
Int J App Pharm, Vol 17, Issue 5, 2025, 471-480Original Article
HPLC-BASED BIOANALYTICAL METHOD DEVELOPMENT AND VALIDATION FOR THE ESTIMATION OF POSACONAZOLE IN SPIKED RAT PLASMA
INDUJA GOVINDAN, ANJANA A. KAILAS, ABUTWAIBE KA, THAMIZHARASAN ANNADURAI, SRINIVAS HEBBAR, ANUP NAHA*
Department of Pharmaceutics, Manipal College of Pharmaceutical Sciences, Manipal Academy of Higher Education, Manipal-576104, India
*Corresponding author: Anup Naha; *Email: anup.naha@manipal.edu
Received: 24 Apr 2025, Revised and Accepted: 03 Jul 2025
ABSTRACT
Objective: Posaconazole (PSC), a highly effective broad-spectrum triazole antifungal, is widely used to treat invasive fungal infections. Accurate and consistent quantification of PSC in biological matrices, such as plasma, is vital for supporting pharmacokinetic and therapeutic drug monitoring studies. To develop and validate a sensitive, robust, and sustainable bioanalytical HPLC method for the quantification of posaconazole in plasma.
Methods: The method utilises a simple protein precipitation technique for sample preparation, avoiding more hazardous or solvent-intensive procedures. Chromatographic separation was achieved using an isocratic elution with a mobile phase composed of acetonitrile and water acidified with 0.5% acetic acid (44:56), delivered at a flow rate of 0.7 ml/min. Unlike most reported methods that use phosphate buffers, this method employs water acidified with 0.5% v/v of acetic acid, enhances environmental compatibility and avoids buffer salt disposal and system fouling issues. Detection was performed at 262 nm using a Shimadzu LC-2010CHT system with a dual-wavelength UV detector and a photodiode array (SPD-M20A, Prominence series).
Results: The method exhibited excellent linearity over the 0.25–32 µg/ml range (r² = 0.9999). Intra and inter-day precision and accuracy complied with ICH M10 bioanalytical validation guidelines, with %RSD values below 2% and recoveries ranging from 97.7±0.07 to 101.12±0.03%. Stability under all relevant conditions was confirmed. Environmental sustainability was evaluated using AGREE and GAPI tools, an approach not previously applied to posaconazole bioanalysis, highlighting its novelty and sustainable design for routine use.
Conclusion: A validated bioanalytical HPLC method for posaconazole quantification in plasma was successfully developed, is suitable for routine pharmacokinetic and therapeutic drug monitoring applications.
Keywords: Posaconazole, Bioanalytical method, HPLC, Green chemistry, Stability
© 2025 The Authors. Published by Innovare Academic Sciences Pvt Ltd. This is an open access article under the CC BY license (https://creativecommons.org/licenses/by/4.0/)
DOI: https://dx.doi.org/10.22159/ijap.2025v17i5.54731 Journal homepage: https://innovareacademics.in/journals/index.php/ijap
INTRODUCTION
Over the past few years, invasive fungal infections (IFIs) have significantly increased, making them a major clinical concern for patients with compromised immune systems. High-risk groups, such as those with chronic immunosuppression, severe neutropenia, advanced HIV, and transplant recipients, have risen alongside this trend [1, 2]. The burden of IFIs has further escalated in the post-COVID-19 era, with notable increases in secondary infections like COVID-associated mucormycosis [3]. Despite the availability of four major antifungal drug classes, such as azoles, polyenes, echinocandins, and flucytosine, clinical outcomes are often suboptimal due to limited efficacy, resistance, and pharmacokinetic variability [4].
Posaconazole (PSC) (fig. 1) is a triazole-based N-arylpiperazine derivative [5], and a second-generation triazole antifungal, has been approved for the prophylaxis and treatment of IFIs that are unresponsive to standard therapies. However, its low and variable bioavailability necessitates precise therapeutic drug monitoring (TDM), especially in paediatric and preclinical settings, where sample volumes are inherently limited [6, 7].
Developing accurate and reliable bioanalytical techniques is a key component of modern pharmaceutical research. The quantitative identification of drug substances, metabolites, and biomarkers in complex biological matrices, such as plasma, serum, and tissue homogenates, has been made feasible by these methods. PSC in plasma can be measured using a variety of analytical techniques, such as high-performance liquid chromatography (HPLC) using ultraviolet (UV) [8] or fluorescence detection [9], as well as liquid chromatography coupled with tandem mass spectrometry (LC–MS/MS).
Several factors can influence retention time (RT) and peak resolution in chromatographic analyses. In the present study, a rapid HPLC–UV method was established utilizing a minimal volume of plasma and the influence of five critical parameters, such as organic phase percentage, aqueous phase percentage, injection volume, column temperature, and flow rate was systematically evaluated for their effect on the RT of PSC and the internal standard (IS). Pre-processing biological matrices to remove endogenous proteins and interfering contaminants is a crucial step in the HPLC bioanalytical method. The most often used sample preparation methods for the development of bioanalytical methods are protein precipitation (PPT), liquid-liquid extraction (LLE), and solid-phase extraction (SPE). PPT was selected as the sample preparation method for this investigation.
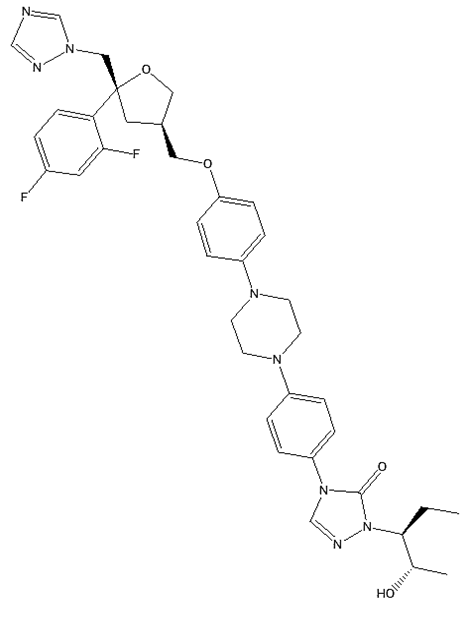
Fig. 1: Chemical structure of posaconazole
Our comparative analysis considered practical considerations like cost, time, and scalability, in addition to analytical performance. LLE and SPE required more labour-intensive procedures and cost more per sample, but they demonstrated better selectivity and lower ion suppression. Conversely, PPT provided a rapid, easy, and automated workflow that greatly decreased sample processing time and resource consumption, two essential elements for high-throughput pharmacokinetic investigations [10].
The primary objective was to establish a sensitive and environmentally friendly HPLC–UV analytical method with a lower Limit of quantification (LOQ), enabling precise measurement of trace levels of PSC in minimal plasma volumes. This is especially critical due to the inherently low bioavailability of PSC. Moreover, the ability to work with small-volume plasma samples is essential in preclinical pharmacokinetic investigations, particularly when dealing with small animal models.
MATERIALS AND METHODS
PSC was provided as a complimentary sample by Lupin Healthcare Limited. High-performance liquid chromatography (HPLC) grade solvents and reagents, including acetonitrile, Methanol and acetic acid, were sourced from Merck Ltd., Mumbai, India. Ethylenediaminetetraacetic Acid (EDTA) was obtained from Sigma-Aldrich. Additionally, nylon membrane filters with a pore size of 0.45 μm were obtained from HiMedia Laboratories Pvt. Ltd., Mumbai, India.
Chromatographic separation was performed on a Shimadzu LC-2010CHT HPLC system equipped with a UV detector and photodiode array (PDA) module (SPD-M20A). Data were acquired and processed using LC Solution software (v5.57). A Phenomenex Kinetex EVO C18 analytical column (250 × 4.6 mm, 5 µm) served as the stationary phase. The mobile phase was filtered through a 0.45 µm nylon membrane using a Millipore vacuum filtration system and degassed via ultrasonication for 10 min. pH adjustments were performed with a digital pH meter (Systronics, India). All aqueous solutions were prepared using Milli-Q purified water (Direct-Q 3 UV, Merck, USA). Samples were centrifuged using a cooling Centrifuge (Z 32 HK, Hermle, Germany).
Animals
The study employed healthy male Sprague Dawley rats, approved for bioanalytical and pharmacokinetic investigations under protocol number IAEC/KMC/98/2022. The animals were maintained under controlled laboratory conditions, temperature of 25 °C, relative humidity of 60%, and a 48-hour alternating light and dark cycle. They were given free access to a standard pellet diet and water throughout the acclimatisation period. To ensure uniformity in pharmacokinetic assessment, the rats were fasted overnight before dosing.
Instrumentation
Chromatographic evaluation was performed using a Shimadzu LC-2010CHT high-performance liquid chromatography system, outfitted with both a dual-wavelength ultraviolet detector and a photodiode array (PDA) detector (SPD-M20A Prominence model). Data processing and chromatogram analysis were facilitated through LC Solution software (version 5.57). The separation of PSC and the internal standard was accomplished on a Phenomenex Kinetex EVO C18 column (250 mm × 4.6 mm), operated at a constant oven temperature of 25 °C. A 60 μL aliquot of the sample was introduced into the system, and the analysis was performed at a flow rate of 0.7 ml/min. UV detection was set at 262 nm, with a total run time of 20 min, ensuring effective resolution of both analytes.
Systematic investigation of chromatographic conditions
A critical analysis of previously published HPLC-based methods for quantifying posaconazole in biological matrices reveals several limitations that impact their suitability for routine pharmacokinetic or therapeutic monitoring applications. The extensive plasma or blood volume requirements are a primary concern. Certain reported methodologies require volumes as high as 1000–3000 µl**, which is impractical for studies involving small animals or limited sample availability [11]. Accurately measuring PSC in small-volume plasma samples is crucial for both therapeutic and scientific purposes, especially in preclinical research involving small animals and susceptible groups like young patients. The volume of blood in the paediatric population is inherently limited, and frequent or large-volume sampling may present physiological and ethical concerns [6]. Thus, analytical techniques requiring a minimal plasma volume are essential for TDM, particularly when PSC is used to treat or prevent IFI in children with weak immune systems [7]. Similarly, due to sample volume limitations, high-sensitivity, low-volume bioanalytical methods are crucial in small-animal pharmacokinetic studies, which are integral to formulation development, dose optimisation, and translational research [12]. In addition to minimising biological burden and supporting ethical study designs, the proposed method expands the feasibility of pharmacokinetic and bioavailability investigations in both clinical and preclinical contexts by permitting reliable drug measurement from as little as 90 µl** of plasma.
Solid-phase extraction methods, although offering better purification, often involve complex procedures and long run times (up to 36 min), reducing throughput [13]. Additionally, several methods employed large volumes of organic extraction solvents, such as diethyl ether or dichloromethane-hexane mixtures, which pose environmental and safety concerns and are incompatible with high-throughput workflows [14]. Moreover, the gradient elution protocols in some cases further contribute to extended analysis times and method complexity [15]. These limitations underscore the need for a sensitive and resource-efficient bioanalytical method suitable for routine quantification of PSC in small-volume plasma samples.
Optimised chromatographic conditions
Chromatographic separation was carried out using a Phenomenex Kinetex EVO C18 column (250 mm × 4.6 mm). During chromatographic method development, the mobile phase composition of MeCN and water acidified with 0.5% v/v acetic acid was selected based on its previously demonstrated compatibility with PSC in our analytical method. However, different mobile phase ratios (55:45, 50:50, 45:55, and 44:56 %) were experimentally examined during bioanalytical method development to improve this composition for plasma matrices. Different flow rates, such as 0.7, 0.8, and 1.0 ml/min, were evaluated for their effect on peak resolution, retention time, and signal intensity. The selected mobile phase, comprising MeCN and water acidified with 0.5% v/v acetic acid, was filtered through a 0.45 µm membrane filter and thoroughly degassed before use. pH was maintained at 3.03, with the final mobile phase composition set at a 44:56 ratio. A flow rate of 0.7 ml/min was found to be optimal and was selected for the final method. Optimised HPLC conditions ensured efficient resolution and consistent peak performance throughout the analysis. The standard and sample solutions were diluted using the mobile phase.
Sample preparation
Stock solution preparation
Primary stock solutions of PSC and IS were independently prepared by dissolving 5 mg of each compound in 5 ml of the mobile phase, yielding a final concentration of 1000 µg/ml. From these stock solutions, working standard solutions at appropriate concentrations were obtained through serial dilutions with the mobile phase. These working solutions were subsequently employed to prepare calibration standards and quality control (QC) samples in spiked rat plasma, facilitating the construction of the calibration curve and validation of the method.
Screening of internal standard
Several prospective internal standards (IS) were assessed to develop a reliable HPLC method for the bioanalytical quantification of PSC, including structurally similar azole antifungals, ketoconazole (KET) and luliconazole (LULI), as well as ibrutinib (IBR), a structurally dissimilar compound. The ideal IS that developing bioanalytical HPLC methods should closely resemble the behaviour of the analyte throughout sample preparation, chromatographic separation, and detection. Despite having a different structure from PSC, IBR was considered for the screening of IS due to its favourable UV absorbance, lipophilicity, chemical stability, and chromatographic compatibility [16].
KET, a broad-spectrum antifungal agent structurally classified as a substituted imidazole, demonstrates therapeutic activity against various fungal infections when administered topically or systemically. KET and PSC exhibit structural resemblance through the presence of azole rings (imidazole and triazole, respectively), halogen-substituted aromatic systems, and cyclic ether groups. These conserved elements support their shared mechanism of action as inhibitors of fungal lanosterol 14α-demethylase [17, 18]. LULI is an imidazole derivative characterised by a 2-substituted imidazole ring, a chlorinated phenyl group, and a dioxolane moiety attached via a thioether linkage [19]. IBR is an acrylamide derivative, specifically a (3R)-3-[4-amino-3-(4-phenoxyphenyl) pyrazolo[3,4-d]pyrimidin-1-yl] piperidine, in which the nitrogen atom of the piperidine ring is substituted with an acryloyl group. It functions as a selective, covalent inhibitor of Bruton's tyrosine kinase (BTK) and is clinically employed in the treatment of B-cell malignancies [20].
Each candidate IS was prepared by dissolving 5 mg of the respective compound in 5 ml of mobile phase to yield a 1000 µg/ml stock solution. Working solutions were then prepared by appropriate dilution in the mobile phase. For the screening procedure, each IS was spiked individually into blank rat plasma along with a fixed concentration of PSC. Sample preparation was conducted using the protein precipitation method with chilled MeOH and MeCN, followed by centrifugation and direct injection of the supernatant into the HPLC system. Chromatographic analysis was performed under the same optimised conditions used for PSC, and each candidate IS was assessed based on retention time compatibility and separation from PSC and endogenous plasma components, peak shape, symmetry, resolution, reproducibility, peak stability across replicates and no interference at the retention time of PSC.
Evaluation of recovery of drug and internal standard
The recovery efficiency of PSC and the IS during protein precipitation was evaluated through preliminary studies using various commonly employed extraction solvents, including chilled MeCN, MeOH, and a chilled mixture of MeOH and MeCN 1:1 (v/v). Each experiment involved adding 10 μl of PSC (100 μg/ml), 10 μl of IS (100 μg/ml), and 300 μl of the selected extraction solvent to 90 μl aliquots of spiked plasma [21]. The samples were then vortexed for 30 seconds and centrifuged at 15,000 rpm for 15 min at 4 °C. Following centrifugation, the supernatant was collected and injected into the HPLC system for analysis. The extraction solvent selected for further investigation was determined by producing a clear plasma matrix and achieving the maximum recovery of both PSC and IS.
HPLC method validation
Validation of analytical processes ensures the method yields dependable results and accurate, specific, reproducible, and robust results across the anticipated range of analysis. Validation gives an official guarantee regarding the reliability of the method, and in many cases is described as empirical evidence generation, ensuring the analytical procedure meets its aim [22]. In pharmaceutical HPLC method validation, regulatory guidelines set by the FDA, United States Pharmacopoeia (USP), and the International Council for Harmonisation (ICH) offer a thorough and uniform basis to ascertain the scientific merit, reliability, and reproducibility of analytical methods [23, 24]. In accordance with the International Council for Harmonisation (ICH) M10, ICH Q2(R1) guidelines, the performance of the optimised analytical procedure was critically assessed in the current research through a series of validation experiments.
Specificity
Achieving sufficient separation in the development of chromatographic methods requires establishing specificity, or the HPLC method's ability to accurately quantify the analyte response in the presence of every possible sample constituent. This is assessed by contrasting the analyte's response in complex test mixtures, which may contain blanks, synthetic intermediates, excipients, degradation products, and impurities related to the process, with the analyte's response in a solution that contains the analyte alone [24]. Three different samples were analysed on the HPLC system to assess the specificity of the optimised bioanalytical method: a blank plasma sample, a PSC-spiked plasma sample, and a plasma sample prepared from a commercial PSC formulation (MKT). The resultant chromatograms were critically examined to evaluate any possible interference from endogenous plasma components or formulation excipients at the retention time corresponding to PSC.
Linearity
Linearity refers to the capability of the method to generate analytical responses that are directly proportional to the concentration of the analyte within a given sample. Defining the linear dynamic range is a critical requirement, irrespective of the stage of drug development [25]. According to ICH guidelines, linearity of the HPLC method should be confirmed by triplicate injections of at least five concentration levels spanning from 70% to 130% of the nominal concentration [23]. Stock solutions of PSC and the IS, each at a concentration of 1000 μg/ml, were prepared. Fresh working solutions of PSC and IS, at 10 and 100 μg/ml, respectively, were subsequently prepared from the stock solutions. Calibration samples were prepared by spiking blank plasma with defined volumes of PSC to yield final concentrations ranging from 0.25 to 32 μg/ml. The clinically relevant plasma concentrations of posaconazole>0.7 mg/l for prophylaxis and>1.0–1.25 mg/l for treatment of IFI are fully encompassed and exceeded by the validated linear range of 0.25–32 µg/ml [26]. The calibration curve was established by plotting PSC concentrations against the corresponding peak area. The coefficient of regression (R²) value (0.99) obtained from linear regression analysis indicated the extent to which the data conformed to the linear model [27].
Accuracy and precision
Accuracy, a critical parameter in analytical method validation, describes the extent to which the measured values correspond with an established reference or true value [28]. The performance of the developed HPLC method in terms of accuracy was determined by analysing six replicates at three concentration levels of PSC spiked plasma (2 µg/ml, 4 µg/ml, and 8 µg/ml) within the validated linearity range. Intra-day accuracy was assessed by performing six replicate injections of each concentration at two separate time points within a single day (10:00 AM and 20:00 PM). Inter-day accuracy was evaluated through duplicate injections of each concentration over two successive days. Method accuracy was quantified by calculating the mean percentage recovery at each concentration level [29].
Precision refers to the degree of reproducibility demonstrated by an analytical method, indicating its capability to consistently yield closely aligned results when measurements are conducted under the same experimental conditions [30]. Precision of the developed method was assessed by analysing three distinct quality control (QC) levels: the low QC (LQC), defined as three times the LOQ; the high QC (HQC), representing 70% of the upper limit of the linear range; and the mid QC (MQC), determined as the average of the LQC and HQC concentrations. Intra-day precision was evaluated by performing six replicate injections of each quality control (QC) level of PSC spiked plasma at two distinct time points within the same day (9.00: 21.00). Two injections of quality control concentrations were analysed across two consecutive days to determine inter-day precision. The corresponding peak areas were recorded for each concentration, and the percentage RSD was calculated [28].
Sensitivity
The sensitivity of an analytical method is defined by two key parameters: the Limit of Detection (LOD) and the Limit of Quantification (LOQ). The lowest concentration of an analyte that can be detected with statistical confidence, but not necessarily quantified, is known as the limit of detection (LOD). The lowest analyte concentration that can be quantitatively measured with respectable levels of precision and accuracy is known as LOQ. These limits are calculated using the given formulas (Equation 1 and Equation 2) [31].
LOD =  …. Equation 1
LOQ = …. Equation 2
Where σ = residual standard deviation of the regression line, S = slope of the regression line
System suitability
System suitability testing is a fundamental prerequisite to confirm that the analytical system is functioning reliably and is appropriate for its intended purpose. In this study, the suitability of the optimised method was verified by analysing peak areas and retention times from six consecutive injections of a PSC-spiked plasma sample. The percent relative standard deviation (%RSD) of these values served as a key indicator of the precision of the method and robustness [32].
Robustness
Robustness characterises the ability of an analytical method to deliver consistent results despite intentional, controlled changes to key method parameters within specified thresholds. This evaluation investigated the impact of slight variations in the proportion of organic phase, aqueous phase, flow rate, Injection volume and column temperature on the retention times and peak area of PSC and the IS [31].
Stability studies
Stability of PSC in plasma was assessed at three QC concentrations under various conditions. Short-term stability was evaluated after 24 h at room temperature using three replicates. Long-term stability was examined by analysing PSC-spiked plasma samples stored at −20 °C for at least six weeks. Additionally, freeze–thaw stability was determined over three cycles at −20 °C using spiked plasma samples. Drug stability was confirmed if results remained within the acceptable precision threshold (≤15% RSD) [33].
Sustainability appraisal of the analytical method
The study aligns with current trends in green analytical chemistry, which emphasises environmentally benign practices by minimising hazardous solvents and chemical waste. Introduced by Anastas and Warner in the 1990s, the twelve principles of green chemistry serve as a foundation for sustainable analytical development. Green analytical chemistry, or GAC, is essential for reducing or eliminating dangerous organic solvents in liquid chromatography while maintaining chromatographic performance for pharmaceutical quality assurance. Additionally, eco-friendly mobile phases are in line with the U. S. Environmental Protection Agency's guidelines, which are designed to lessen the environmental impact of analytical waste [34]. The Analytical GREEnness (AGREE) metric, which is based on the twelve guiding principles of green chemistry, provides a thorough, flexible, and open framework for evaluating the environmental sustainability of analytical processes [35]. Complementing this, the Green Analytical Procedure Index (GAPI) provides an evaluative approach to determine the ecological impact of analytical methods. GAPI employs a visual, colour-coded scheme to categorise the environmental friendliness of individual steps within a method, using a tiered assessment system, typically involving two or three levels, for each procedural component [36].
Given the dynamic evolution of analytical technologies, this work employed the AGREE and GAPI tools to assess the greenness of the developed method following these principles [37, 45].
RESULTS AND DISCUSSION
Sample preparation and optimised chromatographic conditions
Protein precipitation using chilled MeOH and MeCN was explored as a sample preparation strategy for the quantification of PSC in plasma. MeOH was selected over MeCN for protein precipitation following a direct comparison. While plasma proteins were successfully precipitated by both solvents, methanol produced a cleaner supernatant, had sharper peaks, higher analyte recovery, and fewer interference peaks. MeOH was chosen as the preferred precipitation solvent because of its better compatibility and cleaner extraction profile in this procedure fig. 2 depicts a chromatogram of blank plasma spiked with PSC and the IS.
Different mobile phase ratios (55:45, 50:50, 45:55, and 44:56 v/v) with flow rates of 0.7,0.8,1 ml/minute were experimentally assessed to optimise this composition for plasma matrices. For example, the 50:50 and 45:55 ratios led to peak tailing and asymmetry, which compromised quantification accuracy, while the 55:45 ratio produced early elution and poor resolution between posaconazole and endogenous plasma components. The use of a mobile phase consisting of MeCN and water acidified with 0.5% v/v of acetic acid (44:56) on a Phenomenex Kinetex EVO C18 analytical column (250 × 4.6 mm, 5 µm) at a flow rate of 0.7 ml/min enabled distinct separation of PSC and IS peaks from endogenous interferences present in the plasma matrix [39]. PSC demonstrated a RT of 13.095 min under these conditions, while IBR eluted at 9.010 min, ensuring adequate separation between the internal standard peaks and the analyte. System suitability characteristics were used to evaluate the chromatographic quality. Both drugs showed good peak symmetry, with minor peak distortion indicated by tailing factors of 1.105 for IBR and 1.077 for PSC.
Despite the availability of several HPLC methods for quantifying posaconazole in plasma, many are limited by lengthy run times (36 min), large plasma volume requirements (300–1000 µl**), complex extraction procedures, and high organic solvent consumption. Approximately 27% less organic solvent is used in the proposed method than in reported method, which employs 60% CAN [40]. A reduced flow rate (0.7 ml/min compared to 1.0 ml/min in the reported methods [41, 42], which results in a reduction of about 30% in the total solvent volume. For instance, previously reported methods often involve complex solid-phase [42] or liquid-liquid extraction [43], employ high buffer concentrations or extreme pH conditions, and suffer from poor sensitivity or excessive sample handling. In contrast, the current study presents a robust, streamlined HPLC approach using a smaller volume (90 µl**) of plasma. The process does not require complex extraction and has a moderate run time of 20 min; it is significantly shorter than other published protocols requiring up to 36 min for analysis [42]. The proposed method involves protein precipitation for sample preparation, avoiding the complexity and higher solvent usage associated with liquid-liquid extraction or solid-phase extraction. The mobile phase consists of acetonitrile and water acidified with 0.5% acetic acid (44:56, v/v), minimising the use of highly concentrated organic modifiers or buffers at extreme pH (e. g., 10 M ammonium bicarbonate).
Screening of internal standard
The selection of an appropriate IS is a critical step in bioanalytical method development. An ideal IS should exhibit similar extraction efficiency, chromatographic behaviour, and UV absorbance compatibility, thereby compensating for potential variability during sample preparation, matrix effects, and instrument fluctuations [44]. In this study, three compounds KET, LULI, and IBR, were evaluated as potential internal standards for the quantitative analysis of PSC in plasma using HPLC. The selection was based on their retention behaviour, peak shape, signal stability, and absence of interference with the analyte peak. Despite initial expectations, ibrutinib was ultimately selected as the IS based on superior analytical performance.
KET, a triazole antifungal agent structurally like posaconazole, eluted at approximately 3 min under the optimised chromatographic conditions. Although its structural similarity was favourable, its early elution resulted in poor overlap with the matrix environment of the analyte and exposed it to potential early-eluting interferences, which could compromise quantitation. LULI, another imidazole-based antifungal, showed close elution to PSC (Rt: 12.642 min), and its retention profile overlapped significantly with that of the analyte. However, the minimal retention time difference led to peak integration challenges and potential ion suppression due to co-elution, especially in plasma matrices rich in phospholipids. In contrast, IBR, a Bruton’s tyrosine kinase inhibitor with no structural similarity to posaconazole, demonstrated an Rt of 9.010 min, which was closely aligned with that of PSC (Rt: 13.095) fig. 2. Despite being structurally unrelated, IBR exhibited a sharp, symmetrical peak shape, high signal intensity, and excellent reproducibility. Most importantly, it showed no interference with either the analyte or endogenous plasma components. IBR was used as IS and further supported by its consistent recovery during protein precipitation, minimal matrix effects, and stable ionisation response across multiple plasma lots. while structural similarity is often preferred, chromatographic and analytical performance criteria can outweigh structural considerations if validation data supports the effectiveness of IBR. Its proximity in Rt to PSC enabled it to undergo similar matrix-induced ionisation effects, thereby correcting for variability effectively [45, 46].
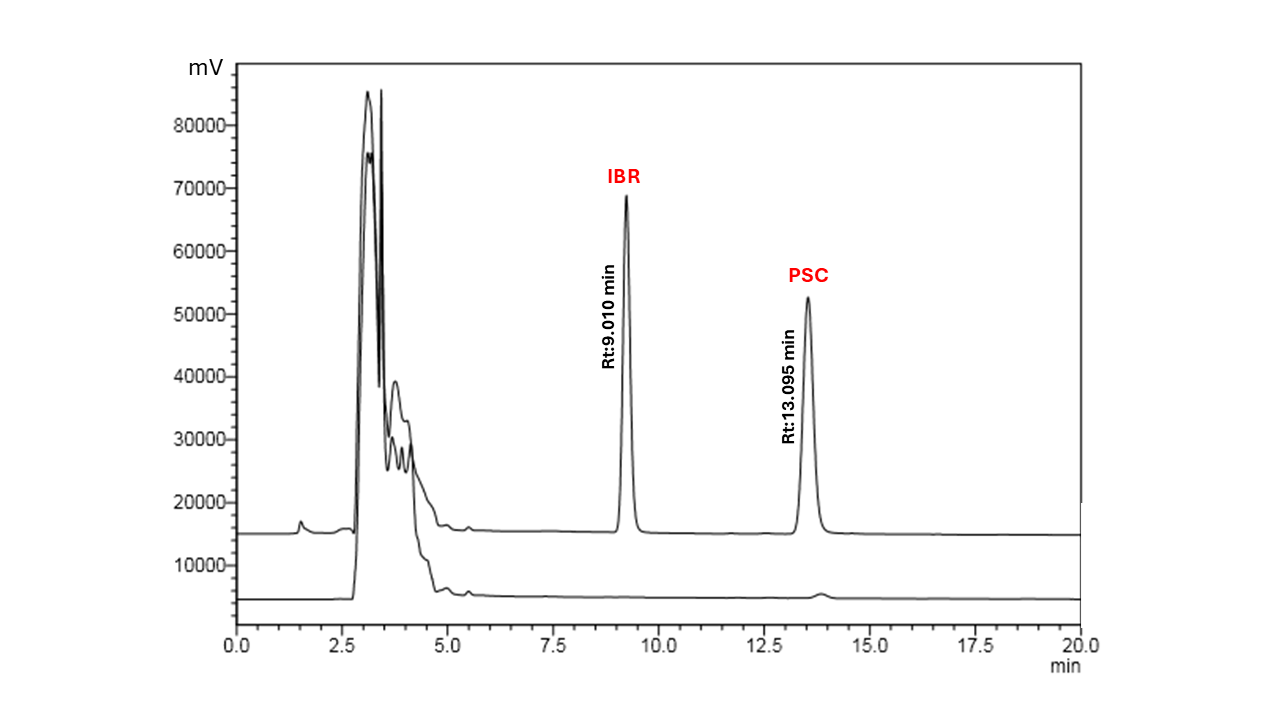
Note: Posaconazole (PSC), Retention time (Rt), Ibrutinib (IBR)
Fig. 2: Chromatogram of posaconazole and ibrutinib
Validation of the optimised method
Specificity
Specificity of the optimised bioanalytical method was evaluated by analysing three distinct samples on the HPLC system: a blank plasma sample, a plasma sample spiked with PSC, and a plasma sample prepared from a commercial PSC formulation. Fig. 3 presents the chromatographic results, highlighting the high specificity of the optimised HPLC bioanalytical method for detecting PSC. No interfering peaks were observed at the Rt of 13.057 min for the plasma spiked with PSC standard and 13.102 min for the plasma spiked with the marketed formulation (MKT). These findings confirmed the robustness of the method in accurately quantifying PSC, even in the presence of formulation excipients.
Chromatogram of Blank, Posaconazole (PSC) and Marketed Posaconazole formulation (MKT)
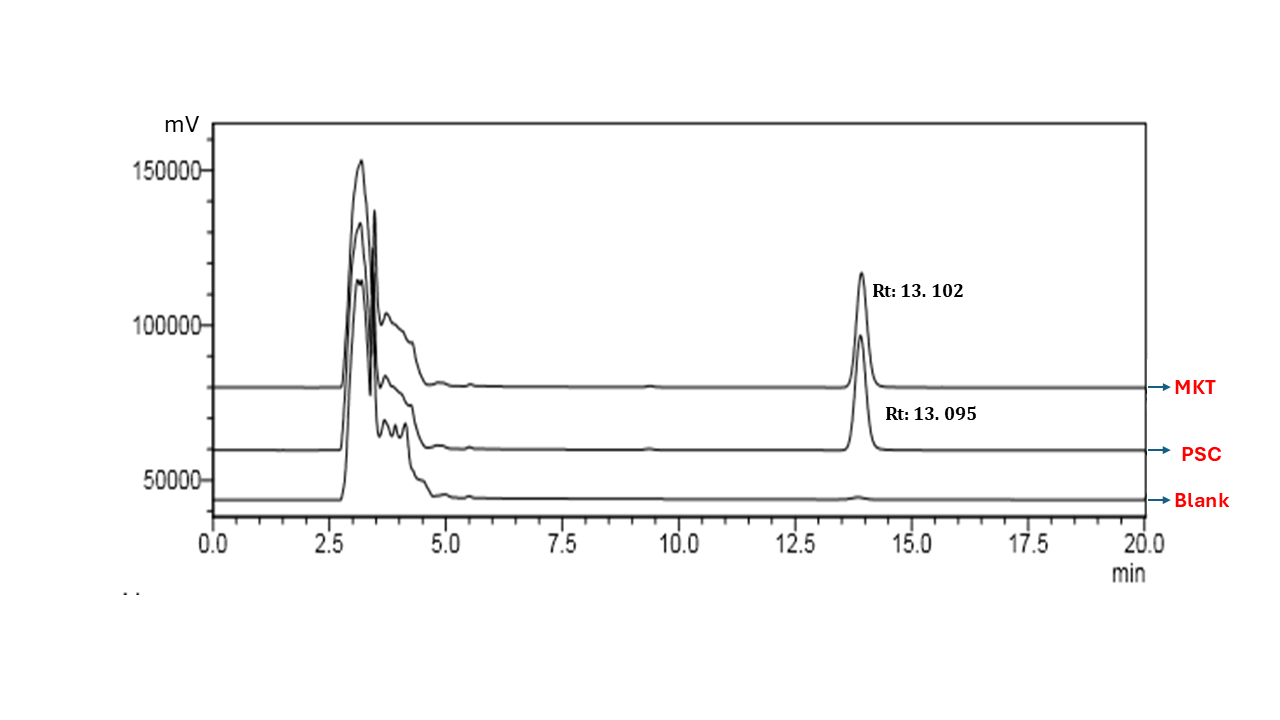
Note: Posaconazole (PSC), Retention time (Rt), Marketed posaconazole formulation (MKT)
Fig. 3: Chromatogram of blank, posaconazole and marketed posaconazole formulation
Linearity
A five-point calibration curve for PSC was constructed over the concentration range of 0.25 to 32 µg/ml, as shown in fig. 4. The resulting standard curve underwent least squares linear regression, yielding the equation y = 37176x+246.24 with an excellent correlation coefficient (r² = 0.9999). These results confirm a robust linear association between the analyte concentration and detector response, thereby establishing the suitability of the method in terms of linearity, accuracy, and precision.
Accuracy and precision
The accuracy of the developed method for PSC quantification was validated through comprehensive intraday and interday studies. For intraday accuracy, six replicates were analysed at 2, 4, and 8 µg/ml, yielding mean recoveries of 98.06±0.05 %, 97.93±0.03 %, and 101.12±0.03 %, respectively. Interday accuracy was assessed using two replicates per concentration, resulting in recoveries of 97.7±0.07%, 98.11±0.06%, and 100.14±0.12%. All values conformed to the acceptance criteria (85–115%), confirming the method's accuracy and reliability for routine analysis. The results are visually summarised in table 1.
The analytical method demonstrated high precision, as evidenced by RSD values under 2% across all quality control concentrations. This low variability between repeated measurements indicates consistent performance and strong reproducibility. These precision metrics support the method’s validity and its suitability for reliably quantifying PSC. Table 1 illustrates the precision of the final optimised method.
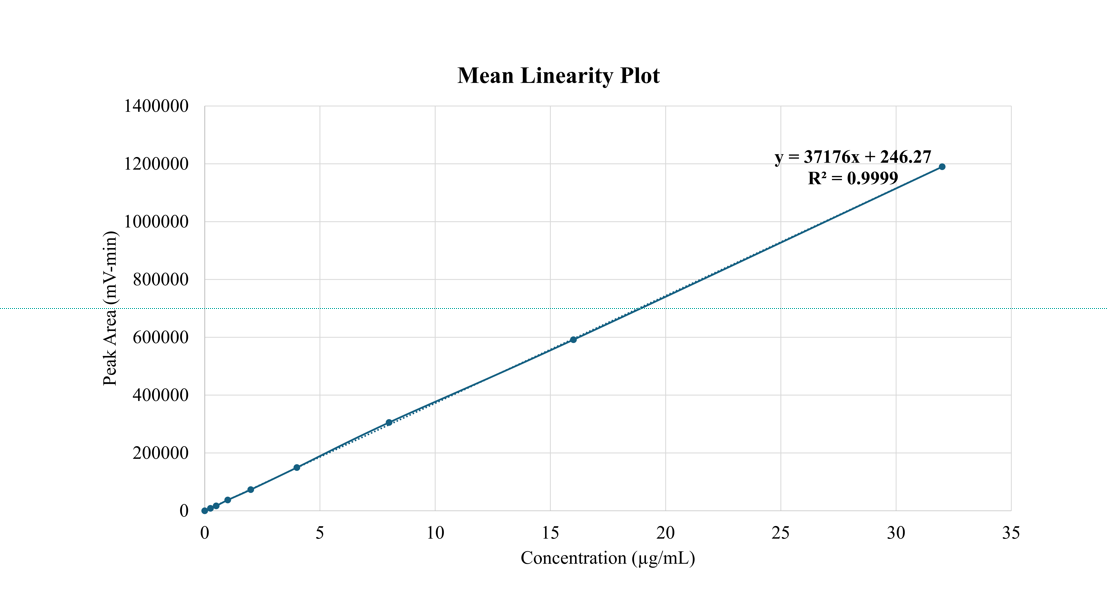
Note: R2: Regression coefficient
Fig. 4: Mean linearity plot of the developed method
Sensitivity
The LOD and LOQ for the finalised HPLC method were computed using the residual standard deviation of the response (σ = 3349.28) and the slope (S=37176) of the calibration curve. The resulting LOD and LOQ values, 0.297 µg/ml and 0.900µg/ml, respectively, reflect the method's high analytical sensitivity, supporting its capability to detect and quantify posaconazole at low concentration levels. The lower LOQ of 0.900 µg/ml for posaconazole is clinically significant, as it effectively covers the therapeutic plasma concentration range required for effective antifungal prophylaxis and treatment (>0.7 mg/ml for prophylaxis and>1.0–1.25 mg/ml for treatment of IFI) [47]. The method is suitably sensitive for quantifying posaconazole within its clinically effective plasma concentration range, ensuring its applicability for prophylactic and therapeutic monitoring in bioanalytical and pharmacokinetic studies.
System suitability
A blank plasma spiked with PSC was subjected to six consecutive injections under uniform chromatographic conditions. The peak area and retention time were meticulously recorded for each injection and subsequently evaluated. The low %RSD of less than 2% reflects negligible variability between successive injections, thereby affirming its suitability for the accurate and reproducible quantification of PSC in biological samples. Table 1 illustrates the system suitability data of the optimised method.
Robustness
A bioanalytical method is considered robust when minor deliberate variations in analytical parameters do not significantly impact the reliability of the results. In this study, robustness was assessed by introducing slight changes to the flow rate, column temperature, and mobile phase composition for PSC analysis. The resulting data demonstrated consistent performance, with all % RSD values remaining below 2%, indicating minimal variability [48]. These findings, presented in table 1, confirm that the method maintains accuracy and precision under modified conditions, thereby establishing its robustness.
Stability studies
All stock solutions were prepared in methanol and stored at −20 °C. Stability assessments revealed that these solutions remained stable for up to two weeks. The %RSD values at three concentration levels, summarised in table 2, further confirmed the stability of the prepared solutions. The stability of PSC in plasma was evaluated under various storage conditions. Short-term stability was assessed by maintaining spiked plasma samples at room temperature (25 °C) for 480 min, during which no significant degradation was observed. For long-term stability, PSC-spiked plasma samples were stored at−20 °C and analysed after 6 w, confirming their stability under frozen conditions [49]. The recovery at the highest tested concentration (22.4 µg/ml) was 93.76%, suggesting a 6% decrease in recovery. This minor drop in recovery may be attributed to sample handling variations, such as adsorption to container surfaces, rather than true degradation. Additionally, the effect of repeated freeze–thaw cycles was examined by subjecting the samples to three cycles, with each cycle involving triplicate 1 ml aliquots. The mean values obtained, summarised in table 3, indicated that samples exposed to three freeze-thaw cycles at concentrations of 3, 12.7, and 22.4 µg/ml demonstrated good stability, with recovery percentages varying between approximately 93% and 98% throughout the cycles. The slight drops in recovery (for example, from 98% to 95% at 3 µg/ml) suggest that the analyte has not degraded or lost much because of freeze-thaw stress.
Sustainability appraisal of the analytical method
The AGREE tool employs a clock-like schematic where the overall environmental score is centrally displayed. A score approaching 1, rendered in dark green, signifies superior environmental compliance. Each segment of the clock represents an individual principle of green analytical chemistry, collectively reflecting the significance of sustainable practices within the method. The colour gradient, from green to red, visually conveys the extent of environmental impact, with green denoting minimal ecological burden and red highlighting critical areas of concern [35]. The GAPI tool utilises a matrix of fifteen pentagonal fields, each representing a specific component of the analytical workflow, such as sample collection, the nature of chemicals and solvents employed, sample preparation, instrumentation, and waste management [50]. The developed bioanalytical HPLC method for PSC achieved an AGREE score of 0.67, reflecting a relatively high level of environmental compatibility fig. 5A. The proposed method shows excellent compliance (dark green) with the GAC principles 2, 6, 8, and 12, such as minimal sample size, absence of derivatization, simultaneous determination of multiple analytes (drug and internal standard), and high operator safety. A good compliance (light green) with principles 4, 5, 7, and 11 is demonstrated, such as moderate sample preparation steps, a semi-automated and miniaturised method, reduced volume of analytical waste, and the use of less toxic solvents [35]. Additionally, the GAPI analysis of the same method revealed a favourable profile comprising 7 green, 5 yellow, and only 3 red pentagrams, indicating Green-Eco-friendly and safe practices, Yellow-Moderate environmental or safety concerns, and Red-Significant environmental or safety concerns fig. 5B. The method demonstrates compliance with easy sample preparation, convenient storage and transport, no need for additional treatment, reduced reagent volumes, moderate occupational hazards, minimised waste generation, and proper waste management. These findings underscore the proposed method's overall environmental significance and indicate that the method aligns well with sustainable analytical practices [51].
Table 1: Validation data of the developed HPLC bioanalytical method
| System suitability | ||||||
| S. No. | Parameter | Mean±SD (n=6) | RSD (%) | |||
| 1 | Peak Area (mV-min) | 37533.16±129.260 | 0.340 | |||
| 2 | Rt (min) | 13.05±0.001 | 0.008 | |||
| 3 | NTP | 14591.50±63.220 | 0.430 | |||
| 4 | Tf | 1.27±0.001 | 0.150 | |||
| 5 | Tf 10% | 1.21±0.003 | 0.290 | |||
| Linearity | ||||||
| Linearity range | 0.5-32 µg/ml | |||||
| Coefficient of determination (r2) | 0.999 | |||||
| Slope | 37176 | |||||
| Intercept | 246.27 | |||||
| Sensitivity | ||||||
| LOD | 0.321 µg/l | |||||
| LOQ | 0.972 µg/ml | |||||
| Accuracy | ||||||
| Intra-day accuracy | Inter-day accuracy | |||||
| Concentration (µg/ml) | Mean % recovery±SD | Concentration (µg/ml) | mean % recovery±SD | |||
| 2 | 98.06±0.05 | 2 | 97.7±0.07 | |||
| 4 | 97.93±0.03 | 4 | 98.11±0.06 | |||
| 8 | 101.12±0.03 | 8 | 100.14±0.12 | |||
| Precision | ||||||
| Intra-day precision | Inter-day precision | |||||
| Concentration (µg/ml) | Peak area±SD ((mV-min) | % RSD | Concentration (µg/ml) | Peak area±SD ((mV-min) | % RSD | |
| 3 | 111704.83± 37.8 | 0.030 | 3 | 111465.8±13.3 | 0.010 | |
| 12.7 | 480790± 335.5 | 0.069 | 12.7 | 466382.8±767.9 | 0.210 | |
| 22.4 | 844387.8± 419.2 | 0.049 | 22.4 | 828506.5±86.8 | 0.010 | |
| Robustness | ||||||
| S. No. | Parameter | Level | Rt (min) | Peak area (mV-min) | ||
| Mean±SD | % RSD | Mean±SD | % RSD | |||
| 1 | Wavelength (nm) | 260 | 12.915±0.001 | 0.007 | 37105.0±11.78 | 0.031 |
| 264 | 12.914±0.002 | 0.015 | 36559.67±25.57 | 0.060 | ||
| 2 | Flow Rate (ml/min) | 0.5 | 13.064±0.007 | 0.056 | 38834.67±44.74 | 0.110 |
| 0.9 | 12.977±0.010 | 0.078 | 36894.33±29 | 0.070 | ||
| 3 | Injection Volume (µl) |
58 | 12.922±0.003 | 0.02 | 36575.33±4.72 | 0.012 |
| 62 | 12.923±0.002 | 0.026 | 38040.33±3.21 | 0.008 | ||
| 4 | Temperature (ᵒC) | 25 | 12.919±0.058 | 0.45 | 37075.33±3.05 | 0.008 |
| 29 | 12.971±0.005 | 0.038 | 37026.00±19.15 | 0.051 | ||
| 5 | Mobile Phase Ratio | 57:43 | 13.057±0.001 | 0.011 | 36563.67±28.53 | 0.078 |
| 53:47 | 13.057±0.002 | 0.23 | 37037.33±8.08 | 0.021 | ||
Note: Data are expressed as mean±SD. Sample sizes: System suitability (n = 6); Linearity (n = 3); Intraday accuracy (n = 6); Interday accuracy (n = 2); Intraday precision (n = 6); Interday precision (n = 2); Robustness (n = 6). Abbreviations: SD: Standard Deviation; %RSD: Percentage Relative Standard Deviation
Table 2: Stability data of developed HPLC bioanalytical method
| Freeze-thaw cycle | ||||||
| Concentration (µg/ml) | Cycle 1 | Cycle 2 | Cycle 3 | |||
| % Recovery | % RSD | % Recovery | % RSD | % Recovery | % RSD | |
| 3 | 98±0.011 | 0.007 | 97±0.021 | 0.022 | 95±0.01 | 0.011 |
| 12.7 | 96.06±0.034 | 0.035 | 96±0.020 | 0.021 | 93±0.032 | 0.034 |
| 22.4 | 97.42±0.022 | 0.023 | 96.11±0.021 | 0.021 | 95.67±0.022 | 0.023 |
| Short-term stability (24 h, Room temperature) | ||||||
| Concentration (µg/ml) | % Recovery | % RSD | ||||
| 3 | 99.94±0.033 | 0.033 | ||||
| 12.7 | 99.97±0.024 | 0.024 | ||||
| 22.4 | 99.89±0.021 | 0.021 | ||||
| Long-term Stability (6 w,-20 ᵒC) | ||||||
| Concentration (µg/ml) | % Recovery | % RSD | ||||
| 3 | 94.14±0.011 | 0.012 | ||||
| 12.7 | 96.23±0.02 | 0.021 | ||||
| 22.4 | 93.76±0.02 | 0.021 | ||||
Note: Data are expressed as mean±SD. Sample size: n=6, Abbreviations: SD: Standard Deviation; %RSD – Percentage Relative Standard Deviation
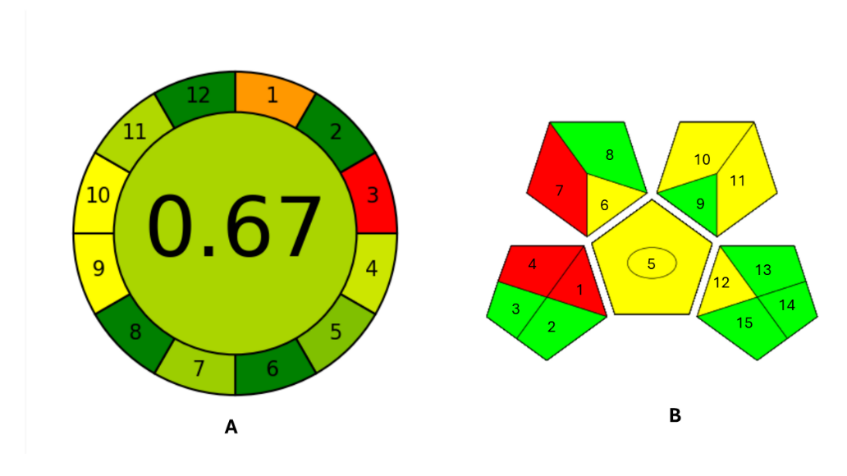
Note: AGREE: Analytical Greenness metric, B) GAPI: Green analytical procedure index
Fig. 5: Greenness analysis of developed method A) AGREE; B) GAPI
CONCLUSION
In the current study, a simplified, economical, and sustainable high-performance chromatographic method was developed for the quantitative measurement of PSC in rat plasma samples. The technique demonstrated good analytical performance, satisfying validation requirements for linearity, precision, and accuracy over a concentration range of 0.25–32 µg/ml. It also featured a low quantification limit, enabling sensitive detection of the analyte. Two key benefits of the developed method are its simplicity and minimal resource requirements. The method minimises time-consuming extraction steps and uses less solvent by employing a protein precipitation process and a smaller volume of plasma. Additionally, AGREE and GAPI tools were used to assess the environmental impact of the method and validate its green profile and conformity to sustainable analytical chemistry principles. These characteristics improve the applicability of the method for pharmacokinetic studies.
ABBREVIATIONS
IFI: Invasive Fungal Infections, PSC: Posaconazole, CAM: COVID-Associated Mucormycosis, FDA: Food and Drug Administration, EMA: European Medicines Agency, HPLC: High Performance Liquid Chromatography, LC–MS/MS: Liquid Chromatography Coupled with Tandem Mass Spectrometry, MeCN: Acetonitrile, MeOH: Methanol, Rt: Retention time, LOD: Limit of Detection, LOQ: Limit of Quantification, UV Spectroscopy: Ultra-Violet Spectroscopy, IS: Internal Standard, PPT: Protein Precipitation, LLE: Liquid-Liquid Extraction, SPE: Solid-Phase Extraction, GAC: Green Analytical Chemistry, AGREE: Analytical GREEnness, GAPI: Green Analytical Procedure Index, EDTA: Ethylenediaminetetraacetic Acid, PDA: Photodiode Array, QC: Quality Control, KET: Ketaconazole, LULI: Luliconazole, IBR: Ibrutinib, BTK: Bruton's Tyrosine Kinase, USP: United States Pharmacopoeia, ICH: International Council for Harmonisation, MKT: Marketed, QL: Quantitation Limit, LQC: Lower Quality Control, MQC: Medium Quality Control, HQC: Higher Quality Control, SD: Standard Deviation, % RSD: Percentage Relative Standard Deviation
ACKNOWLEDGEMENT
The authors are thankful to Manipal College of Pharmaceutical Sciences, Manipal Academy of Higher Education, Manipal, India, for providing funding and for providing facilities for conducting the studies.
FUNDING
This study was supported by the intramural funding of Manipal Academy of Higher Education, Manipal.
AUTHORS CONTRIBUTIONS
Induja Govindan: Writing Original Draft, Investigation, Resources, Visualization; Anjana A Kailas: Data Curation, Investigation, Resources; Abutwaibe K A: Investigation, Resources, Review and Editing, Visualization; Thamizharasan Annadurai: Funding acquisition, Visualization, Srinivas Hebbar: Review and Editing; Anup Naha: Conceptualization, Visualization, Supervision, Project administration and funding acquisition.
CONFLICTS OF INTERESTS
Declared none
REFERENCES
Al Maghrabi RS, Al Musawi T, Albaksami O, Subhi AL, Fakih RE, Stone NR. Challenges in the management of invasive fungal infections in the Middle East: expert opinion to optimize management using a multidisciplinary approach. Cureus. 2023;15(8):e44356. doi: 10.7759/cureus.44356, PMID 37779746.
Langner S, Staber PB, Neumeister P. Posaconazole in the management of refractory invasive fungal infections. Ther Clin Risk Manag. 2008 Aug;4(4):747-58. doi: 10.2147/tcrm.s3329, PMID 19209257.
Kayarat B, Khanna P. Posaconazole in the prevention of COVID-19-associated mucormycosis: a concerning contributor to the rise in antifungal resistance. Indian J Crit Care Med. 2021 Oct;25(10):1209-10. doi: 10.5005/jp-journals-10071-23981, PMID 34916761.
Boutin CA, Luong ML. Update on therapeutic approaches for invasive fungal infections in adults. Ther Adv Infect Dis. 2024 Sep 1;11:20499361231224980. doi: 10.1177/20499361231224980, PMID 38249542.
Pub Chem. Posaconazole. Available from: https://pubchem.ncbi.nlm.nih.gov/compound/468595. [Last accessed on 11 Apr 2025].
Kauffman RE, Kearns GL. Pharmacokinetic studies in paediatric patients: clinical and ethical considerations. Clin Pharmacokinet. 1992 Jul 1;23(1):10-29. doi: 10.2165/00003088-199223010-00002, PMID 1617856.
Ferreras Antolin L, Sharland M, Warris A. Management of invasive fungal disease in neonates and children. Pediatr Infect Dis J. 2019 Jun;38(6S Suppl 1):S2-6. doi: 10.1097/INF.0000000000002317, PMID 31205236.
Chhun S, Rey E, Tran A, Lortholary O, Pons G, Jullien V. Simultaneous quantification of voriconazole and posaconazole in human plasma by high-performance liquid chromatography with ultraviolet detection. J Chromatogr B Analyt Technol Biomed Life Sci. 2007 Jun 1;852(1-2):223-8. doi: 10.1016/j.jchromb.2007.01.021, PMID 17306633.
Tang PH. Determination of posaconazole in plasma/serum by high-performance liquid chromatography with fluorescence detection. Separations. 2017 Jun;4(2):16. doi: 10.3390/separations4020016.
Moein MM, El Beqqali A, Abdel Rehim M. Bioanalytical method development and validation: critical concepts and strategies. J Chromatogr B Analyt Technol Biomed Life Sci. Science Direct. 2017 Feb 1;1043:3-11. doi: 10.1016/j.jchromb.2016.09.028, PMID 27720355.
Li W, Li Y, Cai J, Wang Y, Liu Y, Hu H. Simultaneous quantification of seven antifungal agents in human serum using liquid chromatography tandem mass spectrometry. Pharmaceuticals (Basel). 2023 Oct 30;16(11):1537. doi: 10.3390/ph16111537, PMID 38004403.
Harstad E, Andaya R, Couch J, Ding X, Liang X, Liederer BM. Balancing blood sample volume with 3Rs: implementation and best practices for small molecule toxicokinetic assessments in rats. ILAR J. 2016;57(2):157-65. doi: 10.1093/ilar/ilw023, PMID 28053069.
Storzinger D, Swoboda S, Lichtenstern C, Muller C, Weigand MA, Hoppe Tichy T. Development and validation of a high performance liquid chromatography assay for posaconazole utilizing solid phase extraction. Clin Chem Lab Med. 2008 Dec 1;46(12):1747-51. doi: 10.1515/CCLM.2008.338, PMID 18973464.
Khalil HA, El Yazbi AF, Belal TS, Hamdy DA. High-performance liquid chromatographic assay for the simultaneous determination of posaconazole and vincristine in rat plasma. Int J Anal Chem. 2015 Dec 22;2015:743915. doi: 10.1155/2015/743915, PMID 27034675.
Gordien JB, Pigneux A, Vigouroux S, Tabrizi R, Accoceberry I, Bernadou JM. Simultaneous determination of five systemic azoles in plasma by high-performance liquid chromatography with ultraviolet detection. J Pharm Biomed Anal. 2009 Dec;50(5):932-8. doi: 10.1016/j.jpba.2009.06.030, PMID 19608374.
Bindu GH, Annapurna MM. A sensitive stability indicating RP-HPLC method for the determination of Ibrutinib-an anti-cancer drug. Res J Pharm Technol. 2018;11(10):4587. doi: 10.5958/0974-360X.2018.00839.9.
Kujawski J, Czaja K, Dettlaff K, Zwawiak J, Ratajczak T, Bernard MK. Structural and spectroscopic properties of posaconazole experimental and theoretical studies. J Mol Struct. 2019;1181:179-89. doi: 10.1016/j.molstruc.2018.12.074.
Kujawski J, Czaja K, Jodlowska Siewert E, Dettlaff K, Zwawiak J, Kujawski R. Structural and spectroscopic properties of itraconazole and ketoconazole experimental and theoretical studies. J Mol Struct. 2017 Oct 15;1146:259-66. doi: 10.1016/j.molstruc.2017.05.128.
Khanna D, Bharti S. Luliconazole for the treatment of fungal infections: an evidence based review. Core Evid. 2014 Sep 9;9:113-24. doi: 10.2147/CE.S49629, PMID 25285056.
PubChem. Ibrutinib. Available from: https://pubchem.ncbi.nlm.nih.gov/compound/24821094. [Last accessed on 11 Apr 2025].
Kim JS, Kim Y, Han SH, Jeon JY, Hwang M, Im YJ. Development and validation of an LC-MS/MS method for determination of compound K in human plasma and clinical application. J Ginseng Res. 2013 Mar;37(1):135-41. doi: 10.5142/jgr.2013.37.135, PMID 23717167.
Le TH, Phung TH, Le DC. Development and validation of an HPLC method for simultaneous assay of potassium guaiacolsulfonate and sodium benzoate in pediatric oral powder. J Anal Methods Chem. 2019 Mar 7;2019:6143061. doi: 10.1155/2019/6143061, PMID 30984442.
Borman P, Elder D. Q2(R1) validation of analytical procedures. Text and methodology. In: John Wiley & Sons; ch5. 1st ed Teasdale A, Elder D, Nims RW, editors. ICH quality guidelines; 2017. p. 127–66. Available from: https://onlinelibrary.wiley.com/doi/10.1002/9781118971147. [Last accessed on 19 Apr 2024].
Shabir GA. Validation of high-performance liquid chromatography methods for pharmaceutical analysis understanding the differences and similarities between validation requirements of the-us food and drug administration the-us pharmacopeia and the international conference on harmonization. J Chromatogr A. 2003;987(1-2):57-66. doi: 10.1016/s0021-9673(02)01536-4, PMID 12613797.
Tiwari G, Tiwari R. Bioanalytical method validation: an updated review. Pharm Methods. 2010;1(1):25-38. doi: 10.4103/2229-4708.72226, PMID 23781413.
Dekkers BG, Bakker M, Van Der Elst KC, Sturkenboom MG, Veringa A, Span LF. Therapeutic drug monitoring of posaconazole: an update. Curr Fungal Infect Rep. 2016 Jun 1;10(2):51-61. doi: 10.1007/s12281-016-0255-4, PMID 27358662.
Sonawane SS, Chhajed SS, Attar SS, Kshirsagar SJ. An approach to select linear regression model in bioanalytical method validation. J Anal Sci Technol. 2019 Jan 3;10(1):1. doi: 10.1186/s40543-018-0160-2.
Rama A, Govindan I, Hebbar S, Chaturvedi A, Rani U, Naha A. Advancing posaconazole quantification analysis with a new reverse phase HPLC method in its bulk and marketed dosage form. F1000Res. 2023 Jun 27;12:468. doi: 10.12688/f1000research.132841.2, PMID 37396051.
Shen JX, Krishna G, Hayes RN. A sensitive liquid chromatography and mass spectrometry method for the determination of posaconazole in human plasma. J Pharm Biomed Anal. 2007 Jan 4;43(1):228-36. doi: 10.1016/j.jpba.2006.06.011, PMID 16859858.
Bhujbal S, Rupenthal ID, Agarwal P. Development and validation of a stability-indicating HPLC method for assay of tonabersat in pharmaceutical formulations. Methods Science Direct. 2024 Nov 1;231:178-85. doi: 10.1016/j.ymeth.2024.10.001, PMID 39368764.
Jain D, Basniwal PK. ICH guideline practice: application of validated RP-HPLC-DAD method for determination of tapentadol hydrochloride in dosage form. J Anal Sci Technol. 2013 Jul 18;4(1):9. doi: 10.1186/2093-3371-4-9.
Briscoe CJ, Stiles MR, Hage DS. System suitability in bioanalytical LC/MS/MS. J Pharm Biomed Anal. 2007 Jun 28;44(2):484-91. doi: 10.1016/j.jpba.2007.03.003, PMID 17433601.
Sabale V, Jiwankar M, Sabale P. Bioanalytical method development validation and quantification of flutamide in spiked rat plasma by using high-performance liquid chromatography. Futur J Pharm Sci. 2023 Aug 23;9(1):75. doi: 10.1186/s43094-023-00528-7.
Elsheikh SG, Hassan AM, Fayez YM, El Mosallamy SS. Green analytical chemistry and experimental design: a combined approach for the analysis of zonisamide. BMC Chem. 2023 Apr 17;17(1):38. doi: 10.1186/s13065-023-00942-1, PMID 37069703.
Pena Pereira F, Wojnowski W, Tobiszewski M. AGREE analytical GREEnness metric approach and software. Anal Chem. 2020;92(14):10076-82. doi: 10.1021/acs.analchem.0c01887, PMID 32538619.
Plotka Wasylka J. A new tool for the evaluation of the analytical procedure: green analytical procedure index. Talanta. 2018 May 1;181:204-9. doi: 10.1016/j.talanta.2018.01.013, PMID 29426502.
Santali EY, Naguib IA, Alshehri AM, Alzahrani YA, Alharthi AE, Alosaimi TS. Greenness assessment of chromatographic methods used for analysis of empagliflozin: a comparative study. Separations. 2022 Oct;9(10):275. doi: 10.3390/separations9100275.
Abdel Hameed EA, Abd El Naby ZA, El Gindy A, Zaitone SA, Alshaman R, Saraya RE. Two new HPLC methods assessed by GAPI, for simultaneous determination of four antipsychotics in pharmaceutical formulations: a comparative study. Separations. 2022 Aug;9(8):220. doi: 10.3390/separations9080220.
Ingle RG, Zeng S, Jiang H, Fang WJ. Current developments of bioanalytical sample preparation techniques in pharmaceuticals. J Pharm Anal. 2022 Aug 1;12(4):517-29. doi: 10.1016/j.jpha.2022.03.001, PMID 36105159.
Gharibi S, Kimble B, Vogelnest L, Barnes J, Stadler CK, Govendir M. Pharmacokinetics of posaconazole in koalas (Phascolarctos cinereus) after intravenous and oral administration. J Vet Pharmacol Ther. 2017;40(6):675-81. doi: 10.1111/jvp.12407, PMID 28455999.
Gomez Lopez A, Alcazar Fuoli L, Bernal Martinez L. Simultaneous quantification of systemic azoles and their major metabolites in human serum by HPLC/PDA: role of azole metabolic rate. Diagn Microbiol Infect Dis. 2018;92(1):78-83. doi: 10.1016/j.diagmicrobio.2018.04.003, PMID 29778564.
Campestre C, Locatelli M, Guglielmi P, De Luca E, Bellagamba G, Menta S. Analysis of imidazoles and triazoles in biological samples after microextraction by packed sorbent. J Enzyme Inhib Med Chem. 2017 Jan 1;32(1):1-11. doi: 10.1080/14756366.2017.1354858, PMID 28776447.
Mistretta V, Dubois N, Denooz R, Charlier C. Simultaneous determination of seven azole antifungal drugs in serum by ultra-high pressure liquid chromatography and diode array detection. Acta Clin Belg. 2014 Feb;69(1):53-61. doi: 10.1179/0001551213Z.00000000018, PMID 24635400.
Bergeron A, Furtado M, Garofolo F. Importance of using highly pure internal standards for successful liquid chromatography/tandem mass spectrometric bioanalytical assays. Rapid Commun Mass Spectrom. 2009;23(9):1287-97. doi: 10.1002/rcm.4001, PMID 19308966.
Bayat F, Hashemi Baghi A, Abbasian Z, Dadashzadeh S, Aboofazeli R, Haeri A. Development of an HPLC–UV method for quantification of posaconazole in low-volume plasma samples: design of experiments and machine learning models. BMC Chem. 2024;18(1):238. doi: 10.1186/s13065-024-01349-2, PMID 39633472.
Wright MJ, Wheller R, Wallace G, Green R. Internal standards in regulated bioanalysis: putting in place a decision making process during method development. Bioanalysis. 2019 Sep 1;11(18):1701-13. doi: 10.4155/bio-2019-0169, PMID 31646889.
Wei XC, Zhao MF, Li X, Xiao X. Evaluating posaconazole dosing regimens of the different formulations against Aspergillus spp. in adults: a pharmacokinetic/pharmacodynamic analysis using Monte Carlo simulation. Int J Antimicrob Agents. 2020 Oct 1;56(4):106112. doi: 10.1016/j.ijantimicag.2020.106112, PMID 32721598.
Shah JH, Mehta T, Mukharya A, Chowdhury AR, Patel A, Mevada S. Development of novel single HPLC method for simultaneous separation of multiple impurities in dexamethasone drug product. Int J Pharm Pharm Sci. 2024 Nov 1;16(11):24-31. doi: 10.22159/ijpps.2024v16i11.52010.
Shah SK, Dey S, De S. Simultaneous determination of atorvastatin and atenolol in rabbit plasma by RP-HPLC method and its application in pharmacokinetic study. Int J Curr Pharm Sci. 2022 Mar 15;14(2):72-8. doi: 10.22159/ijcpr.2022v14i2.1968.
Mohamed D, Fouad MM. Application of NEMI, analytical Eco-Scale and GAPI tools for greenness assessment of three developed chromatographic methods for quantification of sulfadiazine and trimethoprim in bovine meat and chicken muscles: comparison to greenness profile of reported HPLC methods. Microchem J. 2020 Sep 1;157. Available from: https://wwwsciencedirect.com/science/article/pii/s0026265x19333454.104873. [Last accessed on 29 Apr 2024].
Marques SM, Salwa KL. Quality by design based development of an eco-friendly HPLC method for the estimation of nisoldipine in nanoformulations: forced degradation studies and in vitro release studies. Sustain Chem Pharm. 2023 Dec 1;36:101254. doi: 10.1016/j.scp.2023.101254.