
Int J App Pharm, Vol 18, Issue 1, 2026, 357-367Original Article
DESIGN OF EXPERT-BASED ECO-FRIENDLY RP-HPLC ANALYTICAL METHOD FOR THE ESTIMATION OF LUMEFANTRINE FROM THE CARBON DOTS
RAKSHA1, ASHUTOSH GUPTA1, MOUMITA SAHA1, SUDHEER MOORKOTH1, ABHAY BHARDWAJ2, ADITYA DEV RAJORA1*
1Department of Pharmaceutical Quality Assurance, Manipal College of Pharmaceutical Sciences, Manipal Academy of Higher Education, Manipal-576104, Karnataka, India. 2Department of Pharmaceutical Chemistry, KIET School of Pharmacy, KIET Group of Institutions, Ghaziabad-201206, Uttar Pradesh, India
*Corresponding author: Aditya Dev Rajora; *Email: aditya.rajora@manipal.edu
Received: 05 May 2025, Revised and Accepted: 10 Nov 2025
ABSTRACT
Objective: The most common and lethal malaria-causing species in humans, Plasmodium falciparum and Plasmodium vivax, are caused by protozoan parasites belonging to the genus Plasmodium. Due to the substantial therapeutic obstacles posed by these parasites, novel therapy strategies are being investigated. By improving the solubility and cellular absorption of antimalarial drugs, including lumefantrine (LUM), carbon dots (CDs), a new nanomaterial, hold promise for the management of malaria. In order to evaluate the stability, drug release profile, and percentage entrapment efficiency (%EE) of LUM-loaded CDs and support their potential for the treatment of malaria, this study set out to design and validate an analytical approach based on HPLC.
Methods: A Design of Experiments (DoE) strategy was employed to optimize the HPLC process, systematically altering the injection volume, flow rate, buffer ratio, and buffer pH to improve performance. The following responses were tracked: theoretical plates (Tp), tailing factor (Tf), drug peak area, and retention time (RT). Following the requirements of ICH Q2(R2), linearity was established for LUM throughout a range of 0.5 to 20 µg/ml.
Results: The result was a linear regression equation with an R2>0.999, demonstrating strong linearity. For both intra-day and inter-day studies, the method's precision with a %CV<2% and accuracy between 98 and 102% ensured repeatability when used for evaluating LUM stability, %EE, and drug release in CDs. The technique exhibited sensitivity for low concentrations and selectivity, separating LUM from excipients and degradation products. Its eco-friendliness was confirmed with an AGREE score of 0.7, indicating less waste and solvent consumption.
Conclusion: The quantification of LUM in CDs, formulation parameter optimization, and the development of sustainable malaria treatment techniques are all made possible by this verified HPLC approach.
Keywords: Malaria, Lumefantrine, HPLC, Design of expert, Carbon dots
© 2026 The Authors. Published by Innovare Academic Sciences Pvt Ltd. This is an open access article under the CC BY license (https://creativecommons.org/licenses/by/4.0/)
DOI: https://dx.doi.org/10.22159/ijap.2026v18i1.54769 Journal homepage: https://innovareacademics.in/journals/index.php/ijap
INTRODUCTION
Globally, malaria is one of the most prevalent infectious diseases, posing a significant public health challenge, especially in tropical and subtropical regions. According to the World Health Organization (WHO), an estimated 241 million malaria cases were reported worldwide in 2020, resulting in over 627000 deaths [1]. The disease is primarily caused by protozoan parasites of the genus Plasmodium, with Plasmodium falciparum and Plasmodium vivax being the most common and virulent species infecting humans. Transmission occurs through the bite of an infected female Anopheles mosquito. Despite progress in malaria control, it remains a leading cause of morbidity and mortality, especially in endemic regions [2]. A major hurdle to the disease's eradication is the intricate biology of malaria parasites, which encompasses stages in both human and mosquito hosts. This highlights the necessity of a variety of preventative and treatment measures. It continues to pose a serious threat to world health, especially in tropical and subtropical areas where it significantly raises morbidity and death rates. Fever, chills, and flu-like symptoms are some of the initial signs of the condition. If treatment is delayed, it can lead to serious consequences, including anaemia, respiratory distress, and even death, especially in susceptible groups like pregnant women and children [2, 3]. The use of generic antimalarial drugs like quinine and chloroquine has given way to a more focused strategy with artemisinin-based combination therapies (ACTs), which are now the mainstay of malaria therapy [4, 5].
An FDA-approved antimalarial medication called lumefantrine (LUM) is frequently employed in conjunction with artemether to treat simple Plasmodium falciparum malaria. It inhibits the malaria parasite's detoxifying process by stopping the polymerization of heme into hemozoin. When this route is inhibited, poisonous heme builds up, which impairs the parasite's capacity to live and proliferate. When combined with artemether, LUM has a strong therapeutic impact that increases medication effectiveness and lowers the risk of malaria recurrence. The crucial antimalarial medication LUM has a low and variable oral bioavailability, usually between 4 and 11%, due to its weak water solubility. LUM's restricted bioavailability can make it more difficult for the medication to be absorbed, distributed, and used effectively to treat malaria. Improving LUM's bioavailability is necessary for boosting its therapeutic results in light of these limitations. Developing and characterizing nanoparticles, which may boost the drug's permeability and solubility, is one way to deal with this problem. Enhancing LUM's efficacy and absorption would greatly increase its clinical value, providing more reliable therapeutic effects and lowering the requirement for larger dosages. This improvement is especially crucial for the treatment of malaria since increasing the bioavailability of LUM may increase its efficacy, making it a more dependable and efficient cure for malaria.
A type of carbon-based nanoparticle, carbon dots (CDs) typically measure between 1 and 10 nm in size. Their specific optical, chemical, and biological characteristics render them extremely adaptable for a wide range of functions [6, 7]. CDs may produce light at multiple wavelengths depending on their size, surface functionalization, or excitation wavelength. They are characterized by their compact size, good water solubility, great biocompatibility, and adjustable fluorescence. Because it allows for applications in bioimaging, medication administration, sensors, and optoelectronics, this fluorescence capacity is one of their most alluring qualities. A carbon core makes up most of a carbon dot's structural makeup, with oxygen, nitrogen, or other elements being added to the surface. Doping can be used to add these functional groups, improving certain characteristics, like as targeting capabilities or fluorescence intensity. CDs can help to enhance the solubility and bioavailability of LUM [8], We have fabricated the LUM-loaded CDs.
To evaluate the % entrapment, % loading, and in vitro drug release of LUM from the CDs, a validated analytical method is required. In this work, we used modelling tools like design of experiment (DoE) to create and verify a sensitive and accurate RP-HPLC-based analytical technique [9, 10]. DoE is a reliable modelling technique that predicts chromatographic settings that yield the best efficiency with the lowest possible attempts. Thus, it also cuts down on the time and expense required to create the HPLC process. It also conserves solvent consumption by lowering the number of trials, which supports environmental sustainability. By using DoE, researchers may more effectively investigate the connections between various factors and their analytical outputs [11–13]. One factor at a time (OFAT) trials, which are costly and time-consuming, are used in the conventional HPLC method development approach [14–16]. By using DoE, the number of trial runs is decreased, and the impact of these factors on the overall performance of the approach is better understood. The greenness of the developed method will be assessed using the AGREE (Analytical GREEnness) analysis based on the 12 principles of green analytical chemistry. The greenness of the method was evaluated by evaluating the parameters such as energy consumption, reagent toxicity, waste generation, instrumentation efficiency, and sample throughput on a scale of 0 to 1, where 1 indicated complete green, which allows research to maximize the environmental friendliness analytical technique.
Fig. 1: Chemical structure of LUM
MATERIALS AND METHODS
Materials
LUM(API) was purchased from Mangalam Drugs and Organics Ltd., Mumbai, India. Citric acid and urea we repurchased from Finar Chemicals, Ahmedabad, India. HPLC-grade solvents, including methanol and acetonitrile, were purchased from Finar Chemicals. Potassium dihydrogen phosphate was purchased from Merck Life Sciences Pvt Ltd, Mumbai, India, while ammonium acetate was purchased from Finar Chemicals. Ultrapure water was obtained from a Milli-Q water purification system (Merk Millipore), and 0.22µm syringe filters were purchased from Nexus Scientific, Bangalore, India.
Method
Instrumentation
A Shimadzu HPLC system comprising an LC-20AD pump, SIL-20AC HT autosampler, CTO-10ASVP column oven, SPD-20A and SPD-M10A detectors, and LabSolutions software was used for the optimization and validation of the chromatographic method. A calibrated analytical balance (Sartorius Mechatronics CP225D, India) was used to accurately weigh all the chemicals and reagents for the preparation of the standard solution and buffers. The mobile phase was filtered through a 0.22 µm membrane filter using a glass vacuum filtration assembly (Merck Millipore, Bangalore, India) and subsequently degassed in an ultrasonic bath (GT Sonic, Guangdong GT Ultrasonic Co. Ltd., China). The pH of the mobile phase was measured using a calibrated digital pH meter (Model LI 617, ELICO, Telangana, India). Pipetting during various stages of sample processing was conducted using a calibrated variable-volume micropipette (Eppendorf, Germany) with capacities ranging from 0.2 – 10 µl**, 10-100 µl**, and 100 – 1000 µl**.
Preparation of mobile phase and standard solution
A combination of methanol and potassium dihydrogen phosphate buffer was used as the mobile phase. To prepare the final mobile phase, methanol and potassium dihydrogen phosphate (25 mmol) were mixed at a ratio of 8:2 (v/v), and the pH was adjusted below 3.0 using orthophosphoric acid. Following pH adjustment, the mobile phase was sonicated and filtered through a 0.2 µm membrane filter to ensure clarity and remove the particulates.
Primary stock solution of LUM (1 mg/ml) was prepared using methanol. A working standard solution (100 µg/ml) was prepared by appropriate dilution of the primary stock solution with methanol. Calibration standard solutions were then prepared in the concentration range of 0.5 to 20 µg/ml using serial dilution of the working standard solution.
Design of experiments (DoE) optimization of chromatographic conditions
DoE is a robust statistical modelling approach that aids in revealing the impact of the interactions of the factors on the responses. It was used to optimize the impacts of multiple chromatographic parameters, including retention Time (Rt), peak area, and resolution, to extensively evaluate and enhance the performance of the analytical method. The injection volume, flow rate, buffer pH, and mobile phase ratio were the independent variables. Preliminary one-factor-at-a-time (OFAT) studies were carried out to identify the factors influencing the drug’s separation. The designs utilized for optimization include central composite design (CCD) and box-Behnken design (BBD) [17, 18]. One benefit of the BBD over the CCD is that it requires fewer runs. Four chromatographic parameters were chosen to be the independent variables for the five responses in the BBD model. The HPLC technique was modelled using the Design Expert®, version 9.0.1 (Stat-Ease Inc., USA). In both lower and higher ranges, the independent variables were % buffer ratio ranges from 15 to 25%, buffer pH ranges from 2.7 to 3.1, flow rate ranges from 0.8 to 1.1 ml/min, and injection volume ranges from 15 to 20 µl**. DoE recommended 29 trial conditions for the model's development based on the input. We conducted HPLC experiments using the recommended conditions, and table 1 presents the results. The dependent variables were peak area of (Y1), retention time (Rt) of LUM (Y2), tailing factor (Tf), and theoretical plate (Tp). The p-value, determination coefficient (R2), adjusted determination coefficient (adj R2), and anticipated determination coefficient (pred R2) were examined after the answer was subjected to an ANOVA. 3D-response surface graphs and perturbation plots were produced by surface analysis. The link between the factors and the outcomes was revealed by the 3D plot and perturbation plots.
Method validation
The DoE-based approach was validated following ICH Q2 (R2) requirements [19]. Six replicates of LUM were injected at concentrations of 1 mg/ml to conduct a system suitability investigation. The Tailing factor (Tf), number of theoretical plates (N), and Rt were then determined. By examining how the blank solvent, matrix, and excipients interfered with the drug peak, the method's selectivity was assessed. Three duplicates of the materials were injected with blank diluent, and the interferences at the Rt of LUM were examined.
A standard curve for the LUM between the peak area and drug concentration has been generated to assess the linearity of the suggested method. LUM's linearity ranged from 0.5 to 20 µg/ml. Three duplicates of the linearity samples were injected. Three separate concentration levels (80%, 100%, and 120%) were used to test the HPLC method's accuracy. The method's intra-and inter-day precision CVs were assessed. By gently altering the chromatographic settings, the new method's robustness was examined. Using the slope and standard deviation of the answers, the proposed method's Limit of Detection (LOD) (Equation 1) and Limit of Quantification (LOQ) (Equation 2) were established. Here, S is the calibration curve's slope and σ is the response's standard deviation.
 …. (1)
 …… (2)
Preparation and evaluation of LUM-loaded CDs
Synthesis of CDs
CDs were synthesized using a microwave-assisted method using citric acid and urea as carbon sources, respectively, in a molar ratio of 5:1 (citric acid: urea). The synthesis process was optimized by varying the precursor ratio and microwave heating duration. The precursors were dissolved in distilled water and stirred to procure a homogeneous solution. The solution was then introduced to microwave irradiation for the formation of CDs. The change of colour was evidence of the formation of CDs by the carbonization method. The reaction mixture was allowed to cool at room temperature, subsequently diluted with distilled water, and homogenized through continuous stirring and sonication. The resultant colloidal dispersion was purified by centrifugation at high speed to remove larger particulates, followed by filtration through a 0.22 µm membrane to eliminate any residual impurities. The process showed the formation of highly stable and fluorescent CDs. For drug loading, first, the drug was dissolved in a methanol: dichloromethane (1:1) solvent system. Thus, the drug solution was then added dropwise to the aqueous CDs solution under constant stirring. The mixture was then allowed to stir for 24 h in light-protected conditions to prevent photodegradation of the drug and facilitate the non-covalent encapsulation of the drug onto the CDs matrix.
Determination of entrapment efficiency (% EE) and drug loading (% DL) of CDs
The entrapment efficiency (% EE) of LUM within CDs was determined by quantifying the amount of free drug present in the supernatant after centrifugation. Briefly, the drug-loaded CDs were prepared by mixing a predetermined amount of LUM with an aqueous dispersion of CDs under optimized conditions. After the loading process, the mixture was subjected to centrifugation using a high-speed ultracentrifuge (REMI High Speed, REMI Corporation, India) at 10,000 RPM for 30 min at 4 °C to ensure complete sedimentation of the drug-loaded CDs. After centrifugation, the supernatant containing unassociated LUM was carefully collected and analyzed using a validated high-performance liquid chromatography (HPLC) method at a detection wavelength of 236 nm. The amount of LUM entrapped within the CDs was calculated using Equation 3:
 … (3)
… (3)
Further, the % drug loading within the CDs was determined to analyze the amount of drug encapsulated per unit mass. The % drug loading was determined using Equation 4:
 …. (4)
Drug release study
For the determination of the loading efficiency of the drug in CDs, 10 ml of the LUM-loaded CDs solution was loaded into a dialysis bag and kept in 100 ml PBS solution having different pH values (3.0 and 6.8). The release profile was evaluated at a magnetic stirrer at 37 °C. The sample was withdrawn at a time interval of 15 min, 30 min, 1 h, 2 h, 4 h, 6 h, 8 h, 12 h, 18 h, and 24 h. The same amount of fresh dissolution media was added to maintain the sink condition. The amount of drug was calculated with the help of an HPLC system at 236 nm wavelength.
Forced degradation studies
Stress-induced degradation studies are used to evaluate a drug's stability under demanding formulation development circumstances. The analytes were subjected to oxidative, thermal, photolytic, alkaline, and acidic stressors. Pharmacosomes containing 1 mg/ml of LUM were subjected to forced degradation investigations. The drug concentration in the degradation samples was evaluated using the DoE modelled verified HPLC technique. The percentage of degradation was calculated after the assay was carried out in triplicate [20].
LUM's acid hydrolysis was assessed using two distinct molar concentrations of HCl (0.1 N and 1 N). The degradation investigations were also assessed at two molar concentrations of NaOH (0.1 N and 1 N) in an alkaline medium. Using a 3% w/v H2O2 solution, the degradation study caused by oxidative stress was assessed. To verify the photolytic stability investigation, the produced pharmacosomes were exposed to UV light for a whole day. For 24 h, thermal degradation research was conducted in an oven set at 60 °C [21].
Greenness of the development method
The AGREE program (Analytical Greenness Metric Approach and program) was used to assess the analytical technique's greenness [22]. The purpose of this methodology is to assess how the analytical procedure affects the environment. Twelve elements are considered in this system, and each one is assigned a value ranging from 0 to 1, where higher scores indicate a greener approach.
RESULTS AND DISCUSSION
DoE-based analytical method modelling decreases trial failure rates and aids in chromatographic condition optimization, which results in effective analyte separation. The good absorption of LUM at 235 nm led to the use of a photodiode array (PDA) detector for the separation. The Gracemart reverse phase C18 (250 mm x 4.6 mm, 5µm) was selected as the stationary phase based on the LUM chemistry (fig. 1). The Lum is a highly lipophilic drug, and the Gracemart reverse phase C18 is well-suited for the lipophilic drugs. The LUM retain in the column through hydrophobic interactions between the drug and the stationary phase. LUM has multiple aromatic rings and long alkyl chains, which interact with the long octadecyl (C18) hydrocarbon chain, which helps the strong retention of LUM in the column. Accordingly, Gracemart reverse phase C18 (250 mm x 4.6 mm, 5µm) was employed in the preliminary one-factor-at-a-time (OFAT) trials. LUM pKa (9.35) and its effect on ionization, retention, and peak shape in RP chromatography are the primary justification for using buffer pH 3 in the HPLC investigation of LUM. Because LUM is a weakly basic and highly lipophilic molecule, it stays protonated (ionized) at pH values below its pKa while existing in its natural (non-ionized) form at higher pH values. In RP-HPLC, the analyte and the nonpolar C18 stationary phase interact hydrophobically to control retention. LUM is mostly ionized at pH 3, which decreases its hydrophobic interactions with the stationary phase and improves peak symmetry and retention durations.
DoE-assisted optimization of HPLC method
Evaluation of risk assessment
The link between analytical technique parameters and their influence on analytical outputs was carefully through a cause-and-effect evaluation utilizing the Ishikawa fishbone diagram (fig. 2). The Ishikawa diagram main goal is to pinpoint any risk factors and root causes that might affect an analytical method's dependability and performance. This fig. offers an organized way to comprehend the interplay between critical analytical attributes (CAAs) and critical method parameters (CMPs), effectively illustrating the crucial link between the two. The impact of each parameter was evaluated using a risk-based approach, which made it possible to pinpoint the crucial elements that have a big impact on analytical performance. Flow rate, injection volume, detection wavelength, oven temperature, methanol-to-buffer ratio, and buffer pH were among the important screening parameters chosen. According to the findings, the factors that had most effects on important analytical characteristics including resolution, retention time (RT), and peak area were buffer pH, buffer ratio, and mobile phase flow rate. These results emphasize how important it is to optimize these parameters in order to improve method robustness and guarantee dependable analytical performance.
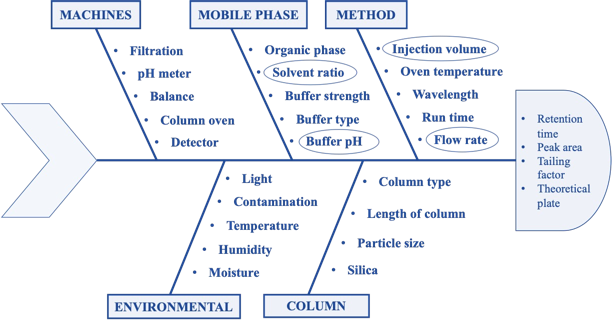
Fig. 2: Ishikawa fishbone diagram for the identification of possible risk factors
BBD aided method optimization
The three-level Box-Behnken Design (BBD) and Design of Experiments (DoE) were used to optimize independent variables, such as buffer ratio (A), buffer pH (B), flow rate (C), and injection volume (D). One-Factor-At-a-Time (OFAT) was used to determine the lower and upper limits for these variables prior to the DoE optimization. Based on the initial screening, the buffer ratio was set between 15% and 25%, the pH of the buffer was changed between 2.7 and 3.1, the flow rate was adjusted between 0.8 and 1 ml/min, and the injection volume was tested between 15-20 µl**. In order to systematically evaluate the influence of these independent variables on chromatographic efficacy, the DoE software generated 29 experimental runs using these defined ranges. Each of the 29 suggested HPLC runs was conducted under the specified conditions, and the responses obtained were carefully examined to determine the optimal chromatographic parameters. This approach allowed for a more accurate and methodical evaluation of the critical factors influencing chromatographic separation, ensuring robust and reliable method development.
For optimization, the following responses were chosen: LUM peak area (Y1), retention time (tR) (Y2), tailing factor (Y3), theoretical plates (Y4), and resolution (Y5). To guarantee a though assistant of the chromatographic methods effectiveness and accuracy of the recommended experimental setups and the accompanying HPLC trial results. An analysis of Variance (ANOVA) was performed in order to ascertain the statistical significance of the independent variables on the chosen answers (table 2). A more focused optimization strategy was made possible by this statistical analysis, assistance in identifying the crucial elements that significantly affected chromatographic performance. To further illustrate the relationship between each answer and the four important factors that had a major impact on the chromatographic results, 3D surface plots and perturbation plots were created using the DoE program. A greater comprehension of the optimization process was made possible by these graphical representations, which offered deeper insights into how each element affected the analytical solution.
Table 1: DoE recommended independent factors and their respective responses
| Runs | Trials suggested by the DoE model | Response obtained from the experimental trials | ||||||
| X1 | X2 | X3 | X4 | Y1 | Y2 | Y3 | Y4 | |
| 1 | 20 | 3.1 | 0.95 | 20 | 81165.5 | 4.903 | 1.438 | 4330.48 |
| 2 | 20 | 3.1 | 0.95 | 15 | 59870.5 | 4.8905 | 1.393 | 4295.02 |
| 3 | 20 | 3.1 | 0.8 | 17.5 | 84100.5 | 5.79 | 1.4015 | 4303.74 |
| 4 | 25 | 3.1 | 0.95 | 17.5 | 71851.5 | 6.4885 | 1.412 | 4700.84 |
| 5 | 15 | 2.9 | 0.95 | 15 | 46875 | 3.989 | 1.545 | 3819.15 |
| 6 | 20 | 2.9 | 0.95 | 17.5 | 71695 | 4.7305 | 1.4435 | 4135.76 |
| 7 | 15 | 2.7 | 0.95 | 17.5 | 78310 | 3.8625 | 1.6635 | 4126.55 |
| 8 | 25 | 2.9 | 0.8 | 17.5 | 85471 | 7.4275 | 1.459 | 4913.28 |
| 9 | 20 | 2.9 | 0.8 | 20 | 92442 | 5.6635 | 1.459 | 4635.27 |
| 10 | 25 | 2.9 | 0.95 | 20 | 76690 | 6.311 | 1.4215 | 4606.54 |
| 11 | 20 | 2.9 | 0.95 | 17.5 | 69605.5 | 4.787 | 1.4455 | 4223.99 |
| 12 | 20 | 2.9 | 0.95 | 17.5 | 71047 | 4.7675 | 1.4565 | 4187.99 |
| 13 | 15 | 2.9 | 0.8 | 17.5 | 97766 | 4.692 | 1.724 | 4260.79 |
| 14 | 20 | 2.7 | 0.95 | 15 | 58749.5 | 4.5335 | 1.432 | 4347.49 |
| 15 | 25 | 2.7 | 0.95 | 17.5 | 72608.5 | 5.8725 | 1.419 | 4631.72 |
| 16 | 20 | 2.7 | 1.1 | 17.5 | 61466 | 3.9105 | 1.417 | 4202.9 |
| 17 | 25 | 2.9 | 1.1 | 17.5 | 63541 | 5.4735 | 1.4845 | 4301.96 |
| 18 | 20 | 2.9 | 0.95 | 17.5 | 70450.5 | 4.7535 | 1.4435 | 4215.89 |
| 19 | 20 | 2.9 | 0.8 | 15 | 68217.5 | 5.6275 | 1.4375 | 4640.28 |
| 20 | 20 | 3.1 | 1.1 | 17.5 | 63254.5 | 4.1975 | 1.426 | 4113.24 |
| 21 | 15 | 3.1 | 0.95 | 17.5 | 75693 | 4.0695 | 1.5395 | 4113.82 |
| 22 | 20 | 2.9 | 1.1 | 15 | 51218 | 4.0865 | 1.4395 | 3985.71 |
| 23 | 20 | 2.9 | 1.1 | 20 | 68304.5 | 4.095 | 1.447 | 4054.5 |
| 24 | 25 | 2.9 | 0.95 | 15 | 58101 | 6.271 | 1.404 | 4570.75 |
| 25 | 20 | 2.9 | 0.95 | 17.5 | 71221.5 | 4.7755 | 1.459 | 4190.83 |
| 26 | 20 | 2.7 | 0.95 | 20 | 79067 | 4.5995 | 1.4205 | 4423.16 |
| 27 | 15 | 2.9 | 0.95 | 20 | 90332.5 | 3.973 | 1.763 | 3873.52 |
| 28 | 20 | 2.7 | 0.8 | 17.5 | 83945.5 | 5.435 | 1.4225 | 4753.22 |
| 29 | 15 | 2.9 | 1.1 | 17.5 | 68806.5 | 3.4595 | 1.7045 | 3530.87 |
Table 2: Outcomes for ANOVA of the box-behnken design
| Response | Peak area of LUM (Y1) | tR of LUM (Y2) | Tf of LUM (Y3) | Tp of LUM (Y4) | ||||
| F-value | 14.09 | |||||||
| p-value | Model | <0.0001 | Model | <0.0001 | Model | <0.0001 | Model | <0.0001 |
| A | 0.1060 | A | <0.0001 | A | <0.0001 | A | <0.0001 | |
| B | 0.9190 | B | 0.0210 | B | 0.1959 | B | 0.1593 | |
| C | <0.0001 | C | <0.0001 | C | 0.9036 | C | <0.0001 | |
| D | <0.0001 | D | 0.8631 | D | 0.0264 | D | 0.5431 | |
| AB | 0.8547 | AB | 0.4103 | AB | 0.1158 | AB | 0.7441 | |
| AC | 0.4917 | AC | 0.1543 | AC | 0.5316 | AC | 0.6368 | |
| AD | 0.0231 | AD | 0.9094 | AD | 0.0116 | AD | 0.9408 | |
| BC | 0.8722 | BC | 0.8901 | BC | 0.6756 | BC | 0.1623 | |
| BD | 0.9233 | BD | 0.9134 | BD | 0.4338 | BD | 0.8724 | |
| CD | 0.4851 | CD | 0.9554 | CD | 0.8448 | CD | 0.7684 | |
| A2 | <0.0001 | - | ||||||
| B2 | 0.0102 | |||||||
| R2 | 0.8867 | 0.9574 | 0.9319 | 0.8946 | ||||
| Adjusted R2 | 0.8238 | 0.9337 | 0.8808 | 0.8361 | ||||
Note: −A specifies buffer ratio, B specifies buffer pH, C specifies flow rate, D specifies injection volume, AB specifies combination of buffer ratio and buffer pH, AC specifies combination of buffer ratio and flow rate, AD specifies combination of buffer ratio and injection volume, BC specifies combination of buffer pH and flow rate, BD specifies combination of buffer pH and injection volume, CD specifies combination of flow rate and injection volume.
Influence of independent variables on peak area of LUM (Y1)
The impact of independent factors on the peak area of LUM was assessed and predicted using the 3D surface plot (fig. 3a) and perturbation plot (fig. 4a). A visual grasp of how changes in the chosen parameters impacted the response was made possible by these graphical representations. Independent variables C and D were shown to have a statistically significant effect on the peak area of LUM by the quadratic equation (Equation 5), which was obtained from the analysis of Variance (ANOVA). In particular, there was a clear proportionate association between an increase in component C and an increase in the peak area. Independent variable D, on the other hand, showed an inverse impact, which means that variables in D caused the peak area of LUM to trend in opposite directions. Further affecting the total peak response was the fact that a drop in C led to a similar fall in D.
The peak area of LUM, however, was not significantly affected by independent variables A or B, indicating that these factors were not crucial in determining the reaction. This research offered useful insights for improving chromatographic conditions and assisted in identifying the main influencing elements.

Influence of independent variables on Rt of LUM(Y2)
The impact of independent factors on the Rt of LUM was predicted using the 3D surface plot (fig. 3a) and perturbation plot (fig. 4a). A fuller comprehension of the chromatographic behaviour was made possible by these plots, which offered a throughout picture of the connections between the experimental parameters and the Rt. The retention duration of LUM was shown to be strongly impacted by independent variables A, B and C, according to the quadratic model (Equation 6), which was obtained from the ANOVA study. In particular, a rise in A and B resulted in a commensurate increase in buffer content and more acidic pH conditions, most likely as a result of charged interactions with the stationary phase.
On the other hand, there was a negative correlation between variable C and Rt. The Rt of LUM reduced the flow rate, which is in line with chromatographic theory, which states that quicker mobile phase movement reduces the analytes contact time with the stationary phase, leading to an earlier elution. In the meantime, the retention duration was not statistically affected by the independent variable D, indicating that its alteration does not significantly change the elution profile of LUM within the measured range. These results are essential for adjusting the parameters of the approach in order to attain the best separation and runtime efficiency.

Influence of independent variables on Tf of LUM (Y3)
The impact of independent factors on the Tf of LUM was evaluated using the 3D surface plot (fig. 3a) and perturbation plot (fig. 4a). A thorough understanding of the individual and combined effects of each parameter on peak symmetry, a crucial quality trait in the development of chromatographic methods, was made possible by these visual aids. The independent variables A and D had a statistically significant effect on the Tf of LUM, according to the quadratic model equation (Equation 7), which was obtained from the ANOVA study, in particular, an increase in A was linked to an increase in Tf, indicating that a larger buffer content might result in less symmetrical peaks, perhaps as a result of changes in elution strength or solute-stationary phase interactions.
Conversely, independent variable D showed the opposite impact. The Tf decreased as the injection volume increased, suggesting better peak symmetry at greater volumes. At higher injection volume, this can be the result of better sample dispersion or increased mass transfer in the column. On the other hand, within the studied experimental range, factors B and C did not significantly affect the Tf. This suggests that peak asymmetry in this situation was not significantly influenced by variations in pH or flow rate. Accurate quantification and resolution depend on sharper, more symmetrical peaks, which may be achieved by fine-tuning technique parameters with the help of these insights.

Influence of independent variables on Tp of LUM (Y4)
The impact of independent factors on the Tp of LUM, a crucial measure of column efficiency and overall chromatographic performance, was investigated using the #D surface plot (fig. 3a) and perturbation plot (fig. 4a) by representing variations in peak sharpness and separation power, these graphical tools provided an easy-to-understand illustration of how each experimental condition affects column efficiency. Independent variables A and C had a statistically significant effect on the theoretical plate count of LUM, as indicated by the quadratic equation (Equation 8) produced by the ANOVA study. The number of theoretical plates increased as an increased, suggesting improved column efficacy. Improved solute-stationary phase interaction under ideal buffer conditions might be the cause of this.
On the other hand, Tp was impacted by C. The number of theoretical plates dropped as the flow rate rose, indicating a drop in column efficiency. Higher flow rate rates can shorten the time analytes and the stationary phase interact, resulting in wider peaks and worse separation performance. This is in line with chromatographic principles. However, within the range under study, independent variables B and D did not significantly affect Tp. This implies that changes in these parameters had little effect on the chromatographic system efficiency. To get high-resolution separations with less peak widening, these results are essential for chromatographic condition optimization.

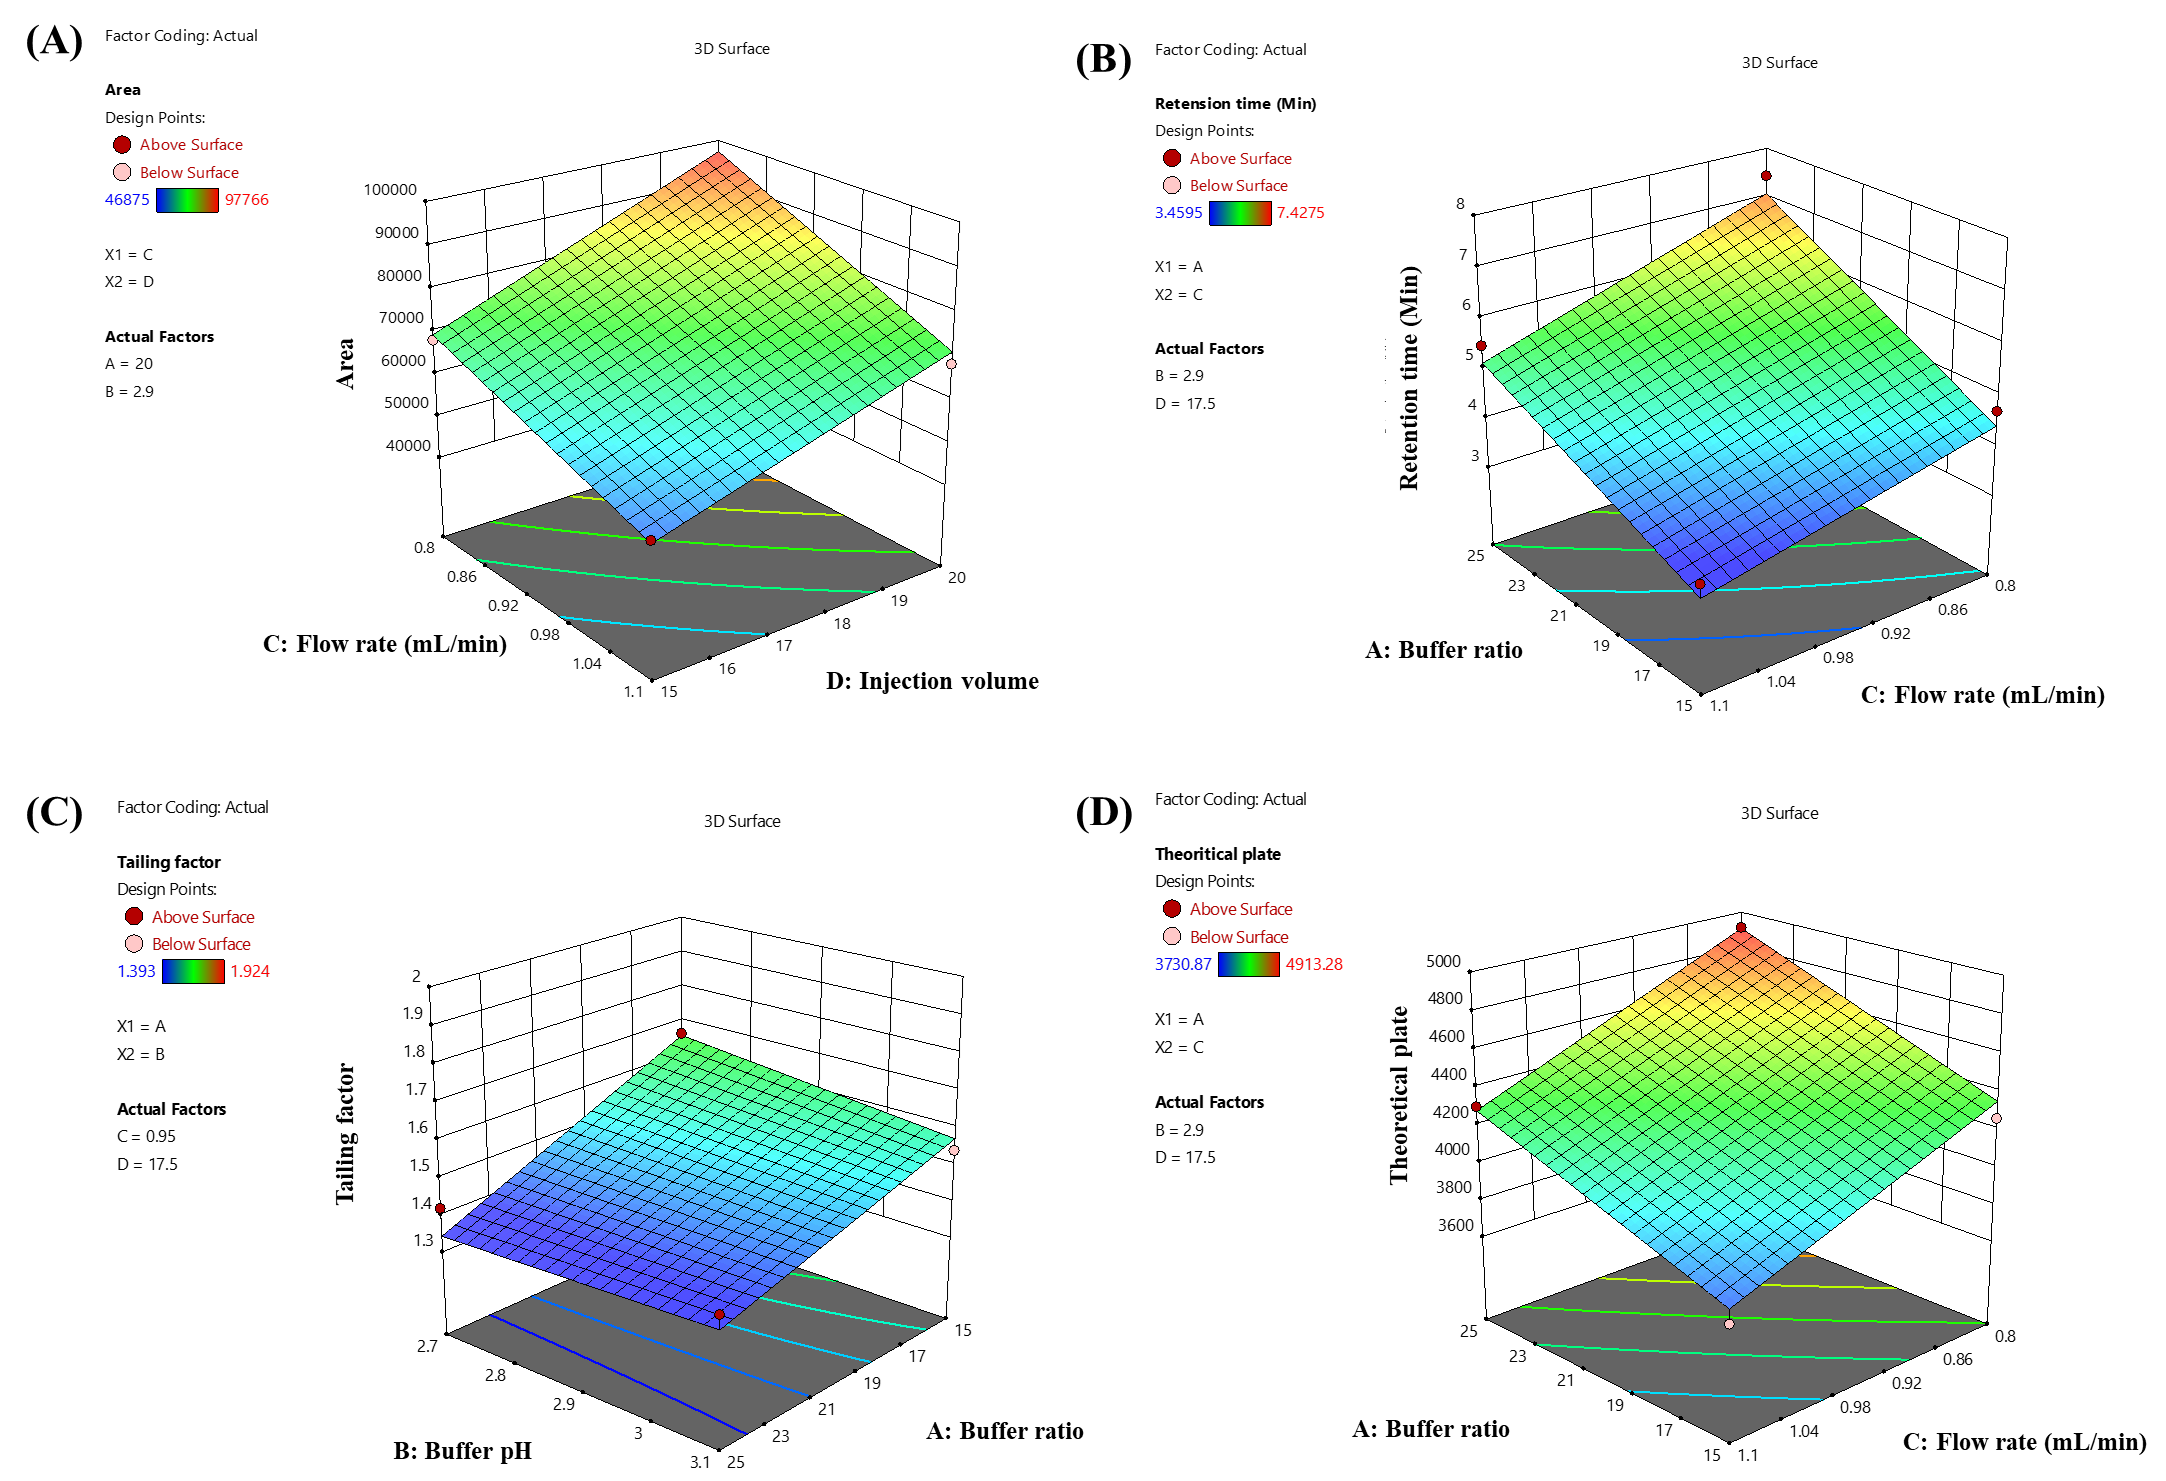
Fig. 3: 3D surface response graph showing the influence of independent variables: (a) peak area of Lumefantrine (Y1); (b) Rt of Lumefantrine (Y2); (c)Tf of Lumefantrine (Y3); and (d) Tp of Lumefantrine (Y4)
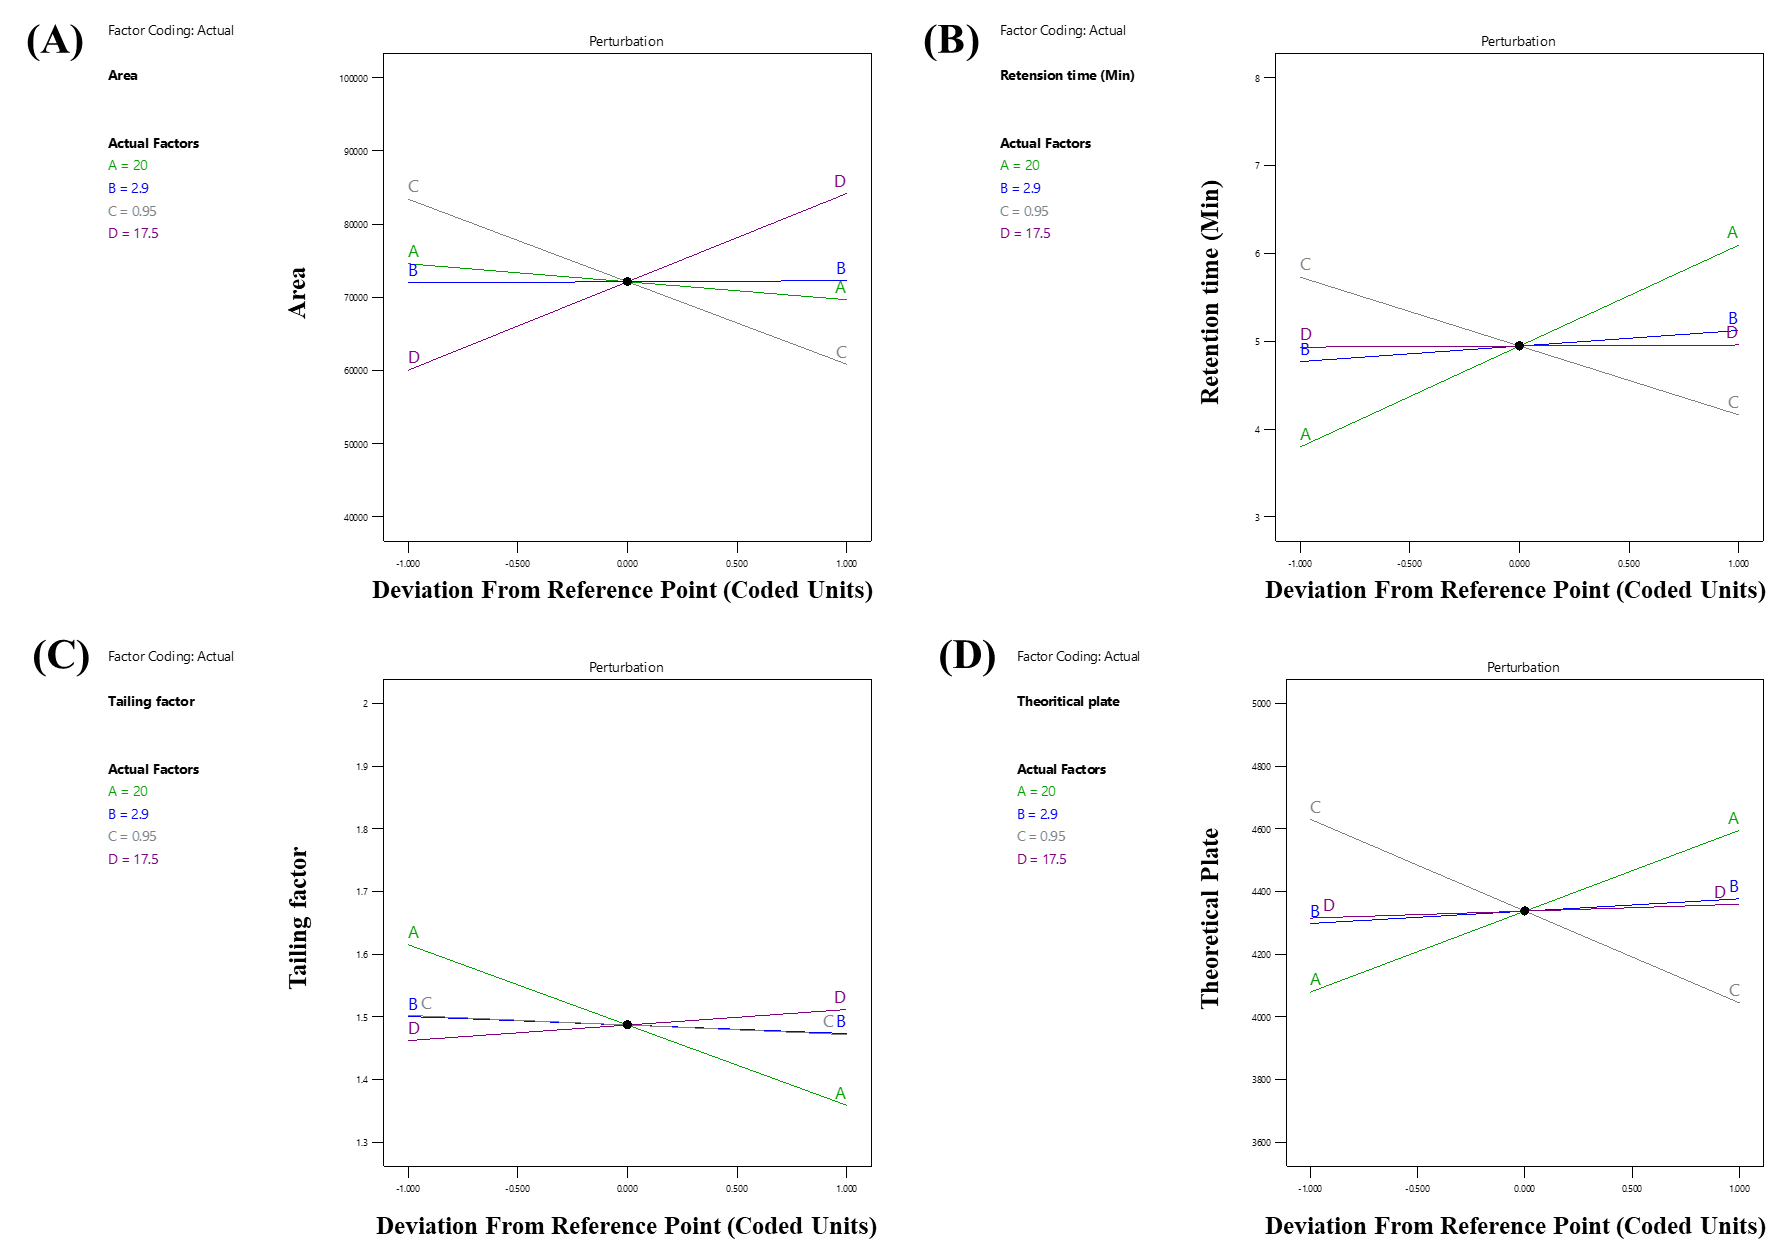
Fig. 4: Perturbation plot depicting the impact of independent factors: (a) peak area of Lumefantrine (Y1); (b) Rt of Lumefantrine (Y2); (c)Tf of Lumefantrine (Y3); and (d) Tp of Lumefantrine (Y4)
Desirability
According to the desire graph generated via the DoE software, the chromatographic parameters that obtained a desirability score of 1 were found to be the ideal parameters for the HPLC technique (fig. 5). Multiple responses, including peak area, Rt, Tf, and Tp, and resolution for LUM, are combined into a single score by the desirability function, a multi-criteria decision-making tool. A value of 1 demonstrates the best balance of these parameters. This modification guarantees that the technique for measuring the antimalarial medication LUM in biological or pharmaceutical samples in accurate and reliable. The desirability study recommends the following as ideal conditions: a pH of 3.0 for the mobile phase for improved analyte stability and separation; a flow rate of 1 ml/min to balance analysis speed and resolution; a 20 µl** injection volume to ensure sufficient sample loading without overloading the column; a mobile phase composition of methanol and 25 mmol potassium dihydrogen phosphate buffer in an 80:20 (v/v) ratio, operated in isocratic mode; and a column oven temperature of 30 ℃ to maintain consistent analyte retention.
The chromatogram generated under these ideal circumstances is shown in fig. 6 and shows a well-resolved peak for LUM with satisfactory symmetry, Rt and resolution, demonstrating the efficacy of the proposed parameters. Following the criteria of the ICH, a thorough validation was carried out to further determine the robustness, repeatability and dependability of the DoE-modelled approach.
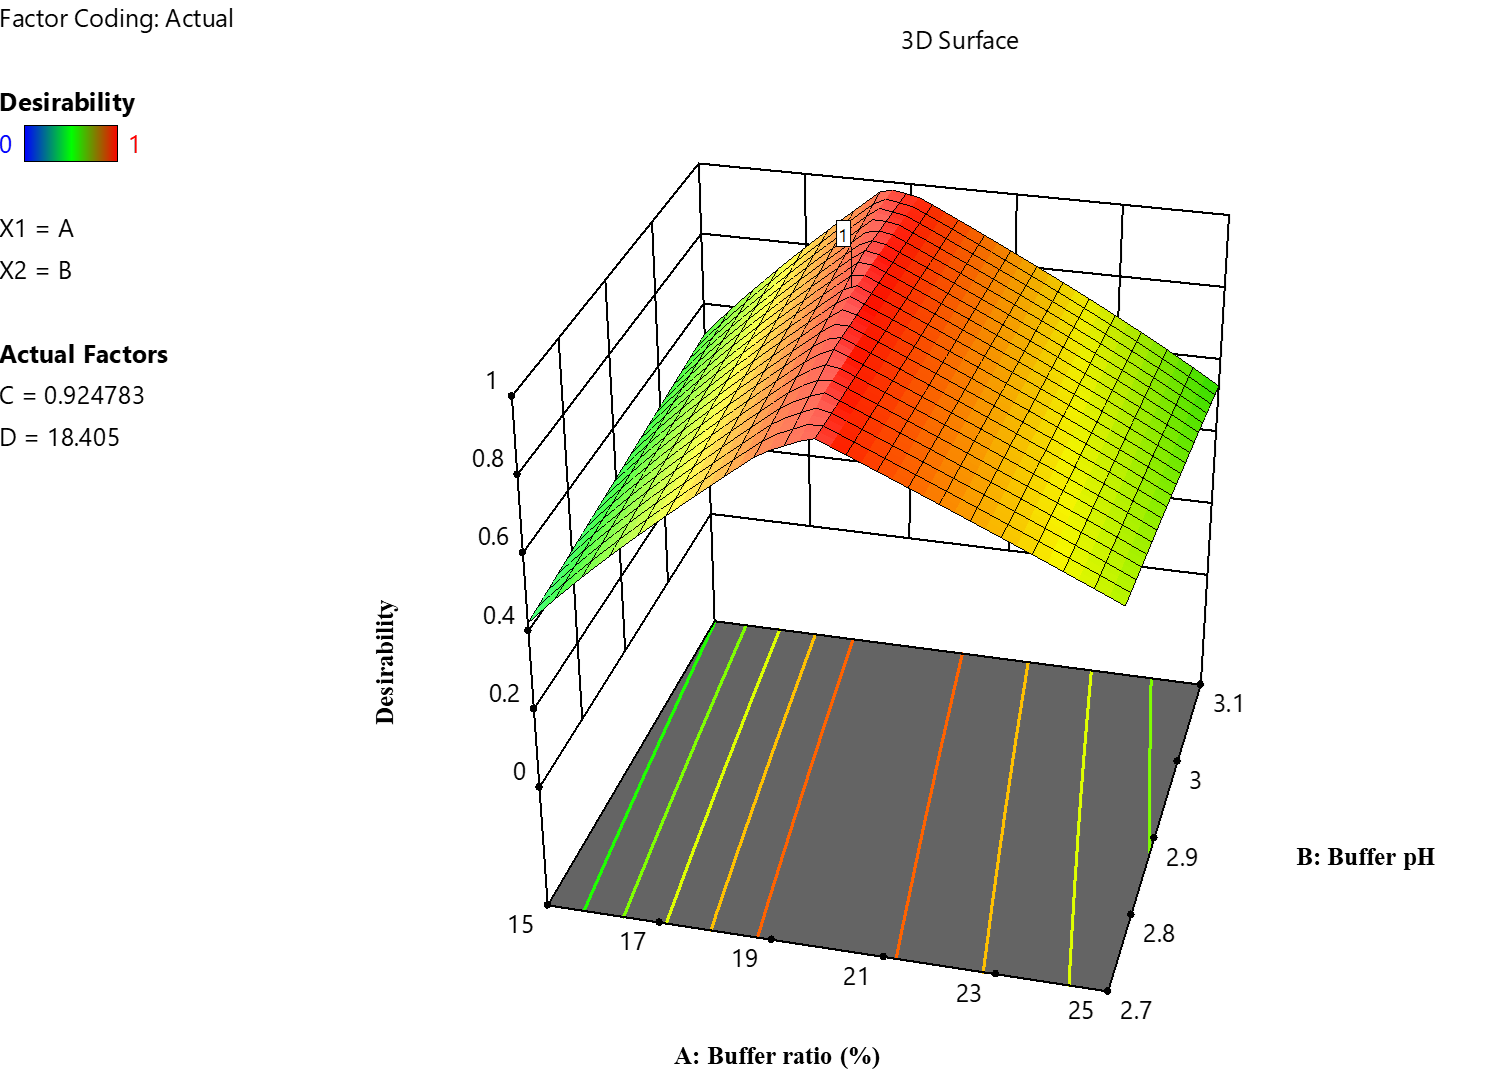
Fig. 5: Desirability plot depicting the optimized conditions
Method validation
Analytical method validation is a crucial step in guaranteeing the method being used is precise, repeatable, as well as suitable for its intended use, such as the accurate measurement of LUM in biological matrices or pharmaceutical formulations. Following the rules of the ICH, the findings of the validation procedure for the established HPLC technique are presented in table 3, which provides a thorough assessment of important performance characteristics (e. g., ICH Q2(R2). To make sure the procedure satisfies scientific and regulatory requirements for routine usage.
The analytical system functions effectively under the optimum settings, determined by the system suitability evaluation, the most important pre-validation check. The results of the study demonstrated peak symmetry and good separation efficiency with a resolution value larger than 2, a Tf around 1, and several Tp above 2000. As required for accurate quantitative analysis, these measures guarantee that the chromatographic technology can effectively separate LUM from any excipient or co-eluting substances. The formulation’s blank chromatogram, shown in fig. 6, offered additional evidence of the method’s selectivity. There were no interference peaks at the LUM Rt in this chromatogram, which was generated by injecting a blank sample. This lack of interference shows that the technique can identify LUM precisely without the help of excipients or degradation products. The peak purity curve has been shown in the supplementary fig. S2. The linearity range of the calibration curve was 0.5-20 µg/ml with an R2 value of 0.999. The linearity equation for the LUM was y = 70246+2511.6, and the calibration curve has been shown in supplementary fig. S1.
Recovery studies validated the precision of the developed HPLC method in quantifying LUM in different drug solutions, with results within 101±2% across three different concentration level (low, medium, and high). The reliability of the method is shown by the fact this recovery range, which is calculated by comparing measured concentrations against known spiking values, satisfies the strict requirements specified in the ICH Q2 (R2) recommendations. The method’s great repeatability for LUM analysis was highlighted by precision evaluations used in intra-day and inter-day experiments, which showed a percentage % CV of less than 2%. To guarantee consistent performance within inter-and intraday, a crucial sign of technique robustness, these evaluations include numerous duplicate injections under uniform conditions. The robustness data is provided as the supplementary table S1. The validation evaluation of the developed method confirms the suitability for the quantification of Lum from the CDs.
Application of the method for evaluating the developed CDs
%EE and %LD of LUM from CDs
The estimation of % EE is a crucial formulation indicator for determining the effectiveness of a new delivery system. EE% is a formulation’s potential to encapsulate the medication within its delivery system. Finding the factors that result in the maximum drug entrapment in the formulation is crucial during formulation development. For formulations including liposomes, nanoparticles, microspheres, and mucoadhesive beads, this determination is essential. The synthesis of CDs with the molar ratio of urea and citric acid (1:5) in distilled water was performed with continuous stirring. The final optimized CDS have a % EE % of 65.19 % and % DL of 18.23% of LUM in CDs. The reported literature showed the % EE and % DL of LUM in the nanoliposomes were 47.34% and 4.5%. Which is lesser than our reported % EE and % DL [23].
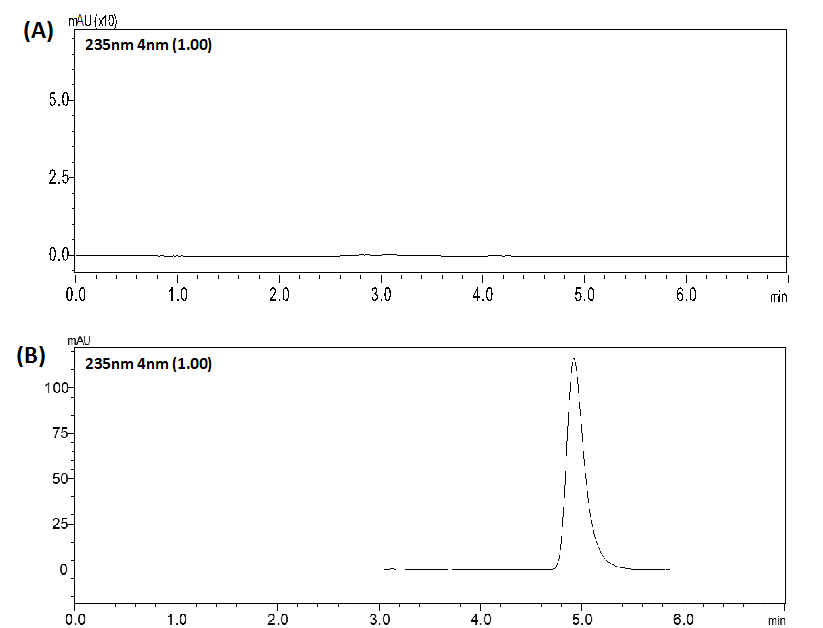
Fig. 6: Chromatogram obtained at optimized conditions (A) Chromatogram of blank formulation, (B) Chromatogram of LUM-loaded CDs
Table 3: Validation data of the optimized analytical method
| Retention time | 4.574±0.059 |
| Theoretical plate | 4421.84±46.13 |
| Tailing factor | 1.401±0.010 |
| Linearity range (µg/ml) | 0.5-20 |
| R2 | 0.999 |
| Linearity equation | Y=70246x-2511.8 |
| LOD (ng/ml) | 77.64 |
| LOQ (ng/ml) | 232.92 |
| Accuracy (% Recovery) | |
| 80% | 98.991 |
| 100% | 99.295 |
| 120% | 101.476 |
| Precision (% CV) | |
| Repeatability | 0.152 |
| Inter-day | 0.631 |
In vitro release of LUM from the CDs
The developed analytical method was employed to assess the in vitro drug release behaviour of LUM-loaded CDs. Release studies were conducted in PBS at pH 3.0 and 6.8 to stimulate different gastrointestinal environments, respectively. Aliquots were withdrawn at predefined time intervals of 15 min, 30 min, 1h, 2h, 4h, 6h, 8h, 12h, 18h, and 24h. The results showed that LUM-loaded CDs remained stable under both pH conditions. At pH 6.8, a complete release (~97 %) of LUM was observed within 24 h, whereas at pH 3.0, only 71 % of the drug was released within the same period. An initial burst release of approximately 30 % was noted within 2 h at both pH levels. However, a sustained release profile was evident at pH 6.8, indicating a controlled and prolonged release behaviour, which supports the hypothesis of LUM absorption predominantly occurring in the intestinal environment. The release from the CDs is driven by protonation-driven changes in drug carrier interactions. LUM, with a pKa of approximately 9.8 (tertiary amine). Is predominantly protonated at pH 3.0, enhancing electrostatic interactions with negatively charged functional groups (e. g., carboxyl) on CDs, reducing diffusion (71% release). At pH 6.8, closer to the pKa, LUM is less protonated, weakening these interactions and promoting a higher profile. We will revise the manuscript to include this explanation and the pKa correlation to strengthen the proposed mechanism.
Forced degradation study
Complete degradation research was carried out to find out LUM sensitivity to various stressors in order to estimate its stability during the formulation development process. The results of the study are shown in fig. 9, which offers crucial information for improving formulation stability by demonstrating the degree of decline against various environmental stresses. LUM’s susceptibility to protonation and hydrolysis in extremely acidic environments, as those seen during gastric transit, was shown by its notable degradation of 65.02% after being subjected to extremely acidic conditions (1N HCL) for a specific time. On the other hand, degradation was demonstrated by a pH-dependent stability profile that offers greater resistance at lower acid concentration. LUM degraded more moderately under alkaline settings, with slightly alkaline conditions (0.1 NaOH) indicating 9.83% degradation and significantly alkaline conditions (1N NaOH) showing 24.86% degradation. This indicates that LUM is more susceptible to breakdown at more alkalinities, most likely as a result of nucleophilic assault on its molecular structure, but remains rather stable at mild base exposure. Furthermore, 52.39% deterioration was caused by exposure to sunlight, demonstrating its vulnerability to photolytic stress; 27.59% degradation was caused by thermal stress at 60℃, indicating thermal instability that may impact storage conditions. LUMs sensitivity to oxidative damage was highlighted by the most significant deterioration, which reached 71.76% under oxidative conditions with hydrogen peroxide. This degradation may have been caused by the cleavage of its aromatic rings or side chains. The hydroxyl radical generates phenoxy radicals by removing hydrogen from aromatic rings, such as the 4-chlorophenyl or 2-trifluoromethylphenyl groups. Ring hydroxylation or cleavage results from additional oxidation of these radicals. The supported LC-MS mass spectrogram showed in the supplementary file fig. S3. The chromatogram of forced degradation of LUM is shown in the supplementary file fig. S4.
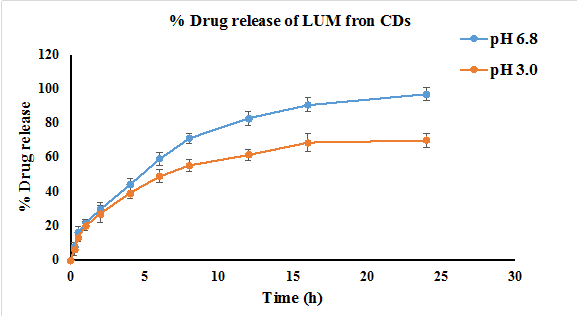
Fig. 7: An illustration of the % cumulative drug release of lumefantrine at pH 3.0 and pH 6.8 of lumefantrine from carbon dots (n =3)
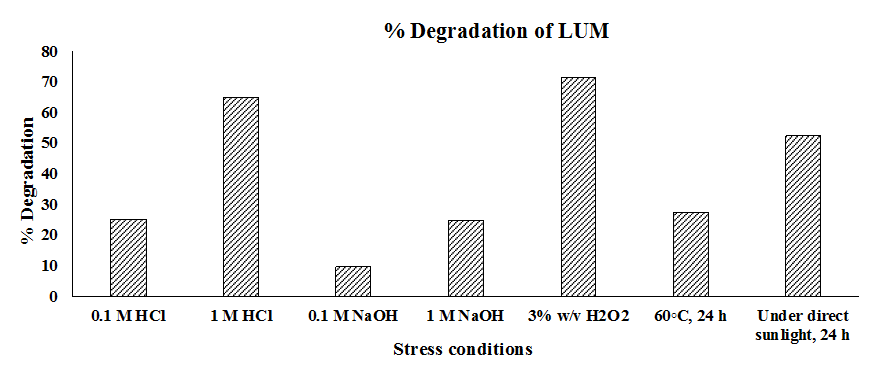
Fig. 8: Forced degradation study results for lumefantrine illustrated in a column chart that displays the percentage of degradation under each condition (Sample size n = 3)
Greenness of the analytical method
Green analytical chemistry (GAC) primary objective is to determine how analytical techniques affect the environment, worker safety, and human health, especially when procedures use organic solvents in the mobile phase, like RP-HPLC. There has been a significant increase in interest in GAC in recent years, which has made it feasible to use a variety of green assessment methods to evaluate the greenness of multiple analytical methods. These tools assist assess the environmental footprint of procedures, such as elements such as solvent usage, energy consumption and trash creation, therefore promoting safer and more sustainable laboratory practices.
A visual depiction, fig. 9, of the eco-friendliness of the created RP-HPLC technique for measuring the amount of LUM was created in this work using the AGREE (Analytical GREEnness) system. Although there is potential for improvement, the methods AGREE of 0.7, which was calculated from a 12-criteria assessment involving solvent toxicity, energy efficiency, and waste management, demonstrates that it is environmentally friendly. This grade highlights the methods compliance with GAC principles and shows a balanced approach to minimizing its ecological effect while preserving analytical performance. This tools us highlights the method decreased dependency on hazardous solvents and serves to lesson health hazards for lab workers, making it a more environmentally friendly option for LUM analysis. The Greenness report of AGREE analysis is mentioned in the supplementary file table S2.
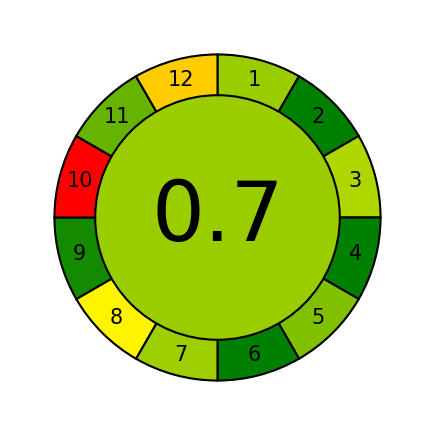
Fig. 9: Pictorial illustration showing the greenness of the analytical method
CONCLUSION
A three-level BBD was utilized to establish a reliable and powerful HPLC-PDA analytical technique for the estimation of LUM from its pharmaceutical formulations. As the information gathered clearly demonstrates, this DoE technique allowed a thorough knowledge of the interactions between independent variables on the results of chromatographic separation. In order to satisfy strict analytical specifications, the proposed model showed remarkable linearity across a specified concentration range, high precision with reliable repeat findings, and accuracy in retrieving known LUM concentrations. Additionally, the approach demonstrated selectivity, effectively distinguishing LUM from possible degradation products and formulation excipients, allowing interference-free analysis. The incorporation of CDs, which are zero-dimensional photoluminescent nanomaterials distinguished by their high drug entrapment effectiveness and tiny size (usually less than 10 nm), increased the method's effectiveness. One of CDs' main benefits is that it can enhance the dissolution and penetration of weakly soluble medications, such as LUM, significantly improving their bioavailability. To evaluate the in vitro drug release profile of CDs, determine the percentage of %LD and %EE, and modify the excipient ratio to get the highest %EE while guaranteeing the required drug release kinetics, the suggested HPLC-PDA technique was effectively employed. Furthermore, the technique demonstrated efficacy in assessing the proportion of LUM degradation under several stress scenarios, offering valuable perspectives on its stability during formulation and storage. The eco-friendly profile of the model-predicted approach is especially remarkable; it reduces solvent consumption as well as waste production, which is consistent with the principles of green analytical chemistry. To sum up, we have created and comprehensively verified an analytical method based on HPLC for the accurate measurement of LUM in its formulations. This approach is a useful tool for pharmaceutical development and quality control as it provides a flexible framework for evaluating drug loading, %EE, release patterns, and drug content in different LUM formulations.
ACKNOWLEDGMENT
Authors are also grateful to Manipal Academy of Higher Education, Manipal, Karnataka, for providing the facilities. The authors are thankful for Biorender. com, a figure-making tool.
FUNDING
Nil
AUTHORS CONTRIBUTIONS
All authors contributed to the study conception and design. Raksha and Ashutosh Gupta carried out the experimental work, data analysis, and paper drafting. Moumita Saha was involved in the experimental work on HPLC method optimization, DoE analysis, and data interpretation. Aditya Dev Rajora, Sudheer Moorkoth and Abhay Bhardwaj supervised the experimental work, data analysis, resources, and paper review. All authors have contributed significantly to the research in the manuscript, approved its claims, and agreed to be an author.
CONFLICT OF INTERESTS
The authors state that the manuscript does not include any conflicts of interest.
REFERENCES
World Health Organization (WHO) guidelines: WHO. WHO guidelines for malaria. Geneva: World Health Organization; 2025 Aug 13. doi: 10.2471/B09514.
Talapko J, Skrlec I, Alebic T, Jukic M, Vcev A. Malaria: the past and the present. Microorganisms. 2019;7(6):179. doi: 10.3390/microorganisms7060179, PMID 31234443.
Tuteja R. Malaria an overview. FEBS Journal. 2007;274(18):4670-9. doi: 10.1111/j.1742-4658.2007.05997.x, PMID 17824953.
Tse EG, Korsik M, Todd MH. The past present and future of anti-malarial medicines. Malar J. 2019;18(1):93. doi: 10.1186/s12936-019-2724-z, PMID 30902052.
Memvanga PB, Nkanga CI. Liposomes for malaria management: the evolution from 1980 to 2020. Malar J. 2021;20(1):327. doi: 10.1186/s12936-021-03858-0, PMID 34315484.
Rajora AD, Bal T, Gupta A. Chapter Five. Properties and characterization of eco-friendly carbon dots. In: Hussain CM, Hussain GN, editors. Ecofriendly carbon dots in analytical chemistry: sustainable materials for separation, detection and imaging. Elsevier; 2025. p. 110-21. doi: 10.1016/bs.coac.2024.09.003.
Gupta A, Rajora AD, Bal T. Chapter One. Eco-friendly carbon dots: new prospects in analytical chemistry. In: Hussain CM, Hussain GN, editors. Ecofriendly carbon dots in analytical chemistry: sustainable materials for separation, detection and imaging. Elsevier; 2025. p. 1-22. doi: 10.1016/bs.coac.2024.09.001.
Gupta A, Rajora AD, Bal T. Chapter Ten-Eco-friendly carbon dots in hydrogels and their applications. In: Ecofriendly carbon dots in analytical chemistry: sustainable materials for separation, detection and imaging. Vol. 108 of Comprehensive Analytical Chemistry. Elsevier; 2025. p. 230–47. doi: 10.1016/bs.coac.2024.09.005.
Gopireddy RR, Maruthapillai A, Devikala S, Tamilselvi M, Selvi JA, Mahapatra S. DoE approach: a validated stability indicating RP-HPLC method development for the separation of diasteromeric analogs and process impurities of carfilzomib. Mater Today Proc. 2019;14:514-31. doi: 10.1016/j.matpr.2019.04.174.
Gupta A, Kossambe RV, Moorkoth S. Box-behnken design assisted eco-friendly RP-HPLC-PDA method for the quantification of paclitaxel: application to evaluate the solubility of paclitaxel-cyclodextrin complex. Int J Appl Pharm. 2024;16(6):305-15. doi: 10.22159/ijap.2024v16i6.51690.
Tome T, Zigart N, Casar Z, Obreza A. Development and optimization of liquid chromatography analytical methods by using AQbD principles: overview and recent advances. Org Process Res Dev. 2019;23(9):1784-802. doi: 10.1021/acs.oprd.9b00238.
Gupta A, P, Moorkoth S, Dhas N. Central composite design aided optimization and validation of developed an eco-friendly HPLC method for the quantification of lenalidomide loaded mesoporous silica nanoparticles. J Appl Pharm Sci. 2024;15:89-101. doi: 10.7324/JAPS.2024.189998.
Gupta A, Mutalik S, Navti PD, Saha M, Moorkoth S, Shetty S. Box-behnken guided development of an ecofriendly RP-HPLC analytical method for simultaneous quantification of pantoprazole sodium and piperine co-loaded mucoadhesive GRDDS formulation for H. pylori eradication. J Appl Pharm Sci. 2024;14(9):98–110. doi: 10.7324/JAPS.2024.179147.
Sarısaltık Yasın D, Arslanturk Bingul A, Karakucuk A, Teksin ZS. Development and validation of an HPLC method using an experimental design for analysis of amlodipine besylate and enalapril maleate in a fixed-dose combination. Turk J Pharm Sci. 2021;18(3):306-18. doi: 10.4274/tjps.galenos.2020.89725, PMID 34157820.
Tomikj M, Bozinovska M, Anevska Stojanovska N, Lazova J, Acevska J, Brezovska K. Sustainable and white HPLC method for simultaneous determination of amlodipine and Atorvastatin in film-coated tablet. Green Anal Chem. 2024;8:100103. doi: 10.1016/j.greeac.2024.100103.
Gupta A, Rachana SP, Moorkoth S, Dhas N. Quality by design-based eco-friendly HPLC analytical method for simultaneous quantification of erastin and lenalidomide in mesoporous silica nanoparticles. Sci Rep. 2025;15(1):8873. doi: 10.1038/s41598-025-93331-8, PMID 40087405.
Mutalik SP, Mullick P, Pandey A, Kulkarni SS, Mutalik S. Box–behnken design aided optimization and validation of developed reverse phase HPLC analytical method for simultaneous quantification of dolutegravir sodium and lamivudine co-loaded in nano-liposomes. J Sep Sci. 2021;44(15):2917-31. doi: 10.1002/jssc.202100152, PMID 34076952.
Naik S, Mullick P, Mutalik SP, Hegde AR, Lewis SA, Bhat K. Full factorial design for development and validation of a stability-indicating RP-HPLC method for the estimation of timolol maleate in surfactant-based elastic nano-vesicular systems. J Chromatogr Sci. 2022;60(6):584-94. doi: 10.1093/chromsci/bmab101, PMID 34435614.
U.S. Food and Drug Administration (FDA) guidance document: U.S. Food and Drug Administration. Q2(R1) Validation of Analytical Procedures: Text and Methodology Guidance for Industry. Silver Spring (MD): FDA; 2021 Sep 16. Available from: https://www.fda.gov/regulatory-information/search-fda-guidancedocuments/q2r1-validation-analytical-procedures-text-and-methodology-guidance-industry. [Last accessed on 05 Mar 2025].
Gupta A, Navti PD, Mutalik S, Saha M, Moorkoth S. DoE guided development of an HPLC method for evaluation of amoxicillin and metronidazole co-loaded mucoadhesive GRDDS formulation for H. pylori eradication. Chromatographia. 2023;86(11-12):729-42. doi: 10.1007/s10337-023-04290-z.
Saha M, Gupta A, Shetty S, Mutalik S, Nandakumar K, Raghu Chandrashekar H. DoE-aided optimization of RP-HPLC method for simultaneous estimation of amoxicillin and tinidazole loaded mucoadhesive GRDDS formulation for the treatment of H. pylori. Chromatographia. 2024;87(9):533-48. doi: 10.1007/s10337-024-04346-8.
Pena Pereira F, Wojnowski W, Tobiszewski M. AGREE-analytical GREEnness metric approach and software. Anal Chem. 2020;92(14):10076-82. doi: 10.1021/acs.analchem.0c01887, PMID 32538619.
Shakeel K, Raisuddin S, Ali S, Imam SS, Rahman MA, Jain GK. Development and in vitro/in vivo evaluation of artemether and lumefantrine co-loaded nanoliposomes for parenteral delivery. J Liposome Res. 2019;29(1):35-43. doi: 10.1080/08982104.2017.1410173, PMID 29179636.