
Int J App Pharm, Vol 17, Issue 5, 2025, 488-498Original Article
ENHANCED BIOAVAILABILITY OF LOBEGLITAZONE VIA DISSOLVING MICRONEEDLE PATCHES IN RATS
SUKANTA ROY1*, BALARAM GHOSH2, ANANYA CHANDRA3, DIBYA DAS4, PARAG GHOSH1, SANGEETA CHOUDHURY5, ANIRBANDEEP BOSE6, SUBAS CHANDRA DINDA1
1Department of Pharmaceutics, School of Pharmacy, The Neotia University, Jhinger Pole, Diamond Harbour Rd, Sarisha, Jhinga, West Bengal-743368, India. 2Department of Pharmacology, Medinipur Medical College and Hospital, Vidyasagar Rd, Midnapore, West Bengal-721101, India. 3Guru Nanak Institute of Pharmaceutical Science and Technology, 157/F, Nilgunj Rd, Sahid Colony, Panihati, Khardaha, West Bengal-700114, India. 4Department of Pharmaceutical Technology, JIS University, Kolkata, India. 5Pulse Pharmaceuticals Pvt. Ltd. Plot No. 18/1, Sector-III, HUDA Techno Enclave, HITEC City, Hyderabad, Telangana-500081, India. 6BCDA College of Pharmacy and Technology, Hridaypur, Barasat, Kolkata, West Bengal, India
*Corresponding author: Subas Chandra Dinda; *Email: subaschandra.dinda@tnu.in
Received: 30 Apr 2025, Revised and Accepted: 09 Jul 2025
ABSTRACT
Objective: To compare the pharmacokinetics of lobeglitazone administered via oral suspension and transdermal dissolving microneedle array (DMNA) patch in rats using a validated LC-MS/MS method.
Methods: Male Wistar rats were administered a single 0.5 mg/kg dose of lobeglitazone either orally or via a DMNA patch. Plasma samples were collected at predefined intervals up to 48 h. Lobeglitazone concentrations were analyzed using a validated LC-MS/MS method. Pharmacokinetic parameters, including Cmax, Tmax, AUC₀–t, AUC₀–∞, elimination rate constant (Kel), and half-life (T₁/₂) were calculated and statistically compared between the groups.
Results: Oral administration resulted in a higher Cmax (1786.25 ± 66.68 ng/ml) and a shorter Tmax (2.67 ± 0.52 h), while DMNA delivery produced a lower Cmax (1207.69 ± 25.70 ng/ml) and a delayed Tmax (5.33 ± 1.03 h). However, systemic exposure was significantly higher in the DMNA group (AUC₀–∞: 24,250.57 ± 650.92 ng·h/ml) compared to the oral group (12,036.84 ± 860.47 ng·h/ml; p < 0.00001). The DMNA group also exhibited an extended half-life (10.13 ± 0.34 h) relative to oral administration (4.85 ± 0.60 h). The calculated relative bioavailability of the DMNA formulation was 201.47%, indicating enhanced systemic exposure.
Conclusion: Transdermal DMNA delivery of lobeglitazone significantly enhances bioavailability and prolongs systemic retention compared to oral administration. These findings suggest that DMNA patches represent a promising, patient-friendly alternative for the sustained delivery of lobeglitazone in the chronic management of type 2 diabetes mellitus.
Keywords: Lobeglitazone, Dissolving microneedles, Pharmacokinetics, Transdermal delivery, LC-MS/MS, Type 2 diabetes
© 2025 The Authors. Published by Innovare Academic Sciences Pvt Ltd. This is an open access article under the CC BY license (https://creativecommons.org/licenses/by/4.0/)
DOI: https://dx.doi.org/10.22159/ijap.2025v17i5.54818 Journal homepage: https://innovareacademics.in/journals/index.php/ijap
INTRODUCTION
Type 2 diabetes mellitus (T2DM) is a progressive metabolic disorder characterized by insulin resistance, β-cell dysfunction, and chronic hyperglycemia, posing a significant global health burden [1-3]. Among the therapeutic targets, peroxisome proliferator-activated receptor gamma (PPAR-γ) agonists have demonstrated potent insulin-sensitizing effects. Lobeglitazone, a novel thiazolidinedione derivative, exhibits high PPAR-γ affinity, offering improved glycemic control at lower doses compared to its predecessors, thus minimizing the adverse cardiovascular outcomes often associated with the class [4-8].
Despite the clinical promise of oral lobeglitazone, its systemic bioavailability is subject to first-pass hepatic metabolism, fluctuating plasma concentrations, and patient non-compliance associated with chronic oral therapy at lower dose [9-12]. To overcome these limitations, transdermal drug delivery systems, particularly dissolving microneedle (DMN) arrays, have gained significant interest. DMNs can bypass hepatic first-pass metabolism, provide controlled release, improve pharmacokinetics, and enhance patient compliance through minimally invasive, pain-free administration [13].
Advancements in microneedle technology have allowed for the formulation of dissolving polymer-based patches capable of delivering therapeutic agents intradermally. Unlike conventional oral routes, microneedle-mediated delivery ensures direct absorption into systemic circulation via dermal capillaries, offering a promising alternative for drugs like lobeglitazone, where maintaining consistent plasma levels is critical for therapeutic efficacy [14-16].
While several pharmacokinetic studies have characterized oral lobeglitazone administration, the comparative pharmacokinetic behavior of lobeglitazone when delivered via a transdermal dissolving microneedle platform remains unexplored. Such an investigation is pivotal to ascertain the feasibility of microneedle patches as a next-generation delivery modality for lobeglitazone, particularly in the context of chronic diabetes management [17-20].
In this study, we aimed to perform a detailed comparative pharmacokinetic evaluation between oral lobeglitazone administration (0.5 mg/kg) and a transdermal dissolving microneedle patch delivering an equivalent dose (0.5 mg/kg) in a rat model. Plasma concentrations of lobeglitazone were quantitatively analyzed using a validated liquid chromatography-tandem mass spectrometry (LC-MS/MS) method, characterized by high sensitivity, selectivity, and reproducibility. Pharmacokinetic parameters, including Cmax, Tmax, AUC, and half-life (T1/2), were calculated to assess differences in absorption kinetics, bioavailability, and systemic exposure between the two routes of administration [17, 18].
This comparative analysis is expected to provide foundational pharmacokinetic insights into the potential advantages of transdermal dissolving microneedle systems over traditional oral dosing for lobeglitazone, thereby advancing the prospects of patient-centric, non-invasive, and controlled delivery platforms in diabetes therapeutics.
MATERIALS AND METHODS
Chemicals and reagents
Lobeglitazone (>98% purity) was provided by Akums Drugs and Pharmaceuticals Ltd. and Pioglitazone (internal standard, IS) were obtained from Shubham Bio Pharma certified sources. Acetonitrile (HPLC grade), formic acid, and LC-MS grade water were purchased from J. T. Baker (USA) and Merck (Germany). Blank heparinized rat plasma was procured from healthy male Wistar rats. Dissolving microneedle patches containing lobeglitazone were fabricated by micromolding technique using pharmaceutical-grade polymers like Hyaluronic acid and Polyvinylpyrrolidone K-90 (PVP K-90) and evaluated for dose uniformity. Prior to initiating the study, ethical approval was obtained from the Institutional Animal Ethics Committee (IAEC) under the protocol number PK (R) DMNA 093 dated 01.08.2022 from IAEC Registration No. 1938/PO/Rc/S/17/CPCSEA, in compliance with the CPCSEA guidelines.
LC-MS/MS analytical conditions
Quantitative analysis of lobeglitazone was performed using an AB Sciex, Triple Quad-4500 system coupled with a triple quadrupole mass spectrometer equipped with an electrospray ionization (ESI) source operated in positive mode summarized in table 1. Calibration curves were linear over the range of 0.200–101,788 ng/ml (r² > 0.999). Quality control samples at low, medium, and high concentrations were included to verify accuracy and precision throughout the analysis [17].
Table 1: Chromatographic parameters
| Chromatographic conditions | |
| Column | Thermo Scientific, Hyersil Gold, 50*4.6 mm,5µm |
| Mobile phase | Acetonitrile: 2 mmol Ammonium Acetate Containing 0.2% Formic Acid: (70:30). |
| Flow rate | 0.6 ml/min |
| Column temperature | 30 °C |
| MS/MS | Triple Quad-4500 |
| Make | Sciex |
| HPLC | Shimadzu LC-20AD |
| Auto sampler | SIL-HTC |
| Ionization Mode | Electro Spray Ionization |
| Detection Mode | MRM (Positive Mode) |
Bioanalytical method validation
The developed LC-MS/MS method for the quantification of lobeglitazone in rat plasma was validated following regulatory guidelines. Validation parameters included selectivity, linearity, precision, accuracy, dilution integrity, matrix effect, recovery, and stability assessments [21, 22].
Selectivity
Selectivity was evaluated by analyzing six different lots of blank rat plasma to confirm the absence of significant interference at the retention times of the analyte and the internal standard (IS). Plasma samples analyzed included matrix blanks, zero samples (blank plus IS), and LLOQ samples. Acceptance criteria required that the area response at the analyte’s retention time in matrix blanks be less than 20% of the area response at LLOQ, and for the internal standard, less than 5% of the average IS response in the LLOQ samples. Signal-to-noise (S/N) ratio for LLOQ samples was required to be greater than 5.
Linearity
The linearity of the method was assessed by analyzing calibration standards over the concentration range of 0.200 to 101.788 ng/ml. Calibration curves were generated by plotting the analyte to internal standard peak area ratios versus nominal analyte concentrations, using a weighted (1/x²) linear regression model. A minimum of six non-zero calibration points was required. Acceptance criteria included a correlation coefficient (r2) ≥0.999 and back-calculated concentrations of standards within ±15% of their nominal concentrations, except for the LLOQ, which was within ±20%.
Precision, accuracy, and dilution integrity
Precision and accuracy were evaluated at four QC levels: LLOQ QC, low QC (LQC), middle QC (MQC), and high QC (HQC), each analyzed in six replicates. Intra-day and inter-day precision were assessed by calculating the coefficient of variation (%CV) across replicate analyses. Accuracy was determined by comparing back-calculated concentrations to their nominal values. Acceptance criteria required that the %CV be ≤15% for all QC levels, except for LLOQ QC, where ≤20% was acceptable. The mean accuracy at each level was required to be within ±15% of the nominal value (±20% for LLOQ). Dilution integrity was assessed by preparing samples at concentrations above the calibration range, diluting them appropriately with blank plasma, and analyzing them to confirm acceptable precision and accuracy.
Matrix effect and recovery
Matrix effect was evaluated by comparing the peak responses of post-extracted plasma samples spiked with analyte to those of neat standard solutions at equivalent concentrations at LQC and HQC levels. The internal standard normalized matrix factor was calculated, and the %CV across different plasma lots was required to be ≤15%. Recovery was determined by comparing the peak areas of analyte spiked before extraction to those spiked after extraction at LQC, MQC, and HQC levels. Consistent and reproducible recovery across the concentration range was required, with an acceptable %CV for recovery values within 15% [20].
Stability
Stability of lobeglitazone was assessed under bench-top stability QC samples were kept at room temperature for 24 h before analysis. Stability was evaluated by comparing the measured concentrations to freshly prepared calibration standards. Acceptance criteria required that a minimum of 67% of stability QC samples and 50% at each QC level should be within ±15% of their nominal concentrations. Additionally, the mean % change between stability and comparison samples had to be within ±15%, with %CV also ≤15% at each level.
Animal study design
Male Wistar rats (200–220 g) were housed under controlled conditions (22 ± 2 °C; 55% ± 10% RH; 12 h light/dark cycle) with ad libitum access to food and water. Institutional Animal Ethics Committee (IAEC) under the protocol number and PKPD(Rat) DMNA0159 from IAEC Registration No. 1938/PO/Rc/S/17/CPCSEA, in compliance with the CPCSEA guidelines. Rats were randomized into two groups (n = 6 per group): Oral Group: Received a single oral suspension of lobeglitazone (0.5 mg/kg) in purified water. Transdermal Group: Received a dissolving microneedle patch delivering lobeglitazone (0.5 mg/kg) applied to the dorsal skin. Prior to patch application, hair was removed from the dorsal area using a depilatory cream. Microneedle patches were applied with gentle manual pressure for 2 min and retained in place for 30 min to ensure complete dissolution.
Blood sampling
Serial blood samples (~250 µl) were collected via retro-orbital puncture at pre-dose (0 h) and post-dose at 0.25, 0.5, 1, 2, 3, 4, 6, 8, 12, 24, 36, and 48 h. Plasma was separated by centrifugation (4000 rpm, 10 min) and stored at −80 °C until analysis.
Plasma sample preparation
Liquid-liquid extraction (LLE) was selected as the plasma sample preparation technique for the quantification of lobeglitazone in rat plasma. LLE offers several advantages, including higher analyte recovery, reduced matrix effects, and cleaner extracts compared to protein precipitation methods. These features are particularly important for achieving the sensitivity and specificity required for low-concentration analytes like lobeglitazone. Therefore, LLE was considered the most suitable method to ensure accurate and reproducible results in this pharmacokinetic study.
An aliquot of 200 µl* plasma sample was taken and added 50µl* of internal standard dilution solution and vortex to mix, except in blank sample in which 50 µl* of diluent was added. Added 2.000 ml of Tert Butyl Methyl Ether and cap all samples. Vortexed all the samples on a multitube vortexer for 10 min at 2500 rpm. Kept all samples for Centrifugation for 5 min at 4.0℃ and 4500 rpm in a refrigerated centrifuge. Transfer about 1.600 ml Supernatant in to pre-labelled ria vials. Kept the samples for drying in Nitrogen Evaporator at 40 °C till the dryness. Reconstitute all the samples with 1.000 ml of Mobile phase and vortex for few seconds. Transferred the samples into pre labelled autosampler vials.
Pharmacokinetic and statistical analysis
Pharmacokinetic parameters were calculated using a non-compartmental model (Phoenix WinNonlin, Certara, USA). The following parameters were estimated: maximum plasma concentration (Cmax), time to Cmax (Tmax), area under the concentration-time curve from time zero to the last measurable concentration (AUC0–t), extrapolated area under the curve (AUC0–∞), terminal half-life (T₁/₂), and Elimination Constant (kel). All results are expressed as mean ± standard deviation (SD). Comparative pharmacokinetic profiles between the oral and transdermal groups were analyzed descriptively.
RESULTS AND DISCUSSION
Method development
Method development and optimization
A sensitive and robust LC-MS/MS method was developed and optimized for the quantification of lobeglitazone in rat plasma using pioglitazone as an internal standard. The biological matrix consisted of rat plasma collected with K₂EDTA as an anticoagulant, sourced from Precision Labs. The analytical technique employed was liquid chromatography coupled with tandem mass spectrometry (LC-MS/MS) using a Sciex Triple Quad 4500 system, operated under positive ionization mode with multiple reaction monitoring (MRM). Analyst software version 1.7.3 was used for instrument control and data processing. The method utilized a peak area ratio for quantitation with a weighting factor of 1/x² to ensure linearity across the calibration range. Chromatographic separation was achieved on a Thermo Scientific Hypersil GOLD C18 column (50×4.6 mm, 5 µm particle size) maintained at ambient temperature. The mobile phase consisted of acetonitrile and 2 mM ammonium acetate containing 0.2% formic acid in a 70:30 (v/v) ratio. The system was operated at a flow rate of 0.600 mL/min. Sample preparation involved a liquid-liquid extraction (LLE) method, which provided clean extracts and improved sensitivity. A plasma volume of 200 µl was processed for each sample. Following extraction, the samples were reconstituted and injected into the LC-MS/MS system for analysis. The MRM transitions selected were m/z 482 → 258 for lobeglitazone and m/z 357.1 → 134.1 for pioglitazone, shown in fig. 1, ensuring high specificity and sensitivity. The calibration curve for lobeglitazone was established over a concentration range of 0.200 to 101.788 ng/ml and demonstrated excellent linearity with correlation coefficients (r²) consistently above 0.999 shown in fig. 2. The optimized method provided robust performance, allowing for the reliable quantification of lobeglitazone in rat plasma samples following oral and transdermal administration.
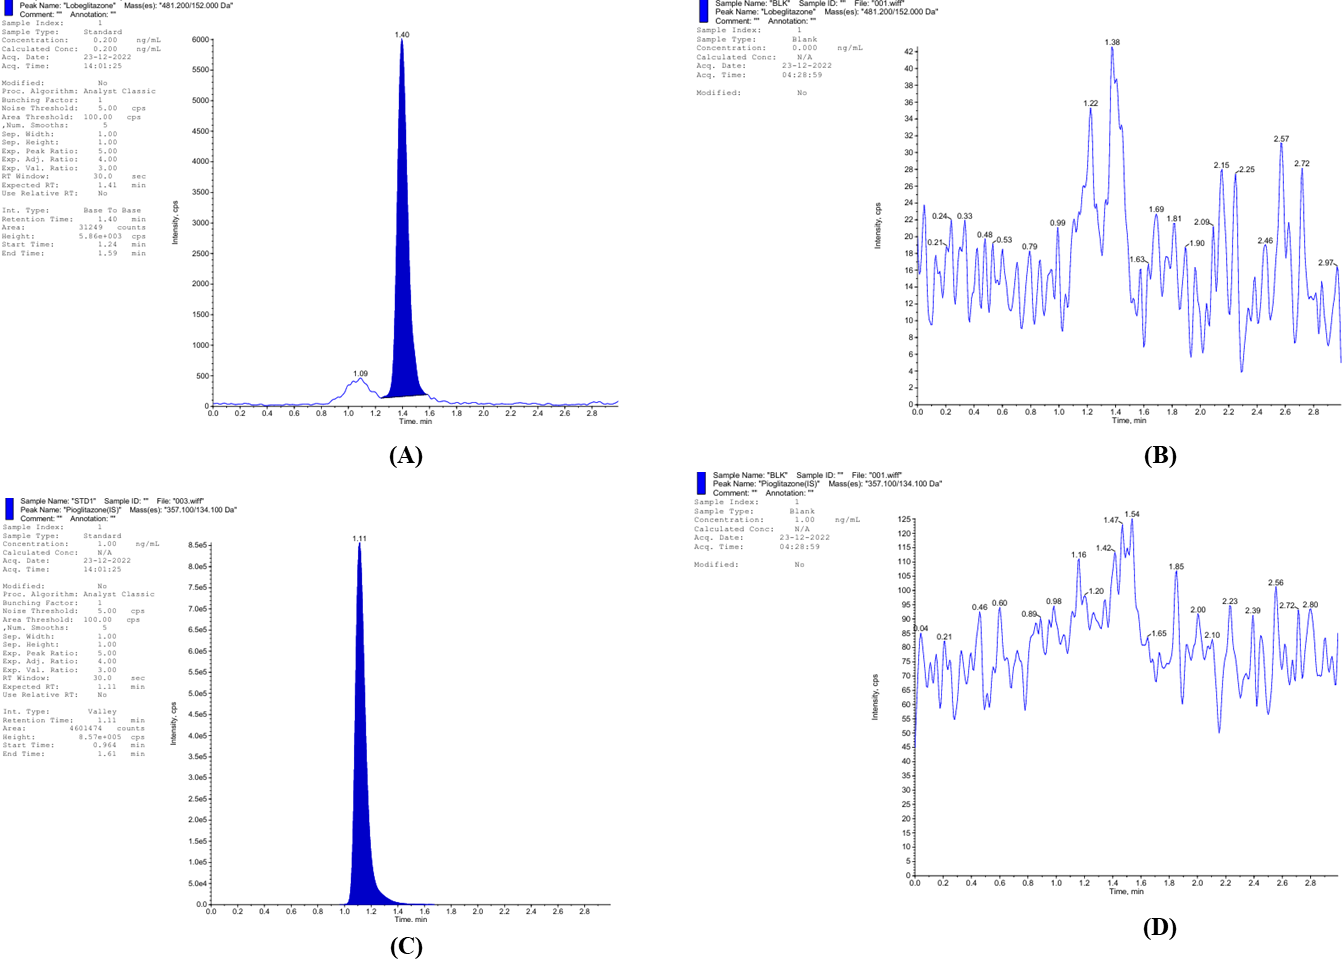
Fig. 1: MS2 Scan of (A) Lobeglitazone MRM transitions m/z 482 → 258, (B) Blank Plasma with Lobeglitazone, (C) Pioglitazone (IS) m/z 357.1 → 134.1, (D) Blank plasma with pioglitazone
Method validation
The bioanalytical method validation was performed for the quantification of lobeglitazone in rat plasma using LC-MS/MS, following regulatory guidelines.
Selectivity and sensitivity
The criteria were evaluated as part of the method validation. The area response of interfering peaks at the analyte’s retention time in matrix blank samples was required to be less than 20% of the analyte peak area in the LLOQ sample processed in the respective blank matrix, while the area response of interfering peaks at the internal standard’s retention time was required to be less than 5% of the internal standard peak area response at LLOQ. The signal-to-noise (S/N) ratio for the LLOQ sample was mandated to be greater than 5. All matrix blanks (100%) were expected to meet these acceptance criteria. In addition, a minimum of 67% of LLOQ samples had to be within ±20% accuracy of their respective nominal concentrations, including at least one LLOQ sample from haemolysed and lipemic plasma lots. The mean % nominal value for the LLOQ should be within ±20% of its nominal concentration, and the coefficient of variation (CV) for the back-calculated LLOQ concentration should not exceed 20%. Furthermore, a minimum of 67% of bracketing quality control (QC) samples had to fall within ±15% accuracy of their respective nominal concentrations, and at least 50% of QC samples at each concentration level were required to meet the ±15% accuracy criterion. Selectivity was confirmed, with no significant interference observed at the retention times of the analyte (≤0.00%) and internal standard (≤0.04%) across six different blank plasma lots (table 2).
Autosampler carryover
Carryover was assessed during method validation to ensure reliability of the assay. For the analyte, the carryover observed after injection of the highest standard should not exceed 20.00% of the area response of the analyte in the extracted LLOQ sample. For the internal standard (ISTD), the carryover should not exceed 5.00% of the area response of the internal standard in the extracted LLOQ sample. The study shows negligible, with no detectable interference at the analyte and IS retention times after injection of the highest standard (≤0.00% and ≤0.01%, respectively) (table 3).
Sensitivity
Sensitivity and LLOQ performance were evaluated as part of the method validation criteria. A minimum of 50% of LLOQ samples was required to be within ±20% accuracy of their respective nominal concentrations. Additionally, the coefficient of variation (CV) of the back-calculated LLOQ concentrations was required to be ≤20%, and the mean % nominal value had to be within ±20% of the nominal concentration. Furthermore, the signal-to-noise (S/N) ratio for the LLOQ samples was mandated to be greater than 5 to ensure sufficient assay sensitivity. It was established with a lower limit of quantitation (LLOQ) at 0.200 ng/ml, demonstrating a coefficient of variation (CV) of 1.62% and a mean accuracy of 94.583% (table 4).
Table 2: Selectivity
| Blank matrix ID | Interfering peak area response at Analyte RT in Blank | Analyte area response in LLOQ | S/N ratio | Area response of interfering peak at IS RT in Blank | IS area response in LLOQ | % Interference at analyte RT |
% Interference at IS RT |
Back calculated Conc. (ng/ml) | % Accuracy |
| PL\893\0522 | 0 | 5395 | 217.804 | 0 | 2175134 | 0.00 | 0.00 | 0.194 | 97.079 |
| PL\1457\1122 | 0 | 5325 | 175.911 | 0 | 2196344 | 0.00 | 0.00 | 0.189 | 94.695 |
| PL\1498\1122 | 0 | 5439 | 203.743 | 0 | 2213396 | 0.00 | 0.00 | 0.192 | 96.092 |
| PL\1499\1122 | 0 | 5575 | 209.608 | 0 | 2191143 | 0.00 | 0.00 | 0.200 | 99.795 |
| PL\1500\1122 | 0 | 2380 | 83.767 | 0 | 999256 | 0.00 | 0.00 | 0.186 | 92.873 |
| PL\1505\1122 | 0 | 1134 | 65.063 | 0 | 523762 | 0.00 | 0.00 | 0.167 | 83.692 |
| PL\1388\1022 (HAE) | 0 | 1466 | 45.826 | 0 | 661980 | 0.00 | 0.00 | 0.172 | 85.790 |
| PL\1389\1022 (HAE) | 0 | 2387 | 117.700 | 0 | 1089308 | 0.00 | 0.00 | 0.170 | 84.769 |
| PL\1390\1022 (LIP) | 0 | 1068 | 51.561 | 216 | 493194 | 0.00 | 0.04 | 0.167 | 83.673 |
| PL\1391\1022 (LIP) | 0 | 1151 | 49.410 | 0 | 489727 | 0.00 | 0.00 | 0.183 | 91.538 |
| N | 10 | 10 | |||||||
| Mean | 0.1820 | 90.9996 | |||||||
| SD | 0.01215 | 6.06215 | |||||||
| %CV | 6.67 | 6.66 |
Abbreviations: ID – Identification, RT – Retention Time, LLOQ – Lower Limit of Quantification, S/N Ratio – Signal-to-Noise Ratio, IS – Internal Standard, % Interference – Percentage Interference, Back Calculated Conc. (ng/ml) – Back Calculated Concentration in nanograms per milliliter, % Accuracy – Percentage Accuracy, SD – Standard Deviation, %CV – Coefficient of Variation, HAE – Hemolyzed Aqueous Extract, LIP – Lipemic Sample.
Table 3: Autosampler carryover test
| Sample ID | Analyte area response | Internal standard area response | % Carry over at analyte RT | % Carry over at IS RT |
| Blank | 0 | 162 | 0.00 | 0.01 |
| STD1 (LLOQ) | 3556 | 1649343 | NA | NA |
| STD8 (ULOQ) | 1950533 | 1533254 | NA | NA |
| BLANK | 0 | 392 | NA | NA |
| BLANK | 0 | 430 | NA | NA |
| Carry over in Ist blank | 0 | 230 | 0.00 | 0.01 |
| Carry over in IInd blank | 0 | 268 | 0.00 | 0.02 |
Abbreviations: Sample ID – Sample Identification, Analyte – Analyzed Substance, Area Response – Detector Response for Analyte, Internal Standard Area Response – Detector Response for Internal Standard, % Carry over at analyte RT – Percentage Carryover at Analyte Retention Time, % Carry over at IS RT – Percentage Carryover at Internal Standard Retention Time, LLOQ – Lower Limit of Quantification, ULOQ – Upper Limit of Quantification, NA – Not Applicable, RT – Retention Time, IS – Internal Standard.
Linearity
Calibration curve acceptance criteria were established to ensure method accuracy and reliability. The correlation coefficient (r) of the calibration curve was required to be ≥0.99. The area response observed at the retention time of the analyte in blank and STD0 samples had to be less than 20% of the area response of the STD1 sample, while the area response at the internal standard's retention time in blank samples had to be less than 5% of the average internal standard response of accepted calibration standards and quality control samples. The percentage nominal values of the calibration standards were required to be within ±15% of their respective nominal concentrations, except for STD1 (LLOQ), which was allowed within ±20%. At least 75% of the calibration standards had to meet the acceptance criteria for curve evaluation, and both the lowest and highest standards were required to be acceptable to validate the calibration curve. Two consecutive calibration standards were not permitted to be excluded from the curve, and in the case of exclusion, standards with the greatest deviation were to be excluded first, considering the acceptance criteria from STD1 to STD8/STD9. If any calibration standard did not meet its acceptance limits, it was excluded, and the calibration curve was re-evaluated without it. Furthermore, the %CV of all acceptable calibration standards was required to be<15%, except for STD1, where it was allowed up to 20%, and the mean % nominal for all acceptable calibration standards had to be within ±15% of the nominal value, except for STD1, which had a limit of ±20%. The study shows excellent linerity across the calibration range of 0.200–101.788 ng/ml, with a correlation coefficient (r) ≥ 0.999 (fig. 2). The percentage nominal values for the calibration standards ranged from 96.191% to 102.515% (table 5 and 6).
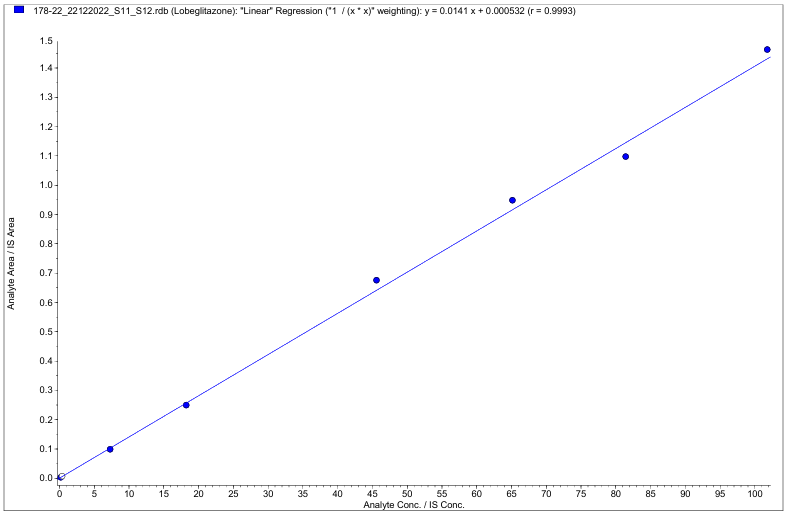
Fig. 2: Liner curve of lobeglitazone between the calibration range of 0.200–101.788 ng/ml (r2≤0.999)
Precision and accuracy
Accuracy and precision acceptance criteria for quality control (QC) samples were established to ensure assay reproducibility. A minimum of 67% of QC samples across all levels was required to be within ±15% of their respective nominal concentrations, except for LLOQ QC samples, where an acceptance limit of ±20% was applied. Additionally, at least 50% of QC samples at each concentration level had to meet the same accuracy criteria, with ±15% for regular QCs and ±20% for LLOQ QCs. The coefficient of variation (%CV) for QC samples at each level was required to be ≤15%, except for LLOQ QC samples, where a %CV of ≤20% was acceptable. Furthermore, the mean % nominal value of analyzed QC samples at each level was required to be within ±15% of the nominal concentration, except for the LLOQ QC samples, where the limit was set at ±20%. The results demonstrated acceptable intra-and inter-batch variability. The QC samples showed CVs between 1.06% and 6.78% and accuracy values between 87.235% and 101.146% across low, medium, and high QC levels (table 7).
Table 4: Within-run sensitivity
| LLOQ (ng/ml) | |||
| Nominal conc. | 0.200 | ||
| Range | 0.160 | 0.240 | |
| Result table ID | Conc. found | % Nominal | S/N ratio |
| PMV_20122022_PA01_SEN_01 | 0.186 | 93.126 | 129.836 |
| 0.187 | 93.591 | 192.118 | |
| 0.194 | 97.194 | 222.831 | |
| 0.190 | 95.050 | 189.121 | |
| 0.191 | 95.307 | 255.052 | |
| 0.187 | 93.744 | 272.610 | |
| N | 6 | ||
| Mean | 0.1892 | ||
| SD | 0.00306 | ||
| %CV | 1.62 | ||
| %Nominal | 94.583 |
Abbreviations: ID–Identification, LLOQ (ng/ml) – Lower Limit of Quantification (nanograms per milliliter), Nominal Conc. – Nominal Concentration, Conc. Found – Concentration Found, % Nominal – Percentage of Nominal Concentration, S/N Ratio – Signal-to-Noise Ratio, N – Number of Replicates, mean – Arithmetic Mean, SD – Standard Deviation, %CV – Coefficient of Variation (expressed as a percentage).
Table 5: Summary of calibration curve parameters
| Result table ID | Slope | Y-Intercept | Correlation coefficient (r) |
| PMV_21122022_SEL | 0.0118 | 0.000198 | 0.9995 |
| PMV_20122022_PA01_SEN01 | 0.0124 | 0.0000407 | 0.9995 |
| NA | 2 | 2 | 2 |
| Minimum | 0.01 | 0.00004 | 0.9995 |
| Maximum | 0.0124 | 0.000198 | 0.9995 |
Abbreviations: Result table ID – Result table Identification, Slope – Calibration Curve Slope, Y-Intercept – Intercept on the Y-Axis of the Calibration Curve, Correlation Coefficient (r) – Statistical Measure of Linearity (r-value), NA – Not Applicable.
Table 6: Concentration summary of calibration standards
| Calibration standards | STD1 | STD2 | STD3 | STD4 | STD5 | STD6 | STD7 | STD8 |
| Nominal Conc.(ng/ml) | 0.200 | 0.400 | 7.296 | 18.240 | 45.601 | 65.144 | 81.431 | 101.788 |
| Range(ng/ml) | 0.160 | 0.340 | 6.202 | 15.504 | 38.761 | 55.372 | 69.216 | 86.520 |
| 0.240 | 0.460 | 8.390 | 20.976 | 52.441 | 74.916 | 93.646 | 117.056 | |
| Result table ID | Conc. Found | Conc. Found | Conc. Found | Conc. Found | Conc. Found | Conc. Found | Conc. Found | Conc. Found |
| PMV_21122022_SEL | 0.196 | 0.415 | 7.641 | 18.212 | 45.726 | 64.076 | 81.130 | 97.066 |
| PMV_20122022_PA01_SEN01 | 0.199 | 0.404 | 7.318 | 18.714 | 45.666 | 61.249 | 80.187 | 105.788 |
| N | 2 | 2 | 2 | 2 | 2 | 2 | 2 | 2 |
| Mean | 0.1975 | 0.4095 | 7.4795 | 18.4630 | 45.6960 | 62.6625 | 80.6585 | 101.4270 |
| SD | 0.00212 | 0.00778 | 0.22840 | 0.35497 | 0.04243 | 1.99899 | 0.66680 | 6.16739 |
| %CV | 1.07 | 1.90 | 3.05 | 1.92 | 0.09 | 3.19 | 0.83 | 6.08 |
| % Nominal | 98.750 | 102.375 | 102.515 | 101.223 | 100.208 | 96.191 | 99.051 | 99.645 |
Abbreviations: Result table ID – Result table Identification, Calibration Standards – Reference Standards Used for Calibration, STD1–STD8 – Standard Samples 1 through 8, Nominal Conc. (ng/ml) – Nominal Concentration in nanograms per milliliter, Range (ng/ml) – Acceptable Concentration Range in nanograms per milliliter, Conc. Found – Measured Concentration, N – Number of Replicates, mean – Arithmetic mean of Replicates, SD – Standard Deviation, %CV – Coefficient of Variation (expressed as a percentage), % Nominal – Percentage of Nominal Concentration.
Recovery
Recovery and matrix effect evaluations were conducted to ensure consistency of the assay. The coefficient of variation (%CV) of the mean % recovery at each QC level was required to be ≤15%. Additionally, the %CV of the area response of the analyte at low, medium, and high QC levels, both in extracted and post-extracted samples, was mandated to be ≤15%, confirming acceptable reproducibility and minimal variability during the extraction process. Lobeglitazone was consistent across concentration levels, with mean recoveries of 100.735%, 93.047%, and 94.679% at LQC, MQC, and HQC levels, respectively. The overall mean recovery of the analyte was 96.15%, with a CV of 4.21%. The internal standard showed a mean recovery of 92.71% with a CV of 0.85% (table 8 and 9).
Matrix effect
Matrix effect evaluation was performed to assess the impact of endogenous plasma components on ionization efficiency. The coefficient of variation (%CV) of the internal standard (ISTD) normalized matrix factor (MF) across different plasma lots was required to be ≤15%, ensuring consistency and reliability of the assay in various biological matrices. Study evaluated by normalized matrix factor, indicated minimal ion suppression or enhancement. The normalized matrix factor was 1.158 at LQC and 1.077 at HQC with CVs of 8.70% and 2.87%, respectively (table 10), supporting the robustness of the method across different plasma sources
Table 7: Within and between-run precision and accuracy
| Nominal Conc. | LLOQQC (ng/ml) | LQC (ng/ml) | M1QC (ng/ml) | MQC (ng/ml) | HQC (ng/ml) | |||||
| 0.201 | 0.598 | 10.308 | 39.645 | 79.290 | ||||||
| Range | 0.161 | 0.241 | 0.508 | 0.688 | 8.762 | 11.854 | 33.698 | 45.592 | 67.397 | 91.184 |
| Result table ID | Conc. found | % nominal |
Conc. found | % nominal |
Conc. found | % nominal |
Conc. found | % nominal |
Conc. found | % nominal |
PMV_2012 2022_PA01 _SEN_01 |
0.199 | 98.816 | 0.516 | 86.228 | 10.739 | 104.180 | 34.257 | 86.410 | 69.553 | 87.719 |
| 0.211 | 104.916 | 0.512 | 85.645 | 10.457 | 101.444 | 34.909 | 88.054 | 66.641 | 84.047 | |
| 0.216 | 107.401 | 0.534 | 89.328 | 10.345 | 100.361 | 35.058 | 88.429 | 69.996 | 88.278 | |
| 0.183 | 90.968 | 0.536 | 89.705 | 10.449 | 101.370 | 34.492 | 87.002 | 69.178 | 87.247 | |
| 0.189 | 94.209 | 0.516 | 86.353 | 10.385 | 100.750 | 34.744 | 87.637 | 70.934 | 89.461 | |
| 0.188 | 93.450 | 0.516 | 86.280 | 10.182 | 98.773 | 34.139 | 86.111 | 69.744 | 87.960 | |
| N | 6 | 6 | 6 | 6 | 6 | |||||
| Mean | 0.1977 | 0.5217 | 10.4262 | 34.5998 | 69.3410 | |||||
| SD | 0.01341 | 0.01046 | 0.18289 | 0.36546 | 1.44849 | |||||
| %CV | 6.78 | 2.01 | 1.75 | 1.06 | 2.09 | |||||
| % Nominal | 98.342 | 87.235 | 101.146 | 87.274 | 87.452 | |||||
Abbreviations: Result table ID – Result table Identification, Nominal Conc. – Nominal Concentration, LLOQQC – Lower Limit of Quantification Quality Control, LQC – Low Quality Control, M1QC – Middle-1 Quality Control, MQC – Middle Quality Control, HQC – High Quality Control, Range (ng/ml) – Acceptable Concentration Range in nanograms per millilitre, Conc. Found – Measured Concentration, % Nominal – Percentage of Nominal Concentration, N – Number of Replicates, mean – Arithmetic Mean, SD – Standard Deviation, % CV – Coefficient of Variation (percentage).
Table 8: Recovery of analyte from biological matrix
| Recovery of analyte | ||||||
| LQC (ng/ml) | MQC (ng/ml) | HQC (ng/ml) | ||||
| Nominal conc. | 0.296 | 6.076 | 12.401 | |||
| S. No. | Area of extracted samples | Area of post extracted samples |
Area of extracted samples | Area of post extracted samples | Area of extracted samples | Area of post extracted samples |
| 1 | 10079 | 9155 | 636175 | 863079 | 1226464 | 1725117 |
| 2 | 12903 | 13026 | 634563 | 823278 | 1345550 | 1692069 |
| 3 | 9822 | 12756 | 606334 | 837220 | 1342424 | 1781018 |
| 4 | 9109 | 14081 | 618803 | 820595 | 1361642 | 1794486 |
| 5 | 8944 | 12695 | 602464 | 845961 | 1391016 | 1802967 |
| 6 | 9738 | 13478 | 595417 | 772075 | 1396758 | 1850621 |
| N | 6 | 6 | 6 | 6 | 6 | 6 |
| Mean | 10099.2 | 12531.8 | 615626.0 | 827034.7 | 1343975.7 | 1774379.7 |
| SD | 1441.11 | 1733.16 | 17081.85 | 31103.98 | 61846.17 | 57061.66 |
| %CV | 14.27 | 13.83 | 2.77 | 3.76 | 4.60 | 3.22 |
| % Recovery | 100.735 | 93.047 | 94.679 | |||
| % Recovery of LQC | 100.735 | |||||
| % Recovery of MQC | 93.047 | |||||
| % Recovery of HQC | 94.679 | |||||
| Mean | 96.1537 | |||||
| Standard Deviation | 4.05059 | |||||
| % CV | 4.21 | |||||
Abbreviations: LQC – Low Quality Control, MQC – Middle Quality Control, HQC – High Quality Control, Nominal Conc. – Nominal Concentration, Sr. No. – Serial Number, N – Number of Replicates, SD – Standard Deviation, %CV – Coefficient of Variation (percentage), % Recovery – Percentage Recovery, ng/ml – nanograms per millilitre.
Table 9: Recovery of internal standard from biological matrix
| Recovery of internal standard | ||||||
| LQC | MQC | HQC | ||||
| S. No. | Area of extracted sampsles | Area of post extracted samples |
Area of extracted samples | Area of post extracted samples |
Area of extracted samples | Area of post extracted samples |
| 1 | 1165584 | 1560104 | 1189717 | 1591713 | 1154058 | 1522035 |
| 2 | 1096077 | 1578525 | 1180215 | 1576278 | 1160722 | 1520128 |
| 3 | 1190729 | 1605525 | 1159328 | 1558877 | 1157242 | 1567879 |
| 4 | 1217198 | 1603824 | 1182858 | 1597836 | 1184261 | 1574573 |
| 5 | 1147424 | 1615433 | 1167301 | 1566520 | 1144999 | 1569847 |
| 6 | 1212386 | 1605005 | 1148632 | 1518561 | 1134913 | 1574899 |
| N | 6 | 6 | 6 | 6 | 6 | 6 |
| Mean | 1171566.3 | 1594736.0 | 1171341.8 | 1568297.5 | 1156032.5 | 1554893.5 |
| SD | 45679.28 | 20952.25 | 15655.02 | 28460.93 | 16685.16 | 26336.49 |
| %CV | 3.90 | 1.31 | 1.34 | 1.81 | 1.44 | 1.69 |
| % Recovery | 91.831 | 93.361 | 92.935 | |||
| % Recovery of LQC | 91.831 | |||||
| % Recovery of MQC | 93.361 | |||||
| % Recovery of HQC | 92.935 | |||||
| Mean | 92.7090 | |||||
| Standard Deviation | 0.78964 | |||||
| % CV | 0.85 | |||||
Abbreviations: LQC – Low Quality Control, MQC – Middle Quality Control, HQC – High Quality Control, Sr. No. – Serial Number, Area of Extracted Samples – Detector Response for Extracted Samples, Area of Post-Extracted Samples – Detector Response for Spiked Extract After Extraction, N – Number of Replicates, mean – Arithmetic Mean, SD – Standard Deviation, %CV – Coefficient of Variation (percentage), % Recovery – Percentage Recovery of Internal Standard.
Stability studies
Stability assessments were conducted to evaluate the integrity of lobeglitazone under various conditions. A minimum of 67% of comparison and stability quality control (QC) samples was required to be within ±15% accuracy of their respective nominal concentrations, and at least 50% of stability QC samples at each concentration level also had to meet the ±15% accuracy criteria. The percentage change between the mean back-calculated values of stability samples and their corresponding nominal and comparison sample concentrations was required to be within ±15%. Furthermore, the mean % nominal value for stability samples at each level had to be within ±15% of the nominal concentration, and the coefficient of variation (%CV) at each level was required to be ≤15%, ensuring assay precision and reliability under stability testing conditions. The study demonstrated that lobeglitazone was stable in plasma under benchtop conditions at room temperature for at least 6 h. The percentage change from nominal concentrations was −2.118% for LQC and −3.959% for HQC, with CVs of 2.94% and 1.13%, respectively (table 11).
Table 10: Matrix effect
| S. No. | LQC (ng/ml) | ||||||
| Concentration | 0.598 | ||||||
| Aqueous Sample | Matrix Sample | Matrix Factor | |||||
| Analyte area response | Internal standard area response | Blank matrix ID | Post extracted analyte area response | Post extracted internal standard area response | Analyte | Internal stand-ard | |
| 1 | 9227 | 1681513 | PL\893\0522 | 15605 | 1581790 | 1.2726 | 0.9113 |
| 2 | 14703 | 1724960 | PL\1457\1122 | 12325 | 1608184 | 1.0051 | 0.9265 |
| 3 | 12185 | 1751865 | PL\1498\1122 | 12692 | 1603479 | 1.0351 | 0.9238 |
| 4 | 12645 | 1750919 | PL\1499\1122 | 12602 | 1605246 | 1.0277 | 0.9248 |
| 5 | 12603 | 1753215 | PL\1500\1122 | 12502 | 1598509 | 1.0196 | 0.9210 |
| 6 | 12209 | 1751808 | PL\1505\1122 | 13361 | 1586813 | 1.0896 | 0.9142 |
| 7 | PL\1388\1022(HAE) | 13292 | 1609738 | 1.0840 | 0.9274 | ||
| 8 | PL\1389\1022(HAE) | 12341 | 1638722 | 1.0064 | 0.9441 | ||
| 9 | PL\1390\1022(LIP) | 14307 | 1620820 | 1.1668 | 0.9338 | ||
| 10 | PL\1391\1022(LIP) | 12597 | 1639807 | 1.0273 | 0.9447 | ||
| N | 6 | 6 | NA | 10 | 10 | 10 | |
| Mean | 12262.0 | 1735713.3 | 1.07343 | 0.92718 | 1.15837 | ||
| SD | 1757.35 | 28673.14 | 0.085963 | 0.011131 | 0.100823 | ||
| %CV | 14.33 | 1.65 | 8.01 | 1.20 | 8.70 | ||
| S. No. | HQC (ng/ml) | ||||||
| Concentration | 79.290 | ||||||
| Aqueous sample | Matrix sample | Matrix factor | |||||
| Analyte area response | Internal standard area response | Blank matrix ID | Post extracted analyte area response | Post extracted internal standard area response | Analyte | Inter-nal stand-ard | |
| 1 | 1685586 | 1741211 | PL\893\0522 | 1768341 | 1640665 | 1.0504 | 0.9483 |
| 2 | 1705063 | 1749890 | PL\1457\1122 | 1652527 | 1626817 | 0.9816 | 0.9403 |
| 3 | 1688346 | 1739068 | PL\1498\1122 | 1640273 | 1619971 | 0.9743 | 0.9364 |
| 4 | 1675723 | 1730364 | PL\1499\1122 | 1718113 | 1644793 | 1.0206 | 0.9507 |
| 5 | 1670305 | 1710790 | PL\1500\1122 | 1760935 | 1637903 | 1.0460 | 0.9467 |
| 6 | 1675997 | 1709123 | PL\1505\1122 | 1721632 | 1640600 | 1.0226 | 0.9483 |
| 7 | PL\1388\1022(HAE) | 1687261 | 1577007 | 1.0022 | 0.9115 | ||
| 8 | PL\1389\1022(HAE) | 1623225 | 1593332 | 0.9642 | 0.9210 | ||
| 9 | PL\1390\1022(LIP) | 1637617 | 1600551 | 0.9727 | 0.9251 | ||
| 10 | PL\1391\1022(LIP) | 1726653 | 1575643 | 1.0256 | 0.9107 | ||
| N | 6 | 6 | NA | 10 | 10 | 10 | |
| Mean | 1683503.3 | 1730074.3 | 1.00603 | 0.93391 | 1.07729 | ||
| SD | 12519.45 | 16783.92 | 0.031467 | 0.015600 | 0.030968 | ||
| %CV | 0.74 | 0.97 | 3.13 | 1.67 | 2.87 | ||
Abbreviations: S. No. – Serial Number, standard, Blank Matrix ID – Identification code of the blank matrix lot, LQC – Low Quality Control, HQC – High Quality Control, ng/ml – nanograms per millilitre, Aqueous Sample – Analyte prepared in solvent, Matrix Sample – Analyte spiked into biological matrix, Matrix Factor – Ratio of analyte response in matrix to that in solvent, Internal Standard Normalized Matrix Factor – Matrix factor corrected by the internal standard, Analyte Area Response – Detector response for the analyte, Internal Standard Area Response – Detector response for the internal HAE – Haemolysed Sample, LIP – Lipemic Sample, IS – Internal Standard, N – Number of Replicates, SD – Standard Deviation,%CV – Coefficient of Variation (percentage).
Table 11: Benchtop stability
| Bench top (Room temperature) stability | ||||||||
| Bench top stability samples | Fresh QC Samples | |||||||
| LQC (ng/ml) | HQC (ng/ml) | LQC (ng/ml) | HQC (ng/ml) | |||||
| Nominal concentration | 0.598 | 79.290 | 0.598 | 79.290 | ||||
| Range | 0.508 | 0.688 | 67.397 | 91.184 | 0.508 | 0.688 | 67.397 | 91.184 |
| S. No. | % Stability calculated with nominal concentration | % Stability calculated with fresh QC samples | ||||||
| Conc. Found | % Nominal | Conc. Found | % Nominal | Conc. Found | % Nominal | Conc. Found | % Nominal | |
| 1 | 0.565 | 94.526 | 77.095 | 97.231 | 0.579 | 96.810 | 75.973 | 95.816 |
| 2 | 0.586 | 97.966 | 76.582 | 96.584 | 0.557 | 93.200 | 75.319 | 94.991 |
| 3 | 0.578 | 96.666 | 76.535 | 96.526 | 0.563 | 94.195 | 75.062 | 94.668 |
| 4 | 0.617 | 103.180 | 76.141 | 96.029 | 0.584 | 97.721 | 73.091 | 92.182 |
| 5 | 0.582 | 97.400 | 75.967 | 95.809 | 0.563 | 94.118 | 74.756 | 94.281 |
| 6 | 0.584 | 97.609 | 74.585 | 94.067 | 0.576 | 96.271 | 75.773 | 95.565 |
| N | 6 | 6 | 6 | 6 | ||||
| Mean | 0.5853 | 76.1508 | 0.5703 | 74.9957 | ||||
| SD | 0.01722 | 0.86147 | 0.01076 | 1.03475 | ||||
| %CV | 2.94 | 1.13 | 1.89 | 1.38 | ||||
| % Nominal | 97.882 | 96.041 | 95.373 | 94.584 | ||||
| % Change | -2.118 | -3.959 | 2.630 | 1.540 | ||||
Abbreviations: S. No. – Serial Number, LQC – Low Quality Control, HQC – High Quality Control, ng/ml – nanograms per millilitre, Nominal Concentration – Target Concentration of the Analyte, Range – Acceptable Concentration Range, % Stability Calculated with Nominal Concentration – Percentage of Stability based on Nominal Concentration, % Stability Calculated with Fresh QC Samples – Percentage of Stability compared to freshly prepared quality control samples, Conc. Found – Measured Concentration of Analyte, % Nominal – Measured concentration expressed as a percentage of the nominal value, % Change – Percentage Change from Reference (either nominal or fresh), N – Number of Replicates, mean – Arithmetic Mean, SD – Standard Deviation, %CV – Coefficient of Variation (percentage).
Overall, the validation parameters confirmed that the developed LC-MS/MS method was selective, sensitive, precise, accurate, reproducible, and suitable for the pharmacokinetic evaluation of lobeglitazone following oral and transdermal microneedle administration.
Pharmacokinetic evaluation
A comparative pharmacokinetic evaluation was performed following a single 0.5 mg/kg dose of lobeglitazone administered via oral suspension and transdermal dissolving microneedle array (DMNA) in rats. The pharmacokinetic parameters are summarized in table 12 and visualized in fig. 3. The oral group exhibited a significantly higher Cmax of 1786.25±66.68 ng/ml, with a T_max of 2.67±0.52 h, indicating rapid systemic absorption. In contrast, the DMNA group showed a significantly lower Cmax of 1207.69±25.70 ng/ml (p<0.00001) and a delayed Tmax of 5.33±1.03 h (p = 0.0001), consistent with sustained release via transdermal delivery. Despite the lower peak concentration, systemic exposure was markedly enhanced in the DMNA group. The AUC0–t and AUC0–∞ were significantly higher than in the oral group (23195.36±527.74 and 24250.57±650.92 ng·h/ml vs. 11926.71±803.83 and 12036.84±860.47 ng·h/ml, respectively; p<0.00001). Furthermore, the Kel for the DMNA group was significantly lower (0.0685±0.0023 h⁻¹) compared to the oral group (0.1446±0.0179 h⁻¹, p<0.00001), resulting in a longer T₁/₂ of 10.13±0.34 h for DMNA versus 4.85±0.60 h for oral administration shown in fig. 3. The relative bioavailability (%RB) of the DMNA formulation was calculated as 201.47%, indicating more than a two-fold enhancement in systemic availability.
In summary, while the DMNA patch produced a lower peak concentration and delayed onset, it significantly enhanced the overall bioavailability and extended the systemic exposure of lobeglitazone, supporting its potential utility as a controlled and sustained delivery system.
Table 12: Summary pharmacokinetics parameters
| Summary of pharmacokinetic parameters | |||||
| Pk-parameters | Oral dose | DMNA | p-Value | ||
| mean | SD | mean | SD | ||
| Cmax (ng/ml) | 1786.25 | 66.68 | 1207.69 | 25.70 | <.00001 |
| Tmax (h) | 2.67 | 0.52 | 5.33 | 1.03 | .000105 |
| Auc0-t (ng*h/ml) | 11926.71 | 803.83 | 23195.36 | 527.74 | <.00001 |
| AUC0–∞ (ng*h/ml) | 12036.84 | 860.47 | 24250.57 | 650.92 | <.00001 |
| Kel (h-1) | 0.14 | 0.02 | 0.07 | 0.00 | <.00001 |
| T ½ (h) | 4.85 | 0.60 | 10.13 | 0.34 | <.00001 |
| % RB | 100% | ||||
Abbreviations: PK – Pharmacokinetics, Cmax (ng/ml) – Maximum Observed Plasma Concentration (in nanograms per millilitre), Tmax (hr) – Time to Reach Maximum Plasma Concentration (in hours), AUC₀–t (ng·hr/ml) – Area Under the Plasma Concentration–Time Curve from Time Zero to Last Measurable Concentration (in nanogram hours per millilitre), AUC₀–∞ (ng·hr/ml) – Area Under the Curve from Time Zero to Infinity,
Kel (h⁻¹) – Elimination Rate Constant (per hour), T½ (hr) – Elimination Half-Life (in hours), %RB – Relative Bioavailability (percentage), SD – Standard Deviation, p-Value – Probability Value (statistical significance), n – Number of Subjects in Each Group. *n=6 in each group, significant at p<.05.
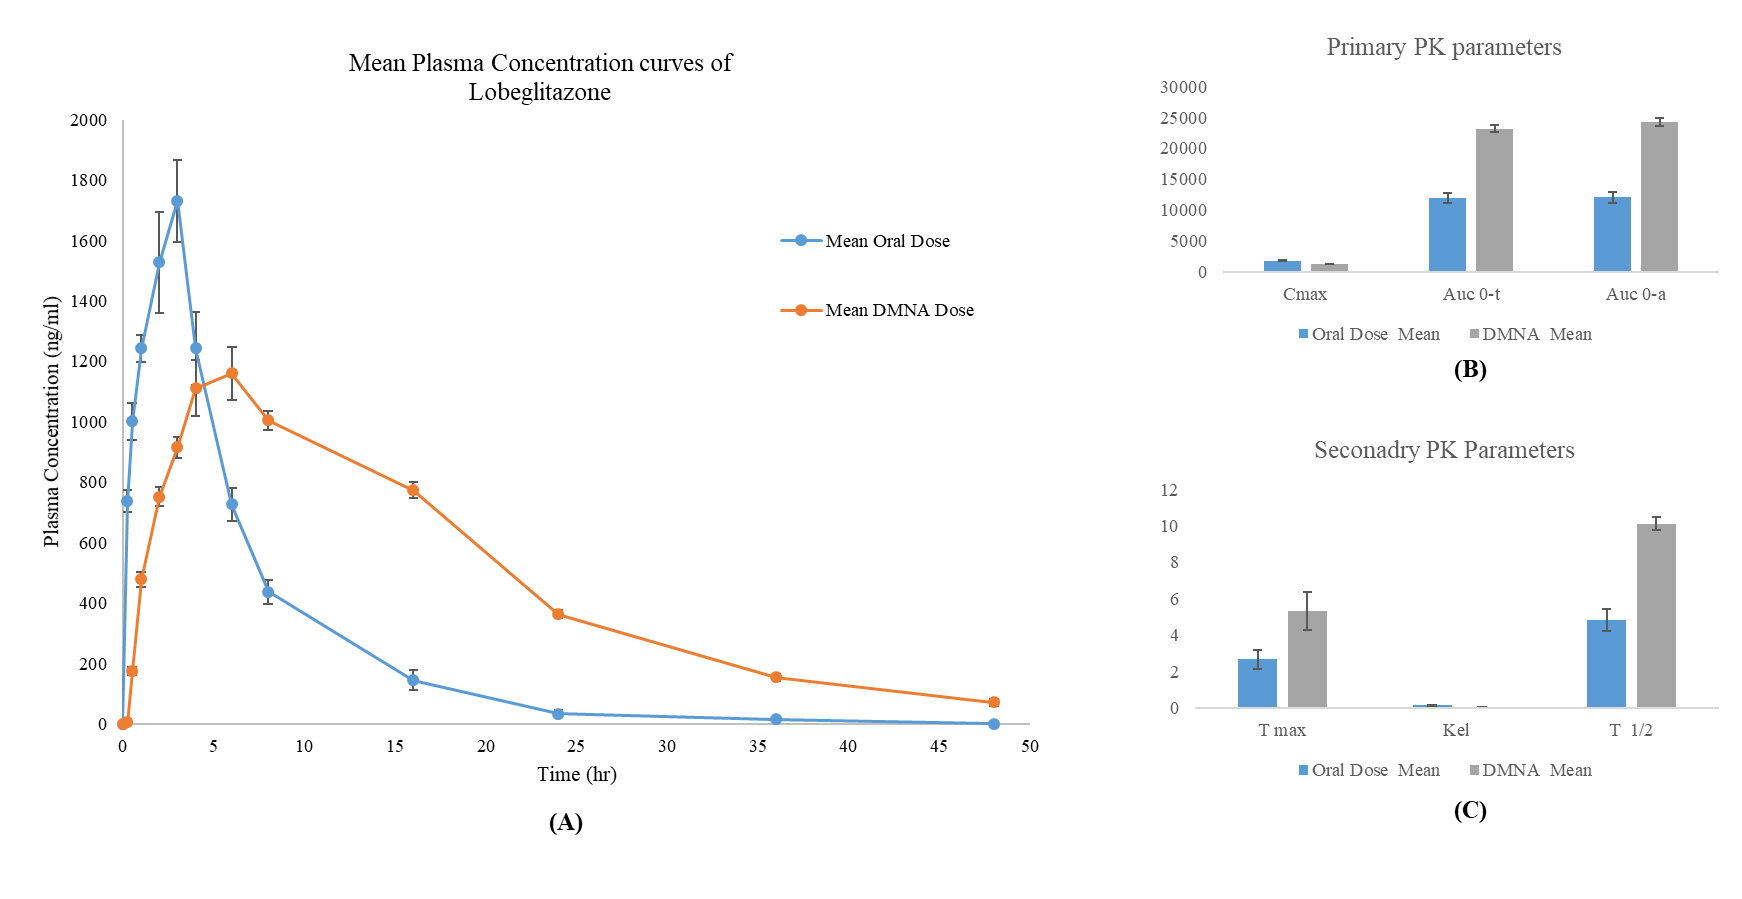
Fig. 3: (A) mean plasma concentration-time profiles of lobeglitazone following a single 0.5 mg/kg dose administered via oral suspension and dissolving microneedle array (DMNA) patch in rats (n = 6 per group). (B) Comparison of primary pharmacokinetic parameters: Cmax, AUC₀–t, and AUC₀–∞ between oral and DMNA administration routes. (C) Comparison of secondary pharmacokinetic parameters: Tmax, elimination rate constant (Kel), and half-life (T₁/₂) between the two groups. Data are presented as mean ± SD. DMNA administration results in delayed Tmax, lower Cmax, and significantly enhanced systemic exposure compared to oral dosing, demonstrating improved pharmacokinetic stability
DISCUSSION
This study presents the first comparative pharmacokinetic evaluation of lobeglitazone delivered via a dissolving microneedle array (DMNA) versus the conventional oral route in a rat model. The findings demonstrate that DMNA-based transdermal delivery significantly alters the pharmacokinetic behavior of lobeglitazone, offering several potential advantages over oral administration.
The lower Cmax and delayed Tmax observed in the DMNA group suggest a sustained release profile, which is consistent with drug delivery via dissolving microneedles. Previous studies have shown that such platforms enable gradual systemic absorption through dermal microcirculation, reducing peak-related toxicity and supporting therapeutic consistency [12, 13]. These pharmacokinetic characteristics are particularly advantageous in chronic conditions like type 2 diabetes mellitus (T2DM), where stable plasma concentrations help mitigate glycemic fluctuations and reduce the risk of side effects such as fluid retention and weight gain known complications associated with thiazolidinedione therapy, including lobeglitazone [8].
Beyond delayed absorption, the significantly enhanced AUC₀–∞ and relative bioavailability (201.47%) observed in the DMNA group indicate markedly improved systemic exposure. These improvements likely result from the bypassing of hepatic first-pass metabolism, a key pharmacokinetic barrier in oral thiazolidinedione therapy [14, 15]. As lobeglitazone undergoes extensive hepatic metabolism following oral administration [16], direct dermal delivery via DMNA represents a mechanistically sound strategy to increase bioavailability and improve therapeutic consistency.
The extended elimination half-life (T₁/₂) with DMNA administration (10.13 ± 0.34 h vs. 4.85 ± 0.60 h for oral) further supports its potential as a sustained-release platform. This prolongation may enable reduced dosing frequency, which in turn can promote better patient adherence. Similar findings have been reported in previous microneedle-based studies with other small molecules, where extended pharmacokinetic profiles improved treatment outcomes and patient satisfaction [13, 14].
In addition to pharmacokinetic enhancements, DMNA systems offer substantial patient-centric benefits. Their minimally invasive, pain-free application improves user experience, especially for chronic disease management, where long-term oral therapy is associated with compliance challenges [15]. Furthermore, the use of biodegradable polymers like hyaluronic acid and PVP K-90 in patch fabrication minimizes safety concerns related to residual materials.
However, some challenges remain. Transdermal absorption variability influenced by skin thickness, hydration, and regional blood flow can affect drug delivery efficiency. While animal models like rats offer a controlled setting for evaluating pharmacokinetics, human skin presents greater inter-individual variability [10]. Microneedle geometry, dissolution kinetics, and formulation composition must therefore be optimized for clinical application. Future studies should assess these factors in human skin models or early-phase clinical trials.
A further limitation of the present study is its single-dose design, which does not account for long-term pharmacokinetic behavior or potential drug accumulation. Repeated-dose studies are warranted to evaluate chronic safety, therapeutic durability, and real-world feasibility. Previous LC-MS/MS-based pharmacokinetic investigations with antidiabetics, such as those conducted by Das et al. (2022) and Halder et al. (2020), provide a strong precedent for extending such work into human trials [18, 19].
This study provides compelling preclinical evidence supporting the use of DMNA patches for lobeglitazone delivery. By enhancing bioavailability, prolonging systemic retention, and offering a more convenient and tolerable administration route, DMNA technology may address several limitations of oral thiazolidinedione therapy [17, 8]. From a translational perspective, the DMNA platform holds promise not only for lobeglitazone but also for other PPAR-γ agonists and therapeutics that benefit from sustained systemic exposure. Realizing this potential, however, will require careful clinical evaluation and regulatory validation to ensure consistent performance and safety in human populations.
CONCLUSION
The present study Concludes that transdermal delivery of lobeglitazone via a dissolving microneedle array (DMNA) significantly enhances systemic bioavailability and prolongs drug exposure compared to conventional oral administration in a rat model. While the oral route achieves faster absorption, the DMNA system provides a more controlled release profile, characterized by a delayed Tmax and sustained plasma concentrations. These pharmacokinetic advantages, combined with the minimally invasive and patient-friendly nature of microneedle patches, position DMNA as a promising alternative for the chronic management of type 2 diabetes mellitus.
By circumventing hepatic first-pass metabolism and improving pharmacokinetic stability, the DMNA platform addresses key limitations associated with oral thiazolidinedione therapy, such as variable absorption and suboptimal patient adherence. Nevertheless, interspecies differences and the single-dose design of this study underscore the need for further investigation. Future studies should focus on multiple-dose pharmacokinetics, long-term safety evaluations, and clinical trials to confirm the therapeutic potential of DMNA-based lobeglitazone delivery in humans.
In conclusion, this study provides foundational evidence supporting the development of dissolving microneedle patches as a viable, patient-centric delivery system for lobeglitazone, offering the potential to enhance therapeutic outcomes and adherence in diabetes care.
ACKNOWLEDGEMENT
The authors would like to acknowledge ABS Clinical Solutions, Kolkata-152 and TAAB Biostudy Services for the technical support and all other kinds of help provided for this study. Authors would like to extended acknowledgement to Senjuti Bhattacharjee and Sudeepto Biswas who performed formal analysis and statistical analysis.
FUNDING
This research did not receive any specific grant from funding agencies in the public, commercial, or not-for-profit sector.
AUTHORS CONTRIBUTIONS
Sukanta Roy (S. R.) contributed to conceptualization, methodology design, data curation, formal analysis, and original draft preparation. Balaram Ghosh (B. G.) was involved in methodology development, validation, investigation, and resource acquisition. Ananya Chandra (A. C.) contributed to software handling, data management, and visualization. Dibya Das (D. D.) participated in formal analysis, investigation, and manuscript review and editing. Parag Ghosh (P. G.) contributed to supervision, project administration, and manuscript review. Sangeeta Choudhury (S. C.) was responsible for validation, investigation, and data curation. Anirbandeep Bose (A. B.) contributed to conceptualization, supervision, project administration, funding acquisition, and manuscript review and editing. Subas Chandra Dinda (S. C. D.) supervised the overall study design, project administration, and critically reviewed and edited the manuscript. All authors have read and approved the final manuscript and agreed to be accountable for all aspects of the work.
CONFLICT OF INTERESTS
The authors hereby declare that they have no conflict of interest either to disclose
REFERENCES
Galicia Garcia U, Benito Vicente A, Jebari S, Larrea Sebal A, Siddiqi H, Uribe KB. Pathophysiology of type 2 diabetes mellitus. Int J Mol Sci. 2020 Aug 30;21(17):6275. doi: 10.3390/ijms21176275, PMID 32872570.
Mlynarska E, Czarnik W, Dzieza N, Jedraszak W, Majchrowicz G, Prusinowski F. Type 2 diabetes mellitus: new pathogenetic mechanisms, treatment and the most important complications. Int J Mol Sci. 2025;26(3):1094. doi: 10.3390/ijms26031094, PMID 39940862.
Guan H, Tian J, Wang Y, Niu P, Zhang Y, Zhang Y. Advances in secondary prevention mechanisms of macrovascular complications in type 2 diabetes mellitus patients: a comprehensive review. Eur J Med Res. 2024;29(1):152. doi: 10.1186/s40001-024-01739-1, PMID 38438934.
MB, SS, RR. Lobeglitazone and its therapeutic benefits: a review. Cureus. 2023 Dec 6;15(12):e50085. doi: 10.7759/cureus.50085, PMID 38186506.
Hong F, Xu P, Zhai Y. The opportunities and challenges of peroxisome proliferator-activated receptors ligands in clinical drug discovery and development. Int J Mol Sci. 2018 Jul 27;19(8):2189. doi: 10.3390/ijms19082189, PMID 30060458.
Basak S, Murmu A, Matore BW, Roy PP, Singh J. Thiazolidinedione an auspicious scaffold as PPAR-γ agonist: its possible mechanism to manoeuvre against insulin-resistant diabetes mellitus. European Journal of Medicinal Chemistry Reports. 2024;11:100160. doi: 10.1016/j.ejmcr.2024.100160.
Yasmin S, Capone F, Laghezza A, Piaz FD, Loiodice F, Vijayan V. Novel benzylidene thiazolidinedione derivatives as partial PPARγ agonists and their antidiabetic effects on type 2 diabetes. Sci Rep. 2017;7(1):14453. doi: 10.1038/s41598-017-14776-0, PMID 29089569.
Ryang S, Kim SS, Bae JC, Han JM, Kwon SK, Kim YI. A double blind randomized controlled trial on glucose-lowering effects and safety of adding 0.25 or 0.5 mg lobeglitazone in type 2 diabetes patients with inadequate control on metformin and dipeptidyl peptidase-4 inhibitor therapy: REFIND study. Diabetes Obes Metab. 2022 Sep;24(9):1800-9. doi: 10.1111/dom.14766, PMID 35581902.
Currie GM. Pharmacology part 2: introduction to pharmacokinetics. J Nucl Med Technol. 2018 Sep;46(3):221-30. doi: 10.2967/jnmt.117.199638, PMID 29724803.
Olivares Morales A, Hatley OJ, Turner D, Galetin A, Aarons L, Rostami Hodjegan A. The use of ROC analysis for the qualitative prediction of human oral bioavailability from animal data. Pharm Res. 2014 Mar;31(3):720-30. doi: 10.1007/s11095-013-1193-2, PMID 24072264.
Martinez MN, Amidon GL. A mechanistic approach to understanding the factors affecting drug absorption: a review of fundamentals. J Clin Pharmacol. 2002 Jun;42(6):620-43. doi: 10.1177/00970002042006005, PMID 12043951.
Wang X, Yue J, Guo S, Rahmatulla A, Li S, Liu Y. Dissolving microneedles: a transdermal drug delivery system for the treatment of rheumatoid arthritis. Int J Pharm. 2025 Feb 25;671:125206. doi: 10.1016/j.ijpharm.2025.125206, PMID 39799999.
Bauleth Ramos T, El Sayed N, Fontana F, Lobita M, Shahbazi MA, Santos HA. Recent approaches for enhancing the performance of dissolving microneedles in drug delivery applications. Mater Today. 2023;63:239-87. doi: 10.1016/j.mattod.2022.12.007.
Aldawood FK, Andar A, Desai S. A comprehensive review of microneedles: types, materials processes, characterizations and applications. Polymers (Basel). 2021 Aug 22;13(16):2815. doi: 10.3390/polym13162815, PMID 34451353.
Garland MJ, Caffarel Salvador E, Migalska K, Woolfson AD, Donnelly RF. Dissolving polymeric microneedle arrays for electrically assisted transdermal drug delivery. J Control Release. 2012 Apr 10;159(1):52-9. doi: 10.1016/j.jconrel.2012.01.003, PMID 22265694.
Lee JH, Noh CK, Yim CS, Jeong YS, Ahn SH, Lee W. Kinetics of the absorption distribution metabolism and excretion of lobeglitazone a novel activator of peroxisome proliferator activated receptor gamma in rats. J Pharm Sci. 2015 Sep;104(9):3049-59. doi: 10.1002/jps.24378, PMID 25648999.
Bae J, Park T, Kim H, Lee M, Cha BS. Lobeglitazone: a novel thiazolidinedione for the management of type 2 diabetes mellitus. Diabetes Metab J. 2021 May;45(3):326-36. doi: 10.4093/dmj.2020.0272, PMID 33866775.
Das D, Halder D, Bose A, Shaw TK, Saha C, Kumar De P. Determination of metformin and sitagliptin in healthy human volunteer’s blood plasma and its bioequivalence study under fasting condition. Int J App Pharm. 2022;14(6):42-50. doi: 10.22159/ijap.2022v14i6.45140.
Halder D, Das S, Ghosh B, Biswas E, Roy S, Bose A. An LC-MS/MS-based bioanalytical approach to resolve pharmacokinetic investigation of acotiamide hydrochloride and its application to bioequivalence study. Int J Pharm Pharm Sci. 2020;12(10):76-84. doi: 10.22159/ijpps.2020v12i10.38410.
Matuszewski BK, Constanzer ML, Chavez Eng CM. Strategies for the assessment of matrix effect in quantitative bioanalytical methods based on HPLC–MS/MS. Anal Chem. 2003 Jun 1;75(13):3019-30. doi: 10.1021/ac020361s, PMID 12964746.
Gibaldi M, Perrier D. Pharmacokinetics. 2nd ed. New York: Informa Healthcare; 1982. p. 409-16.
International council for harmonisation of technical requirements for pharmaceuticals for human use (ICH). ICH harmonised guideline: bioanalytical method validation and study sample analysis M10. Vol. R1. Geneva: ICH; 2022 May 24.