
Int J App Pharm, Vol 17, Issue 5, 2025, 417-425Original Article
BIO-ANALYTICAL METHOD DEVELOPMENT AND VALIDATION OF TENELIGLIPTIN, REMOGLIFLOZIN ETABONATE AND ITS APPLICATION TO PHARMACOKINETIC STUDIES IN RAT PLASMA BY USING LC-MS/MS
T N V S S SATYADEV*1, BHARGAVI CHINTA2, MANIKANTA RAKESH VEJJU3, B. VICTOR PRADEEP SAGAR4
*1Department of Chemistry, P B Siddhartha College of Arts and Science, Vijayawada, AP-520010, Inida. 2Department of Chemistry, Andhra Loyola College, Vijayawada-520008, Andhra Pradesh, India. 3Department of Chemistry, Sir C R Reddy Autonomous College, Eluru, AP, India. 4Department of Chemistry, Krishna University, Machilipatnam, AP, India
*Corresponding author: T N V S S Satyadev; *Email: satyadev2satya@gmail.com
Received: 03 May 2025, Revised and Accepted: 25 Jul 2025
ABSTRACT
Objective: An easy, quick, precise, active and reproducible LC-MS/MS (Liquid Chromatography Tandem Mass Spectrometry) technique was developed for the simultaneous estimation of Teneligliptin and Remogliflozin etabonate in rat plasma using Ertugliflozin as internal standard (IS).
Methods: An elaborate protein precipitation extraction technique used Ertugliflozin as internal standard for Remogliflozin Etabonate and Teneligliptin. The two compounds were separated on a Zorbax SB C18 column (250x4.6 mm, 5µ), an isocratic program utilizing 0.1% perchloric acid and acetonitrile (ACN) at a ratio of 70:30 as mobile phases to achieve a separation in 10 min.
Results: In the teneligliptin range of 0.5–20 ng/ml and the remogliflozin etabonate range of 5-200 ng/ml, the calibration curve was linear. At various QC (Quality Control) concentration levels, teneligliptin and remogliflozin etabonate recovered with accuracy and precision of 95.41%, 95.41%, 97.29%, and 95.23%, 96.08%, 98.10%, respectively. The findings of the matrix effect were within the permissible range. Teneligliptin and Remogliflozin etabonate were studied using an electrospray ionisation source at mass analysis ion pairs 427.5839 → 118.0474, 523.5967→88.6473, and 437.8882→140.7849, respectively, for ertugliflozin.
Conclusion: When used successfully for the examination of rat pharmacokinetic studies, the application indicates that all system appropriateness, specificity, linearity, and accuracy characteristics are in excellent compliance with USFDA (United States of Food and Drug Administration) requirements.
Keywords: Teneligliptin, Remogliflozin etabonate, LC-MS/MS, USFDA guidelines, Rat plasma
© 2025 The Authors. Published by Innovare Academic Sciences Pvt Ltd. This is an open access article under the CC BY license (https://creativecommons.org/licenses/by/4.0/)
DOI: https://dx.doi.org/10.22159/ijap.2025v17i5.54860 Journal homepage: https://innovareacademics.in/journals/index.php/ijap
INTRODUCTION
The pharmaceutical medicine teneligliptin, also known as Tenelia, is used to treat type 2 diabetes mellitus [1, 2]. Included in the group of medications called "gliptins" or dipeptidyl peptidase-4 inhibitors [3, 4], it is used to treat diabetes. The distinctive J-shaped or anchor-locked domain structure of teneligliptin is responsible for its strong inhibition of the DPP 4 enzyme. With no side effects, teneligliptin effectively regulates blood sugar levels. There is no need to change the dosage for people with renal impairment.
One medication in the gliflozin family, remogliflozin etabonate, is used to treat type 2 diabetes and non-alcoholic steatohepatitis (NASH) [5, 6]. One example of a pro-drug is remogliflozin etabonate. One mechanism by which remogliflozin prevents the kidneys from reabsorb glucose is by blocking the sodium-glucose transport proteins (SGLT) [7, 8]. The excretion of glucose from the bloodstream is facilitated by blocking this transporter. The drug remogliflozin targets SGLT2 specifically. Both rats and humans exhibited an increase in urine glucose excretion when given remogliflozin etabonate. Plasma glucose levels were improved in early diabetes trials.
Several UPLC [9, 10] and HPLC [11-15] procedures have been published in the literature but no method is available for bio-analysis of Teneligliptin and remogliflozin etabonate in any type of biological matrix. The aim of the study was to develop a new rapid and sensitive LC-MS/MS method for the simultaneous estimation of Teneligliptin and remogliflozin etabonate in rat plasma using Ertugliflozin as internal standard.
For the first time, we can establish the method for the estimation of Teneligliptin and Remogliflozin etabonate in rat plasma. The developed method with simple buffer with less run time.
MATERIALS AND METHODS
Chemicals and reagents
Remogliflozin Etabonate and Teneligliptin (C26H38N2O9 and C22H30N6O5) and Ertugliflozin Internal Standard (C22H25ClO7) with purity levels of ≥ 99% was purchased from Zydus Cadila, Ahmadabad. Acetonitrile (LC-MS Grade, 99.99% purity), water (Milli Q), Perchloric acid (HPLC grade, 99.2% purity) was obtained from Merck (India) Ltd., Worli, and Mumbai, India. All other reagents and materials were of AR grade and commercially available.
Instrument and conditions
To build the bio-analytical test, we used the following instruments: a mass spectrometer QTRAP 5500 triple quadrupole instrument (SCIEX) and a high-performance liquid chromatography system (Waters Alliance model) [16, 17]. The separation process occurred at room temperature with the use of an isocratic mode and a zorbax SB C18 column measuring 250 x 4.6 mm x 5 µm. The mobile phase was a 30-to-70 (by volume) mixture of acetonitrile and perchloric acid flowing at 1.0 ml/min. During the five-minute cycle, ten microlitres of liquid were injected. A QTRAP 5500 triple quadrupole mass spectrometer with a positive ion electrospray ionisation interface was used for this work. For teneligliptin, remogliflozin etabonate, and ertugliflozin (Internal Standard), the mass ion pair monitoring in MRM mode shows the following values: m/z 427.5839 → 118.0474, m/z 523.5967→88.6473, and m/z 437.8882→140.7849. The parameters are as follows: ion spray voltage of 5500V, source temperature of 550 °C, drying gas temperature of 120-250 °C, collision gas nitrogen, pressure of 55 psi, drying gas flow rate of 5 ml/min, declustering potential of 40V, entry potential of 45V, exit potential of 15V, capillary voltage of 5500V, and dwell duration of 1 second.
Pharmacokinetic study
Selection of animals
Six healthy rats weighing about 250 g were procured from Biological E Limited in Hyderabad, India, for the purpose of conducting in vivo pharmacokinetic investigations. Institutional Animal Ethics Committee approval (Reg. No: 1074/PO/Re/S/25/CPCSEA) was obtained for the animal research protocol. The animals live in controlled environments with access to fresh corn, endive, and carrots. Their diet should be maintained at a temperature of 21-24 ᵒC and a humidity level of 50-55%. There was an overnight fast and free access to water for all animals before the experiment [18].
Chromatographic conditions
The separation was carried out at room temperature using an isocratic mode on a Symmetry Zorbax SB C18 column (250 x 4.6 mm, 5 micron). The mobile phase consisted of a mixture of 70% acetonitrile and 0.1% perchloric acid, with a flow rate of 1.0 ml/min. 10 min was the run period, and the injection rate was 10µl.
Preparation of standard and internal control samples
Preparation of Teneligliptin Parent Stock Solution Four milligrammes of teneligliptin (used as the working standard) were placed into a 100 ml volumetric flask along with 70 millilitres of diluent. The mixture was sonicated for 10 min to dissolve the contents, after which diluent was added to bring the volume up to the mark. One millilitre of this solution was then transferred to another 100 ml volumetric flask for further dilution. A sonicator with a frequency of 40 kHz and power of 360 W was used.
Preparation of remogliflozin etabonate parent stock solution
Ten milligrammes of remogliflozin etabonate (used as a working standard) were weighed and transferred to a 100 ml volumetric flask. Seventy millilitres of diluent were added, and the mixture was sonicated for 10 min to achieve complete dissolution. The volume was then adjusted to the mark with additional diluent. Subsequently, 0.4 millilitres of this solution were transferred to a 10 ml volumetric flask for further dilution.
Preparation of standard stock solution
A 10 ml volumetric flask was filled to the mark with diluent after adding 1 millilitre each of the teneligliptin and remogliflozin etabonate parent stock solutions.
Preparation of internal standard stock solution
Ten milligrammes of the internal standard (ertugliflozin) were added to a 100 ml volumetric flask, followed by sufficient diluent to fill the flask to the mark. The mixture was sonicated for 10 min to ensure complete dissolution. From this solution, 0.4 ml were transferred to a 10 ml volumetric flask. 1 ml of the resulting solution was then added to another 10 ml volumetric flask, which was subsequently filled to the mark with diluent.
Preparation of standard solution
After adding 300µl of ACN to 200µl of plasma, a 2 ml centrifuge tube was vortexed for 10 min to prepare the standard. Vortexing was continued for 10 min after the addition of 500µl of standard stock solution, 500µl of IS stock, and 500 µl of diluents. Following this, the samples were centrifuged at 5,000 rpm for 20 min. Gather the solution, pass it through a 0.45µ nylon syringe filter, and then transfer the clear solution to a vial. Inject it into a system.
Diluent: 0.1% Perchloric acid and Acetonitrile at a ratio of 70:30
Bioanalytical method validation
Selectivity, sensitivity, linearity, accuracy, precision, matrix condition, recovery study, re-injection repeatability, and stability were all areas where the technique was verified [19-23].
Selectivity
In order to evaluate selectivity, we evaluated the retention durations of teneligliptin, remogliflozin etabonate, and IS, and we tested for interference from untested substances by analysing plasma samples from six different rats [24].
Matrix effect
We evaluated the effect matrix [25] for teneligliptin and remogliflozin etabonate by comparing the peak zone percentage in the post-extract plasma sample of six distinct medicine-free and slick recovery samples. Replicated testing at MQC (Middle Quality Control) levels on six separate plasma batches yielded acceptable results (% Coefficient of variation (CV) 15%).
Recovery
The recovery [26, 27] was determined by comparing the peak areas of the extracted teneligliptin and remogliflozin etabonate with those of the non-extracted standards (with 6 replicates per QC (Quality Control) concentration).
Dilution integrity
To ensure accurate dilution, it is necessary to inject a matrix with an analyte concentration higher than the Upper Limit of Quality Control (ULOQC) and then dilute the test using a blank matrix.
Carry over
Carry over refers to the analyte that remains in the chromatographic system after a sample has been injected; it may be detected in future blank or unknown samples.
Precision and accuracy
Precision and Accuracy [28, 29] was evaluated at a Lower Quantification Limit (LLOQ), Low-Quality Control (LQC), Medium Quality Control (MQC), High-Quality Control (HQC) levels by replication analysis of quality control specimens (n=6). The level of CV (Cumulative Variance) should be less than 15%, except for LLOQ, where it should be less than 20%. The level of accuracy should be less than 115% except for LLOQ, where it should be less than 120%.
Stability
To determine the stability of the stock solution, we compared the analyte's area response in the stability samples [30, 31] with the region response of the sample taken from the fresh stock solution. Using six dosage replicates, the effects of Lower Quality Control (LQC) and Higher Quality Control (HQC) concentrations on plasma stability were evaluated. For an analyte to be considered stable, according to the US Food and Drug Administration (USFDA), its coefficient of variation must be less than 15%. We evaluated the shelf life (bench top stability) of injected rat plasma samples after 24 h of room temperature storage. Increasing the temperature of the rat plasma for 24 h at 2-8 °C allowed us to test its auto-sampler stability. To evaluate the auto sampler's stability, plasma extract samples were either injected right away or kept in the device at 2-8 °C for 24 h. A comparison was made between freshly injected quality control samples and those that had been frozen at-30 °C and thawed three times to determine their freeze-thaw stability. Both the low-quality and high-quality control concentrations were tested for freeze-thaw stability using six aliquots. The stability over time was assessed by comparing the concentration after 24 h to the initial concentration.
Pharmacokinetic study
The pharmacokinetic study protocol includes male Wister albino rats weighing approximately 200–250 gm, which were segregated into two groups (six rats in each group) [32]. The animals in the control group received 1 ml of diluent orally, while the animals in the treatment group received 1.67 mg/kg of Remogliflozin Etabonate and 0.17 mg/kg of Teneligliptin. The blood was collected at 0.5, 1, 1.5, 2, 3, 5, 10, 20, and 30 h of treatment through the retro-orbital puncher technique. At each time point, a capillary tube was used to collect 0.300 μL of blood from the retro-orbital plexus into centrifugal radioimmunoassay vials containing EDTA before being centrifuged for 20 min at 5000 rpm. (We took tmax and t1/2 values from online and by using these tmax and t1/2 values we chose time points. In this PK studies we used sample size of n=12, but we represented only six sample readings.
RESULTS AND DISCUSSION
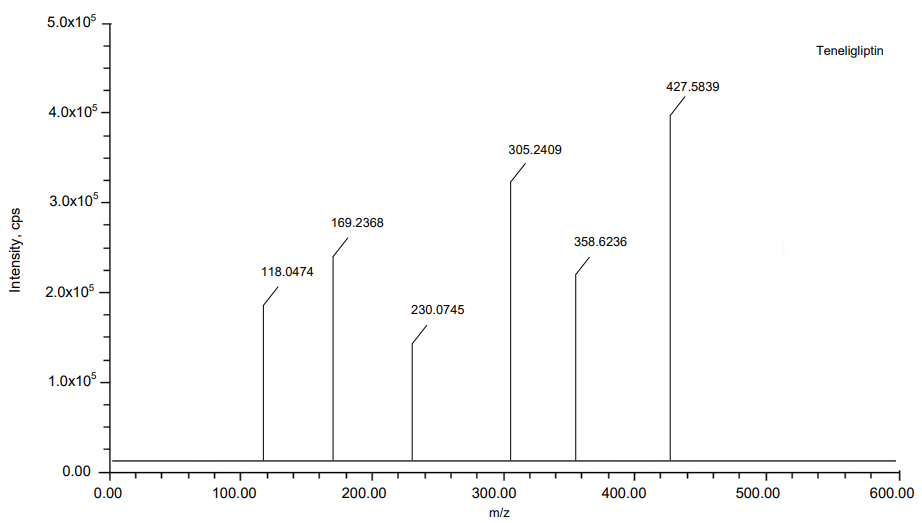
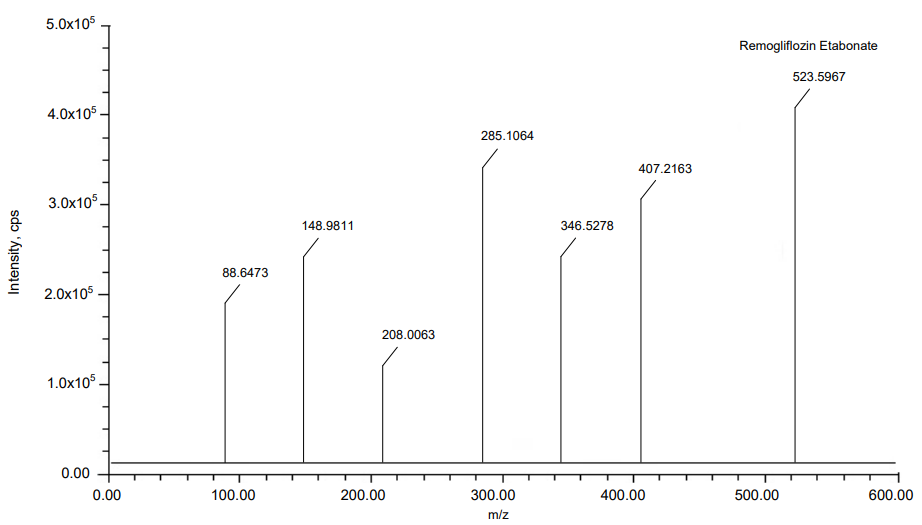
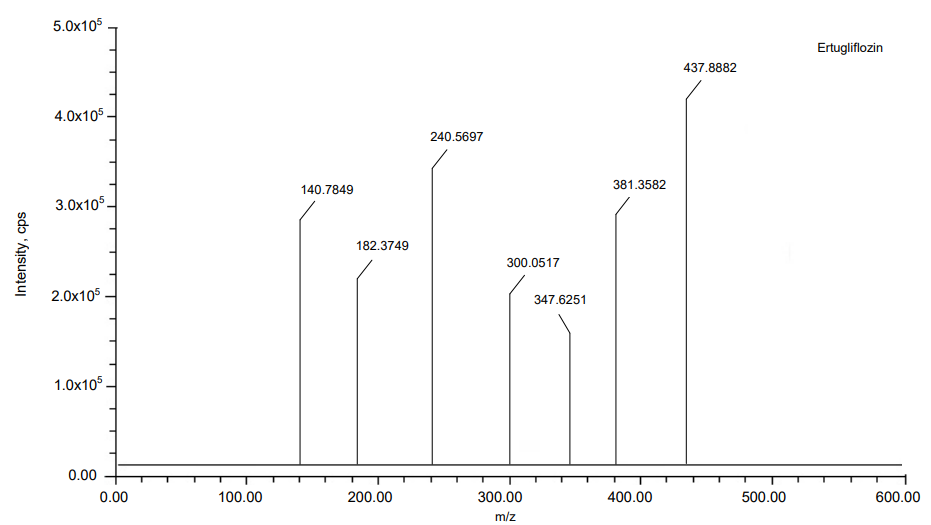
The MRM mode has been applied to Teneligliptin and Remogliflozin Etabonate to quantification of its ions. Ion pair scan of Teneligliptin and Remogliflozin Etabonate m/z 800.2 and m/z 745.4 formed major ions of [M+H]+at m/z 427.5839, m/z 305.2409 and m/z 523.5967, m/z 285.1064. In the same way, internal standard Ertugliflozin formed major ions of [M+H]+at m/z 437.8882, m/z 240.5697. Teneligliptin and Remogliflozin Etabonate give good positive ion response mode when resembling ion-negative mode. Fig. 1 show the details of the mass spectrum.
To acquire the best chromatographic conditions, we used different buffers with Acetonitrile as mobile phase in different ratios for isocratic, and gradient modes were tested. The mobile phase composition was modified at each trial to enhance the resolution and achieve acceptable retention times. Finally, 0.1% perchloric acid and Acetonitrile in isocratic mode at 70:30 v/v ratio was selected as a mobile phase because it gave a maximum response of the selected drugs. In the optimization method, we used different stationary phases like C18 and C8. From the different trials, we got good peak shapes of Teneligliptin and Remogliflozin Etabonate by using Zorbax SB C18 column of dimensions 250 mm x 4.6 mm, 5 μ connected to a PDA detector. Mobile phase flow rates were performed at 1 ml/min. By applying the above conditions, we got the retention times of Teneligliptin, Ertugliflozin and Remogliflozin Etabonate were 3.416 min, 5.459 min and 7.626 min, respectively. We get % CV of six replicate injections of Teneligliptin, Remogliflozin Etabonate were 1.63, 0.20; it indicates that the suggested strategy is very specific. The method under progress has been validated by following per USFDA guidelines [33, 34]. The system suitability results were shown in the following table 1.
A
B
C
Fig. 1: MS Spectras of (A) Teneligliptin, (B) Remogliflozin etabonate and (C) Ertugliflozin
Table 1: System suitability results
| S. No. | Name | Mean retention time (min)±Std Dev | Mean area±Std Sev | Mean USP resolution±Std Dev | Mean USP tailing±Std Dev | Mean USP plate count±Std Dev |
| 1 | Teneligliptin | 3.414±0.0425 | 215478±125.032 | 1.05±0.0547 | 5471±1.247 | |
| 2 | Ertugliflozin | 5.453±0.0843 | 3152046±374.185 | 8.67±0.0054 | 1.01±0.0062 | 9230±0.895 |
| 3 | Remogliflozin Etabonate | 7.621±0.1257 | 3204751±366.514 | 9.82±0.0087 | 0.98±0.0039 | 9548±1.156 |
(n=6)
Specificity
The method's specificity was shown by the simultaneous investigation of teneligliptin and remogliflozin etabonate. Fig. 2, 3 and 4 show the chromatograms of the standard and blank, respectively. There were no interference peaks in the chromatograms of the standard and blank rat plasma [35].
Matrix effect
The matrix effects [36] were investigated for six lots of different samples of plasma at the LQC and HQC levels were prepared from different lots of plasma (i. e., a total of 36 QC samples). Percent RSD (Relative Standard Deviation) for within the signal, ion suppression/enhancement was observed as 1.0 percent for Teneligliptin and Remogliflozin Etabonate in LCMS, suggesting that under these circumstances the matrix effect on analyte ionization is within an acceptable range of ionization. In matrix effect, LQC (Low Quality Control) and HQC (High Quality Control) of Teneligliptin were 96.35 and 97.76 and Remogliflozin etabonate were 95.80, 98.50%. %CV of the both drugs at LQC level were 0.99, 0.12 and HQC level is 1.89, 0.31, respectively. It indicates that the matrix effect on the ionization of the analyte is within the suitable limit.
Linearity
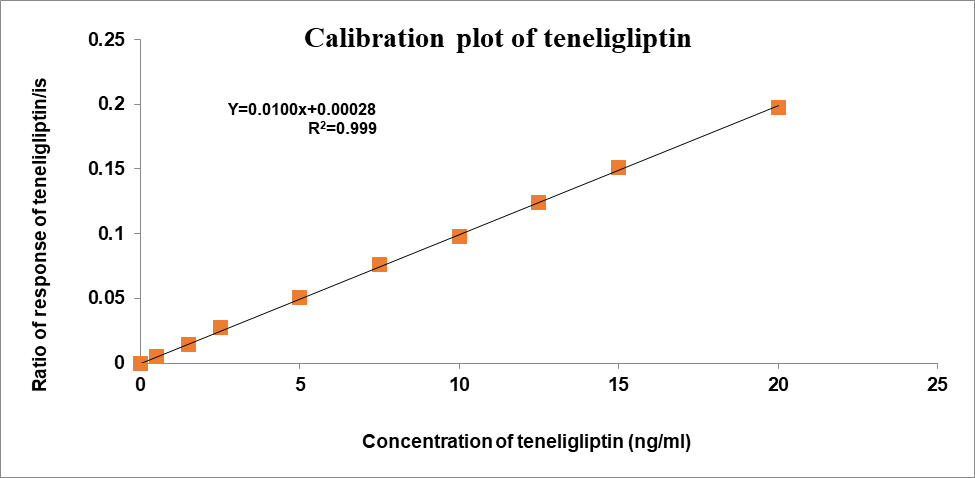
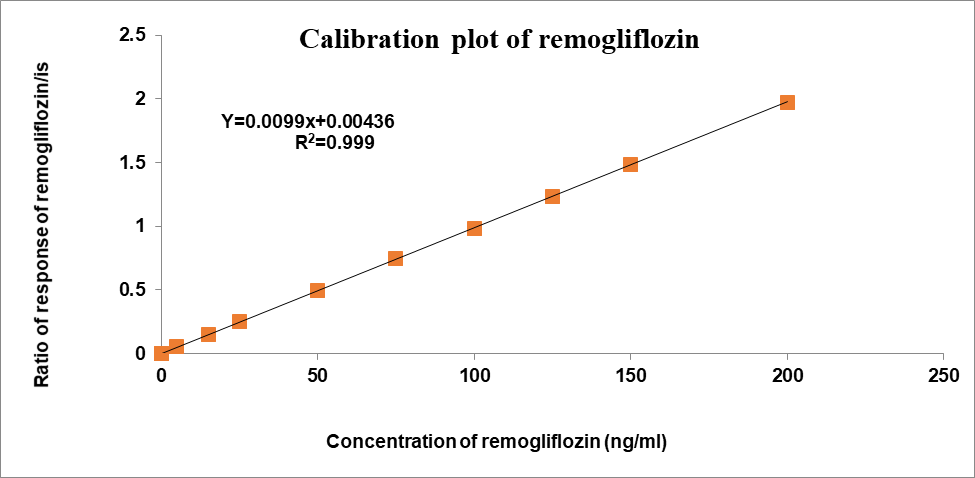
Concentration had a direct correlation with the peak area ratio of the standards used for calibration. Remogliflozin etabonate concentration ranges from 5-200 ng/ml and Teneligliptin have concentration ranges of 0.5-20 ng/ml using the least squares method. Table 2 shows the results of the linearity test for teneligliptin and remogliflozin etabonate, and fig. 4 shows the calibration plots for both drugs. Teneligliptin and remogliflozin etabonate both showed linear calibration curves with a correlation value of 0.999 [37].
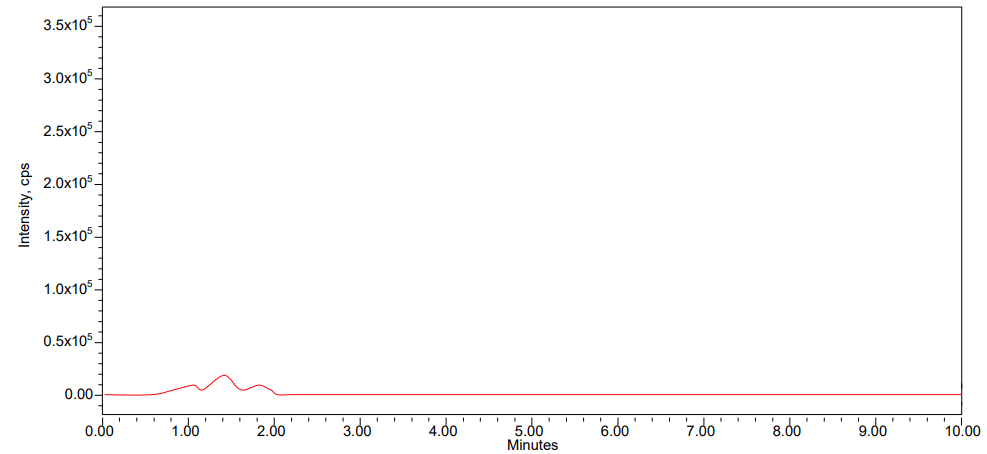
Fig. 2: Chromatogram of blank
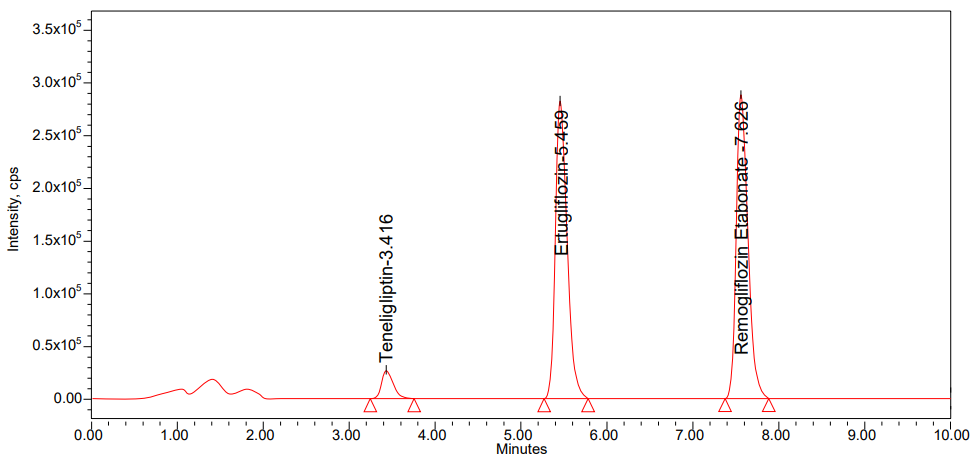
Fig. 3: Chromatogram of standard
Table 2: Results of linearity
| Linearity | Teneligliptin | Remogliflozin etabonate | ||
| Conc.(ng/ml) | Area response ratio | Conc.(ng/ml) | Area response ratio | |
| 1 | 0.50 | 0.005 | 5.00 | 0.054 |
| 2 | 1.50 | 0.015 | 15.00 | 0.152 |
| 3 | 2.50 | 0.027 | 25.00 | 0.252 |
| 4 | 5.00 | 0.051 | 50.00 | 0.496 |
| 5 | 7.50 | 0.076 | 75.00 | 0.748 |
| 6 | 10.00 | 0.098 | 100.00 | 0.982 |
| 7 | 12.50 | 0.124 | 125.00 | 1.233 |
| 8 | 15.00 | 0.151 | 150.00 | 1.488 |
| 9 | 20.00 | 0.197 | 200.00 | 1.973 |
| Slope | 0.0100 | Slope | 0.0099 | |
| Intercept | 0.00028 | Intercept | 0.00436 | |
| CC | 0.99948 | CC | 0.99996 | |
A
B
Fig. 4: Calibration plots of (A) Teneligliptin and (B) Remogliflozin etabonate
Table 3: Precision and accuracy of teneligliptin
| QC name | LLQC | LQC | MQC | HQC |
| Nominal Conc. (ng/ml) | 0.52 | 1.54 | 10.12 | 15.23 |
| Back calculated Conc. (ng/ml)±SD | 0.50±0.07 | 1.47±0.12 | 10.03±1.56 | 14.05±3.47 |
| %CV | 1.46 | 0.57 | 1.58 | 0.95 |
| Accuracy % | 95.41% | 95.41% | 97.88% | 97.29% |
(n=6)
Precision and accuracy
The accuracy and precision were determined by combining the individual test findings from several internal control samples. Based on the data that was supplied, it was clear that the plan was successful and precise. In tables 3 and 4, we can see the precise outcomes of teneligliptin and Remogliflozin etabonate. The accuracy of teneligliptin ranges from 95.41 to 97.29 on quality control samples, whereas the accuracy of remogliflozin etabonate ranges from 95.23 to 98.23. The complete internal control samples for teneligliptin and remogliflozin etabonate have a CV (Coefficient Variance) less than 5% [38].
Table 4: Precision and accuracy of remogliflozin etabonate
| QC name | LLQC | LQC | MQC | HQC |
| Nominal Conc. (ng/ml) | 5.15 | 15.34 | 100.58 | 150.74 |
| Back calculated Conc. (ng/ml)±SD | 5.02±2.36 | 15.22±3.29 | 98.87±7.69 | 149.46±15.64 |
| %CV | 0.64 | 0.24 | 0.31 | 0.46 |
| Accuracy % | 95.23% | 96.08% | 98.23% | 98.10% |
(n=6)
Recovery
The bioanalytical approach showed high extraction efficiency based on the recoveries [39] for teneligliptin and remogliflozin etabonate at the LQC, MQC, and HQC levels. This further demonstrated that the recovery was unrelated to focus. Teneligliptin had recoveries ranging from 95.41% to 98.00% and remogliflozin etabonate from 95.87% to 98.08% at LQC, MQC, and HQC levels, with teneligliptin's recoveries ranging from 0.57 to 1.57 and remogliflozin etabonate from 0.09 to 0.36. Good extraction efficiency was shown by the findings using the bioanalytical technique.
Ruggedness
Using two separate analysers and two separate columns, the percentage recoveries and percent CV of remogliflozin etabonate and teneligliptin were found to be within acceptable ranges in the HQC, LQC, MQC, and LLQC samples [40]. The method's findings demonstrated its robustness. Teneligliptin had a percent recovery range of 96.58% to 98.47% and remogliflozin etabonate from 96.03% to 98.20%. For teneligliptin, the %CV values were 0.94-1.29, and for Remogliflozin etabonate, they were 0.12-0.25. The method's findings demonstrated its robustness.
Auto sampler carryover
Blank rat plasma samples taken following several injections of LLQC and ULQC at the retention times of teneligliptin and remogliflozin etabonate did not show any peak area response of these drugs. Auto sampler carryover is not shown by this approach.
Stability
To conduct the solution stability investigation, teneligliptin and remogliflozin etabonate solutions were made using diluents and stored in a refrigerator at 2-8 °C. Stock solutions that were produced 24 h before to use were paired with fresh stock solutions. After twenty-four hours at room temperature and twenty-four hours in the auto sampler, the plasma stability of both the bench top and auto sampler remained constant. Teneligliptin and remogliflozin etabonate were shown to be stable at long-term stability (28 d at-80 °C), as revealed by future stability. Tables 5, 6 below provide the overall stability findings of teneligliptin and remogliflozin etabonate.
Table 5: Stability results of teneligliptin
| Stability experiment spiked plasma | Spiked plasma conc. (n=6, ng/ml) | Mean area (n=6) | Std dev | % CV | % Recovery |
| Bench top stability | LQC | 1.5 | 0.0409 | 0.00069 | 1.69 |
| MQC | 10 | 0.279 | 0.00459 | 1.65 | |
| HQC | 15 | 0.415 | 0.00303 | 0.73 | |
| Auto sampler stability | LQC | 1.5 | 0.0409 | 0.00059 | 1.43 |
| MQC | 10 | 0.279 | 0.00518 | 1.86 | |
| HQC | 15 | 0.414 | 0.00798 | 1.93 | |
| Long term (Day28) stability | LQC | 1.5 | 0.0399 | 0.00154 | 1.63 |
| MQC | 10 | 0.262 | 0.00032 | 1.12 | |
| HQC | 15 | 0.364 | 0.00071 | 1.04 | |
Wet extract stability (18 H) |
LQC | 1.5 | 0.0404 | 0.00047 | 1.17 |
| MQC | 10 | 0.272 | 0.387 | 1.42 | |
| HQC | 15 | 0.411 | 0.405 | 0.99 | |
Dry extract stability (18 H) |
LQC | 1.5 | 0.0400 | 0.00037 | 0.92 |
| MQC | 10 | 0.274 | 0.00354 | 1.29 | |
| HQC | 15 | 0.411 | 0.00327 | 0.80 | |
| Freeze thaw stability | LQC | 1.5 | 0.0410 | 0.00040 | 0.97 |
| MQC | 10 | 0.279 | 0.00306 | 1.10 | |
| HQC | 15 | 0.415 | 0.00634 | 1.53 | |
| Short term stability | LQC | 1.5 | 0.398 | 0.00062 | 1.57 |
| MQC | 10 | 0.267 | 0.00321 | 1.20 | |
| HQC | 15 | 0.401 | 0.00463 | 1.16 |
In vivo pharmacokinetic evaluation
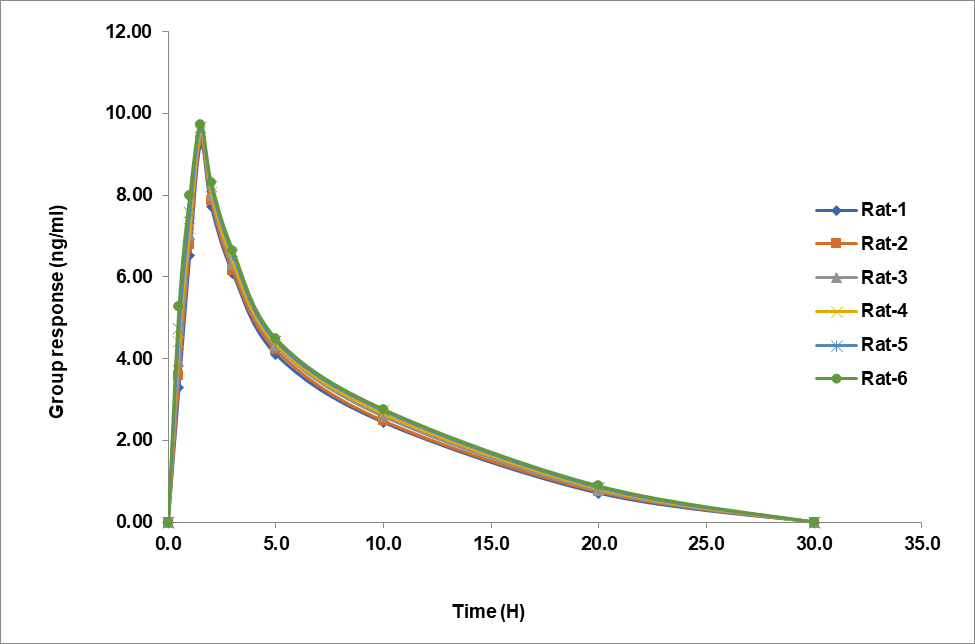
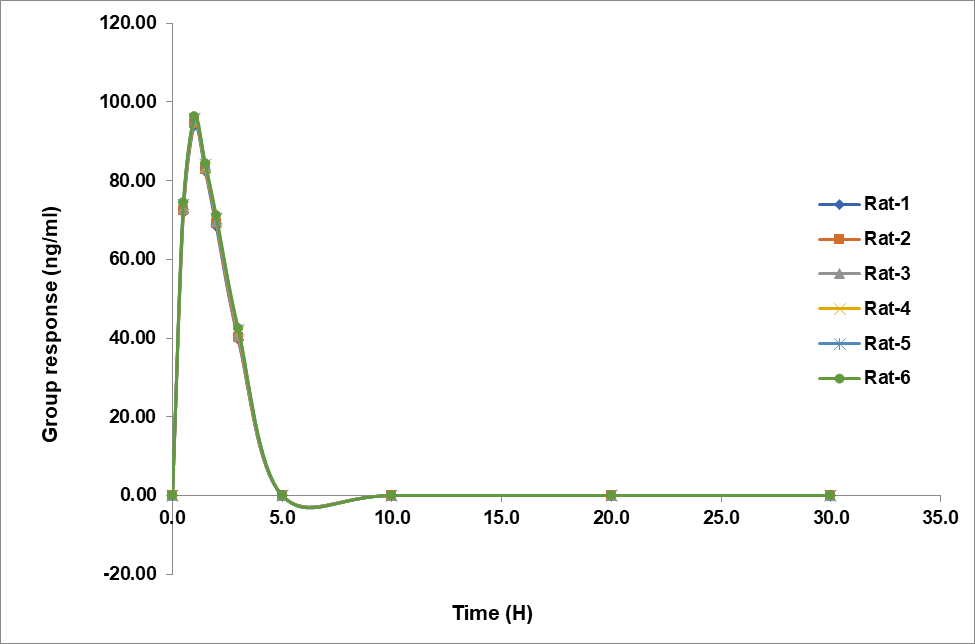
Fig. 4 shows the dynamics of teneligliptin and remogliflozin etabonate plasma concentrations over time in rats. Both experimental formulation scenarios showed a bell-shaped curve on the graph. The fact of teneligliptin and remogliflozin etabonate were detectable in the blood for 20 and 3 h, respectively, after oral treatment, suggests that the formulation successfully released the drugs.
The data is shown in table 7, which includes the computed pharmacokinetic parameters Cmax, Tmax, T1/2, Kel, Ka, AUC0-t, and AUC0-∞. Teneligliptin had a Cmax of 9.504 ng/ml and remogliflozin etabonate of 95.226 ng/ml. The half-life of remogliflozin etabonate was determined to be 1 hour and that of teneligliptin to be 1.5 h. Teneligliptin and remogliflozin etabonate had t½ values of 20 and 3 h, respectively. In table 6 we can see the teneligliptin and remogliflozin etabonate pharmacokinetic characteristics.
Table 6: Stability results of remogliflozin etabonate
| Stability experiment spiked plasma | Spiked plasma conc. (n=6, ng/ml) | Mean area (n=6) | Std dev | %CV | % Recovery |
| Bench top stability | LQC | 15 | 0.4076 | 0.00038 | 0.09 |
| MQC | 100 | 2.765 | 0.00896 | 0.32 | |
| HQC | 150 | 4.170 | 0.00797 | 0.19 | |
| Auto sampler stability | LQC | 15 | 0.4077 | 0.00102 | 0.25 |
| MQC | 100 | 2.771 | 0.01321 | 0.48 | |
| HQC | 150 | 4.176 | 0.00833 | 0.20 | |
Long term (Day 28) stability |
LQC | 15 | 0.3382 | 0.00205 | 0.35 |
| MQC | 100 | 2.675 | 0.00654 | 0.27 | |
| HQC | 150 | 3.898 | 0.00417 | 0.23 | |
Wet extract stability (18 H) |
LQC | 15 | 0.4073 | 0.00034 | 0.08 |
| MQC | 100 | 2.770 | 0.00931 | 0.34 | |
| HQC | 150 | 4.160 | 0.00525 | 0.13 | |
Dry extract stability (18 H) |
LQC | 15 | 0.4068 | 0.00055 | 0.13 |
| MQC | 100 | 0.765 | 0.00539 | 0.19 | |
| HQC | 150 | 4.159 | 0.00423 | 0.10 | |
| Freeze-thaw stability | LQC | 15 | 0.4078 | 0.00067 | 0.17 |
| MQC | 100 | 2.755 | 0.00797 | 0.29 | |
| HQC | 150 | 4.184 | 0.00789 | 0.19 | |
| Short-term stability | LQC | 15 | 0.3988 | 0.00048 | 0.12 |
| MQC | 100 | 2.713 | 0.00261 | 0.10 | |
| HQC | 150 | 4.038 | 0.00514 | 0.13 |
A
B
Fig. 4. Recovery plot (A) Teneligliptin and (B) Remogliflozin etabonate
Table 7: Pharmacokinetic parameters of teneligliptin and remogliflozin etabonate
| Pharmacokinetic parameters | Teneligliptin | Remogliflozin etabonate |
| AUC0-t (ng-h/ml) | 69±3.52 | 240 ±24.38 |
| Cmax (ng-h/ml) | 9.504±0.79 | 95.226±9.36 |
| AUC0-∞ (ng-h/ml) | 69±3.14 | 240±24.83 |
| Tmax (H) | 1.5±0.07 | 1±0.02 |
| T1/2 (H) | 20 ±3.48 | 3±1.11 |
Mean±SD (n=6), AUC0−∞: Area under the curve extrapolated to infinity, AUC0−𝑡: Area under the curve up to the last sampling time, Cmax: The maximum plasma concentration, Tmax: The time to reach peak concentration, T1/2: Time the drug concentration
CONCLUSION
A robust method was developed in the current study, which was comprehensively validated to quantify two drugs, Teneligliptin and Remogliflozin Etabonate, simultaneously in rat plasma using a cost-effective HPLC-ESI-LCMS/MS approach. This method will enable its application to pharmacokinetic studies and a blend of these drugs in pharmaceutical dosage forms and prospective new pharmaceutical formulations. This reproducible extraction technique and the optimized chromatography resulted in the ideal outcomes. The procedure captured is easy to adopt and was designed to ensure easy adaptability for future exploratory studies, early-phase clinical trials and therapeutic drug monitoring.
ACKNOWLEDGEMENT
P B Siddhartha College of Arts and Science administration has the author's gratitude for their support.
FUNDING
Nil
AUTHORS CONTRIBUTIONS
Bhargavi has collected the literature and information about the drug, Manikanta Rakesh and Pradeep carried out the research samples and Satyadev prepared the manuscript.
CONFLICTS OF INTERESTS
Declared none
REFERENCES
Qaseem A, Wilt TJ, Kansagara D, Horwitch C, Barry MJ, Forciea MA. Hemoglobin A1c targets for glycemic control with pharmacologic therapy for nonpregnant adults with type 2 diabetes mellitus: a guidance statement update from the American college of physicians. Ann Intern Med. 2018;168(8):569-76. doi: 10.7326/M17-0939, PMID 29507945.
Magkos F, Hjorth MF, Astrup A. Diet and exercise in the prevention and treatment of type 2 diabetes mellitus. Nat Rev Endocrinol. 2020;16(10):545-55. doi: 10.1038/s41574-020-0381-5, PMID 32690918.
Maslov IO, Zinevich TV, Kirichenko OG, Trukhan MV, Shorshnev SV, Tuaeva NO. Design synthesis and biological evaluation of Neogliptin a novel 2-azabicyclo [2.2.1]heptanes based inhibitor of dipeptidyl peptidase-4 (DPP-4). Pharmaceuticals (Basel). 2022;15(3):273. doi: 10.3390/ph15030273, PMID 35337071.
Abrahami D, Douros A, Yin H, Yu OH, Renoux C, Bitton A. Dipeptidyl peptidase-4 inhibitors and incidence of inflammatory bowel disease among patients with type 2 diabetes: population based cohort study. BMJ. 2018;360:k872. doi: 10.1136/bmj.k872, PMID 29563098.
Komolafe O, Buzzetti E, Linden A, Best LM, Madden AM, Roberts D. Nutritional supplementation for nonalcohol related fatty liver disease: a network meta-analysis. Cochrane Database Syst Rev. 2021;7(7):CD013157. doi: 10.1002/14651858.CD013157.pub2, PMID 34280304.
Loomba R, Wong VW. Implications of the new nomenclature of steatotic liver disease and definition of metabolic dysfunction associated steatotic liver disease. Aliment Pharmacol Ther. 2024;59(2):150-6. doi: 10.1111/apt.17846, PMID 38153279.
Dominguez Rieg JA, Xue J, Rieg T. Tubular effects of sodium glucose cotransporter 2 inhibitors: intended and unintended consequences. Curr Opin Nephrol Hypertens. 2020;29(5):523-30. doi: 10.1097/MNH.0000000000000632, PMID 32701600.
Gyimesi G, Pujol Gimenez J, Kanai Y, Hediger MA. Sodium-coupled glucose transport the SLC5 family and therapeutically relevant inhibitors: from molecular discovery to clinical application. Pflugers Arch. 2020;472(9):1177-206. doi: 10.1007/s00424-020-02433-x, PMID 32767111.
Surendranath Y, Krishnamanjari Pawar A. Stability indicating RP-UPLC method for the estimation of teneligliptin and remogliflozin. Ymer. 2024;23:1-15.
Menda J, Chintala V, Kanuparthy PR, Katari NK, Kowtharapu LP, Jonnalagadda SB. Quality by design tool assessed ultraperformance liquid chromatography method for the analysis of remogliflozin and teneligliptin in oral dosage form. ACS Omega. 2024;9(11):12553-63. doi: 10.1021/acsomega.3c04589, PMID 38524417.
David Blessing Rani J, Asha Deepti C. Method development, validation and forced degradation studies of new RP-HPLC method for simultaneous estimation of remogliflozin and teneligliptin in pure and tablet dosage form. IJPSR 2023;14:3452-61. doi: 10.13040/IJPSR.0975.8232.14(7).3452-61.
Prasanthi T, Rao A AL, Uha G. Development and validation of RP-HPLC method for simultaneous quantification of remogliflozin and teneligliptin in pure and tablet dosage form. IJRPC. 2023;13(1):75-9. doi: 10.33289/IJRPC.13.1.2023.13(15).
Jahnavi K, Sudhakar M, Parthiban C, Dixit DC. RP-HPLC method validation for the simultaneous estimation of remogliflozin and teneligliptin in bulk and pharmaceutical dosage form. Int J Res Pharm Pharm Sci. 2022;2(2):54-64.
Lad, Shailesh V, Luhar, Narkhede. Simultaneous estimation of Remogliflozin etabonate and Teneligliptin hydrobromide hydrate in tablet dosage form by RP-HPLC method. IJRD. 2023;8(4):82-90.
Patel R, Kotadiya R. Stability indicating green HPLC method for fixed-dose tablets containing remogliflozin etabonate and teneligliptin: an AQbD approach. Drug Dev Ind Pharm. 2024;50(8):750-62. doi: 10.1080/03639045.2024.2400199, PMID 39226128.
Ramadevi P, Rambabu K. Bio analytical method development and validation for ezetimibe and pitavastain and its applications to pharmacokinetic studies in rabbit plasma by using LCMS/MS. IJRPS. 2020;11(4):7854-62. doi: 10.26452/ijrps.v11i4.4670.
Eluru A, Surendra Babu K. Bio analytical method development and validation for aplidine in rat plasma and their pharmacokinetic studies by LCMS. WJPPS. 2019;8:1201-9.
Ramchandran D, Kethipalli A, Krishnamurthy M. Bio analytical method development and validation of daunorubicin and cytrarabine in rat plasma by LC-MS/MS and its application in pharmacokinetic studies. J Pharm Sci Res. 2020;12:381-6.
Naykode MD, Bhagwat DA, Jadhav SD, More HN. Analytical and bioanalytical method for quantification of pure azilsartan not its salts by RP-HPLC. Res J Pharm Technol. 2017;10(3):708-14. doi: 10.5958/0974-360X.2017.00133.0.
Singh M, Charde M, Shukla R, Rita MC. Determination of calcipotriene in calcipotriene cream 0.05% w/w by RP-HPLC method development and validation. Res J Pharm Technol. 2011;4(8):1219-23.
Malathi S, Arunadevi N. Development and validation of stability indicating simultaneous estimation of metformin and alogliptin in tablets by high-performance thin layer chromatography. Int J Pharm Pharm Sci. 2020;12(12):68-73. doi: 10.22159/ijpps.2020v12i12.33871.
Senthil Rajan D, Muruganathan G, Shivkumar K, Ganesh T. Development and validation of HPLC method for simultaneous quantification of vasicine glycyrrhizin and piperine in poly herbal cough syrup. Int J Curr Pharm Res. 2020;12:15-9.
Shanmugasundaram P, Kamarapu SK. RP-HPLC method for the simultaneous estimation and validation of amlodipine besylate and atenolol in bulk and tablet dosage form in biorelevant dissolution medium (Fassif). Res J Pharm Technol. 2017;10(10):3379-85. doi: 10.5958/0974-360X.2017.00601.1.
Gomathy S, Narenderan ST, Meyyanathan SN, Gowramma B. Development and validation of HPLC method for the simultaneous estimation of apigenin and luteolin in commercial formulation. J Crit Rev. 2020;7:4785-90.
Kumar SA, Debnath A, Rao JV, Sankar DG. Development and validation of a sensitive RP-HPLC method for simultaneous estimation of rosuvastatin and fenofibrate in tablet dosage form by using PDA detector in Gradient mode. Res J Pharm Technol. 2016;9(5):549-54. doi: 10.5958/0974-360X.2016.00104.9.
Malak Y, Al Bathish A, A, Gazy MK, El Jamal. Rp-HPLC and chemometric methods for the determination of two anti-diabetic mixtures; metformin hydrochloride canagliflozin and metformin hydrochloride gliclazide in their pharmaceutical formulation. Int J Pharm Pharm Sci. 2020;12(2):83-94. doi: 10.22159/ijpps.2020v12i2.35415.
Gadhvi MP, Bhandari A, Suhagia BN, Desai UH. Development and validation of RP-HPLC method for simultaneous estimation of atazanavir and ritonavir in their combined tablet dosage form. Res J Pharm Technol. 2013;6(2):200-3.
Prabhakara Rao K, Namburi l, A Amara babu, Kalyani Koganti, Babji Palakeeti, Koduri SV, Srinivas. Related substances method development and validation of an LC-MS/MS method for the quantification of Selexipag and its related impurities in rat plasma and its application to pharmacokinetic studies. SN Appl Sci. 2021;3:321. doi: 10.1007/s42452-021-04219-x.
Hasanah YI, Harahap Y, Suryadi H. Development and validation method of cyclophosphamide and 4-hydroxy cyclophosphamide with 4-hydroxy cyclophosphamide-D4 as internal standard in dried blood spots using UPLC-MS/MS. Int J Appl Pharm. 2021;13(2):148-52. doi: 10.22159/ijap.2021v13i2.39590.
Naveen VM, Veeraswami B, Srinivasa Rao G. High response bio-analytical validation approach of nadolol and bendroϑlumethiazide by LC-MS/MS on rat plasma. IJRPS. 2020;11(SPL4):2272-9. doi: 10.26452/ijrps.v11iSPL4.4454.
Kumari GK, Kantipudi R. Bioanalytical method development and validation for avapritinib in rat plasma by LC-MS/MS. J Pharm Sci Res. 2021;13(3):134-7.
Harsha K, Panchumarthy Ravisankar, Sathish Kumar Konidala. Application of newly developed and validated LC-MS/MS method for pharmacokinetic study of adagrasib and pembrolizumab simultaneously in rat plasma. J Chromatogr B. 2024;1241:124171. doi: 10.1016/j.jchromb.2024.124171.
Wichitnithad W, Nantaphol S, Vicheantawatchai P, Kiatkumjorn T, Wangkangwan W, Rojsitthisak P. Development and validation of liquid chromatography tandem mass spectrometry method for simple analysis of sumatriptan and its application in bioequivalence study. Pharmaceuticals (Basel). 2020;13(2):21. doi: 10.3390/ph13020021, PMID 31991540.
Monica W, Ammerman J, Lisio PD, Killmer J, Kyle D, Mainstone E. LC-MS/MS bioanalysis method development, validation and sample analysis: points to consider when conducting nonclinical and clinical studies in accordance with current regulatory guidances. J Anal Bioanal Tech. 2011;1(1):S4. doi: 10.4172/2155-9872.S4-001.
Baje Syed IB, Nannapaneni M. Bioanalytical validation method for capmatinib and spartalizumab in rabbit plasma by using highly effective mass spectrophotometric method. Rasayan J Chem. 2022;15(4):2748-55. doi: 10.31788/RJC.2022.1547098.
US Food and Drug Administration. Bioanalytical method validation: guidance for industry. Silver Spring, MD; 2018.
ICH guideline. M10 on Bioanalytical method validation and study sample analysis; 2023.
Vatsavayi JR, Revu NB. Method development and validation of a highly selective and specific positive polarity ESI-LC-MS/MS method for simultaneous determination of semaglutide and canagliflozin in human plasma. Int J Appl Pharm. 2025;17(3):312-21. doi: 10.22159/ijap.2025v17i3.53379.
Talari S, Vejendla A, Shetty RK. Development and validation of a UPLC-MS/MS method for the simultaneous determination of verapamil and trandolapril in rat plasma: application to a pharmacokinetic study. Curr Pharm Anal. 2022;18(3):291-304. doi: 10.2174/1573412917666210302145711.
Manoranjani M. LC-MS/MS method for simultaneous estimation of ethinyl estradiol and etonogestrel in rat plasma and its application to pharmacokinetic study. High Technol Lett. 2023;29:543-56.