
Int J App Pharm, Vol 17, Issue 6, 2025, 193-203Original Article
DEVELOPMENT AND VALIDATION OF HPLC METHOD FOR THE DETERMINATION OF RESVERATROL IN BULK DOSAGE FORM, COMMERCIAL TABLET, AND MULTIWALLED CARBON NANOTUBES-BASED FORMULATION
NEHA SHARMA1,2, YACHANA MISHRA3, NEELAM SHARMA2, VIJAY MISHRA1*
1School of Pharmaceutical Sciences, Lovely Professional University, Phagwara (Punjab)-144411, India. 2ASBASJSM College of Pharmacy Bela, Ropar-104111, India. 3School of Bioengineering and Biosciences, Lovely Professional University, Phagwara (Punjab)-144411, India
*Corresponding author: Vijay Mishra; *Email: vijaymishra2@gmail.com
Received: 09 May 2025, Revised and Accepted: 28 Aug 2025
ABSTRACT
Objective: Resveratrol (RES), a polyphenol, is a promising option to treat multiple diseases due to its anticancer, cardioprotective, anti-inflammatory, and antioxidant activities. The present study was designed to develop and validate a simple, precise, rapid and reproducible analytical method for the detection of RES in different formulations.
Methods: A novel analytical technique was developed and validated for the detection of RES via ultrafast liquid chromatography utilizing C18 column. Methanol along with high-performance liquid chromatography (HPLC) grade water (40:60) was used as a mobile phase with a rate of flow of 0.8 ml/min. This technique has been validated following the International Conference for Harmonization (ICH) Q2 (R1) guidelines. The method's accuracy was determined through the percent recovery within the limit of 95 to 105%.
Results: The method demonstrated linearity within the 2-10 µg/ml range, exhibiting a regression coefficient of 0.997. The precision of the method was indicated by the percentage RSD, which was recorded to be less than 2%. Limit of detection (LOD), and limit of quantification (LOQ) were found to be 1.6 µg/ml and 4.8 µg/ml, respectively. The proposed approach has been proved to be robust because the response did not significantly change due to a change in the rate of flow, along with the composition of the mobile phase.
Conclusion: The results of the study demonstrated that the developed method has passed all the validation test parameters and can be applied for the estimation of RES in bulk dosage form, commercial tablet, and developed multiwalled carbon nanotube (MWCNTs)-based formulations.
Keywords: Resveratrol, Multiwalled carbon nanotubes, HPLC, Validation
© 2025 The Authors. Published by Innovare Academic Sciences Pvt Ltd. This is an open access article under the CC BY license (https://creativecommons.org/licenses/by/4.0/)
DOI: https://dx.doi.org/10.22159/ijap.2025v17i6.54953 Journal homepage: https://innovareacademics.in/journals/index.php/ijap
INTRODUCTION
Resveratrol (RES), specifically trans-3,4',5-trihydroxystilbene, is an inherent poly-phenolic compound that can be found in various food sources, predominantly in red grapes (fig. 1). Resveratrol, a highly effective antioxidant, is primarily found in the skin of the grape [1, 2]. A minor quantity of trans-RES can also be found within the seed and core of grapes. The trans-RES is derived from Polygonum cuspidatum, a botanical species indigenous to China and Japan [3-5]. In recent years, there has been a notable increase in the interest and focus of health professionals, diet nutritionists, and medical chemists on trans-RES primarily due to the numerous advantageous outcomes associated with it, such as its ability to inhibit the formation of new blood vessels, modulate the immune system, combat microbial infections, affect the nervous system, prevent the development of cancer, regulate blood sugar levels, and mitigate the risk of cardiovascular diseases, reduce inflammation, works against free radicals [6-13].
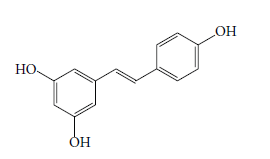
Fig. 1: Chemical structure of trans-RES [3]
RES is present in both cis-and trans-isomeric forms, but the trans-isomer is a predominant and physiologically active variant. The compound undergoes rapid metabolism by phase II enzymes in the gastrointestinal tract and hepatic tissues [14, 15]. The poor solubility of the RES (less than 0.05 mg/ml) in aqueous medium can be attributed to its enzymatic structure, potentially impacting its consumption [16, 17]. The excretion of total urinary metabolites following the administration of 14C labeled RES demonstrated that RES was given either orally or intravenously, resulting in an increased rate of absorption of approximately 70%. However, it exhibited significant metabolic activity, leading to the accumulation of sulphate glucuronides [18]. A scientific framework called the biopharmaceutics classification system (BCS) is used for categorized the drugs according to their permeability and solubility [19, 20]. Regardless of its limited aqueous solubility, RES demonstrates significant permeability across membranes and can be classified under BCS Class-II drugs [16, 17]. The plasma half-life of RES is relatively brief, estimated to be approximately 8-14 min. The quick and extensive presystemic metabolism of this compound results in a significantly low oral bioavailability [1, 18]. The utilization of multi-walled carbon nanotubes (MWCNTs) in the context of targeted drug delivery has emerged as a highly promising approach [21-23].
Carbon nanotubes (CNTs) have garnered considerable interest owing to their distinctive mechanical, electrical, and thermal characteristics. The remarkable characteristics of CNTs render them effective in several applications, including electronics, optics, and medicines. CNTs demonstrate toxicity via various pathways, impacting allergies, fibrosis, organ dysfunction, neurological damage, liver toxicity, renal toxicity, and lungs toxicity. Nonetheless, apprehensions regarding the possible toxicity of carbon nanotubes have Furthermore, concerns have been elevated, necessitating thorough studies to elucidate their impacts on people's health along with the ecosystem. Numerous research has examined the toxicity of CNTs, with results varying based on aspects like as surface chemistry, shape, size, and exposure route [24-27]. Mohammadi and co-worker studied the toxicological parameter of CNTs and suggested that due to lipophilic nature, the pristine CNTs are more susceptible for agglomeration and issues in dispersibility when exposed to biological systems, so they are more toxic. Functionalized CNTs, like those containing carboxyl (–COOH) or amine (–NH₂) groups, are frequently less harmful since changing the surface makes them more soluble, less prone to form cluster together, and more compatible with biological fluid [27].
Table 1: Toxicity comparison between pristine CNTs and functionalized CNTs
| S. No. | Observed toxicity | Pristine CNTs | Functionalized CNTs | References |
| Cytotoxicity | Particular among pulmonary and hepatic cells | Generally lower, however, it varies for each group. | [27, 28] | |
| Oxidative stress | Elevated, resulting in cellular damage | Minimized, particularly with carboxylic acid groups | [27] | |
| Inflammation response | Persistent release of interleukin 6 (IL-6) and IL-8 cytokines | Less severe or contingent upon cell type | [28] | |
| Genital toxicity | Prominent in male mice. | Lowering upon COOH-functionalization | [27] | |
| Genotoxicity | Deoxyribonucleic acid (DNA) mutations detected | Persisting, although with lower intensity | [28] |
To comprehensively evaluate the t-RES-loaded MWCNT (t-RES-MWCNT) formulation, it is essential to confirm the successful loading of t-RES into MWCNTs by different techniques like X-ray diffraction (XRD), differential scanning calorimetry (DSC), and loading efficiency. The assessment of loading efficiency is a crucial factor for estimating the effective development of CNT-based formulations. The progress in nanotechnology-based delivery systems and their sophisticated pharmacokinetics entail strict monitoring of the quality of these dosage forms to ensure both their efficacy and safety [29, 30].
Several chromatographic techniques, including high-performance liquid chromatography (HPLC), liquid chromatography-mass spectrometry (LC/MS), fluorometric, and electrochemical detection approaches, were documented to evaluate the amount of t-RES in various fruits along with nanoparticle formulation [1, 21, 23, 31, 32]. Nevertheless, the HPLC procedures that have been reported suffer from various drawbacks, such as elevated flow rates [33, 34], complex elution gradient [35, 36], and the presence of buffer solutions in the mobile phase.
Currently, RES is widely utilized in clinical practice and therapy. The present work aims to develop and evaluate t-RES-MWCNT. Furthermore, there have been no reported techniques thus far for determining the amount of RES in CNTs. Therefore, it is essential to have an accurate and validated analytical technique for measuring the amount of RES in bulk, commercially accessible tablets, and t-RES-MWCNT. In this study, the approach is assessed for its accuracy, precision, robustness, and ability to measure force deterioration, among other validation characteristics, following the guidelines set by the International Council for Harmonisation (ICH).
MATERIALS AND METHODS
Materials
The t-RES was purchased from Roseburg, USA. HPLC-grade methanol and water were procured from Rankem, Maharashtra, India. Carboxylated MWCNTs (COOH-MWCNTs) were purchased from Machenahalli, Karnataka, India.
Chromatographic conditions and instrumentation
The HPLC (Waters, USA) instrument consists of a single pump 515, UV/Vis light detector 2489 along with a Rheodyne injector. The chromatography process was separated by using a Waters C18 column (250 mm×4.6 mm I. D., 5 µm) at room temperature. Octadecylsilane, known as C18, consists of 18 carbon atoms. In contrast, Octylsilane (C8) consists of only 8 carbon atoms that are bound to silicon (Si) in the column parking. C18 has superior resolution compared to C8 [30]. The collection and processing of the results were conducted using Waters Empower 3 software. Prior to the finalization of the mobile ratio, many ratios of methanol to water were tested, specifically 60:40, 50:50, 40:60, and 20:80. The rate of flow of the system was adjusted to 0.8 ml/min, while the mobile phase ratio remained isocratic at 40% methanol and 60% water. The analyses were performed at 308 nm and injection volume was set at 10 µl.
Safety measures
In order to prevent photochemical isomerization from the trans-to cis-form, all analyses were conducted under low light conditions and the samples were maintained at room temperature while being shielded from light.
Stock solution preparation and calibration curve
A precise measurement of 10 mg of t-RES was carefully shifted to a 10 ml capacity volumetric flask. Initially, 2 ml methanol was introduced and thoroughly agitated until the drug was completely dissolved after that final volume was adjusted to 10 ml (stock solution I-1000 µg/ml). Now withdraw 1 ml of stock solution I in a 10 ml volumetric flask with further volume made up to 10 ml (stock solution II-100 µg/ml). Now from stock solution II 0.2, 0.4, 0.6, 0.8, and 1 ml volume was withdrawn to get five standard concentrations ranging from 2-10 µg/ml, respectively. HPLC analysis was performed for the prepared dilutions. The stock samples were preserved in a dark, cool environment, typically at-80 ºC until analysis [37]. Using the area of the peak as a point of reference, the curve for calibration was produced, with concentration along the X-axis and peak area along the Y-axis. After injecting the samples six times, the average peak area for each concentration can be determined. Using this HPLC method, the calibration curve's slope, intercept, and correlation coefficient can be calculated with greater precision [38].
Method validation
Following the ICH guidelines, the validation procedure for improving the performance of the HPLC method was carried out. During the validation process, many parameters such as precision, accuracy, range, linearity, robustness, limit of detection (LOD) and limit of quantification (LOQ) were investigated and evaluated [39].
System suitability
An evaluation of the chromatographic system must be carried out before carrying out sample analysis to ensure that it satisfies the predefined criteria for the applicability of the system. It is essential to do this evaluation to enhance the accuracy as well as precision of the HPLC method that has been established. To determine whether or not a system is suitable for its intended purpose, a variety of parameters, such as tailing factors, the theoretical plate number, the height of the theoretical plate, LOD, and LOQ, must first be evaluated [40, 41].
Limit of detection and limit of quantification
The detection and quantification limits were determined with the help of a calibration curve that was derived from five standard solutions containing the t-RES at concentrations that were relatively close to these limit values. The standard solutions had concentrations ranging from 2 to 10 µg/ml. The LOD and LOQ were determined using the following equations:
 …….. (1)
 ……. (2)
where 𝜎 represents the standard deviation of the response, while S represents the slope of the calibration curve [42].
Range and linearity
With five different concentrations of t-RES solutions ranging from 2 to 10 µg/ml, the calibration curve was developed. To verify overall linearity, plotted the peak area against the standard concentration while implementing the least squares approach to generate a line of regression. The acquired data were analyzed using Microsoft Excel and the least squares approach for linear regression [43].
Accuracy
To evaluate the procedure’s accuracy, we calculated the percentage of the initially injected drug that was successfully recovered from the processed samples. The accuracy of the developed approach was evaluated by analyzing nine samples. Test samples (Marketed tablet and Pure t-RES along with t-RES-MWCNT formulation) with a reported amount of 6 µg/ml were enriched with three distinct levels, specifically 80%, 100%, and 120%. Further, percentage recovery was calculated [44].
Precision
The precision study encompasses two aspects: repeatability, which refers to measurements taken within the same day (intra-day), and intermediate precision, which pertains to measurements taken on different days (inter-day). The six samples of low-quality control (LQC), medium quality control (MQC), and high-quality control (HQC) were injected six separate times using identical experimental parameters on a single day. The concept of intermediate precision encompasses three components: intraday precision, inter-day precision, and inter-analyst precision. The inter-day studies involved via injecting of LQC, MQC, and HQC samples six times over a period of three consecutive days. Intra-day analysis was conducted by injecting LQC, MQC, and HQC samples six times at various intervals within the same day. Inter-analyst analysis was performed by different analysts, each injecting LQC, MQC, and HQC samples six times. The experiments were conducted with precision under identical conditions on the same day [45].
 ……. (3)
Robustness
The method's robustness was assessed through the implementation of slight modifications in the experimental parameters, including variations in the rate of flow (1.2, 1, and 0.8 ml/min) and the ratio of the mobile phase components (methanol: water) at different proportions (42:58, 40:60, and 38:62 v/v) along with change in column temperature and mobile phase pH. Six independent runs of the method's medium concentration, specifically 6 mg/ml, were injected, and the resulting percentage recovery, peak area, and retention time were recorded [46].
Force degradation studies
The method's specificity was assessed by subjecting a drug solution with a known concentration to various circumstances including exposure to 1 ml of each acidic (0.1 M HCl for 24h), basic (0.1 M NaOH for 24h), oxidizing (30% H2O2 v/v for 24h), thermal stress at 50 ºC for 24h and photolytic degradation (for 24h). The solutions obtained were diluted and treated accordingly, and subsequently examined for the presence of the drug peak along with any degradation product [44].
Development of t-RES-MWCNT formulation
In this experiment, 250 mg of MWCNTs were dispersed in a 20 ml methanolic solution, further incorporating 250 mg of t-RES. The dispersion was agitated with magnetic stirring (Remi, India) at 150 rpm for 48h at 25±2 °C. The process was conducted in a dark environment to minimize light interference. After 48h the drug loaded samples were centrifuged at 10,000 rpm for 30 min, washed them three times using deionized water, and then dried in a desiccator for 48h. No residual drug remained in the wash supernatants [21, 46]. Percent drug loading efficiency was determined using following equation:
 ……. (4)
Characterization of t-RES-MWCNT formulation
Differential scanning calorimetry (DSC)
Thermal analysis was performed for given sample by using a DSC (Perkin Elmer DSC 6000)Q10 at the range of temperature 20 to 400 °C with rate of heating was 10 °C/min for the determination of melting point and drug interactions [47, 48].
X-ray diffraction (XRD)
An automatic Bruker D8 (Bruker Corporation, Billerica, MA, USA) AdvanA sophisticated diffractometer was utilized to produce X-ray diffraction patterns in reflection using nickel-filtered Cu– Kα radiation. The 2θ range used to record patterns was 10–80°, with 2θ being the highest diffraction angle [49].
Fourier transform infrared spectroscopy (FTIR)
Fourier Transform Infrared (FTIR) Spectroscopy (PerkinElmer Spectrum IR Version 10.6.1, CT, USA) was used to collect spectrum of t-RES, COOH-MWCNT, and t-RES-MWCNT to analyze their chemical structures and identify the functional groups and chemical bonds. The samples were scanned from 4000 to 400 cm-1using the potassium bromide (KBr) pellets method [50].
Field emission scanning electron microscopy (FE-SEM)
Field emission scanning electron microscopy (FE-SEM) (JEOL, JSM-7610F Plus, Tokyo, Japan) was used to examine the surface morphology of t-RES, COOH-MWCNT, and t-RES-MWCNT. The sample was placed onto a metallic stub while covered with gold sputtering under vacuum. The images were taken at suitable magnification [51, 52].
In vitro drug release
In vitro release study was performed by equilibrium dialysis tube diffusion technique. The t-RES (25 mg), and t-RES-MWCNT (equivalent to 25 mg of t-RES), were mixed with 5 ml of suitable solvent separately. The mixture was then placed into a dialysis bag with a molecular weight cutoff of 8-10 kDa (Spectra/Por®) and sealed hermetically on both ends. The dialysis membrane was thereafter immersed in 50 ml of dissolution medium at pH 7.4. Strict sink conditions were maintained by placing the dialysis bag inside the receptor medium at constant stirring (100 rpm) with a magnetic stirrer. The study was conducted at a temperature of 37±1 °C. To keep the sink condition, a fresh medium was added after sampling the aliquot at various intervals. Test samples were collected periodically and examined using HPLC [16].
RESULTS AND DISCUSSION
Optimization of developed method
A HPLC approach has been established for the purpose of quantitative estimation of t-RES in MWCNTs-based formulation, following the guidelines of good laboratory practices (GLP). The optimization experiments were conducted employing a Waters C18 column, wherein various ratios of methanol and water were tested. The mobile phase was optimized to consist of 40% methanol and 60% water at a flow rate of 0.8 ml/min. In the given conditions of experimentation, t-RES was observed to elute at a retention time of 11.351 min (fig. 2). The method was successfully validated across the concentration range of 2-10 𝜇g/ml.
System suitability
In order to ensure the practicality and sufficiency of the suggested approach for estimating t-RES in routine pharmaceutical applications, as well as to validate the column efficiency and chromatographic repeatability, a series of system suitability tests were carried out (table 2). It was found that the percent relative standard deviation (%RSD) of peak areas after six successive injections was below 2%, indicating ideal reproducibility of injections and optimal chromatographic and environmental conditions. The t-RES exhibited a tailing factor of 1.2±0.026, indicating ideal peak symmetry. The observed values corresponding to the theoretical plate number exhibited acceptable column efficiency.
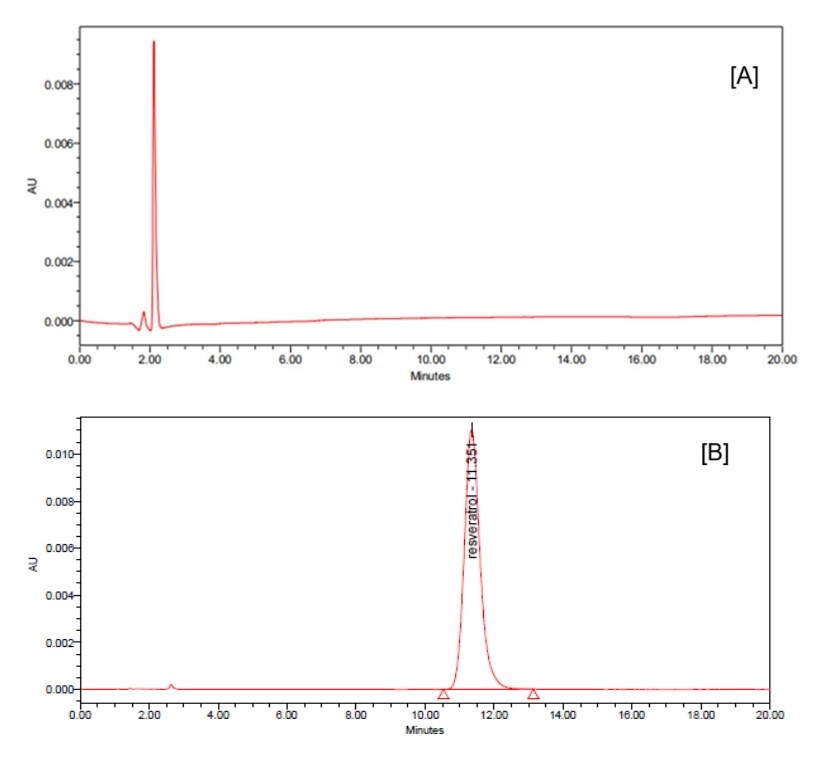
Fig. 2: Chromatogram of [A] Blank and [B] t-RES
Table 2: System suitability parameters
| S. No. | Parameter | Value |
| 1 | Theoretical plates | 3060±0.094 |
| 2 | Retention time (min) | 11.351±0.026 |
| 3 | Tailing factor | 1.2±0.026 |
Limit of detection (LOD) and limit of quantification (LOQ)
The calculated LOD for t-RES was found to be 1.6 µg/ml whereas, LOQ determined for t-RES was 4.8𝜇g/ml.
Range and linearity
The linearity of t-RES was assessed within the concentration ranges from 2 to 10 𝜇g/ml. During this evaluation, the equation of regression along with its coefficient (r2) was estimated. The data was acquired using the least squares method (fig. 3). The r2 value was 0.997, which typically interpreted that the data fit well with the regression line and the line was linear over the proposed concentration range.
Accuracy
The method's accuracy was assessed by determining the average percentage recovery of the drug from the LQC, MQC, and HQC samples. The data indicated that the mean percentage recovery for all three levels fell within the specified range of 95 to 105% (table 3). This finding suggests that the developed method exhibited a high level of accuracy.
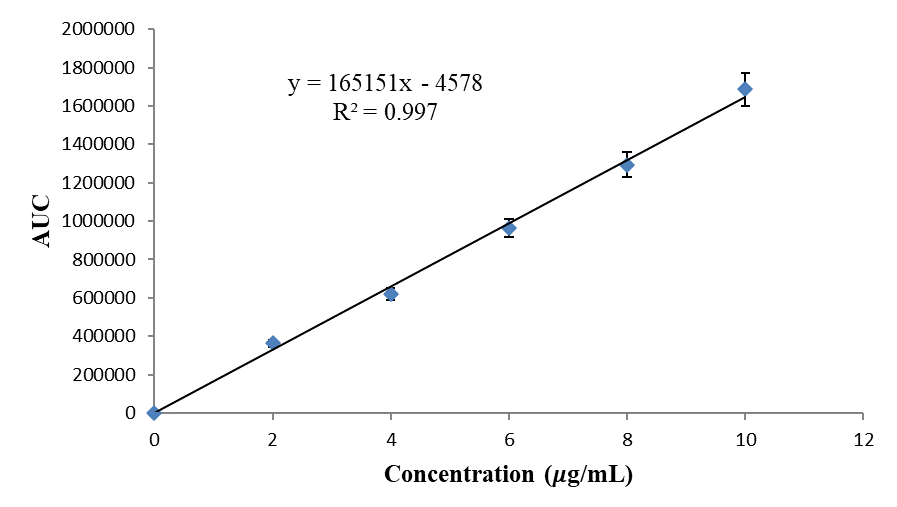
Fig. 3: Calibration curve of t-RES
Table 3: Results of accuracy study
| Dosage form | Level of addition (in percentage) | % Recovery |
| Bulk drug | 80 | 101.71±0.16 |
| 100 | 103.42±0.11 | |
| 120 | 99.34±0.32 | |
| Marketed tablet | 80 | 95.54±0.14 |
| 100 | 95.89±0.15 | |
| 120 | 97.62±0.17 | |
| t-RES-MWCNT | 80 | 100.74±0.42 |
| 100 | 104.84±0.56 | |
| 120 | 103.56±0.21 |
(n=6); t-RES-MWCNT: t-RES loaded MWCNT
Precision
Six replicate injections of three distinct levels of LQC, MQC, and HQC were applied to assess the RSD to confirm the precision of the approach method. Further evaluation was done by considering three different parameters, which include inter-analyst, intra-day, and inter-day. These parameters were estimated under identical experimental conditions. The investigation's findings indicate that the proposed approach demonstrated a notable degree of accuracy, as seen by the percentage relative variance remaining below 2% (table 4a, 4b, 4c).
Table 4a: Intraday precision
| Level | Standard solution (µg/ml) | Area | Mean AUC (cm2) | SD (±) | % RSD | |||||
| 1 | 2 | 3 | 4 | 5 | 6 | |||||
| LQC | 4.8 | 812743 | 817568 | 815250 | 829176 | 817537 | 810423 | 817116.2 | 6530.3 | 0.79 |
| MQC | 6 | 961082 | 969475 | 968483 | 963820 | 961540 | 969029 | 965571.5 | 3876.7 | 0.40 |
| HQC | 7.2 | 1081414 | 1086429 | 1084470 | 1096246 | 1083629 | 1089818 | 1087001 | 5342.7 | 0.49 |
Table 4b: Interday precision
| Level | Standard solution (µg/ml) |
Area | Mean AUC (cm2) | SD (±) | % RSD | |||||
| 1 | 2 | 3 | 4 | 5 | 6 | |||||
| Day 1 | ||||||||||
| LQC | 4.8 | 825575 | 829865 | 829075 | 821964 | 827469 | 829116 | 827177.3 | 2980.4 | 0.36 |
| MQC | 6 | 966186 | 955361 | 958196 | 951945 | 959570 | 966969 | 959704.5 | 5935.5 | 0.61 |
| HQC | 7.2 | 1085706 | 1089133 | 1088209 | 1084569 | 1088767 | 1089649 | 1087672 | 2050.5 | 0.18 |
| Day 2 | ||||||||||
| LQC | 4.8 | 812719 | 815564 | 812299 | 813695 | 817469 | 819116 | 815143.7 | 2736.2 | 0.33 |
| MQC | 6 | 967324 | 969974 | 969974 | 966479 | 962992 | 965329 | 967012 | 2717.3 | 0.28 |
| HQC | 7.2 | 1080183 | 1084325 | 1081780 | 1088911 | 1084208 | 1085714 | 1084187 | 3049.4 | 0.28 |
| Day 3 | ||||||||||
| LQC | 4.8 | 813282 | 817956 | 817616 | 810070 | 815356 | 818153 | 815405.5 | 3222.4 | 0.39 |
| MQC | 6 | 967412 | 962065 | 965682 | 969643 | 962178 | 966969 | 965658.2 | 3023.1 | 0.31 |
| HQC | 7.2 | 1080317 | 1087255 | 1081766 | 1089814 | 1085623 | 1087541 | 1085386 | 3649.6 | 0.33 |
Table 4c: Intermediate precision
| Level | Standard solution (µg/ml) | Area | Mean AUC (cm2) | Std. Dev. (±) | % RSD | |||||
| 1 | 2 | 3 | 4 | 5 | 6 | |||||
| Inter analyst 1 | ||||||||||
| LQC | 4.8 | 805648 | 804572 | 806650 | 802368 | 806954 | 807772 | 805660.7 | 1956.3 | 0.24 |
| MQC | 6 | 961427 | 961746 | 968058 | 965432 | 962914 | 960580 | 963359.5 | 2850.7 | 0.29 |
| HQC | 7.2 | 1085554 | 1082879 | 1087499 | 1085423 | 1088149 | 1087328 | 1086139 | 1938.3 | 0.18 |
| Inter analyst 2 | ||||||||||
| LQC | 4.8 | 812258 | 817235 | 816521 | 818944 | 814540 | 819872 | 816561.7 | 2817.7 | 0.34 |
| MQC | 6 | 968769 | 962587 | 964723 | 961139 | 964765 | 966382 | 964727.5 | 2703.1 | 0.28 |
| HQC | 7.2 | 1082369 | 1086421 | 1083215 | 1089852 | 1086821 | 1086251 | 1085822 | 2701.9 | 0.25 |
| Inter analyst 3 | ||||||||||
| LQC | 4.8 | 810208 | 818356 | 817456 | 812532 | 816892 | 819348 | 815798.7 | 3605.7 | 0.44 |
| MQC | 6 | 967894 | 968523 | 964221 | 962321 | 968998 | 961427 | 965564 | 3329.1 | 0.34 |
| HQC | 7.2 | 1082569 | 1085922 | 1087865 | 1086310 | 1089521 | 1086932 | 1086520 | 2323.7 | 0.21 |
(n=6); LQC: Low-quality control; MQC: Medium quality control; HQC: High-quality control; AUC: Area under the curve; RSD: Relative standard deviation
Robustness
The RSD of the results, calculated by adjusting the mobile phase ratio and flow rate marginally, was found to be below 2%. This suggests that the developed method exhibited a high level of robustness (table 5).
Force degradation studies
The analysis demonstrated that the devised approach successfully distinguished the analyte peak from the degradation products (table 6). The chromatograms obtained from the forced degradation study, which involved subjecting the sample to various stress conditions such as acid, base, photo, oxidative, and thermal stress, showed distinct peaks for both the analyte and the degradants. This indicates that the established approach is specific and can accurately differentiate between the analyte and its degradation products. The t-RES had the highest resistance to acid treatment, but was particularly susceptible to alkali treatment (fig. 4B and 4C).
Table 5: Results of robustness study
| Variable | Value | Concentration (µg/ml) | Average AUC (mean± SD) | % Recovery | RT (min) | % RSD |
Flow rate (ml/min) |
0.8 | 6 | 965001.5±1764 | 97.7 | 11.024 | 0.45 |
| 1.0 | 6 | 985803.3±3155 | 99.9 | 11.028 | 0.12 | |
| 1.2 | 6 | 994796.2±1389 | 100 | 10.566 | 0.32 | |
Mobile phase (Methanol: Water) |
42:58 | 6 | 947077.7±2457 | 97.8 | 11.023 | 0.16 |
| 40: 60 | 6 | 965393.3±2670 | 96.03 | 11.042 | 0.13 | |
| 38:62 | 6 | 984381±2967 | 99.8 | 10.842 | 0.31 | |
| Column temperature (°C) | 25 | 6 | 973924.7±1141 | 99.45 | 11.034 | 0.17 |
| 30 | 6 | 990342.5±1034 | 98.67 | 11.543 | 0.19 | |
| 35 | 6 | 963346.6±1581 | 97.31 | 11.273 | 0.44 | |
Mobile phase pH |
2.8 | 6 | 985430.23±1432 | 99.53 | 11.023 | 0.25 |
| 3.0 | 6 | 966643.65±1101 | 98.65 | 11.340 | 0.37 | |
| 3.2 | 6 | 995432.55±2910 | 99.78 | 11.072 | 0.29 |
(n=6); AUC: Area under the curve, RT: Retention time, RSD: Relative standard deviation
Table 6: Results of force degradation studies
| Stress applied | % mean recovered ±SD |
| Untreated sample | 100±0.45 |
| Acid treatment HCl (0.1M, 24h) | 97.23±0.66 |
| Alkali treatment NaOH (0.1M, 24h) | 70.21± 0.26 |
| Light exposure (24h) | 91.43±0.77 |
| Treatment with H2 O2(30% v/v, 24h) | 85.53±0.85 |
| Thermal treatment (50 °C, 24h) | 83.21±0.82 |
(n=6); HCl: Hydrochloric acid; NaOH: Sodium hydroxide; H2O2: Hydrogen peroxide

Fig. 4: Chromatogram of (A) Untreated sample, (B) Acid treatment, (C) Alkali treatment, (D) Light exposure, (E) H2O2 treatment, and (F) Thermal treatment
Drug loading
The developed HPLC method was implemented to determine the drug t-RES loading in MWCNTs. The % drug loading was found to be 96.25%. The results of this study offer empirical support for the validity of the developed methodology in measuring the concentration of t-RES in MWCNT-based formulation.
In vitro release
The in vitro release study involving free t-RES exhibited rapid and complete drug diffusion within 2h. However, the t-RES-MWCNT formulation proved a biphasic sustained release pattern. Initially, approximately 30% of the total loaded drug diffused out within the first 2h, with the remaining 92% diffusing out over a period of 48h. The burst effect occurs when a drug has high solubility in the dissolving environment and drug molecules are readily available at the surface, causing them to rapidly leach out. On the other hand, sustained release happens when drug molecules are located in the hydrophobic core of MWCNTs.
Differential scanning calorimetry (DSC)
Fig. 5A represents the DSC thermogram of t-RES. An endothermic peak existed when the temperature increased to 268.96 °C, which was very close to the melting point of t-RES, indicating that t-RES crystals have melted. DSC pattern of COOH-MWCNT (fig. 5B) and t-RES-MWCNT formulation (fig. 5C) confirms the successful loading of drug in MWCNTs.
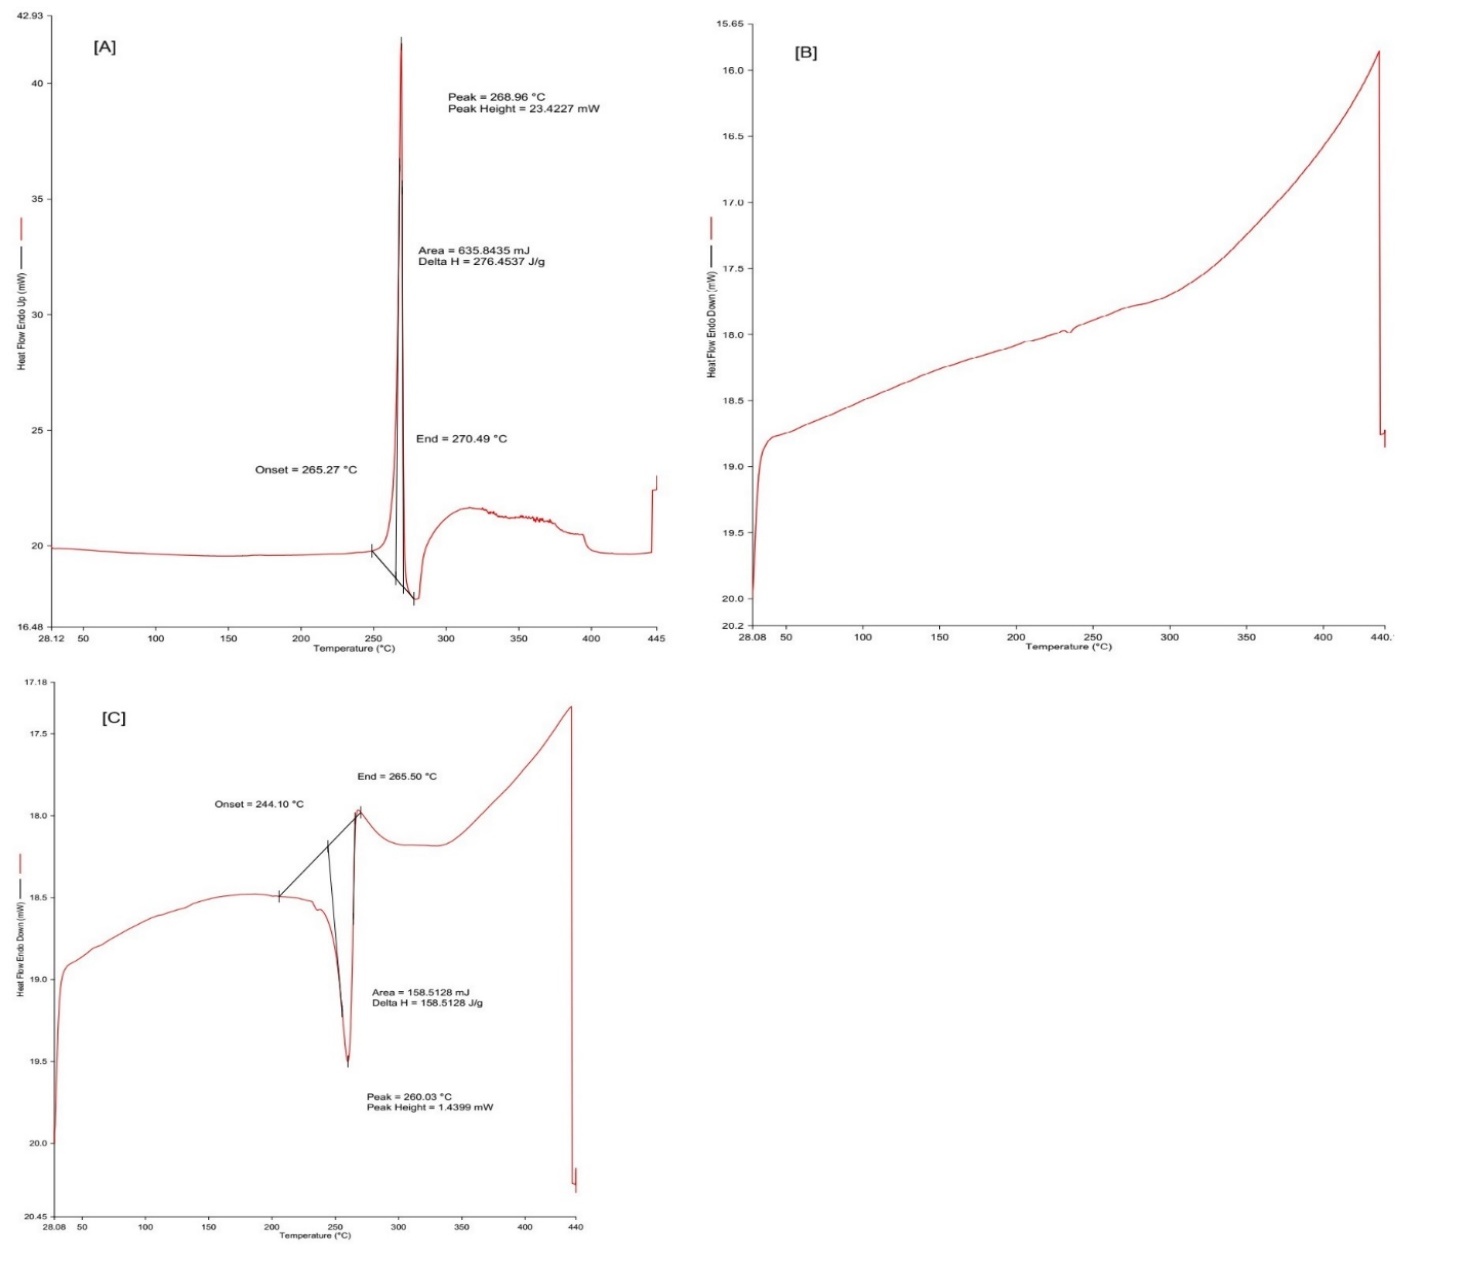
Fig. 5: DSC thermogram of [A] t-RES, [B] COOH-MWCNT, and [C] t-RES-MWCNT
X-ray diffraction analysis
X-ray diffraction (XRD) examination was conducted in order to ascertain the physical condition of t-RES. Fig. 6A illustrates the presence of distinct peaks at specific angles, particularly 16.43°, 19.23°, 22.43°, and 28.33°, which provide evidence supporting the high crystallinity of pure t-RES. Further, on comparing the XRD pattern of COOH-MWCNT (fig. 6B) with that of t-RES-MWCNT formulation (fig. 6C), the loading of t-RES on COOH-MWCNT was confirmed.
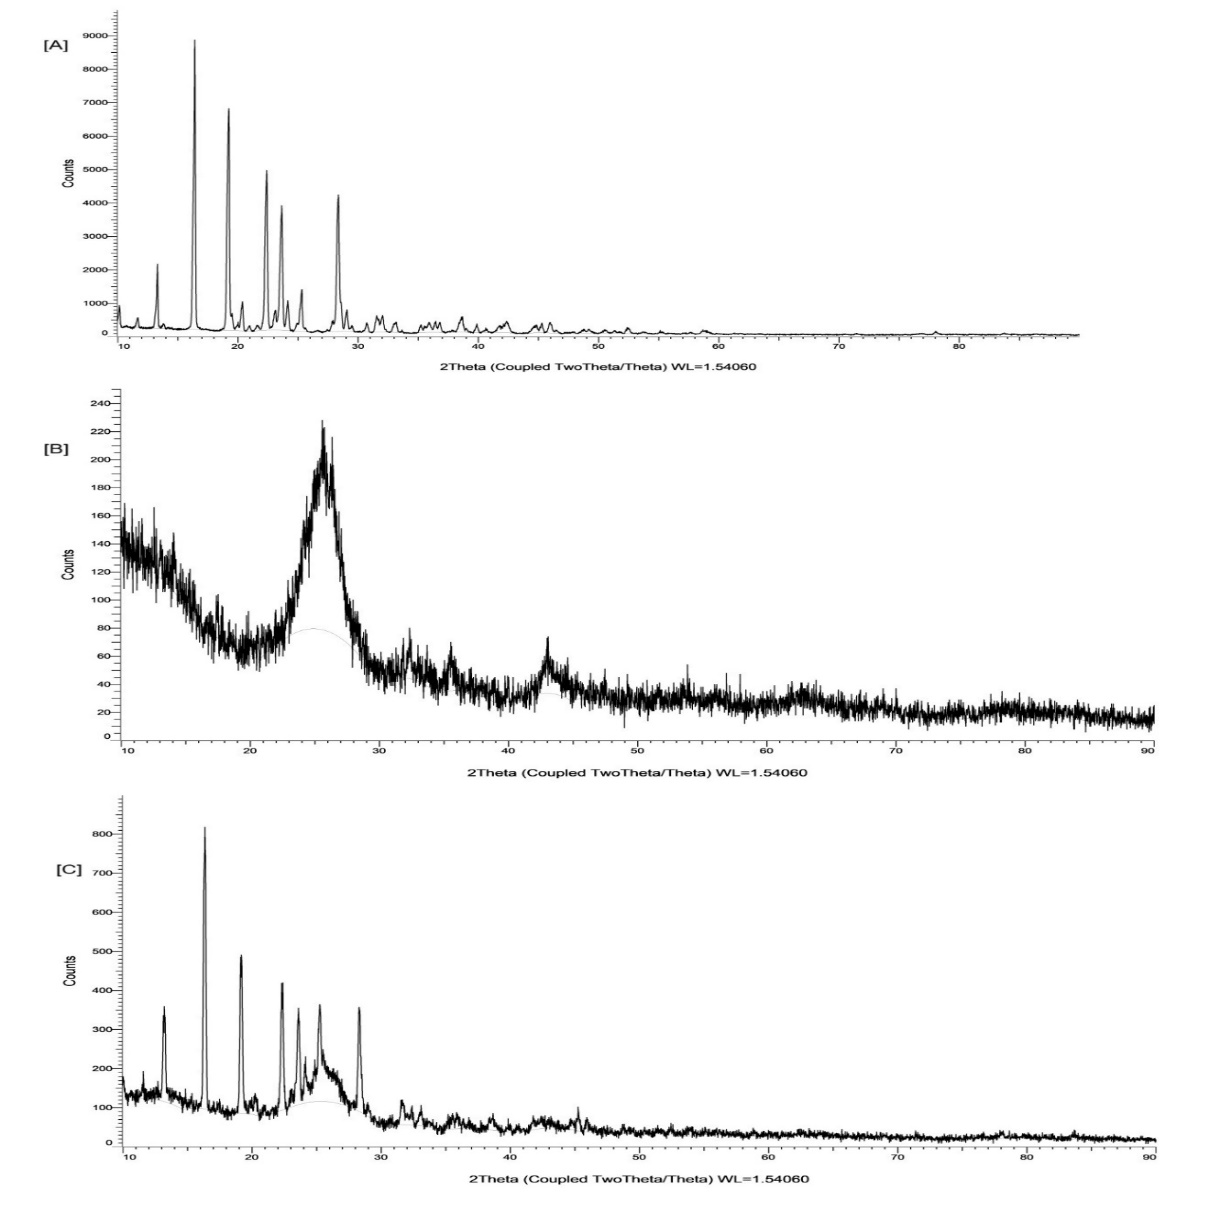
Fig. 6: XRD pattern of [A] t-RES, [B] COOH-MWCNT, and [C] t-RES-MWCNT
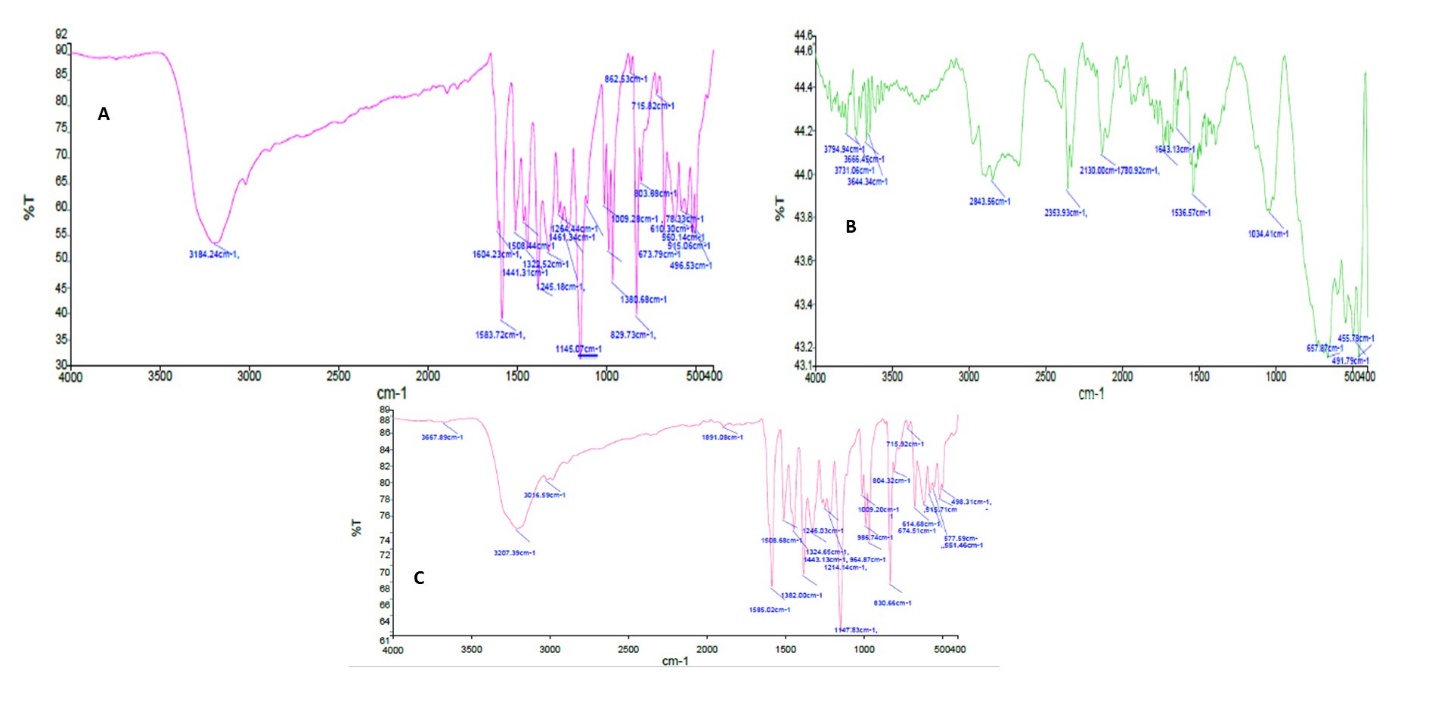
Fig. 7: FTIR spectrum of [A] t-RES, [B] COOH-MWCNT, and [C] t-RES-MWCNT
Fourier transform infrared spectroscopy (FTIR)
FTIR measurements were performed for t-RES, COOH-MWCNT, and t-RES-MWCNT. Fig. 7A reveals that in t-RES spectrum peaks at 1508.44 and 1604.23 cm-1 indicate C-C olefin stretches and aromatic C=C stretch, respectively. Another peak observed at 3184.24 cm-1indicates the presence of free O-H stretch vibration. Additionally, O-H bending phenol stretch vibrations occur at peak 1380 cm-1. Ultimately, peaks at 803 cm-1 shows C=C=H bending vibration, which indicates a Trans olefin group, confirming that compound exists in trans form. In fig. 7B FTIR spectrum of COOH-MWCNT peaks at 3644.34 cm-1, 2843.56 cm-1, 2353.93 cm-1and 2130 cm-1 confirm OH, C-H stretching, C=O stretching and C=C stretching, respectively. Similarly, FTIR spectrum of t-RES-MWCNT formulation (fig. 7C) demonstrates that formulation retains basic drug groups along with the basic functional group of COOH-MWCNT, confirming that the t-RES was successfully loaded onto COOH-MWCNTs.
Field emission scanning electron microscopy (FE-SEM)
Fig. 8 displays images from field emission scanning electron microscopy (FE-SEM) demonstrating the tiny structures of t-RES, COOH-MWCNT and t-RES-MWCNT. The images distinctly illustrated the nanoscale, elongated, thread-like structure of COOH-MWCNT. The FE-SEM images facilitate the analysis of the structural surface morphology. The dimensions of the t-RES-MWCNT were determined to be uneven due to the random adhesion of drug molecules on the nanotube network's surface.
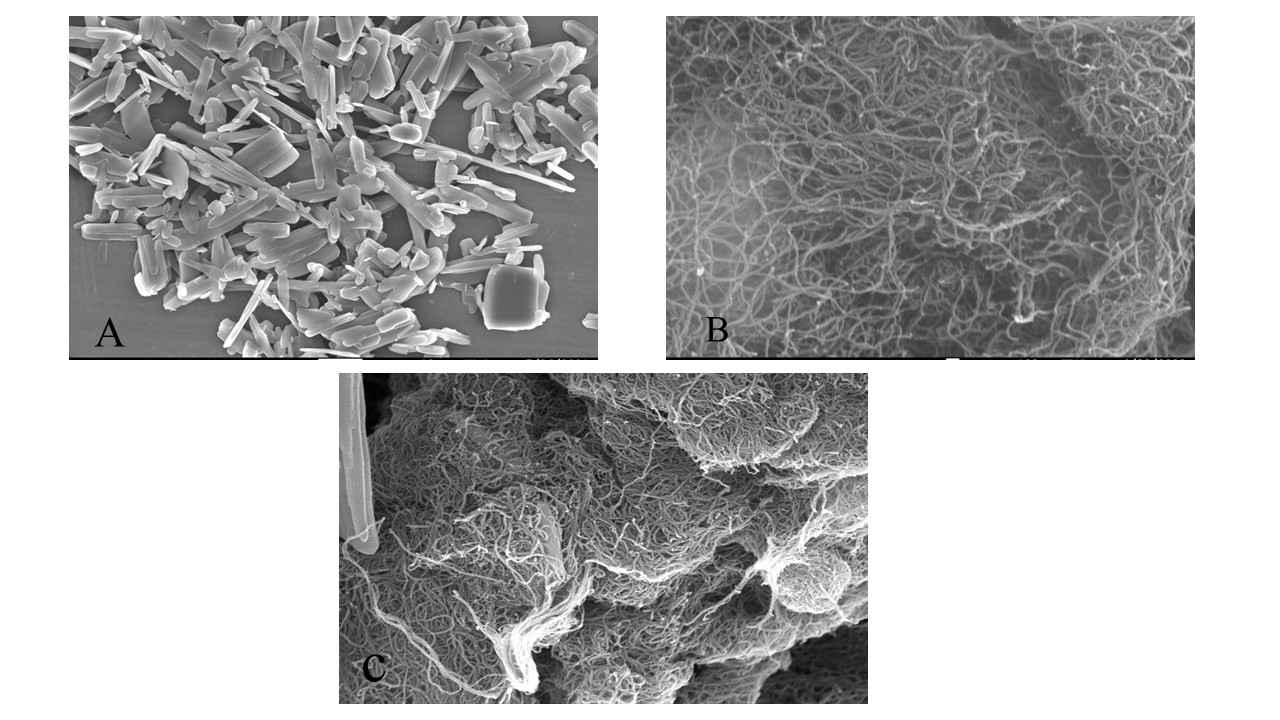
Fig. 8: FE-SEM images of [A] t-RES, [B] COOH-MWCNT, and [C] t-RES-MWCNT
CONCLUSION
The investigation was commenced with the objective of developing an economical, simple, highly sensitive, precise analytical approach for the quantitative assessment of t-RES. The developed method was rigorously verified to precisely and accurately measure t-RES. The method demonstrates linearity and reproducibility. The recovery percentage falling within the range of 97-99% demonstrated the exceptional retrieval of t-RES from the formulation. The percentage of RSD in samples at different concentrations utilized for intraday and intermediate precision examinations was observed to be below 2%, and the system suitability assessments highlighted the method's reproducibility and resilience. The results of present study confirmed that COOH-MWCNTs have loading capacity (more than 95%). Loading of drug was endorsed and further evaluated by different techniques including DSC, XRD, FTIR and FE-SEM. The t-RES-MWCNT demonstrates potential as a nanocarrier for efficient delivery of t-RES to the particular target site. The newly devised HPLC method could be further investigated for pharmacokinetic and biodistribution analyses of the drug within a drug delivery system.
ACKNOWLEDGEMENT
The authors are thankful to Lovely Professional University for providing the facilities to conduct the experimental work.
FUNDING
This study has not received any financial support.
AUTHORS CONTRIBUTIONS
Neha Sharma: Methodology, Investigation, Formal Analysis, Writing-Original Draft; Yachana Mishra: Methodology, Formal analysis, Data Curation, Writing-Original Draft, Writing-Reviewing and Editing; Neelam Sharma: Methodology, Formal Analysis; Vijay Mishra: Supervision, Conceptualization, Formal analysis, Data Curation, Writing-Original Draft, Writing-Reviewing and Editing.
CONFLICT OF INTERESTS
Authors state no conflict of interest
REFERENCES
Singh G, Pai RS. A rapid reversed-phase HPLC method for analysis of trans resveratrol in PLGA nanoparticulate formulation. ISRN Chromatogr. 2014 Feb;2014:1-6. doi: 10.1155/2014/248635.
Zhu XD, Lei XP, Dong WB. Resveratrol as a potential therapeutic drug for respiratory system diseases. Drug Des Dev Ther. 2017 Dec;11:3591-8. doi: 10.2147/DDDT.S148868, PMID 29290681.
Salehi B, Mishra AP, Nigam M, Sener B, Kilic M, Sharifi Rad M. Resveratrol: a double-edged sword in health benefits. Biomedicines. 2018 Sep;6(3):91. doi: 10.3390/biomedicines6030091, PMID 30205595.
Liu X, Pei J, Li J, Zhu H, Zheng X, Zhang X. Recent advances in resveratrol derivatives: structural modifications and biological activities. Molecules. 2025 Feb;30(4):958. doi: 10.3390/molecules30040958, PMID 40005268.
Kumar B. Resveratrol inhibits expression of cancer-specific pentose phosphate pathway enzyme TKTL1. Asian J Pharm Clin Res. 2018 Jun;11(6):332. doi: 10.22159/ajpcr.2018.v11i6.25021.
Abu Amero KK, Kondkar AA, Chalam KV. Resveratrol and ophthalmic diseases. Nutrients. 2016 Apr;8(4):200. doi: 10.3390/nu8040200, PMID 27058553.
Seukep JA, Sandjo LP, Ngadjui BT, Kuete V. Antibacterial and antibiotic resistance modifying activity of the extracts and compounds from Nauclea pobeguinii against gram negative multi-drug resistant phenotypes. BMC Complement Altern Med. 2016 Jul;16(1):193. doi: 10.1186/s12906-016-1173-2, PMID 27386848.
Meyer C, Brockmueller A, Ruiz De Porras VR, Shakibaei M. Microbiota and resveratrol: how are they linked to osteoporosis? Cells. 2024 Jul;13(13):1145. doi: 10.3390/cells13131145, PMID 38994996.
Oliveira AR, Domingues FC, Ferreira S. The influence of resveratrol adaptation on resistance to antibiotics benzalkonium chloride heat and acid stresses of Staphylococcus aureus and Listeria monocytogenes. Food Control. 2017;73:1420-5. doi: 10.1016/j.foodcont.2016.11.011.
Kataria R, Khatkar A. Resveratrol in various pockets: a review. Curr Top Med Chem. 2019 Mar;19(2):116-22. doi: 10.2174/1568026619666190301173958, PMID 30834833.
Trombino S, Cassano R, Di Gioia ML, Aiello F. Emerging trends in green extraction techniques chemical modifications and drug delivery systems for resveratrol. Antioxidants (Basel). 2025 May;14(6):654. doi: 10.3390/antiox14060654, PMID 40563289.
Meng T, Xiao D, Muhammed A, Deng J, Chen L, He J. Anti-inflammatory action and mechanisms of resveratrol. Molecules. 2021 Jan;26(1):229. doi: 10.3390/molecules26010229, PMID 33466247.
Huo Y, Yang D, Lai K, Tu J, Zhu Y, Ding W. Antioxidant effects of resveratrol in intervertebral disk. J Invest Surg. 2022 Oct;35(5):1135-44. doi: 10.1080/08941939.2021.1988771, PMID 34670455.
Wenzel E, Somoza V. Metabolism and bioavailability of trans resveratrol. Mol Nutr Food Res. 2005 Mar;49(5):472-81. doi: 10.1002/mnfr.200500010, PMID 15779070.
Jarosova V, Vesely O, Doskocil I, Tomisova K, Marsik P, Jaimes JD. Metabolism of cis and trans resveratrol and dihydroresveratrol in an intestinal epithelial model. Nutrients. 2020 Feb;12(3):595. doi: 10.3390/nu12030595, PMID 32106482.
Gambini J, Ingles M, Olaso G, Lopez Grueso R, Bonet Costa V, Gimeno Mallench L. Properties of resveratrol: in vitro and in vivo studies about metabolism bioavailability and biological effects in animal models and humans. Oxid Med Cell Longev. 2015 Jan;2015:837042. doi: 10.1155/2015/837042, PMID 26221416.
Annaji M, Poudel I, Boddu SH, Arnold RD, Tiwari AK, Babu RJ. Resveratrol loaded nanomedicines for cancer applications. Cancer Rep (Hoboken). 2021 Mar;4(3):e1353. doi: 10.1002/cnr2.1353, PMID 33655717.
Perrone D, Fuggetta MP, Ardito F, Cottarelli A, De Filippis A, Ravagnan G. Resveratrol (3,5,4′-trihydroxystilbene) and its properties in oral diseases. Exp Ther Med. 2017 May;14(1):3-9. doi: 10.3892/etm.2017.4472, PMID 28672886.
Wu Z, Wang N, Ye Z, Xu H, Chan G, Ouyang D. Formulation BCS: a machine learning platform based on diverse molecular representations for biopharmaceutical classification system (BCS) class prediction. Mol Pharm. 2025;22(1):330-42. doi: 10.1021/acs.molpharmaceut.4c00946, PMID 39647169.
Truzzi F, Tibaldi C, Zhang Y, Dinelli G, D Amen E. An overview on dietary polyphenols and their biopharmaceutical classification system (BCS). Int J Mol Sci. 2021 May;22(11):5514. doi: 10.3390/ijms22115514, PMID 34073709.
Ali HE, Radwan RR. Synthesis characterization and evaluation of resveratrol loaded functionalized carbon nanotubes as a novel delivery system in radiation enteropathy. Eur J Pharm Sci. 2021 Sep;167:106002. doi: 10.1016/j.ejps.2021.106002, PMID 34517108.
Srivastava N, Mishra Y, Mishra V, Ranjan A, Tambuwala MM. Carbon nanotubes in breast cancer treatment: an insight into properties functionalization and toxicity. Anticancer Agents Med Chem. 2023 May;23(14):1606-17. doi: 10.2174/1871520623666230510094850, PMID 37165493.
Srivastava N, Mishra V, Mishra Y, Ranjan A, Aljabali AA, El Tanani M. Development and evaluation of a protease inhibitor antiretroviral drug loaded carbon nanotube delivery system for enhanced efficacy in HIV treatment. Int J Pharm. 2024;650:123678. doi: 10.1016/j.ijpharm.2023.123678, PMID 38065344.
Witkowska M, Florek E, Mrowczynski R. Assessment of pristine carbon nanotubes toxicity in rodent models. Int J Mol Sci. 2022 Dec;23(23):15343. doi: 10.3390/ijms232315343, PMID 36499665.
Saleemi MA, Hosseini Fouladi MH, Yong PV, Chinna K, Palanisamy NK, Wong EH. Toxicity of carbon nanotubes: molecular mechanisms, signaling cascades and remedies in biomedical applications. Chem Res Toxicol. 2021;34(1):24-46. doi: 10.1021/acs.chemrestox.0c00172, PMID 33319996.
Antrim AK, Tseytlin IN, Cooley EG, Fernando PU, Barker ND, Alberts EM. Acute toxicity of carbon nanotubes carbon nanodots and cell penetrating peptides to freshwater cyanobacteria. Toxins. 2025 Apr;17(4):172. doi: 10.3390/toxins17040172, PMID 40278670.
Mohammadi E, Zeinali M, Mohammadi Sardoo M, Iranpour M, Behnam B, Mandegary A. The effects of functionalization of carbon nanotubes on toxicological parameters in mice. Hum Exp Toxicol. 2020 Jan;39(9):1147-67. doi: 10.1177/0960327119899988, PMID 31957491.
Ursini CL, Cavallo D, Fresegna AM, Ciervo A, Maiello R, Buresti G. Differences in cytotoxic genotoxic and inflammatory response of bronchial and alveolar human lung epithelial cells to pristine and COOH-functionalized multiwalled carbon nanotubes. Biomed Res Int. 2014 Jan;2014:359506. doi: 10.1155/2014/359506, PMID 25147797.
Xu S, Luo H, Chen H, Guo J, Yu B, Zhang H. Optimization of extraction of total trans resveratrol from peanut seeds and its determination by HPLC. J Sep Sci. 2020 Jan;43(6):1024-31. doi: 10.1002/jssc.201900915, PMID 31916409.
Santos AC, Veiga FJ, Sequeira JA, Fortuna A, Falcao A, Pereira I. First time oral administration of resveratrol loaded layer by layer nanoparticles to rats a pharmacokinetics study. Analyst. 2019 Jan;144(6):2062-79. doi: 10.1039/c8an01998c, PMID 30724915.
Katsagonis A, Atta Politou J, Koupparis MA. HPLC method with UV detection for the determination of trans resveratrol in Plasma. J Liq Chromatogr Relat Technol. 2005;28(9):1393-405. doi: 10.1081/JLC-200054884.
Ramesh D, Habibuddin M. Application of validated RP-HPLC method for simultaneous determination of metaxalone and diclofenac potassium in plasma. Int J Curr Pharm Sci. 2024 Jul;16(4):89-94. doi: 10.22159/ijcpr.2024v16i4.5039.
Juan ME, Maijo M, Planas JM. Quantification of trans resveratrol and its metabolites in rat plasma and tissues by HPLC. J Pharm Biomed Anal. 2010;51(2):391-8. doi: 10.1016/j.jpba.2009.03.026, PMID 19406597.
Sunsong R, Du T, Etim I, Zhang Y, Liang D, Gao S. Development of a novel UPLC-MS/MS method for the simultaneously quantification of polydatin and resveratrol in plasma: application to a pharmacokinetic study in rats. J Chromatogr B Analyt Technol Biomed Life Sci. 2021 Oct;1185:123000. doi: 10.1016/j.jchromb.2021.123000, PMID 34710805.
Boocock DJ, Patel KR, Faust GE, Normolle DP, Marczylo TH, Crowell JA. Quantitation of trans resveratrol and detection of its metabolites in human plasma and urine by high performance liquid chromatography. J Chromatogr B Analyt Technol Biomed Life Sci. 2007;848(2):182-7. doi: 10.1016/j.jchromb.2006.10.017, PMID 17097357.
Moon H, Park J, Hwang J, Chung H. Magnetic solid phase extraction of drugs and pesticides from human plasma using COOH-mMWCNTs. J Anal Toxicol. 2021;44(9):968-75. doi: 10.1093/jat/bkaa029, PMID 32369168.
Robinson K, Mock C, Liang D. Pre-formulation studies of resveratrol. Drug Dev Ind Pharm. 2015 Sep;41(9):1464-9. doi: 10.3109/03639045.2014.958753, PMID 25224342.
Pentek T, Newenhouse E, O Brien B, Chauhan AS. Development of a topical resveratrol formulation for commercial applications using dendrimer nanotechnology. Molecules. 2017 Jan;22(1):137. doi: 10.3390/molecules22010137, PMID 28098828.
Sathishbabu P, Hani U, Shakeela C, Hemanth Vikram PR, Ghazwani M, Osmani RA. A novel RP-HPLC method development and validation for simultaneous quantification of gefitinib and resveratrol in polymeric hybrid lipid nanoparticles and glioma cells. J Chromatogr B Analyt Technol Biomed Life Sci. 2022 Oct;1212:123483. doi: 10.1016/j.jchromb.2022.123483, PMID 36279777.
Bhaskararao P, Sarika M, Madhavi CL, Kollipara MG, Prashanthi G. The industrial importance of technology transfer for analytical method development and validation application to vilazodone hydrochloride dosage form. Int J Chem Res. 2024 Oct;8(4):12-7. doi: 10.22159/ijcr.2024v8i4.235.
Wu W, Li K, Zhao C, Ran X, Zhang Y, Zhang T. A rapid HPLC–MS/MS method for the simultaneous determination of luteolin resveratrol and their metabolites in rat plasma and its application to pharmacokinetic interaction studies. J Chromatogr B Analyt Technol Biomed Life Sci. 2022 Jan;1191:123118. doi: 10.1016/j.jchromb.2022.123118, PMID 35085987.
Kurangi B, Jalalpure S, Jagwani S. A validated stability indicating HPLC method for simultaneous estimation of resveratrol and piperine in cubosome and human plasma. J Chromatogr B Analyt Technol Biomed Life Sci. 2019 May;1122-1123:39-48. doi: 10.1016/j.jchromb.2019.05.017, PMID 31150952.
Woldemariam G, Kyad A, Moore S, Qiu J, Semin D, Tan ZJ. Development and validation of a HPLC-UV method for urea and related impurities. PDA J Pharm Sci Technol. 2020;74(1):2-14. doi: 10.5731/pdajpst.2018.009803, PMID 31209168.
Tariq M, Thomas S, Singh A, Talegaonkar S. Developed and validated stability indicating HPLC method for the determination of epirubicin in bulk drug marketed injection and polymeric nanoparticles. Braz J Pharm Sci. 2018 Jan;54(4):e17515. doi: 10.1590/s2175-97902018000417515.
Srivastava N, Mishra V, Kumar B, Mishra Y, Palanimuthu VR. Bioanalytical method development of nevirapine fosamprenavir calcium and its metabolite amprenavir by RP-HPLC in rat plasma. J Chromatogr B Analyt Technol Biomed Life Sci. 2025 Jun 23;1263:124702. doi: 10.1016/j.jchromb.2025.124702, PMID 40570690.
Cui L, Liu W, Liu H, Qin Q, Wu S, He S. PH-triggered charge reversal mesoporous silica nanoparticles stabilized by chitosan oligosaccharide/carboxymethyl chitosan hybrids for effective intracellular delivery of doxorubicin. ACS Appl Bio Mater. 2019 Apr;2(5):1907-19. doi: 10.1021/acsabm.8b00830, PMID 35030680.
Sahu A, Jain A, Gulbake A. The role of carbon nanotubes in nanobiomedicines. Int J Pharm Pharm Sci. 2017 Jun;9(6):235-51. doi: 10.22159/ijpps.2017v9i6.18522.
Zu Y, Zhang Y, Wang W, Zhao X, Han X, Wang K. Preparation and in vitro/in vivo evaluation of resveratrol loaded carboxymethyl chitosan nanoparticles. Drug Deliv. 2016;23(3):971-81. doi: 10.3109/10717544.2014.924167.
Ha ES, Park H, Lee SK, Sim WY, Jeong JS, Baek IH. Pure trans resveratrol nanoparticles prepared by a supercritical antisolvent process using alcohol and dichloromethane mixtures: effect of particle size on dissolution and bioavailability in rats. Antioxidants (Basel). 2020 Apr;9(4):342. doi: 10.3390/antiox9040342, PMID 32331478.
Yuan X, Zhou Y, Bi J, Li S, Wu H, Zeng M. An antioxidant composite film based on loquat seed starch incorporating resveratrol loaded core shell nanoparticles. Int J Biol Macromol. 2025 Feb;306(3):141493. doi: 10.1016/j.ijbiomac.2025.141493, PMID 40023425.
Tomic N, Matic T, Filipovic N, Mitic Culafic DM, Boccacccini AR, Stevanovic MM. Synthesis and characterization of innovative resveratrol nanobelt like particles and assessment of their bioactivity antioxidative and antibacterial properties. J Biomater Appl. 2023 Jun;38(1):122-33. doi: 10.1177/08853282231183109, PMID 37303075.
Long Huang KL, Hu L, Liu SQ. Preparation and characterization of disulfide functionalized multi-walled carbon nanotubes for biomedical applications. Int J Chem. 2010 Jul;2(2):144-8. doi: 10.5539/ijc.v2n2p144.