
Int J App Pharm, Vol 18, Issue 1, 2026, 250-262Original Article
A REVERSE PHASE HIGH PERFORMANCE LIQUID CHROMATOGRAPHY-PHOTO DIODE ARRAY ESTIMATION OF PROBENECID AND SULOPENEM ETZADROXIL IN BULK AND PHARMACEUTICAL DOSAGE FORM AND CHARACTERIZATION OF DEGRADANTS BY USING LIQUID CHROMATOGRAPHY MASS SPECTROMETRY
M. DAVID RAJU1*, PRAVEEN KUMAR PALIVELA2, YESUPADAMU RAYINUTHALA3
*1Department of Chemistry, Parvathaneni Brahmayya Siddhartha College of Arts and Science, Vijayawada, AP, India. 2Department of Chemistry, Sir C R Reddy College (Autonomous), Eluru, India. 3Department of Chemistry, Government Degree College, Chebrole, Guntur District, AP-522212, India
*Corresponding author: M. David Raju; *Email: davidm201926@gmail.com
Received: 09 May 2025, Revised and Accepted: 28 Oct 2025
ABSTRACT
Objective: This study presents a valid and dependable "Reverse Phase High-Performance Liquid Chromatography (RP-HPLC)" technique for the simultaneous quantification of sulopenem etzadroxil and probenecid in their pharmaceutical dose form, which indicates stability.
Methods: Probenecid and sulopenem etzadroxil were isolated by using an isocratic elution technique with a phenyl column (250 mm x 4.6 mm, 5μm) and a mobile phase consisting of acetonitrile and triethyl amine at a pH of 2.5, which was adjusted with a 0.1% formic acid buffer in a 60:40 ratio, and a flow rate of 1.0 ml/min, respectively. Sulopenem etzadroxil and probenecid were quantified using a 271 nm detection wavelength.
Results: At retention durations of 2.631 and 4.048 min, respectively, the peaks for probenecid and sulopenem etzadroxil were eluted with fine resolution. Both probenecid and sulopenem etzadroxil showed linear calibration curves with regression coefficients of 0.99998 and 0.99975 in the concentration range of 50-300 μg/ml respectively. Resolution of probenecid and sulopenem etzadroxil from its degradation-based chemicals demonstrated the sensitivity, precision, robustness, accuracy, and specificity of the proposed high-performance liquid chromatography method and also indicated stability. The degradation agents were identified by the use of LCMS in the research involving forced degradation.
Conclusion: The pharmaceutical dosage forms of probenecid and sulopenem etzadroxil were evaluated using the well-established high-performance liquid chromatography method, and the findings seemed adequate.
Keywords: Isocratic method, Development, Validation, RP-HPLC, Stability indicating
© 2026 The Authors. Published by Innovare Academic Sciences Pvt Ltd. This is an open access article under the CC BY license (https://creativecommons.org/licenses/by/4.0/)
DOI: https://dx.doi.org/10.22159/ijap.2026v18i1.54958 Journal homepage: https://innovareacademics.in/journals/index.php/ijap
INTRODUCTION
Sulopenem, also known as CP-70,429, is an oral active thiopenem antibiotic derivative [1, 2] from the penem family. In conjunction with probenecid (Orlynvah brand name), it has been authorized for the treatment of simple UTIs [3, 4]. Research into its possible uses is continuous, and it has entered Phase III clinical trials on many times. It is being studied primarily for its ability to cure MDR UTIs. For the treatment of urinary tract infections in adult women caused by Escherichia coli [5, 6], klebsiella pneumoniae [7], or Proteus mirabilis [8] for whom there are few alternative oral antibiotic alternatives, the US Food and Drug Administration authorized a combination of sulopenem etzadroxil with probenecid. Iterum Therapeutics came up with the combo and sold it under the ORLYNVAH brand name.
An increase in the excretion of uric acid [9, 10] is the effect of the medicine probenecid, which is marketed under the trade name Probalan. Gout [11, 12] and hyperuricemia [13, 14] are the main indications of use. To increase the plasma concentration and duration of action of some medications, probenecid was created as a substitute for caronamide by competitively inhibiting renal excretion. When used with cidofovir, probenecid may protect the kidneys and raise the concentration of some antibiotics. Specifically, there is some data that suggests using intravenous cefazolin once day instead of three times with probenecid. Additionally, it has been used as a masking agent, which might aid athletes who use PEDs in evading drug testing. This medicine is often associated with mild side effects such as nausea, loss of appetite [15], dizziness [16], vomiting, headache, sore gums, or frequent urination. Thrombocytopenia [17], hemolytic anemia [18], leukemia and encephalopathy [19] are exceedingly uncommon but potentially fatal adverse effects. Uric acid kidney stones may be more likely to occur in patients using probenecid, at least in theory. A new sensitive stability-indicating RP-HPLC method for the evaluation of the combination of probenecid and sulopenem etzadroxil is suggested in this work. Estimating the pharmaceutical components probenecid, sulopenem, etzadroxil, and RP-HPLC is the goal of the investigation.
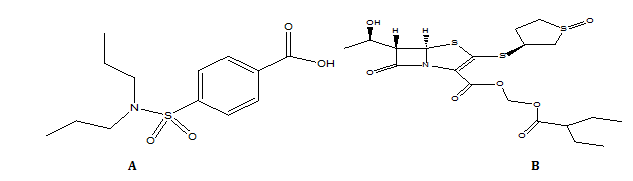
Fig. 1: Structure of (A) Probenecid and (B) Sulopenem etzadroxil
Till date, only one HPLC method was available [20] in the literature. The aim of the study was to develop a new rapid and sensitive RP-HPLC method for the simultaneous estimation of probenecid and sulopenem etzadroxil and characterization of its degradants using LCMS/MS (Liquid Chromatographic Mass Spectrophotometer). We performed only assay and characterization of degradants only and we didn’t go to further studies. Clinical relevance and regulatory data was available in USFDA.gov
MATERIALS AND METHODS
Chemicals
Merck India Ltd. of Mumbai, India, supplied the acetonitrile, HPLC-grade methanol, and water. We obtained the active pharmaceutical ingredients (APIs) of probenecid, sulopenem, and etzadroxil from Glenmark Mumbai. We used probenecid and sulopenem etzadroxil tablets, which are a formulation sample from Euphoria India Pharma, with a label claim of 500 mg each.
The instrumentation
We used an HPLC system from Waters Alliance, the e-2695, which has a quaternary pump, a PDA (Photo Diode Array) detector, and the Empower 2.0 software [20, 21].
Method optimization
The chromatographic conditions were optimized by experimenting with various ratios of phosphate buffer to acetonitrile in the mobile phase using isocratic mode. Nevertheless, in order to obtain satisfactory retention durations and improve resolution, the mobile phase composition was adjusted at each session. The active pharmaceutical components were shown to be more responsive after using an isocratic elution mobile phase consisting of acetonitrile and formic acid. The process was optimized by testing it with several stationary phases, including amino phenyl columns, C8, and C18. Based on these experiments, the peak morphologies using a 250 x 4.6 mm phenyl column with a 5 µ particle size, PDA detector were satisfactory. In order to achieve sufficient sensitivity, the mobile phase flow rate of 1 ml/min has been carried out at 271 nm. Probenecid and sulopenem etzadroxil had retention durations of about 2.631 and 4.048 min, respectively, with a tailing factor of 1.07 and 1.01, according to the circumstances mentioned above. Probenecid and sulopenem etzadroxil had 7253 and 8512 theoretical plates, respectively, indicating that the column produced the desired results. With a RSD (Relative Standard Deviation) of between 0.40 and 0.14 percent for six separate injections, the suggested method seems to be very accurate. The developed procedure was verified according to ICH (International Council for Harmonization) criteria.
Validation procedure
The following analytical characteristics were evaluated according to the ICH Q2 (R1) guidelines: system appropriateness, precision, specificity, accuracy, linearity, robustness, LOD (Limit of Detection), LOQ (Limit of Quantification), forced deterioration, and stability [22, 23]. (International Conference on Harmonization, or ICH)
Preparation of buffer
Use 0.1% formic acid to bring the pH of 1 liter of 0.1% triethylamine solution down to 2.5 and then filter the mixture using 0.22 micrometer filter paper.
Chromatographic conditions
Using a mobile phase of acetonitrile and triethylamine at pH-2.5 adjusted with 0.1% formic acid in a 60:40 ratio, and a phenyl (250x4.6 mm, 5 μ) column operating at a flow rate of 1.0 ml/min, the HPLC analysis was carried out using a reverse-phase HPLC system with isocratic elution mode.
Diluent: Ethanol.
Preparation of the standard solution
A 20 mg probenecid and 20 mg sulopenem etzadroxil standard solution was made by dissolving the two drugs in 10 ml of an ethanol solvent mix. The resulting solution had a concentration of 200 μg/ml. To further dilute, add diluents to 1 ml to 10 milliliters.
Preparation of the sample solution
The 45 mg sample, which is equal to 20 mg of probenecid and 20 mg of sulopenem etzadroxil (the label claim 500 mg of probenecid and 500 mg of sulopenem etzadroxil), was dissolved in 10 ml of an ethanol solvent mix to create a sample solution with a concentration of 200 μg/ml for each drug further dilute, add diluents to 1 ml to 10 ml.
RESULTS
The separation of active pharmaceutical components posed the greatest analytical problem during the process of developing a new technique. Optimizing the chromatographic conditions allowed for excellent results. The stability indicating technique for these medications utilizing HPLC has not been disclosed yet; nonetheless, sulopenem etzadroxil is an antibiotic prodrug and probenecid is a uricosuric drug. Therefore, in accordance with the ICH Guideline, a new approach has been created and verified.
The validity criteria were set up in accordance with the guidelines provided by the ICH [24-26].
System suitability
Table 1 displays the reported tailing and plate count values as well as the system appropriateness injecting standard solution and USP (United States of Pharmacopeia) values [27, 28].
Specificity
The interference was examined by separately analyzing the placebo, standard, and sample solutions in this test procedure [29]. The graphic below demonstrates that the active components were clearly separated from the blank and their excipients, and that the primary peak was unaffected by the placebo. Therefore, it is a targeted approach.
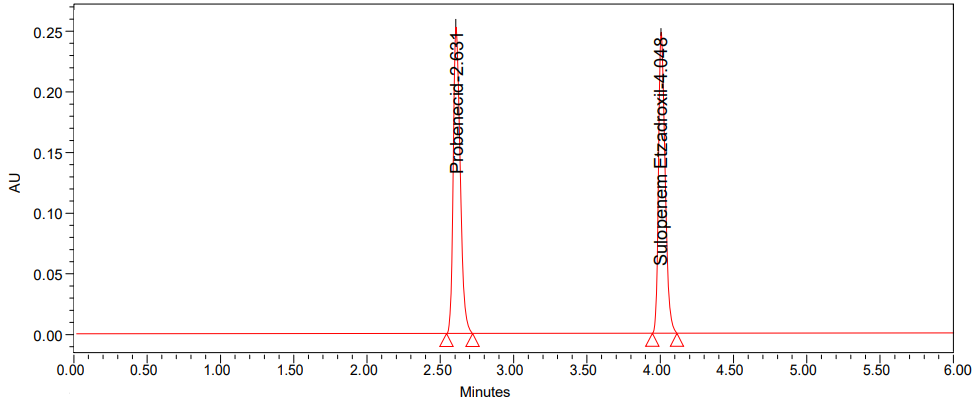
Fig. 2: Chromatogram of standard
Table 1: Results of system suitability
| System suitability parameter | Acceptance criteria | Drug name | |
| Probenecid | Sulopenem etzadroxil | ||
| USP Plate Count | Not Less Than 2000 | 7251 | 8536 |
| USP Tailing | Not More Than 2.0 | 1.07 | 1.01 |
| USP Resolution | Not Less Than 2.0 | - | 6.35 |
| % RSD | Not More Than 2.0 | 0.40 | 0.14 |
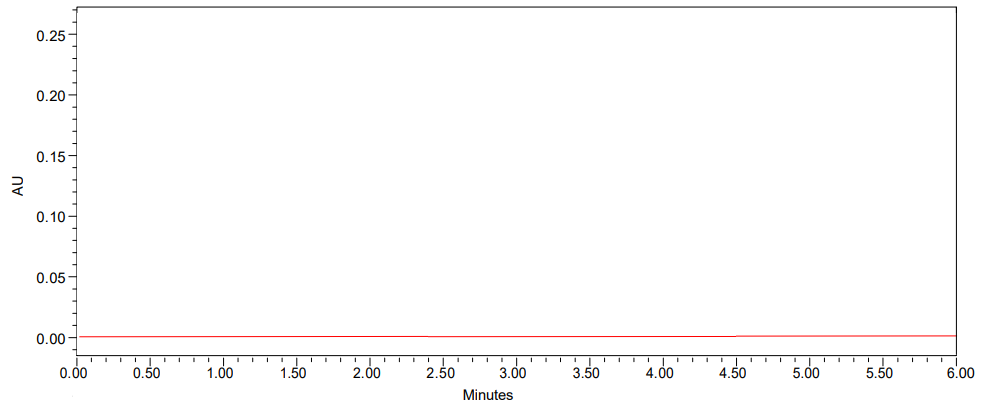
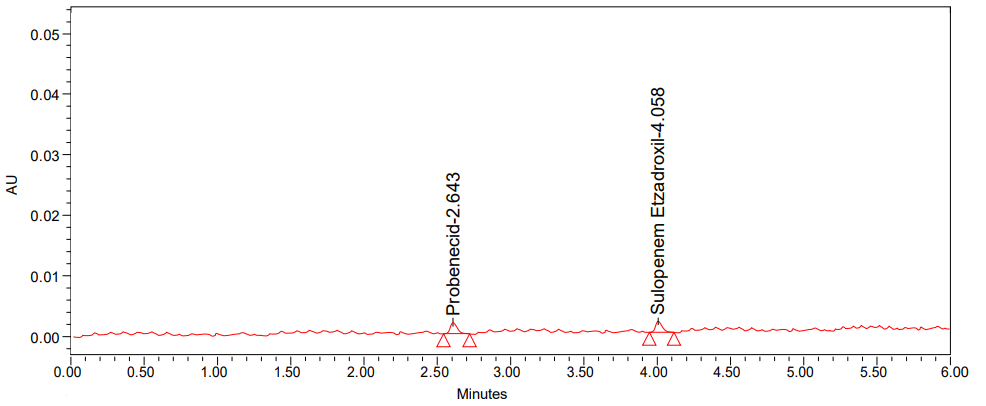
Fig. 3: Chromatogram of blank
Linearity
In this study, we tested probenecid and sulopenem etzadroxil for linearity of area response. The linear peak response areas were determined for probenecid and sulopenem etzadroxil by chromatography of solutions with concentrations ranging from 50 to 300 μg/ml. Fig. 4 shows the calibration curves for probenecid and sulopenem etzadroxil as well as the regression line equation and regression coefficient.
Accuracy
Probenecid and sulopenem etzadroxil assays in spiked samples were used to assess accuracy according to the suggested approach. The samples were supplemented with three different concentrations of probenecid and sulopenem etzadroxil standards: 50%, 100% and 150% [30, 31]. Table 3 displays the outcomes.
Precision
Precision was checked by measuring the same solution of probenecid and sulopenem etzadroxil six times throughout the day, with a concentration of 500 µg/ml each. Precision was confirmed by measuring the RSD of the peak regions of probenecid and sulopenem etzadroxil, while accuracy was confirmed by conducting % content tests of the two drugs. Table 4 displays these outcomes.
Intraday precision
On the same day, six separate samples containing 200 μg/ml of probenecid and 200 μg/ml of sulopenem etzadroxil were examined [32-34]. In order to determine the mean, standard deviation, and percentage of reliability, peak regions were computed.
Table 2: Linearity of probenecid and sulopenem etzadroxil
| S. No. | Probenecid | Sulopenem etzadroxil | ||
| Conc. (µg/ml) | Area | Conc. (µg/ml) | Area | |
| 1 | 50.00 | 621753 | 50.00 | 685508 |
| 2 | 100.00 | 1221560 | 100.00 | 1278268 |
| 3 | 150.00 | 1862175 | 150.00 | 1989596 |
| 4 | 200.00 | 2466503 | 200.00 | 2662998 |
| 5 | 250.00 | 3087600 | 250.00 | 3318987 |
| 6 | 300.00 | 3698881 | 300.00 | 3903202 |
| the correlation coefficient | 0.99998 | 0.99975 | ||
| Slope | 12338.06 | 13115.21 | ||
| intercept | 501.71 | 9655.50 | ||
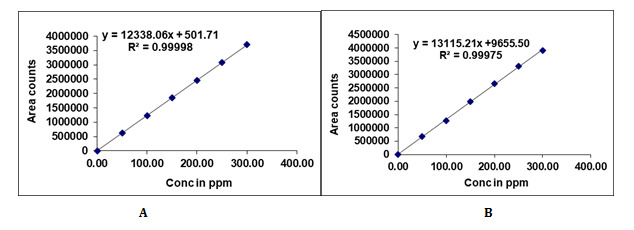
Fig. 4: Calibration plots of (A) Probenecid (B) Sulopenem etzadroxil
Table 3: Results of accuracy of (A) Probenecid and (B) Sulopenem etzadroxil
A
| Level (%) | Sample peak area | Amount of standard added (μg/ml) | Amount recovered | % Recovery | SD | % RSD |
| 50 | 1221560 | 10 | 9.91 | 99.5 | 0.85 | 0.85 |
| 1242558 | 10 | 10.08 | ||||
| 1230567 | 10 | 9.98 | ||||
| 100 | 2469284 | 20 | 20.03 | 99.5 | 0.62 | 0.62 |
| 2439286 | 20 | 19.79 | ||||
| 2449381 | 20 | 19.87 | ||||
| 150 | 3695881 | 30 | 29.98 | 99.6 | 0.48 | 0.48 |
| 3689792 | 30 | 29.93 | ||||
| 3662896 | 30 | 29.71 |
Data are given as mean+SD (n=3), SD – Standard Deviation
B
| Level (%) | Sample peak area | Amount of standard added (μg/ml) | Amount recovered | % Recovery | SD | % RSD |
| 50 | 1341854 | 10 | 10.02 | 100.1 | 0.14 | 0.14 |
| 1338399 | 10 | 9.99 | ||||
| 1341452 | 10 | 10.01 | ||||
| 100 | 2689215 | 20 | 20.07 | 100.0 | 0.34 | 0.34 |
| 2674277 | 20 | 19.96 | ||||
| 2673081 | 20 | 19.95 | ||||
| 150 | 3944586 | 30 | 29.44 | 98.6 | 0.60 | 0.61 |
| 3956257 | 30 | 29.53 | ||||
| 3990942 | 30 | 29.79 |
Data are given as mean+SD (n=3)
Table 4: Intraday precision results of probenecid and sulopenem etzadroxil
| S. No. | Probenecid | Sulopenem etzadroxil | ||||
| Conc. (µg/ml) | Area | Percent recovery | Conc. (µg/ml) | Area | Percent recovery | |
| 1 | 200 | 2416891 | 98.1 | 200 | 2626795 | 98.1 |
| 2 | 2461789 | 99.9 | 2684321 | 100.3 | ||
| 3 | 2465810 | 100.1 | 2673873 | 99.9 | ||
| 4 | 2454608 | 99.6 | 2694855 | 100.7 | ||
| 5 | 2449396 | 99.4 | 2662664 | 99.5 | ||
| 6 | 2471312 | 100.3 | 2672798 | 99.8 | ||
| Mean | 2453301 | 99.6 | 2669218 | 99.7 | ||
| SD | 19470.81 | 0.789 | 23505.35 | 0.895 | ||
Data are given as mean+SD (n=6)
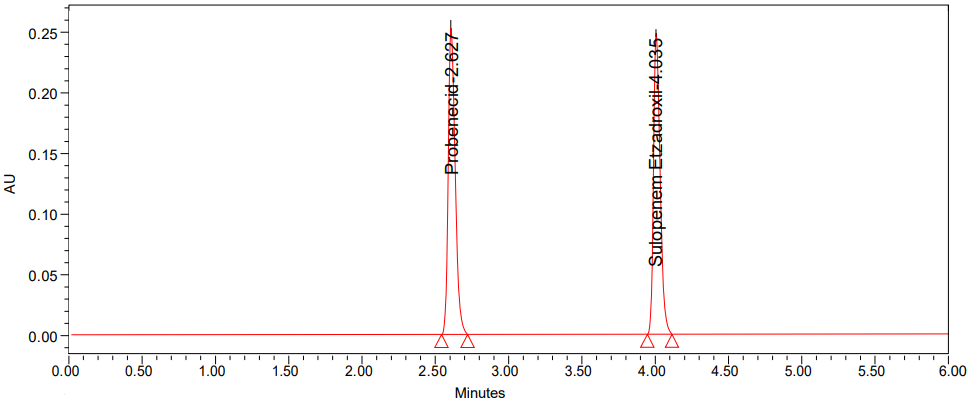
Fig. 5: Chromatogram of method precision
Intermediate precision
On different days, different equipment was tested, and six distinct versions of the sample solution were examined by the researchers. We have computed the peak areas that will be used to ascertain the mean percent RSD values. The outcomes are shown in the table that follows [35].
Inter-day precision
On separate days, six separate solutions containing probenecid and sulopenem etzadroxil were tested. Each solution had 200μg/ml of each compound. The mean, standard deviation, and percentage of reliability were determined by calculating the peak regions. Results showed that the current procedure was accurate, with RSD values below 2% and percentage assay values around 100%. Table 5 displays the outcomes.
LOD and LOQ
The limit of detection and limit of quantification were assessed using a signal-to-noise ratio. The LOQ for probenecid was 10 times the baseline noise, whereas the LOD for sulopenem etzadroxil was 3 times the baseline noise.
Table 5: Inter-day outcomes of accuracy of probenecid and sulopenem etzadroxil
| S. No. | Probenecid | Sulopenem etzadroxil | ||||||
| Day-1 Area counts | Day-1 % recovery | Day-2 Area counts | Day-2 % recovery | Day-1 Area counts | Day-1 % recovery | Day-2 Area counts | Day-2 % recovery | |
| 1 | 2452889 | 99.6 | 2481362 | 100.8 | 2661868 | 99.4 | 2663021 | 99.5 |
| 2 | 2473794 | 100.5 | 2412754 | 98.0 | 2683677 | 100.2 | 2645817 | 98.8 |
| 3 | 2435815 | 98.9 | 2463958 | 100.1 | 2675424 | 99.9 | 2631025 | 98.3 |
| 4 | 2454611 | 99.7 | 2447845 | 99.4 | 2684435 | 100.3 | 2655248 | 99.2 |
| 5 | 2439397 | 99.1 | 2462305 | 100.0 | 2669579 | 99.7 | 2685479 | 100.3 |
| 6 | 2481324 | 100.8 | 2450187 | 99.5 | 2671873 | 99.8 | 2683054 | 100.2 |
| Mean | 2456305 | 99.8 | 2453069 | 99.6 | 2674476 | 99.9 | 2660607 | 99.4 |
| SD | 18177.32 | 0.753 | 23087.93 | 0.944 | 8653.98 | 0.331 | 21217.3 | 0.783 |
Data are given as mean+SD (n=6)
Table 6: LOD and LOQ for probenecid and sulopenem etzadroxil
| Probenecid | Sulopenem etzadroxil | ||||||
| LOD | LOQ | LOD | LOQ | ||||
| Concentration | s/n | Concentration | s/n | concentration | s/n | Concentration | s/n |
| 0.06µg/ml | 3 | 0.2µg/ml | 10 | 0.06µg/ml | 3 | 0.2µg/ml | 10 |
A
B
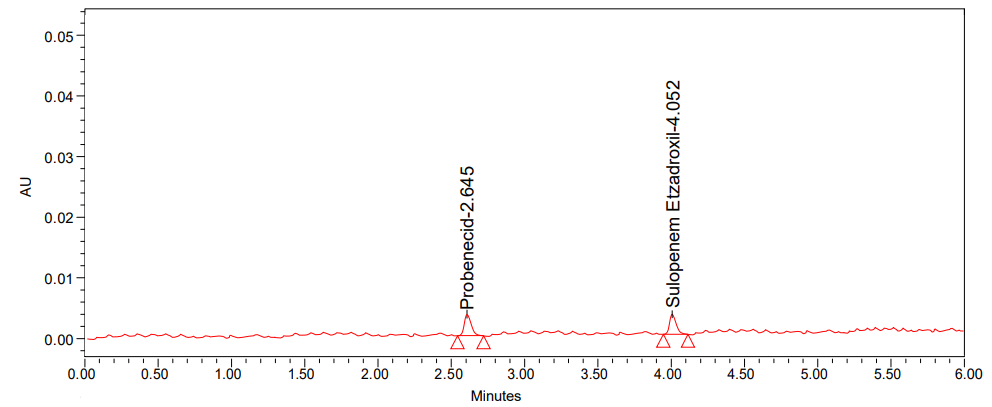
Fig. 6: Chromatogram of (A) LOD and (B) LOQ
Table 7: Robustness data of (A) Probenecid and (B) Sulopenem etzadroxil
A
| Parameter | Condition | Peak area±SD, % RSD (n = 3) |
| Flow rate (±10%) | 0.9 | 2295841± 5148.23, 0.78 |
| 1 | 2475128± 5231.15, 0.32 | |
| 1.1 | 2751023± 3620.47, 0.57 | |
Mobile Phase composition (±10%) |
54:46 | 2104536± 6107.23, 0.61 |
| 60:40 | 2451208± 5247.13, 0.26 | |
| 66:34 | 2985641± 4174.05, 0.95 | |
| pH Variation (±0.2) | 2.3 | 2455879±5178.58, 1.12 |
| 2.5 | 2415638±6325.21, 0.98 | |
| 2.7 | 2385641±4518.12, 1.47 |
Data are given as mean+SD (n=3)
B
| Parameter | Condition | Peak area±SD, % RSD (n = 3) |
| Flow rate (±10%) | 0.9 | 2561325± 1875.13, 0.63 |
| 1 | 2685471± 2745.31, 0.84 | |
| 1.1 | 2884501± 1203.09, 1.24 | |
| Mobile phase composition (±10%) | 54:46 | 2285715± 3621.42, 0.48 |
| 60:40 | 2653204± 2736.36, 0.41 | |
| 66:34 | 3069340±1546.85, 1.64 | |
| pH Variation (±0.2) | 2.3 | 2694857±1975.45, 0.63 |
| 2.5 | 2634781±2659.31, 0.56 | |
| 2.7 | 2599472±3620.07, 1.01 |
Data are given as mean+SD (n=3), In the optimized method, we cannot mention the column temperature. So, we should not perform column temp variation in robustness.
Robustness
The strength was evaluated by measuring the peak area of a solution containing 200µg/ml of probenecid and sulopenem etzadroxil, with significantly altered parameters in the HPLC test. According to references [36, 37], table 7 displays the modified parameters and the subsequent peak regions.
Degradation studies
The medicine probenecid and sulopenem etzadroxil was partially degraded by subjecting the sample to different forced degradation settings. Studies of forced degradation have carried out to find out that the method is suitable for products of degradation [38]. Furthermore, the investigations describe the drug's instability under certain circumstances, which allows for the implementation of safeguards during formulation to prevent such instability [39].
Acid degradation
Using 1N HCl (Hydrochloric acid), the acid degraded 13.7% of probenecid and 12.1% of sulopenem etzadroxil. Two degradation products (DP) were formed, namely DP1 and DP 4.
Alkali degradation
Using 1N NaOH (Sodium Hydroxide), the base degraded 12.5% of probenecid and 11.8% of sulopenem etzadroxil. Two degradation products were formed, namely DP2 and DP 5.
Peroxide degradation
Using 10% H2O2 (Hydrogen Peroxide), degraded 15.9% of probenecid and 3.0% of sulopenem etzadroxil. Only one degradation product was formed, namely DP3.
Reduction degradation
Using 10% NaHSO3 (Sodium bisulphite), degraded 2.5% of probenecid and 10.2% of sulopenem etzadroxil. Only one degradation product was formed, namely DP6.
Thermal degradation
The sample was degraded to 2.1% of probenecid and 2.9% of sulopenem etzadroxil in thermal oven. No degradation products were formed.
Photolytic degradation
The sample was degraded to 2.4% of probenecid and 1.2% of sulopenem etzadroxil in photolytic chamber. No degradation products were formed.
Hydrolysis degradation
The sample was degraded to 1.7% of probenecid and 0.9% of sulopenem etzadroxil in hydrolysis condition (Addition of 1 ml of HPLC water only). No degradation products were formed.
All degradation results are tabulated in table 8. These degradants were characterized by using LCMS.
Table 8: Forced degradation results of probenecid and sulopenem etzadroxil
| Degradation condition | Probenecid | Sulopenem etzadroxil | Number of DPs formed | ||
| % Assay | % Deg | % Assay | % Deg | ||
| Control degradation | 100 | 0 | 100 | 0 | - |
| Acid degradation | 86.3 | 13.7 | 87.9 | 12.1 | DP 1 and DP 4 |
| Alkali degradation | 87.5 | 12.5 | 89.2 | 11.8 | DP 2 and DP 5 |
| Oxidation degradation | 84.1 | 15.9 | 87 | 3.0 | DP 3 |
| Reduction degradation | 97.5 | 2.5 | 96.8 | 10.2 | DP 6 |
| Hydrolysis degradation | 98.3 | 1.7 | 99.1 | 0.9 | - |
| Thermal degradation | 90.9 | 2.1 | 97.1 | 2.9 | - |
| Photo degradation | 97.6 | 2.4 | 98.8 | 1.2 | - |
DISCUSSION
According to a review of the relevant literature, just one HPLC [40] technique has been documented up to this point. To estimate probenecid and sulopenem etzadroxil, we have devised a rapid, accurate, and reliable HPLC method. Our HPLC approach is the first of its kind to simultaneously quantify probenecid and sulopenem etzadroxil in both bulk and tablet forms. The existing HPLC: probenecid and sulopenem etzadroxil analytical procedure was validated while considering the ICH requirements [41, 42]. The elution of probenecid and sulopenem etzadroxil was not affected by the tablet formulation excipients or the mobile phase components. The selectivity chromatograms (fig. 2, 3 and 5) corroborated the selectivity [43].
To separate probenecid and sulopenem etzadroxil, the chromatographic technique is mostly used. With the use of organic modifiers such as acetonitrile and methanol in the mobile phase and different stationary phases such as C8, C18 and Phenyl as well as different mobile phases containing buffers such as formic acid, tri ethyl amine, and water with pH values ranging from 2 to 4, different trails were created using standard solution. The results showed that the phenyl column, mobile phase triethylamine buffer, and acetonitrile produced rather excellent peak shapes for probenecid and sulopenem etzadroxil. The flow rate was set at 1.0 ml/min. Probenecid and sulopenem etzadroxil were successfully separated using a phenyl column with a length of 250 mm, an inner diameter of 4.6 mm, a particle size of 5 µm, tri ethyl amine as a buffer, and acetonitrile as the organic phase. The separation was carried out using an isocratic program of 40:60, with a post run time of 6 min and a detection wavelength of 271 nm. The outcomes were as follows given the aforementioned circumstances: With a tailing factor of 1.01 and a total of 7247 theoretical plates (N), the retention time of probenecid was 2.631 min, and the percentage RSD [44, 45] for six replicate injections was 0.40%. On the other hand, sulopenem etzadroxil had a retention time of 4.048 min, a total of 8587 theoretical plates (N), and a percentage RSD of 0.14%. Accelerated degradation experiments show that probenecid and sulopenem etzadroxil are easily broken down in environments with high temperatures, ultraviolet light, acidity, and oxidation. Using a photodiode array detector on Waters HPLC, the peak purity of stressed samples of probenecid and sulopenem etzadroxil was examined. It was found that all of the stress samples had a purity angle below the purity threshold, indicating that the analyte peaks were homogeneous. Our goal in doing this research was to find a novel characterisation HPLC technique that is sensitive, specific, and applicable to the analysis of probenecid, sulopenem etzadroxil.
A
B
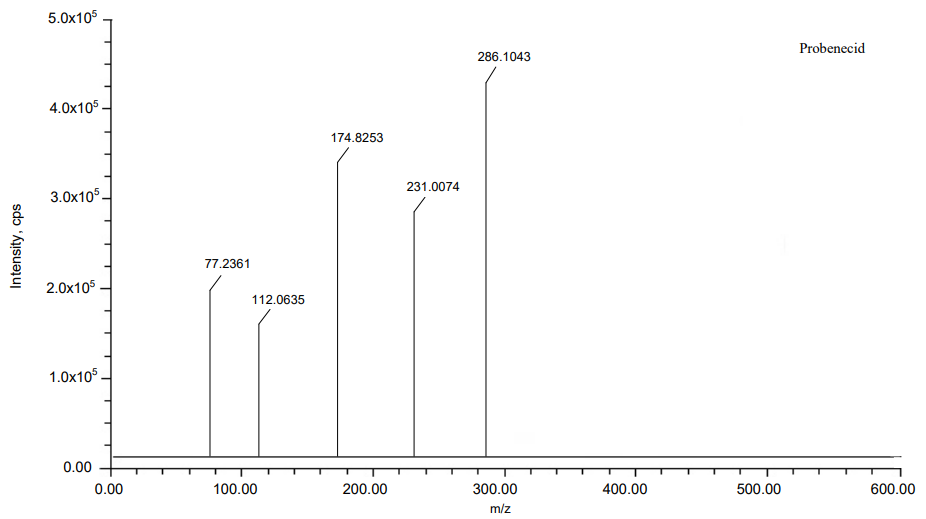
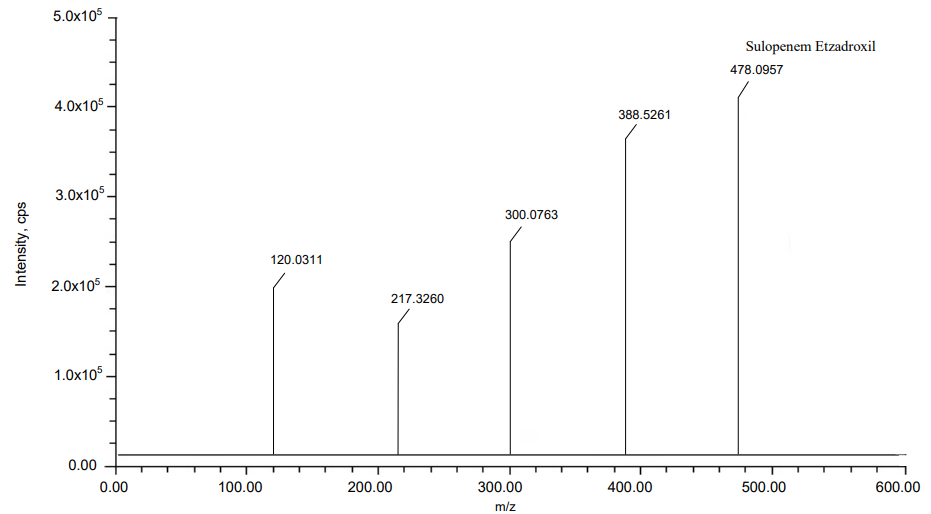
Fig. 7: MS Spectra of (A) Probenecid and (B) Sulopenem etzadroxil
Scheme 1
The process of fragmentation of probenecid degradation product 1 of m/z-303.0696 was observed under acidic degradation condition. The spectrum exhibited prominent fragment ions at m/z-203.9648 (C6H15N loss), m/z-140.0029 (SO2 loss). Mass spectrometry and precise mass measurements both lent credence to the suggested structures.
Scheme 2
The process of fragmentation of probenecid degradation product 2 of m/z-307.0854 was observed under alkaline degradation condition. The spectrum exhibited prominent fragment ions at m/z-207.9806 (C6H15N loss), m/z-144.0187 (SO2 loss). Mass spectrometry and precise mass measurements both lent credence to the suggested structures.
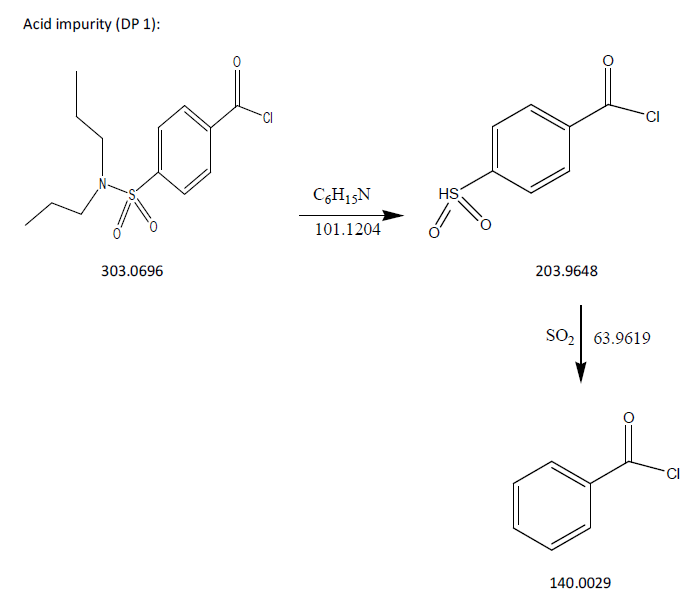
Fig. 8: Fragmentation mechanism of DP 1
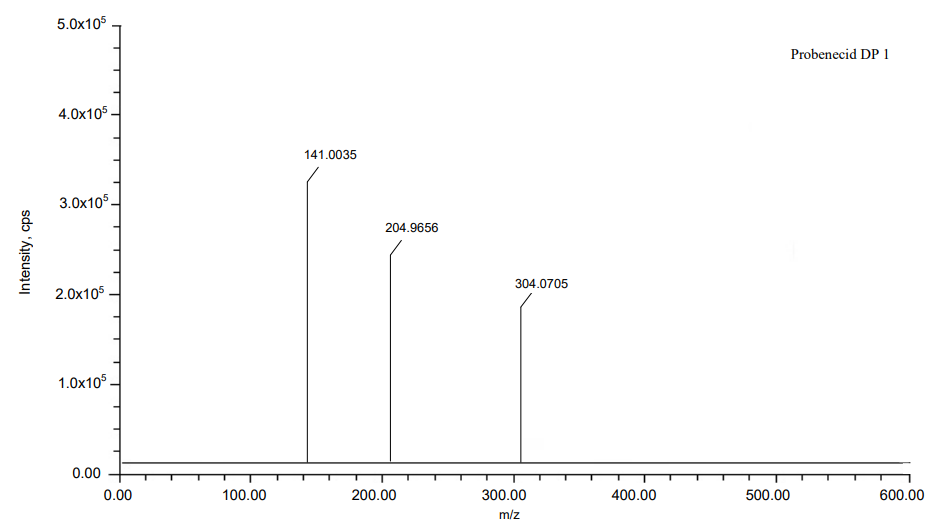
Fig. 9: Mass spectra of DP 1
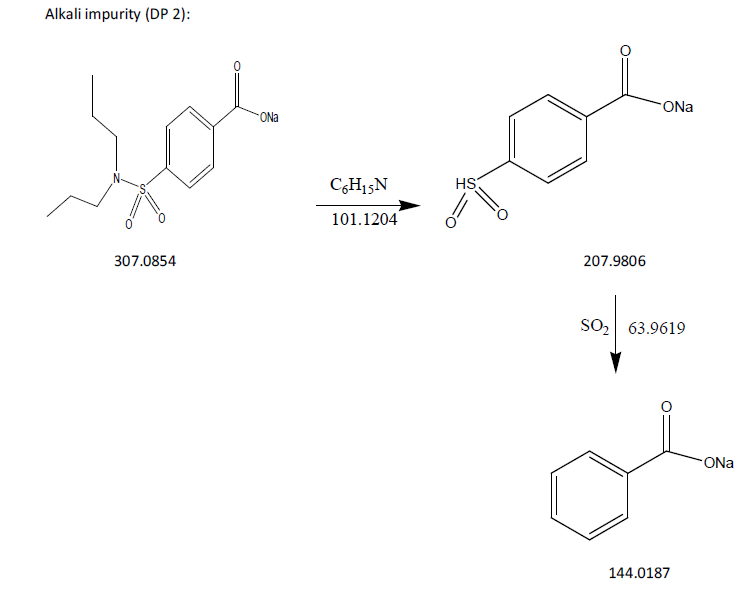
Fig. 10: Fragmentation mechanism of DP 2
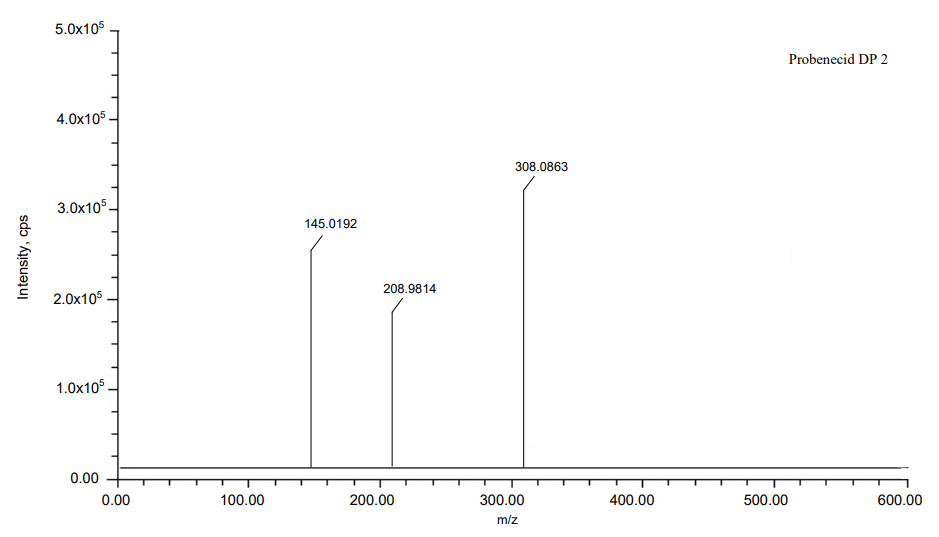
Fig. 11: Mass spectra of DP 2
Scheme 3
The process of fragmentation of probenecid degradation product 3 of m/z-301.0984 was observed under peroxide degradation condition. The spectrum exhibited prominent fragment ions at m/z-185.9987 (C6H15NO loss), m/z-122.0368 (SO2 loss). Mass spectrometry and precise mass measurements both lent credence to the suggested structures.
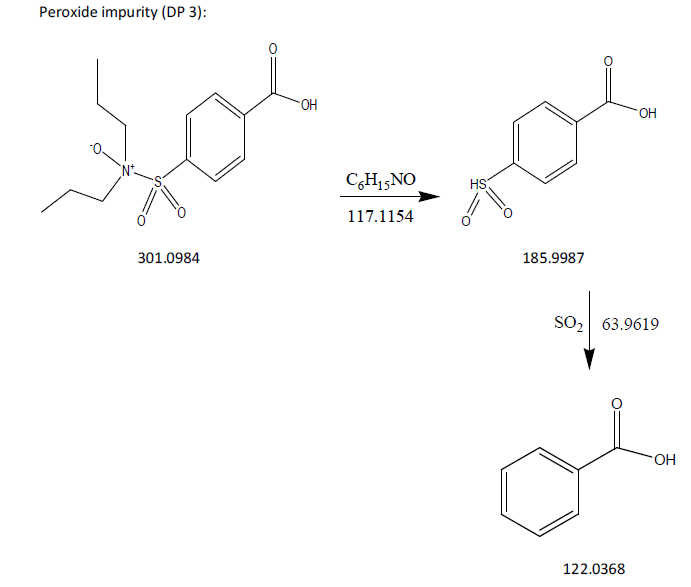
Fig. 12: Fragmentation mechanism of DP 3
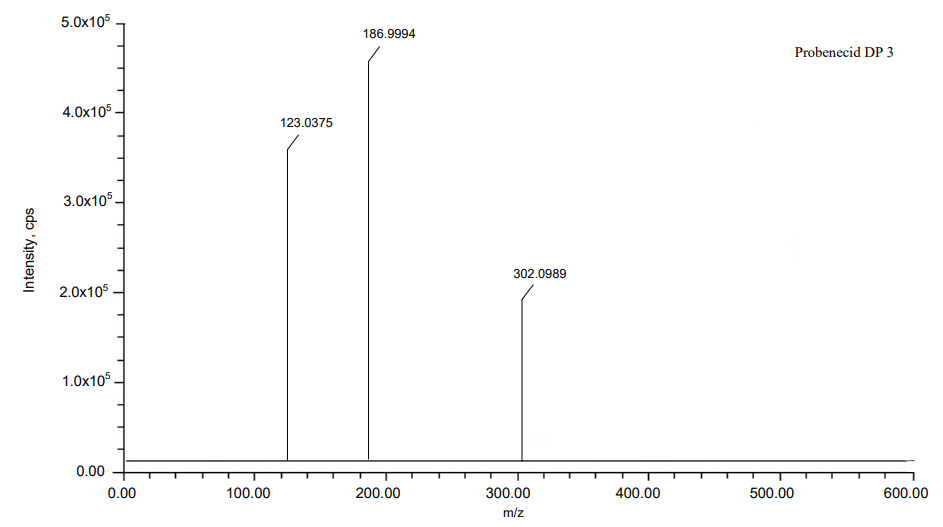
Fig. 13: Mass spectra of DP 3
Scheme 4
The process of fragmentation of sulopenem etzadroxil degradation product 4 of m/z-382.9723 was observed under acid degradation condition. The spectrum exhibited prominent fragment ions at m/z-280.9583 (C4H8OS loss), m/z-196.9372 (C4H8O2 loss), m/z-63.0143 (C3H3ClO2S loss). Mass spectrometry and precise mass measurements both lent credence to the suggested structures.
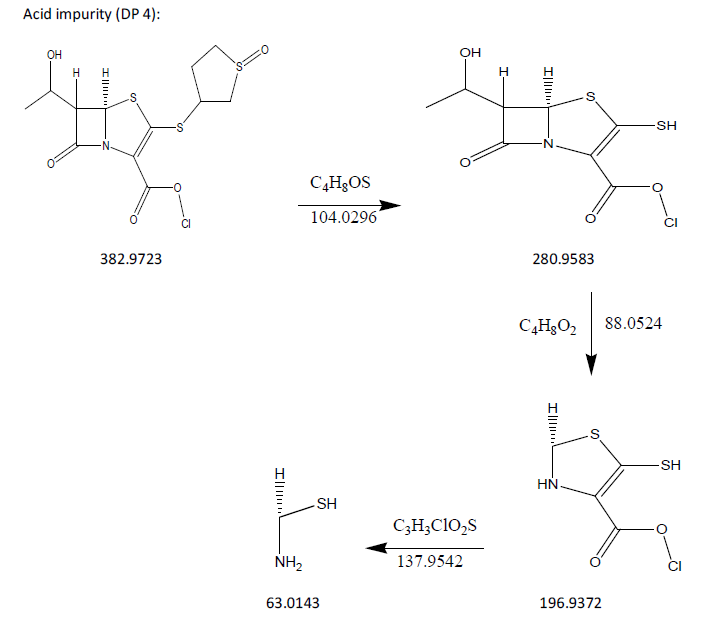
Fig. 14: Fragmentation mechanism of DP 4
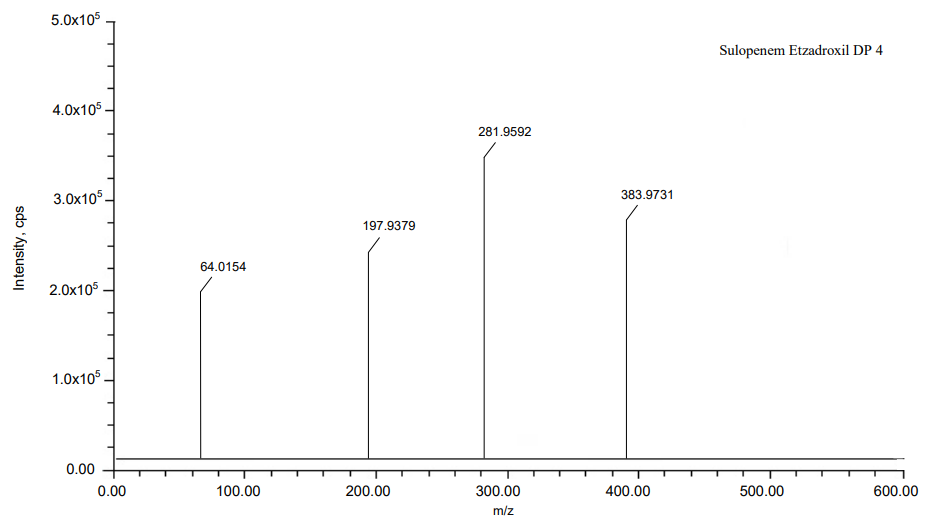
Fig. 15: Mass spectra of DP 4
Scheme 5
The process of fragmentation of sulopenem etzadroxil degradation product 5 of m/z-370.9932 was observed under alkali degradation condition. The spectrum exhibited prominent fragment ions at m/z-268.9792 (C4H8OS loss), m/z-184.9581 (C4H8O2 loss), m/z-63.0143 (C3H3NaO2S loss). Mass spectrometry and precise mass measurements both lent credence to the suggested structures.
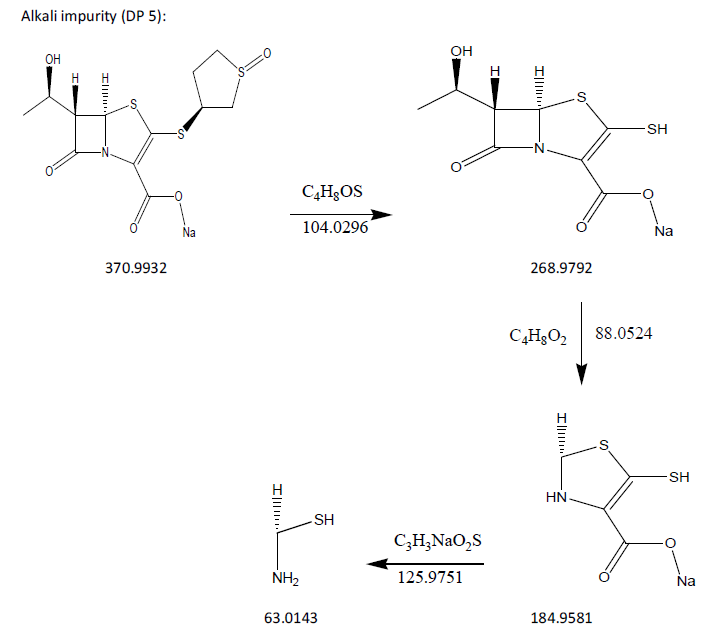
Fig. 16: Fragmentation mechanism of DP 5
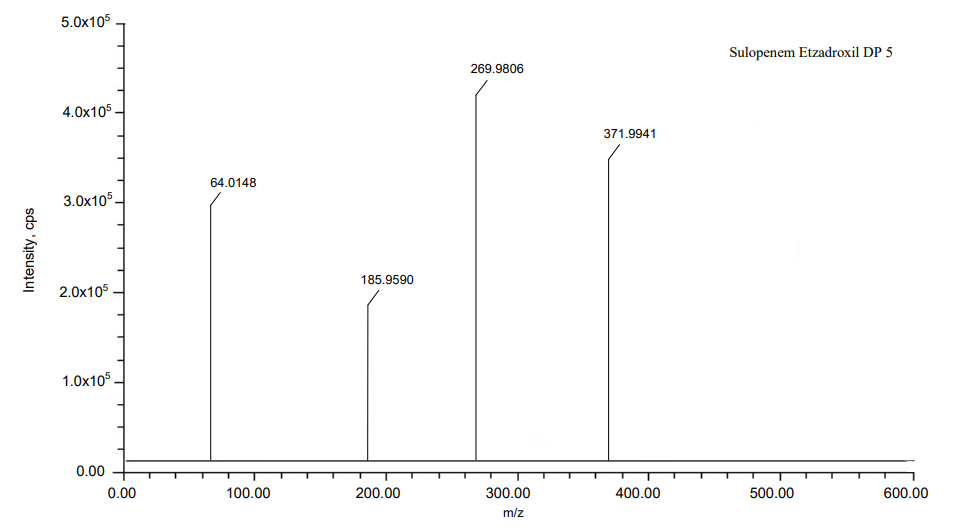
Fig. 17: Mass spectra of DP 5
Scheme 6
The process of fragmentation of sulopenem etzadroxil degradation product 5 of m/z-450.95 was observed under reduction degradation condition. The spectrum exhibited prominent fragment ions at m/z-348.9361 (C4H8OS loss), m/z-264.9149 (C4H8O2 loss), m/z-118.9863 (CHNaO5S loss). Mass spectrometry and precise mass measurements both lent credence to the suggested structures.
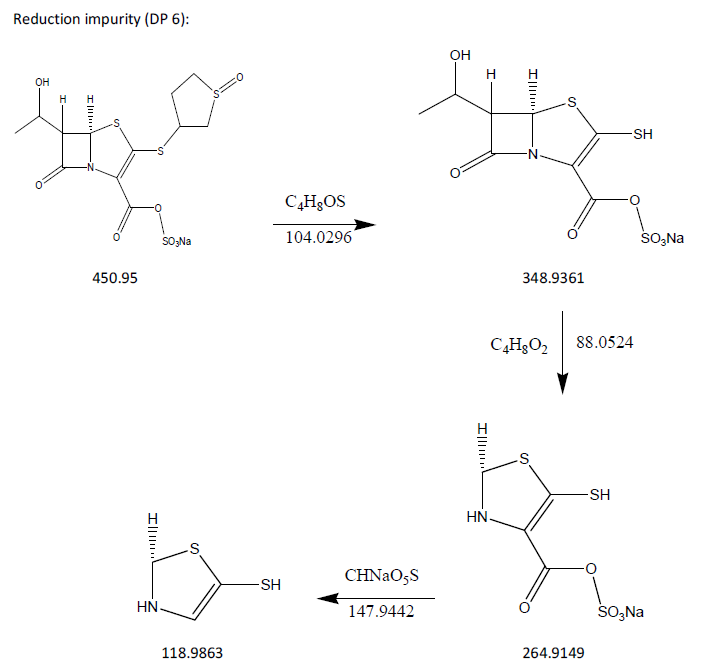
Fig. 18: Fragmentation mechanism of DP6
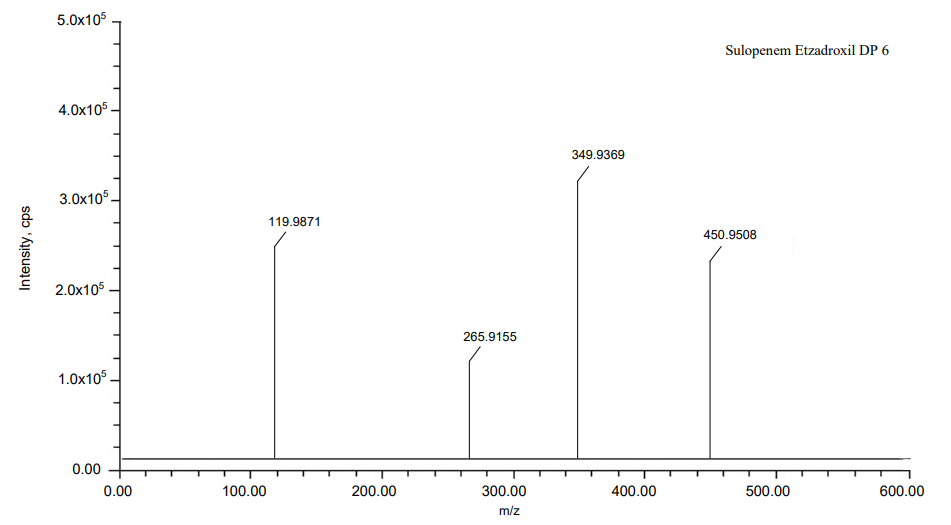
Fig. 19: Mass spectra of DP 6
Table 9: LC-MS/MS data of probenecid and it’s degradation products and some major fragments
| Molecular formula | Calculated mass | Observed mass | Mass error (ppm) | Major fragment ions | |
| Probenecid | C13H19NO4S | 285.1035 | 285.1043 | 2.805999 | 77.2361, 112.0635, 174.8253, 231.0074 |
| DP 1 | C13H18ClNO3S | 303.0696 | 303.0705 | 2.969615 | 141.0035, 204.9656 |
| DP 2 | C13H18NNaO4S | 307.0854 | 307.0863 | 2.930781 | 145.0192, 208.9814 |
| DP 3 | C13H19NO5S | 301.0984 | 301.0989 | 1.660587 | 123.0375, 186.9994 |
Table 10: LC-MS/MS data of sulopenem etzadroxil and it’s degradation products and some major fragments
| Molecular formula | Calculated mass | Observed mass | Mass error (ppm) | Major fragment ions | |
| Sulopenem Etzadroxil | C19H27NO7S3 | 477.095 | 477.0957 | 1.467213 | 120.0311, 217.3260, 300.0763, 388.5261 |
| DP 4 | C12H14ClNO5S3 | 382.9723 | 382.9731 | 2.088924 | 64.0154, 197.9379, 281.9592 |
| DP 5 | C12H14NNaO5S3 | 370.9932 | 370.9941 | 2.425920 | 64.0148, 185.9590, 269.9806 |
| DP 6 | C12H14NNaO8S4 | 449.95 | 449.9508 | 1.777975 | 119.9871, 265.9155, 349.9369 |
We got ppm error values like the above only. We calculated these errors using https://warwick.ac.uk/fac/sci/chemistry/research/barrow/barrowgroup/calculators/mass_errors/ sheet. Not all LCMS fig. (e. g., fig. 12–14) contain peak structure annotations within the graphic itself—some rely solely on captions – We can’t understand this sir
CONCLUSION
The proposed research work is found to be promising and less time-consuming, with minimum amount of solvent utilization for method development. The developed method proved that the method is specific, accurate, precise, and robust for probenecid and sulopenem etzadroxil. Stress degradation studies revealed that probenecid and sulopenem etzadroxil withstand thermal, photo and hydrolysis conditions. At the same time, acidic, alkali, oxidative degradation occurred for probenecid and acidic, alkali, reduction degradation occurred for sulopenem etzadroxil. The developed method and obtained statistical data manifested that designed protocol is simple, rapid and economical for the estimation of probenecid and sulopenem etzadroxil APIs (Active Pharmaceutical Ingredient) and pharmaceutical formulation. Forced degradation products were characterized by using LCMS. Both drugs were not toxic, already stated that in vitro data is available in USFDA. gov. This method uses very less run time and organic phase composition was 60% very less cost for analysis and eco eco-friendly nature.
ACKNOWLEDGEMENT
The authors were thankful to the management of P B Siddhartha college of Arts and Science for their encouragement.
FUNDING
Nil
AUTHORS CONTRIBUTIONS
Praveen Kumar has collected the literature and information about the drugs, David Raju carried out the research samples and prepared the manuscript.
CONFLICTS OF INTEREST
Declared none
REFERENCES
Blaser MJ, Melby MK, Lock M, Nichter M. Accounting for variation in and overuse of antibiotics among humans. BioEssays. 2021;43(2):e2000163. doi: 10.1002/bies.202000163, PMID 33410142.
Ghosh C, Sarkar P, Issa R, Haldar J. Alternatives to conventional antibiotics in the era of antimicrobial resistance. Trends Microbiol. 2019;27(4):323-38. doi: 10.1016/j.tim.2018.12.010, PMID 30683453.
Harding C, Mossop H, Homer T, Chadwick T, King W, Carnell S. Alternative to prophylactic antibiotics for the treatment of recurrent urinary tract infections in women: multicentre open label randomised non-inferiority trial. BMJ. 2022;376:e068229. doi: 10.1136/bmj-2021-0068229, PMID 35264408.
Magistro G, Stief CG. Vaccine development for urinary tract infections: where do we stand. Eur Urol Focus. 2019;5(1):39-41. doi: 10.1016/j.euf.2018.07.034, PMID 30093359.
Martinson JN, Walk ST. Escherichia coli residency in the gut of healthy human adults. EcoSal Plus. 2020;9(1). doi: 10.1128/ecosalplus.esp-0003-2020, PMID 32978935.
Guerrero Montero I, Dolata KM, Schluter R, Malherbe G, Sievers S, Zuhlke D. Comparative proteome analysis in an Escherichia coli CyDisCo strain identifies stress responses related to protein production, oxidative stress and accumulation of misfolded protein. Microb Cell Fact. 2019;18(1):19. doi: 10.1186/s12934-019-1071-7, PMID 30696436.
Setiawan A, Widodo AD, Endraswari PD. Comparison of ciprofloxacin, cotrimoxazole and doxycycline on Klebsiella pneumoniae: time-kill curve analysis. Ann Med Surg (Lond). 2022;84:104841. doi: 10.1016/j.amsu.2022.104841, PMID 36536710.
Howery KE, Clemmer KM, Simsek E, Kim M, Rather PN, editors. Regulation of the min cell division inhibition complex by the rcs phosphorelay in proteus mirabilis. J Bacteriol. 2015;197(15):2499-507. doi: 10.1128/JB.00094-15, PMID 25986901.
Saito Y, Tanaka A, Node K, Kobayashi Y. Uric acid and cardiovascular disease: a clinical review. J Cardiol. 2021;78(1):51-7. doi: 10.1016/j.jjcc.2020.12.013, PMID 33388217.
Mandal AK, Mount DB. The molecular physiology of uric acid homeostasis. Annu Rev Physiol. 2015;77:323-45. doi: 10.1146/annurev-physiol-021113-170343, PMID 25422986.
Andres M, Sivera F, Buchbinder R, Pardo Pardo J, Carmona L. Dietary supplements for chronic gout. Cochrane Database Syst Rev. 2021;11(11):CD010156. doi: 10.1002/14651858.CD010156.pub3, PMID 34767649.
Van Durme CM, Wechalekar MD, Landewe RB, Pardo Pardo J, Cyril S, Van Der Heijde D. Non-steroidal anti-inflammatory drugs for acute gout. Cochrane Database Syst Rev. 2021;12(12):CD010120. doi: 10.1002/14651858.CD010120.pub3, PMID 34882311.
Si K, Wei C, Xu L, Zhou Y, Lv W, Dong B. Hyperuricemia and the risk of heart failure: pathophysiology and therapeutic implications. Front Endocrinol (Lausanne). 2021;12:770815. doi: 10.3389/fendo.2021.770815, PMID 34867815.
Pennington E, Bell S, Hill JE. Should video laryngoscopy or direct laryngoscopy be used for adults undergoing endotracheal intubation in the pre-hospital setting? A critical appraisal of a systematic review. J Paramed Pract. 2023;15(6):255-9. doi: 10.1002/14651858, PMID 38812899.
Winston AP. The clinical biochemistry of anorexia nervosa. Ann Clin Biochem. 2012;49(2):132-43. doi: 10.1258/acb.2011.011185, PMID 22349551.
Chu EC, Chin WL, Bhaumik A. Cervicogenic dizziness. Oxf Med Case Reports. 2019;2019(11):476-8. doi: 10.1093/omcr/omz115, PMID 31844531.
Estcourt LJ, Malouf R, Hopewell S, Doree C, Van Veen J. Use of platelet transfusions prior to lumbar punctures or epidural anaesthesia for the prevention of complications in people with thrombocytopenia. Cochrane Database Syst Rev. 2018;4(4):CD011980. doi: 10.1002/14651858.CD011980.pub3, PMID 29709077.
Machado RF, Gladwin MT. Pulmonary hypertension in hemolytic disorders: pulmonary vascular disease: the global perspective. Chest. 2010;137(6 Suppl):30S-8S. doi: 10.1378/chest.09-3057, PMID 20522578.
Carapancea E, Cornet MC, Milh M, De Cosmo L, Huang EJ, Granata T. Clinical and neurophysiologic phenotypes in neonates with BRAT1 encephalopathy. Neurology. 2023;100(12):e1234-47. doi: 10.1212/WNL.0000000000206755, PMID 36599696.
Elumalai S, Sharma M, Dantinapalli VLS, Palanisamy M. Comprehensive RP-HPLC analysis of sulopenem etzadroxil and probenecid: development validation and stability studies. IJDDT. 2025;15(1):132-8. doi: 10.25258/ijddt.15.1.18.
Choppella V, Badipati RB, Badipati S, Gonthina H, Chukka VK. Stability indicating method development and validation for simultaneous quantification of sorafenib and regorafenib drug subtances by using RP-UPLC. Int J Curr Pharm Sci. 2020;12(1):56-62. doi: 10.22159/ijcpr.2020v12i1.36832.
Ashok G, Mondal S. Stability-indicating method development and validation for the estimation of cabozantinib in pharmaceutical dosage forms by ultra-performance liquid chromatography. Asian J Pharm Clin Res. 2018;11(10):238-41. doi: 10.22159/ajpcr.2018.v11i10.27409.
International Conference on Harmonisation (ICH). ICH Harmonised Tripartite Guideline: Validation of Analytical Procedures-Text and Methodology Q2(R1). Geneva: ICH; 2005.
ICH Harmonised Tripartite Guideline: Impurities in New Drug Products Q3B(R2). Geneva: ICH; 2006.
Vijayakumari M, Reddy Ch B. Stability indicating validated HPLC method for the determination of zanubrutinib in bulk and pharmaceutical dosage form. Asian J Pharm Clin Res. 2020;13(10):159-62. doi: 10.22159/ajpcr.2020.v13i10.38621.
Mohanty D, Ray P. Stress degradation studies and development of a validated RP-HPLC method for determination of tiagabine in presence of its degradation products. Int J Pharm Pharm Sci. 2016;8(11):230-6. doi: 10.22159/ijpps.2016v8i11.12683.
Liana A, Haluszczuk A, Gawor A, Bulska E. Identification and structural characterization of degradation products of linagliptin by mass spectrometry techniques. Int J Mol Sci. 2024;25(5):2591. doi: 10.3390/ijms25052591, PMID 38473837.
Sukanya B, Mohan Goud V, Anitha P. Stability indicating ultra performance liquid chromatography method development and validation for simultaneous estimation of artemether and lumefantrine in bulk and pharmaceutical dosage form. J Drug Deliv Ther. 2019;9(2):217-21. doi: 10.22270/jddt.v9i2.2408.
Tabassum R, Rizwan SH. Stability indicating analytical method development and validation for the estimation of ruxolitinib in bulk and pharmaceutical dosage form using UPLC. Int J Pharm Pharm Sci. 2023;15:40-6. doi: 10.22159/ijpps.2023v15i2.46839.
Alumuri T, Amarababu NL, Kurnool A, Kanuparthy PR, Merugu K. Development and validation of a stability indicating related substances of atenolol and nitrendipine by RP-HPLC. Int J App Pharm. 2022;14(4):265-73. doi: 10.22159/ijap.2022v14i4.44531.
Sesharao M, Madhavarao V. A new validated simultaneous reversed-phase high-performance liquid chromatography assay method for estimation of two flavones (baicalein and chrysin) in api drugs. Asian J Pharm Clin Res. 2018;11(1):351. doi: 10.22159/ajpcr.2017.v11i1.21174.
Satyadev TN, Uma Mahesh A, Durga Bhavani N, Rohith M, Nirnajan N, Venu Gopala Krishna UlN, Ramanajaneyulu K. High performance liquid chromatographic mass spectrometric method for development and validation of Belzutifan in rat plasma. High Technol Lett. 2023;29:640-54.
Naresh P, Kumar KV. Leflunomide tablet formulation: development and validation of an RP-HPLC technique. Int J Pharm Pharm Sci. 2023;15(1):16-21. doi: 10.22159/ijpps.2023v15i1.46505.
Rao N, Gawde KD. Method development and force degradation studies for simultaneous estimation of salbutamol sulfate etofylline and bromhexine hydrochloride in pharmaceutical dosage form using reversed-phase high-performance liquid chromatography method. Asian J Pharm Clin Res. 2018;11(8):378. doi: 10.22159/ajpcr.2018.v11i8.26119.
Dev S, TNVSS, Chintalapudi Ramakrishna. A new related substances method development and validation of two anti-cancer drugs by using effective liquid chromatographic method. Int J Appl Pharm. 2022;14(2):116-24. doi: 10.22159/ijap.2022v14i2.43582.
Satyadev TN, Kanthi Priya S, Nisitha YK, Lakshmi Sravani MS, Sree TR, Naga Naveen M. Analytical method development and validation of cefixime and lactobacillus by using RP-UPLC in bulk and pharmaceutical dosage form. Afr J Biomed Res. 2024;27(4S):8005–12. doi: 10.53555/AJBR.v27i4S.5121.
Rayudu S, Manoranjani M, Sekhara Reddy DR. Analytical method development and validation of dexmethylphenidate and serdexmethylphenidate by using RP-HPLC in bulk and pharmaceutical dosage form. Int J App Pharm. 2022;14(2):110-5. doi: 10.22159/ijap.2022v14i2.43515.
Mohanty D, Ray P. Stress degradation studies and development of a validated RP-HPLC method for determination of tiagabine in presence of its degradation products. Int J Pharm Pharm Sci. 2016;8(11):230-6. doi: 10.22159/ijpps.2016v8i11.12683.
Charu Pandya P, Sadhana Rajput J. Development and validation of stability indicating method RP-HPLC method of acotiamide. Int J Pharm Pharm Sci. 2018;10(9):1-8. doi: 10.22159/ijpps.2%20018v10i9.24925.
Prasada Rao PTSRK. HPLC method development and validation of lercanidipine HCl and atenolol characterization of its degradants by using LC-MS/MS. Int J Appl Pharm. 2022;14(2):125-34. doi: 10.22159/ijap.2022v14i2.43624.
Manoranjani M. LC-MS/MS method for simultaneous estimation of ethinyl estradiol and etonogestrel in rat plasma and its application to pharmacokinetic study. High Technol Lett. 2023;29:543-6.
Dev S, TNVSS, Chintalapudi Ramakrishna. A new related substances method development and validation of two anti-cancer drugs by using effective liquid chromatographic method. Int J Appl Pharm. 2022;14(2):116-24. doi: 10.22159/ijap.2022v14i2.43582.
Manoranjani M. Assay method development and validation of cilnidipine and ramipril characterization of its degradants by using LC-MS/MS. Int J Appl Pharm. 2022;14(2):276-85. doi: 10.22159/ijap.2022v14i2.43570.
Vejendla A, Talari S, Ramu G, Rajani Ch. Characterization of novel stress degradation products of bempedoic acid and ezetimibe using UPLC-MS/MS: development and validation of stability indicating UPLC method. Futur J Pharm Sci. 2021;7:234. doi: 10.1186/s43094-021-00381-6.
Sailaja O, Manoranjani M, Krishnaveni G. Simultaneous estimation of aflatoxins (B1, B2, G1 and G2) by liquid chromatography coupled with mass spectrometry (LC-MS) in corn samples. Asian J Chem. 2021;33(3):521-6. doi: 10.14233/ajchem.2021.23031.
Vejendla A, Talari S, Moturu R, Murthy Boddapati SN, Kola AE. Method development and validation for cabotegravir and rilpivirine by using HPLC and its degradants are characterized by LCMS and FTIR. Futur J Pharm Sci. 2021;7:1-18. doi: 10.1186/s43094-021-00355-8.