
Int J App Pharm, Vol 18, Issue 1, 2026, 280-388Original Article
ANALYTICAL METHOD DEVELOPMENT AND VALIDATION OF SODIUM PHENYLBUTYRATE AND TAURURSODIOL BY USING RP-HPLC IN BULK AND PHARMACEUTICAL DOSAGE FORM
SUNIL RAYUDU1, M. MANORANJANI2*, D. ANITHA3
1Department of Chemistry, Krishna University, Machilipatnam-521004, AP, India. 2*Department of Chemistry, PB Siddhartha College of Arts and Science, Vijayawada-520010, AP, India. 3Department of Chemistry, Dhanekula Institute of Engineering and Technology (DIET), Vijayawada, AP, India
*Corresponding author: M. Manoranjani; *Email: drmanoranjani@gmail.com
Received: 13 May 2025, Revised and Accepted: 12 Nov 2025
ABSTRACT
Objective: In order to assess Sodium Phenylbutyrate and Taurursodiol, two active pharmaceutical components, simultaneously, this study set out to create and validate a new RP-HPLC (Reverse Phase High Performance Liquid Chromatography) technique that was simple, responsive, and stable.
Methods: An X-bridge phenyl column with dimensions 150x4.6 mm and a 3.5 µ was used in the chromatographic approach. The mobile phase consisted of acetonitrile and 0.1% triethyl amine with a pH of 2.5, adjusted with OPA (Ortho Phosphoric Acid) in a ratio of 40:60. Isocratic elution was used. The instrumental conditions were set to 1.0 ml/min with a detection wavelength of 266 nm using the PDA (Photo Diode Array) detector. Validation of the proposed method was carried out according to an international conference on harmonization (ICH) guidelines.
Results: The calibration curves were linear, with a regression coefficient (R2) value of 0.999 and concentrations ranging from 75 to 450 µg/ml of Sodium phenylbutyrate and 25–150 µg/ml of Taurursodiol. The method’s LOD (Limit Of Detection) and LOQ (Limit Of Quantification) were 0.63 µg/ml, 0.21 µg/ml, and 2.1 µg/ml, 0.7 µg/ml for Sodium Phenylbutyrate and Taurursodiol, respectively.
Conclusion: The proposed method to be fast, simple, feasible and affordable in assay condition. During stability tests, it can be used for routine analysis of production samples and to verify the quality of drug samples during stability studies.
Keywords: Sodium phenylbutyrate, Taurursodiol, RP-HPLC, Development, Validation
© 2026 The Authors. Published by Innovare Academic Sciences Pvt Ltd. This is an open access article under the CC BY license (https://creativecommons.org/licenses/by/4.0/)
DOI: https://dx.doi.org/10.22159/ijap.2026v18i1.55081 Journal homepage: https://innovareacademics.in/journals/index.php/ijap
INTRODUCTION
Sodium phenylbutyrate, a salt of an aromatic fatty acid, 4-phenylbutyrate (4-PBA) or 4-phenylbutyric acid, is offered under many trade names, including Buphenyl. The compound's metabolites provide an alternate route for nitrogen excretion, which is why it is utilized to treat urea cycle abnormalities [1]. Research into sodium phenylbutyrate's potential as an anti-cancer drug and by its roles as a chemical chaperone and histone deacetylase inhibitor [2, 3], respectively, in protein misfolding illnesses such cystic fibrosis [4, 5] has been prompted. Sodium phenylbutyrate has an extremely salty and bitter taste when administered orally or by nasogastric intubation [6, 7]. It is available as a tablet or powder. In urea cycle disorders, a condition known as hyperammonemia [8] occurs when the enzymes carbamoyl phosphate synthetase I, ornithine transcarbamylase, or argininosuccinic acid synthetase are impaired, leading to an accumulation of nitrogen waste in the blood plasma as ammonia glutamine. This condition may be treated with this medication. This leads to premature mortality and intellectual disability if left unchecked. It is common for children born with urea cycle problems to live beyond 12 mo with the help of sodium phenylbutyrate metabolites, which the kidneys may use to eliminate excess nitrogen instead of urea. Dialysis, amino acid supplements, and a protein-restricted dietal. l contribute to this survival. Lifelong therapy may be necessary for certain patients. Amenorrhea or menstrual disruption [9, 10] may have a negative impact on around 25% of women [9, 10]. Anorexia is experienced by 4% of patients. The phenylbutyrate metabolism causes 3% of patients to smell bad and 3% to taste bad. Among the many documented side effects, fewer than 2% of individuals have gastrointestinal problems [11] and, on the other hand, largely modest signs of neurotoxicity [12]. Sodium phenylbutyrate should not be administered to a pregnant woman because treatment could mimic maternal phenylketonuria [13, 14] due to the production of phenylalanine, potentially causing fetal brain damage.
One formulation of tauroursodeoxycholic acid (TUDCA) that has an international nonproprietary name (INN) is ursodoxicoltaurine. Taurursodiol is another name for it. The taurine-conjugated version of ursodeoxycholic acid (UDCA), tauroursodeoxycholic acid is a hydrophilic bile acid [15, 16] that occurs naturally. When it comes to bile, bears have far higher concentrations of tauroursodeoxycholic acid and ursodeoxycholic acid than humans do. It has also been proposed that the medicine might be useful in treating heart disease [17, 18], Huntington's disease [19, 20], Parkinson's disease [21, 22], amyotrophic lateral sclerosis [23, 24], and stroke in view of the drug's ability to reduce apoptotic [25] effects. The purpose of this research is to use RP-HPLC to determine the amounts of the pharmaceutical components taurursodiol and sodium phenylbutyrate. Fig. 1 shows the Chemical structures of Sodium phenyl butyrate and Taurursodiol.
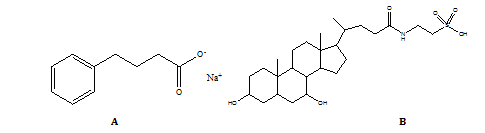
Fig. 1: Chemical structures of (A) Sodium phenylbutyrate and (B) Taurursodiol
So far, three UPLC (Ultra Performance Liquid Chromatography) methods [26-28] and one HPLC method [29] have been documented in the literature. Hence, we developed method for the quantification of Sodium phenylbutyrate and Taurursodiol. The developed HPLC method was utilized for the estimation of the drug by in vitro method. Available methods were shown in table 1.
MATERIALS AND METHODS
Chemicals
The following ingredients were sourced from Merck India Ltd, Mumbai, India: acetonitrile (HPLC-grade), orthophosphoric acid, triethylamine, and water. Zydus Cadila of Ahmedabad was contacted to get the sodium phenylbutyrate and taurursodiol standard APIs. The sample is a gifted sample.
The instrumentation
Waters alliance liquid chromatography (model e-2695) monitored with empower 2.0 data handling system and a detector of photo diode array (model 2998) was used for this study [30, 31].
Method optimization
Various ratios of acetonitrile to phosphate buffer in the mobile phase with isocratic mode were investigated in order to improve the chromatographic conditions. Resolution and retention time were both improved with trial-to-trial adjustments to the mobile phase's composition. Because it increases the responsiveness of the active pharmaceutical components, a pH-2.5 solution of triethylamine adjusted with an OPA buffer and acetonitrile using isocratic elution was finally chosen. The process was optimized by testing it with several stationary phases, including amino phenyl columns, C8, and C18. Using a PDA detector and an X-Bridge phenyl column of 150 x 4.6 mm, the peak shape was found to be pretty satisfactory in these testing. To achieve sufficient sensitivity, the mobile phase flow rate was set at 266 nm. The retention duration of sodium phenylbutyrate, under the aforementioned circumstances, was about 2.145 min, and the tailing factor was 0.94. Taurursodiol retention time was 3.768 min with a tailing of 1.02 and plate count 4521, indicating the column's successful output, while the number of theoretical plates for Sodium Phenylbutyrate was 8963. The suggested method seems to be very accurate, as the % RSD for six duplicate injections of Sodium Phenylbutyrate was 0.72% and for Taurursodiol it was 1.29%. We verified the procedure according to ICH criteria.
Validation procedure
The analytical parameters such as system suitability, precision, specificity, accuracy, linearity, robustness, LOD, LOQ, forced degradation and stability were validated according to ICH Q2 (R1) guidelines [31-34].
Preparation of buffer
Dissolve 1 ml of triethylamine in 1 L of high-performance liquid chromatography (HPLC) water, adjust the pH to 2.5 using ortho-phosphoric acid, and filter the mixture through a 0.45 µ filter paper. (OPA improves the separation and peak shape of analytes).
Wavelength determination
In simultaneous estimation of two drugs isobestic wavelength was used. Isobestic point is the wavelength where the molar absorptivity is the same for two substances that are interconvertible. So this wavelength was used in simultaneous estimation to estimate two drugs accurately. The absorption curve shows isobestic point at 266 nm. Thus 266 nm was selected as detector wavelength for the HPLC chromatographic method.
Chromatographic conditions
The X-bridge phenyl (150x4.6 mm, 3.5 μ) column was used in conjunction with an acetonitrile and 0.1% TEA mobile phase and an isocratic elution mode on a reverse-phase HPLC system operating at a flow rate of 1 ml/min to conduct the HPLC study.
Diluent: A mixture of Acetonitrile+water (50+50) was used as diluent.
Standard solution preparation (Sodium Phenyl Butyrate 300 µg/ml and Taurursodiol 100 µg/ml)
Accurately weighed 30 mg of Sodium phenyl butyrate and 10 mg of Taurursodiol working standards were transferred into a 10 ml volumetric flask, and 7 ml of diluent was added and sonicated to dissolve it. Then, the volume was made up to the mark with diluents (Concentration of Sodium Phenyl butyrate was 3000 µg/ml and 1000 µg/ml). Further, diluted 1 ml of the above solution was transferred into a 10 ml volumetric flask with diluent (Concentration of Sodium Phenyl butyrate was 300 µg/ml and 100 µg/ml). [A sonicator frequency of 40 KHz and a power of 360 W were used].
Sample solution preparation (Sodium Phenyl Butyrate 300 µg/ml and Taurursodiol 100 µg/ml)
The samples were prepared by dissolving the sample powder equivalent to 30 mg of Sodium phenyl butyrate and 10 mg of Taurursodiol, and they were transferred into a 10 ml volumetric flask, and 7 ml of diluents was added, ultra sonicated for 20 min, and diluted up to 10 ml mark with diluents (Concentration of Sodium Phenyl butyrate was 3000 µg/ml and 1000 µg/ml). Further, diluted 1 ml of the sample stock solution was transferred into a 10 ml volumetric flask with diluents (Concentration of Sodium Phenyl butyrate was 300 µg/ml and 100 µg/ml). Finally, the solution was filtered by utilizing a 0.45 μ syringe filter before injecting into the LC column.
RESULTS AND DISCUSSION
The separation of active pharmaceutical components posed the greatest analytical difficulty to the development of a novel approach. We tuned the chromatographic conditions to ensure optimal performance.
System suitability
In System suitability, injecting standard solution and reported USP tailing and plate count values are tabulated in table 2 and the standard chromatogram was shown in fig. 2 [35, 36].
Specificity
In this experiment, the interference was examined by separately analyzing the placebo and standard solutions. There was no interference of placebo with the primary peak, and the active components were well separated from blank and their excipients, as seen in the fig. 3 below. Hence the method is specific [37].
Table 2: Results of system suitability
| System suitability parameter | Sodium phenylbutyrate | Taurursodiol | ||
| Mean | Std Dev | Mean | Std Dev | |
| USP Plate Count | 8981 | 0.00638 | 4537 | 0.00158 |
| USP Tailing | 0.97 | 0.00261 | 1.05 | 0.01163 |
| USP Resolution | - | - | 7.05 | 0.00482 |
| Retention time | 2.153 | 0.00745 | 3.758 | 0.00359 |
Mean±SD (n=6)
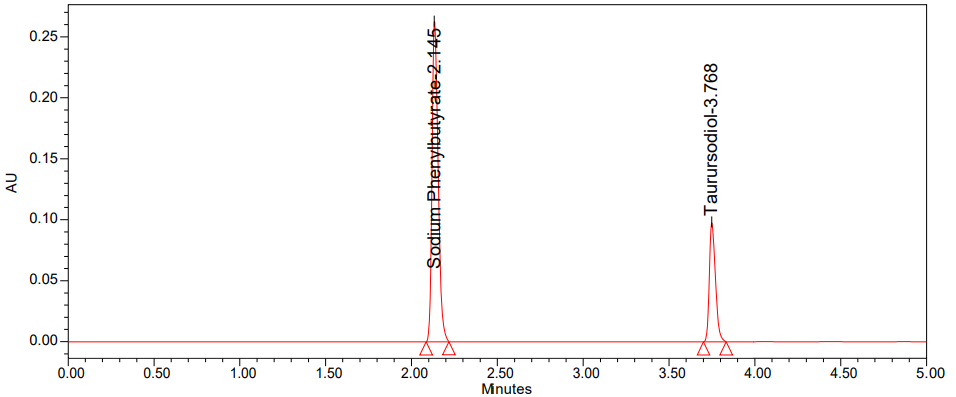
Fig. 2: Chromatogram of standard
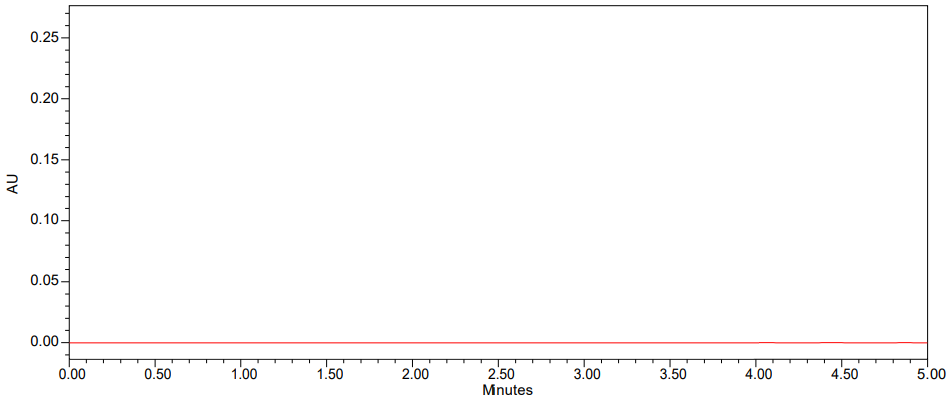
Fig. 3: Chromatogram of blank
Linearity
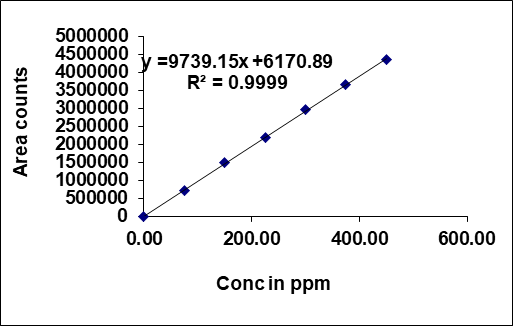
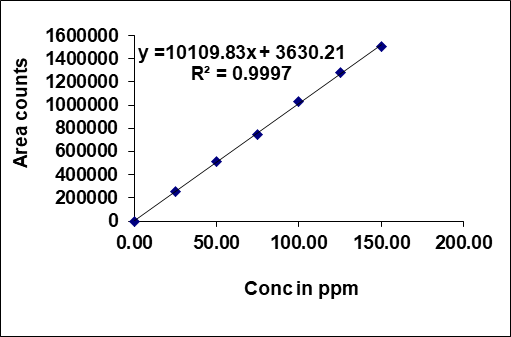
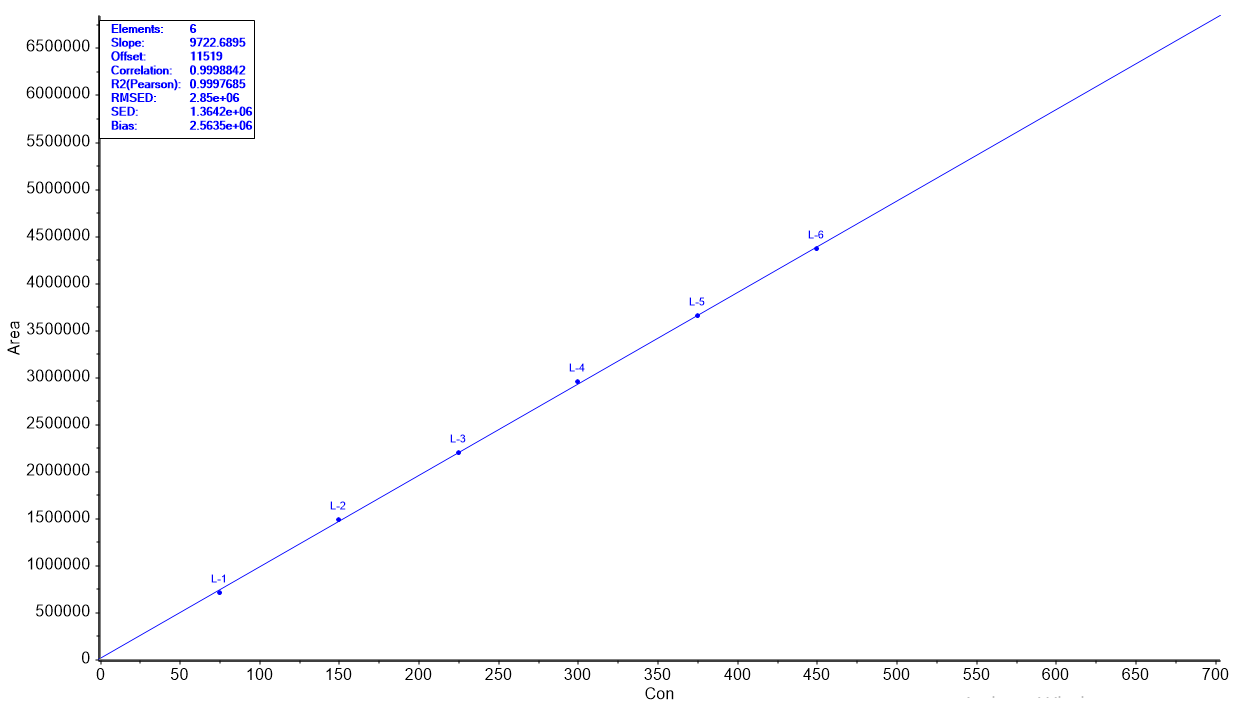
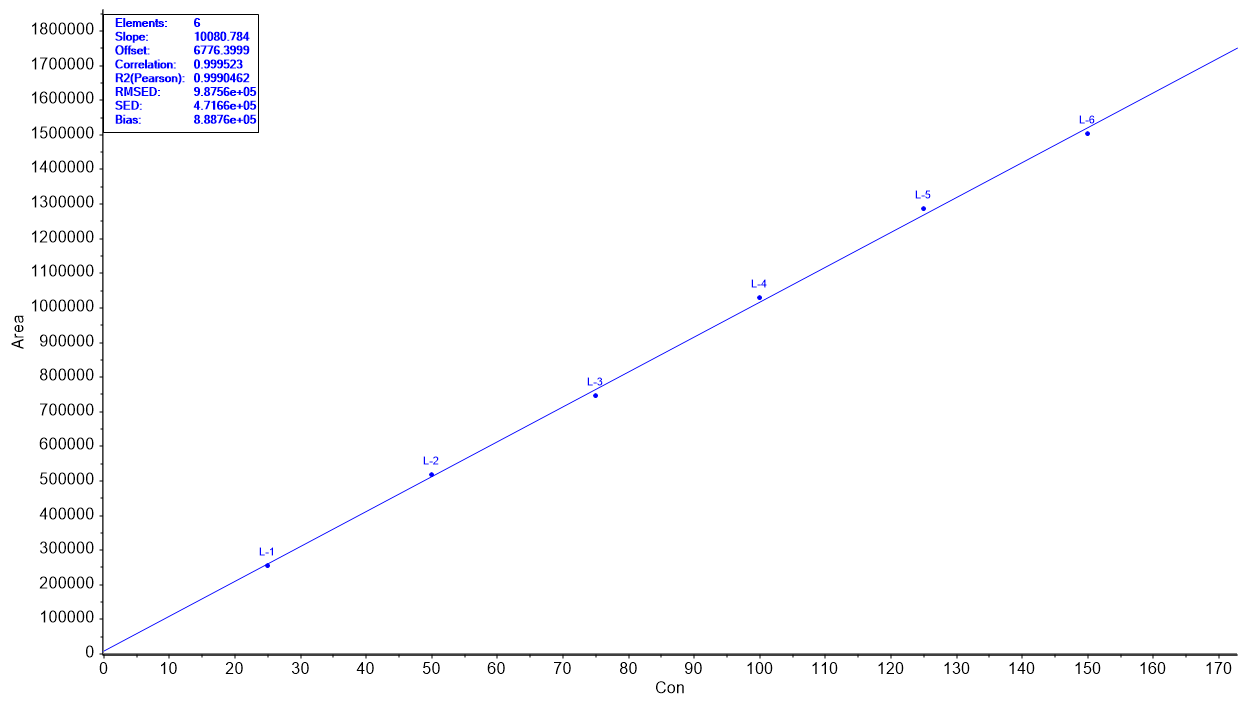
The area of the linearity peak versus different concentrations has been evaluated for Taurursodiol as 25, 50, 75, 100, 125, 150 percent dilutions [38], respectively. Linearity was performed in the range of 75-450 µg/ml of Taurursodiol and 25-150 µg/ml of Sodium Phenylbutyrate. The correlation coefficient achieved greater than 0.999 for all. Calibration plots of Sodium Phenyl butyrate and Taurursodiol were shown in fig. 4.
Table 3: Linearity results
| S. No. | Sodium phenylbutyrate | Taurursodiol | ||
| Conc. (µg/ml) | Area count | Conc. (µg/ml) | Area count | |
| 1 | 75 | 715240 | 25 | 255496 |
| 2 | 150 | 1485769 | 50 | 516387 |
| 3 | 225 | 2201547 | 75 | 746524 |
| 4 | 300 | 2956341 | 100 | 1027458 |
| 5 | 375 | 3658246 | 125 | 1284816 |
| 6 | 450 | 4365207 | 150 | 1502389 |
| Correl coeff | 0.99993 | 0.99970 | ||
| Slope | 9739.15 | 10109.83 | ||
| intercept | 6170.89 | 3630.21 | ||
A B
Fig. 4: Calibration plot of (A) Sodium Phenylbutyrate and (B) Taurursodiol
A
B
Fig. 5: ANOVA for linearity plot of (A) Sodium phenylbutyrate and (B) Taurursodiol
Accuracy
In order to evaluate the precision of this approach, three different concentration levels 50, 100, and 150 percent, within a predetermined range were used. Results showed that the new approach was both accurate and dependable. The recovery percentages were given in table 4 [39, 40].
Precision
For the method precision research, six distinct sample solutions were prepared and injected into the HPLC system with varying concentrations of Sodium Phenylbutyrate (300 µg/ml) and Taurursodiol (100 µg/ml). A range of 98% to 102% was discovered in the test findings. The mean, standard deviation, and percentage of reliability were determined by calculating the peak regions. These results are given below table 5 [41]. Method precision chromatogram was shown in fig. 6.
Intermediate precision
Each of the six sample solution replicates was independently investigated using different instruments (Waters HPLC 2695 Alliance model and Agilent HPLC 1200 model) on a separate day in same place. We have computed and determined the mean and RSD values from the peak locations. Six separate samples [42] were used for the analysis of Taurursodiol (100 μg/ml) and Sodium Phenylbutyrate (300 μg/ml) on separate days. Using the regions of the peaks, we were able to determine the mean, standard deviation, and percentage of standard deviation. With RSD values below 2% and percent assay values close to 100%, it is clear that the present approach produces very reliable findings. In table 6 we can see the results.
Table 4: Results of accuracy
| S. No. | % Level | Sodium phenylbutyrate | Taurursodiol | ||
| Mean % recovery | Std dev | Mean % recovery | Std dev | ||
| 1 | 50 | 98.8 | 0.353 | 99.8 | 0.239 |
| 2 | 100 | 100.2 | 0.533 | 99.7 | 0.755 |
| 3 | 150 | 98.9 | 0.542 | 98.6 | 0.567 |
n=3
Table 5: Intraday precision results
| S. No. | Sodium Phenylbutyrate | Taurursodiol | ||||
| Conc.(µg/ml) | Area counts | % Assay as is | Conc.(µg/ml) | Area counts | % Assay as is | |
| 1 | 300 | 2910417 | 99.1 | 100 | 1032541 | 99.5 |
| 2 | 2915326 | 99.3 | 1021574 | 98.5 | ||
| 3 | 2953268 | 100.5 | 1025289 | 98.8 | ||
| 4 | 2932514 | 99.8 | 1042040 | 100.4 | ||
| 5 | 2921501 | 99.5 | 1044146 | 100.6 | ||
| 6 | 2934712 | 99.9 | 1040578 | 100.3 | ||
| % RSD | 0.50 | % RSD | 0.89 | |||
| Mean | 99.7 | Mean | 99.7 | |||
| SD | 0.507 | SD | 0.889 | |||
n=6
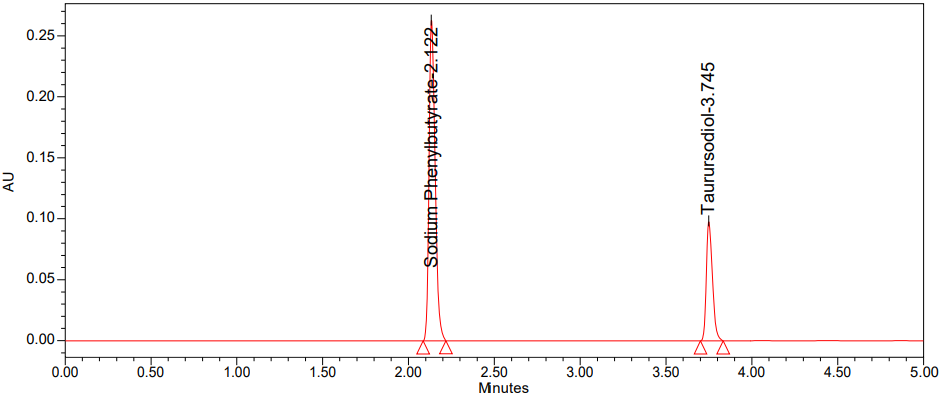
Fig. 6: Chromatogram of method precision
Table 6: Inter-day outcomes of accuracy of sodium phenylbutyrate
| S. No. | Sodium phenylbutyrate | Taurursodiol | ||||
| Conc.(µg/ml) | Area counts | % Assay as is | Conc.(µg/ml) | Area counts | % Assay as is | |
| 1 | 300 | 2934307 | 99.7 | 100 | 1024157 | 98.9 |
| 2 | 2953204 | 100.4 | 1036958 | 100.1 | ||
| 3 | 2934619 | 99.7 | 1030258 | 99.5 | ||
| 4 | 2944124 | 100.1 | 1021457 | 98.6 | ||
| 5 | 2965761 | 100.8 | 1036697 | 100.1 | ||
| 6 | 2951240 | 100.3 | 1021052 | 98.6 | ||
| % RSD | 0.43 | % RSD | 0.71 | |||
| Mean | 100.2 | Mean | 99.3 | |||
| SD | 0.427 | SD | 0.701 | |||
n=6
LOD and LOQ
The LOD concentration of Sodium Phenylbutyrate was 0.63 µg/ml and s/n values is 3 and Taurursodiol was 0.21 µg/ml and s/n values is 3. The LOQ concentration for Sodium Phenylbutyrate was 2.1 µg/ml and their s/n values are 10, and Taurursodiol was 0.7 µg/ml and s/n values is 10. The method is validated as per the ICH guidelines [43, 44]. To establish the least conc 0.63, 0.21 µg/ml. These are detected in HPLC and LCMS detects 103 times of HPLC. So that they can be easily detected in LCMS.
Table 7: LOD and LOQ for sodium phenylbutyrate
| Sodium phenylbutyrate | Taurursodiol | ||||||
| LOD | LOQ | LOD | LOQ | ||||
| Concentration | s/n | Concentration | s/n | Concentration | s/n | Concentration | s/n |
| 0.63µg/ml | 3 | 2.1µg/ml | 10 | 0.21µg/ml | 3 | 0.7µg/ml | 10 |
Robustness
Intentionally changing the experiment's design allowed us to assess the system's resilience. Modifications like this may alter the organic ratio, the flow rate. The results were robust and tabulated in table 8 [45]. According to ICH guidelines flow rate was changed in robustness.
Degradation studies
Samples of taurursodiol and sodium phenylbutyrate were partially degraded by subjecting them to a range of forced degradation conditions. The efficacy of the approach for product degradation has been the subject of research [46, 47]. The studies also describe the drug's unstable settings, which adds further information. In order to prevent potential instability, it is necessary to take the necessary measures during formulation [48, 49].
Acid degradation
In acid degradation, the 100 mg of sample having 1 ml of 1 N HCl was transferred into a 10 ml volumetric flask and remains undisturbed for 15 min. After 15 min neutralized with 1 ml of 1 N NaOH. Then, it was made up to the mark with diluent. Further, diluted 1 ml of the above solution was transferred into a 10 ml volumetric flask with diluent and then filtered and injected into HPLC system.
Alkali degradation
In alkali degradation, the 100 mg of sample having 1 ml of 1 N NaOH was transferred into a 10 ml volumetric flask and remains undisturbed for 15 min. After 15 min neutralized with 1 ml of 1 N HCl. Then, it was made up to the mark with diluent. Further, diluted 1 ml of the above solution was transferred into a 10 ml volumetric flask with diluent and then filtered and injected into HPLC system.
Peroxide degradation
In peroxide degradation, the 100 mg of sample, having 1 ml of 10% hydrogen peroxide was transferred into a 10 ml volumetric flask and remains undisturbed for 15 min. After 15 min, it was made up to the mark with diluent. Further, diluted 1 ml of the above solution was transferred into a 10 ml volumetric flask with diluent and then filtered and injected into HPLC system.
Reduction degradation
In reduction degradation, the 100 mg of sample having 1 ml of 10% sodium bi sulphite solution was transferred into a 10 ml volumetric flask and remains undisturbed for 15 min. After 15 min, it was made up to the mark with diluent. Further, diluted 1 ml of the above solution was transferred into a 10 ml volumetric flask with diluent and then filtered and injected into HPLC system.
Thermal degradation
In thermal degradation, 150 mg sample powder was weighed in a petri dish and exposed to dry heat at 105 °C for 6 h. After that, 100 mg of Sodium phenyl butyrate and Taurursodiol exposed sample was weighed, transferred into a 10 ml volumetric flask, and dissolved in a diluent. Then, it was made up to the mark with diluent. Further, diluted 1 ml of the above solution was transferred to a 10 ml volumetric flask with diluent.
Photo degradation
In photolytic degradation, 200 mg of sample was placed in photo stability chamber for 6 h. After that, 100 mg of Sodium phenyl butyrate and Taurursodiol exposed sample was weighed, transferred into a 10 ml volumetric flask, and dissolved in a diluent. Then, it was made up to the mark with diluent. Further, diluted 1 ml of the above solution was transferred to a 10 ml volumetric flask with diluent.
Hydrolysis degradation
In hydrolysis degradation, the 100 mg of sample having 1 ml of HPLC water was transferred into a 10 ml volumetric flask and remains undisturbed for 15 min. After 15 min, it was made up to the mark with diluent. Further, diluted 1 ml of the above solution was transferred into a 10 ml volumetric flask with diluent and then filtered and injected into HPLC system.
We can see all of the degradation findings in table 9 and the degradation chromatograms were shown in fig. 7-11.
Table 8: Robustness data of sodium phenylbutyrate
| Parameter name | Sodium phenylbutyrate | Taurursodiol | ||||
| Mean | SD | %RSD | Mean | SD | %RSD | |
| Flow minus (0.9 ml/min) | 99.7 | 0.513 | 0.51 | 99.6 | 0.777 | 0.78 |
| Flow plus (1.1 ml/min) | 99.6 | 0.361 | 0.36 | 99.6 | 0.651 | 0.65 |
| Organic minus (36:64) | 99.9 | 0.700 | 0.70 | 99.8 | 0.513 | 0.51 |
| Organic plus (44:56) | 99.8 | 0.569 | 0.57 | 99.3 | 0.624 | 0.63 |
RSD-Relative standard deviation; All the values are presented as mean±SD (n=3)
Table 9: Forced degradation results of sodium phenylbutyrate
| Degradation condition | Sodium phenylbutyrate | Taurursodiol |
| Mean % assay | Std deviation | |
| Control degradation | 99.9 | 0.15275 |
| Acid degradation | 86.7 | 0.20043 |
| Alkali degradation | 87.1 | 0.15213 |
| Peroxide degradation | 85.2 | 0.36056 |
| Reduction degradation | 90.1 | 0.32141 |
| Hydrolysis degradation | 99.1 | 0.12034 |
| Thermal degradation | 96.4 | 0.01753 |
| Photolytic degradation | 95.5 | 0.18964 |
Data expressed as mean±SD (n=3)
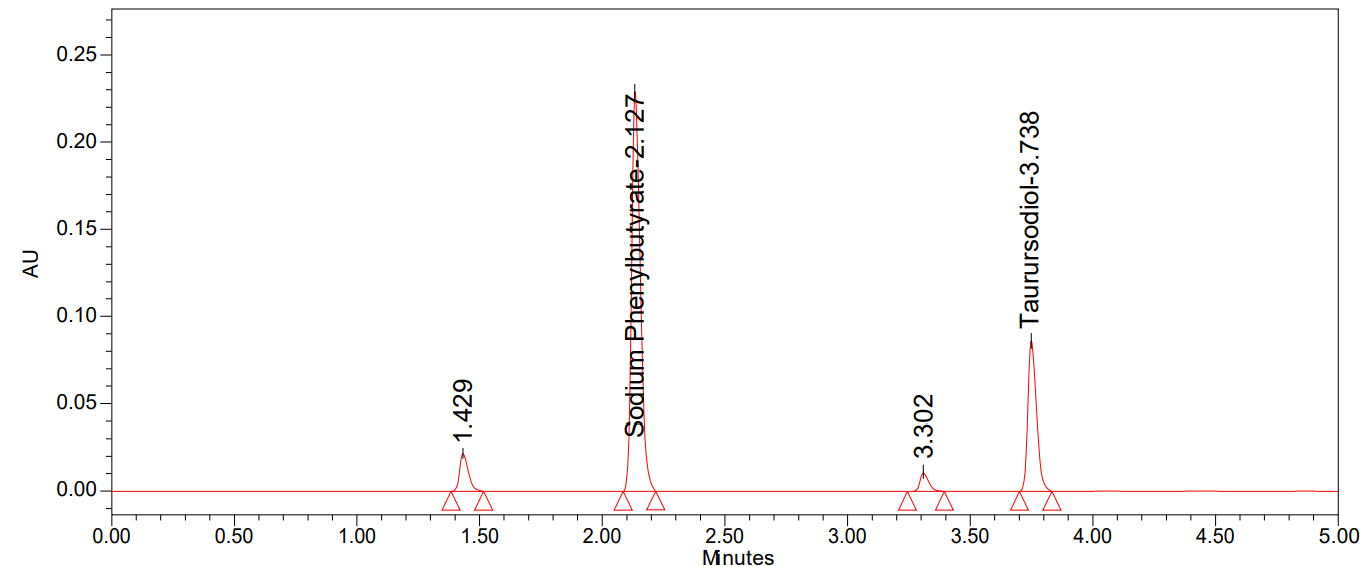
Fig. 7: Chromatogram of acid degradation
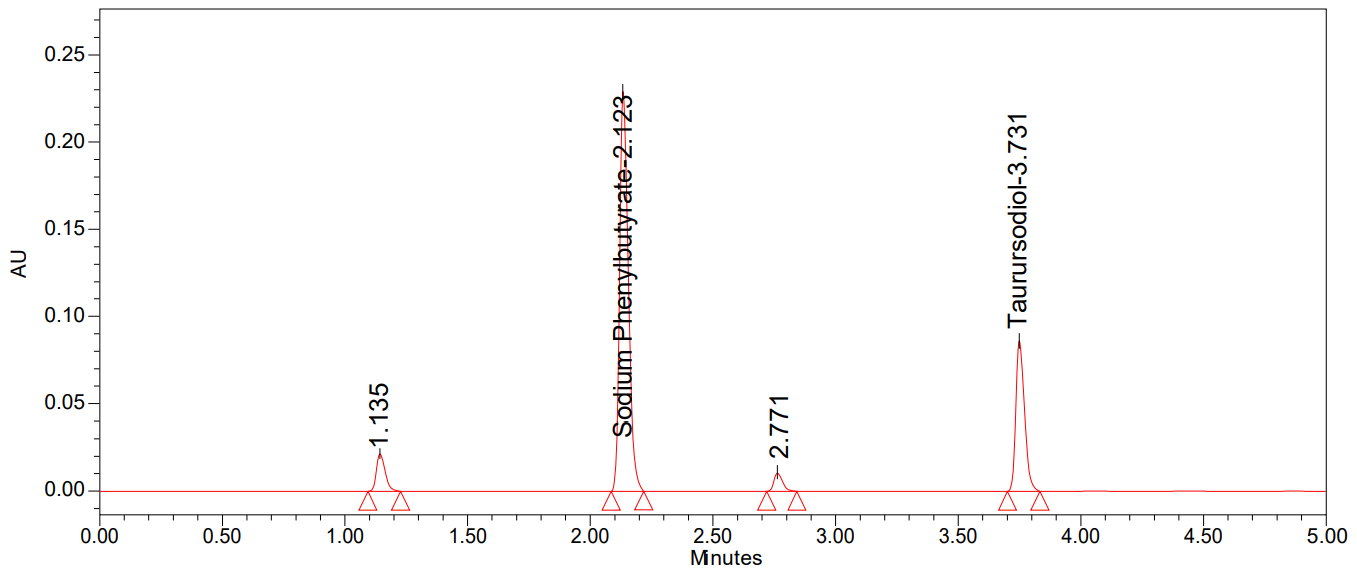
Fig. 8: Chromatogram of alkali degradation
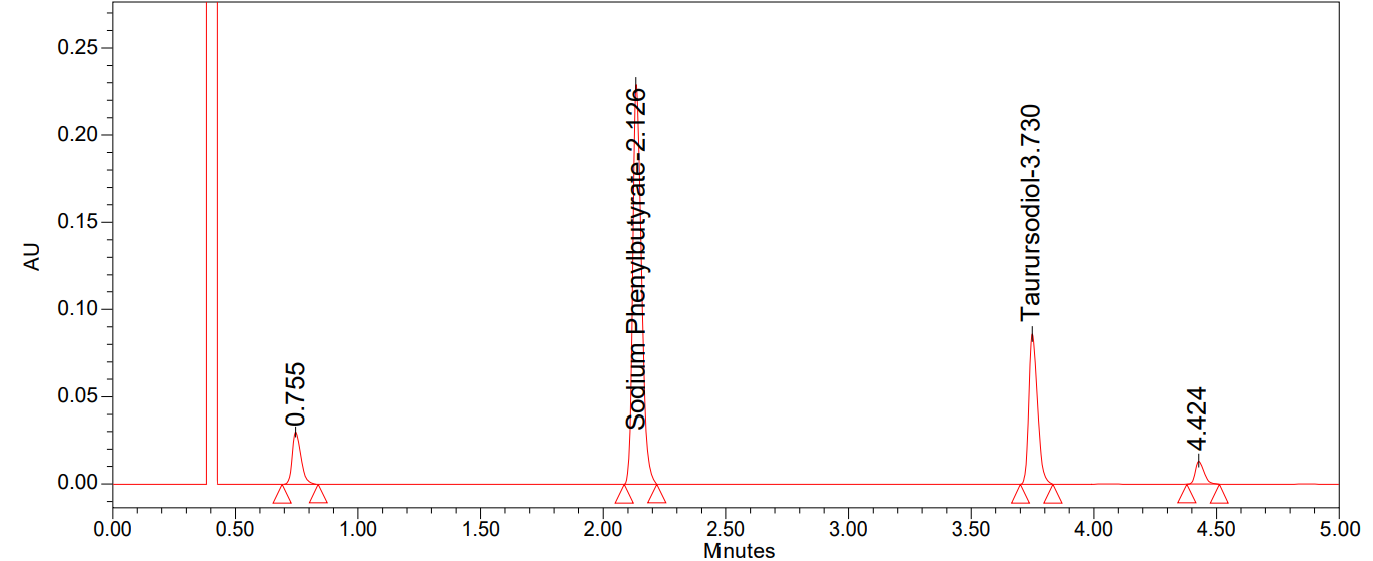
Fig. 9: Chromatogram of peroxide degradation
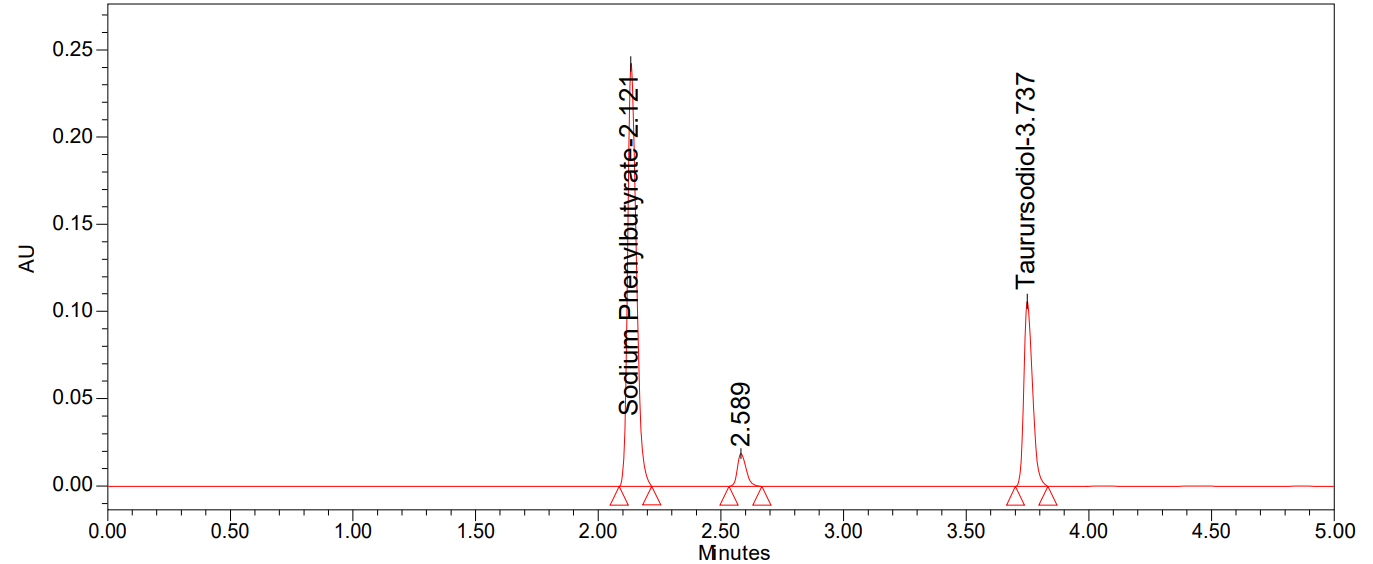
Fig. 10: Chromatogram of reduction degradation
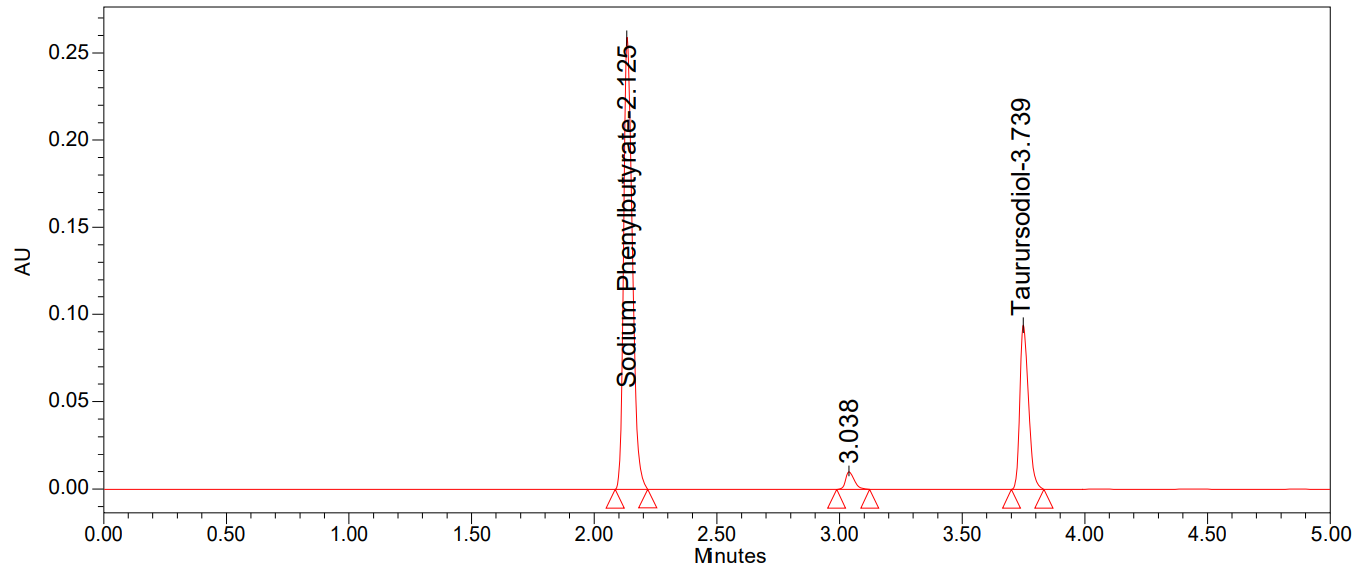
Fig. 11: Chromatogram of thermal degradation
CONCLUSION
When tested on pharmaceutical formulations including both Sodium Phenylbutyrate and Taurursodiol, the established technique demonstrated high levels of accuracy, precision, and reliability. The technique was tested for its ability to accurately and precisely degrade Sodium Phenylbutyrate and Taurursodiol under controlled conditions, as well as its resilience. The approach's validity and the findings achieved by this method are in reasonable agreement, since all parameters were determined to have RSD values less than 2. Sodium phenylbutyrate and taurursodiol may now be more accurately analyzed using this approach. This method is applied to LCMS also, but we used ortho-phosphoric acid in the buffer preparation. So, the method is applied to LCMS by modifying the buffer, because ortho-phosphoric acid was not used in LCMS.
ACKNOWLEDGEMENT
Sri M. Manoranjani's encouragement and assistance were invaluable to finish this study.
AUTHORS CONTRIBUTIONS
Sunil Rayudu has collected the literature and information about the drug and carried out the research samples and prepared the manuscript. Dr Manoranjani checked the data and reviewed the article.
CONFLICT OF INTERESTS
Declared none
REFERENCES
Merritt JL, Brody LL, Pino G, Rinaldo P. Newborn screening for proximal urea cycle disorders: current evidence supporting recommendations for newborn screening. Mol Genet Metab. 2018;124(2):109-13. doi: 10.1016/j.ymgme.2018.04.006, PMID 29703588.
Milazzo G, Mercatelli D, Di Muzio G, Triboli L, De Rosa P, Perini G. Histone deacetylases (HDACs): evolution, specificity role in transcriptional complexes and pharmacological actionability. Genes. 2020;11(5):556. doi: 10.3390/genes11050556, PMID 32429325.
Shahbazi J, Liu PY, Atmadibrata B, Bradner JE, Marshall GM, Lock RB. The bromodomain inhibitor JQ1 and the histone deacetylase inhibitor panobinostat synergistically reduce N-Myc expression and induce anticancer effects. Clin Cancer Res. 2016;22(10):2534-44. doi: 10.1158/1078-0432.CCR-15-1666, PMID 26733615.
Shteinberg M, Haq IJ, Polineni D, Davies JC. Cystic fibrosis. Lancet. 2021;397(10290):2195-211. doi: 10.1016/s0140-6736(20)32542-3, PMID 34090606.
Xu X, Zhang X, Zhang G, Abbasi Tadi D. Prevalence of antibiotic resistance of Staphylococcus aureus in cystic fibrosis infection: a systematic review and meta-analysis. J Glob Antimicrob Resist. 2024;36:419-25. doi: 10.1016/j.jgar.2023.05.006, PMID 37211214.
Motta AP, Rigobello MC, Silveira RC, Gimenes FR. Nasogastric/nasoenteric tube-related adverse events: an integrative review. Rev Lat Am Enfermagem. 2021;29:e3400. doi: 10.1590/1518-8345.3355.3400, PMID 33439952.
Kodua M, Mackenzie JM, Smyth N. Nursing assistants experiences of administering manual restraint for compulsory nasogastric feeding of young persons with anorexia nervosa. Int J Ment Health Nurs. 2020;29(6):1181-91. doi: 10.1111/inm.12758, PMID 32578949.
Arghya M, Santosh S. Andrographolide prevents acute hyperammonemia-induced motor dysfunction in rats. Evidences for its mechanism of action. Phytomedicine Plus. 2025;5(3):100679. doi: 10.1016/j.phyplu.2024.100679.
McGlacken Byrne SM, Conway GS. Premature ovarian insufficiency. Best Pract Res Clin Obstet Gynaecol. 2021;81:98-110. doi: 10.1016/j.bpobgyn.2021.09.011, PMID 34924261.
Seppa S, Kuiri Hanninen T, Holopainen E, Voutilainen R. Management of endocrine disease: diagnosis and management of primary amenorrhea and female delayed puberty. Eur J Endocrinol. 2021;184(6):R225-42. doi: 10.1530/EJE-20-1487, PMID 33687345.
Bernstein H, Bernstein C. Bile acids as carcinogens in the colon and at other sites in the gastrointestinal system. Exp Biol Med (Maywood). 2023;248(1):79-89. doi: 10.1177/15353702221131858, PMID 36408538.
Masato A, Plotegher N, Boassa D, Bubacco L. Impaired dopamine metabolism in Parkinson’s disease pathogenesis. Mol Neurodegener. 2019;14(1):35. doi: 10.1186/s13024-019-0332-6, PMID 31488222.
Martinez M, Harding CO, Schwank G, Thony B. State-of-the-art 2023 on gene therapy for phenylketonuria. J Inherit Metab Dis. 2024 Jan;47(1):80-92. doi: 10.1002/jimd.12651, PMID 37401651.
Ashe K, Kelso W, Farrand S, Panetta J, Fazio T, De Jong G. Psychiatric and cognitive aspects of phenylketonuria: the limitations of diet and promise of new treatments. Front Psychiatry. 2019;10:561. doi: 10.3389/fpsyt.2019.00561, PMID 31551819.
Chiang JY, Ferrell JM. Bile acid receptors FXR and TGR5 signaling in fatty liver diseases and therapy. Am J Physiol Gastrointest Liver Physiol. 2020;318(3):G554-73. doi: 10.1152/ajpgi.00223.2019, PMID 31984784.
Shapiro H, Kolodziejczyk AA, Halstuch D, Elinav E. Bile acids in glucose metabolism in health and disease. J Exp Med. 2018;215(2):383-96. doi: 10.1084/jem.20171965, PMID 29339445.
Petersen KS, Kris Etherton PM. Diet quality assessment and the relationship between diet quality and cardiovascular disease risk. Nutrients. 2021;13(12):4305. doi: 10.3390/nu13124305, PMID 34959857.
Blood Pressure Lowering Treatment Trialists’ Collaboration. Pharmacological blood pressure lowering for primary and secondary prevention of cardiovascular disease across different levels of blood pressure: an individual participant-level data meta-analysis. Lancet. 2021;397(10285):1625-36. doi: 10.1016/S0140-6736(21)00590-0, PMID 33933205.
Handsaker RE, Kashin S, Reed NM, Tan S, Lee WS, McDonald TM. Long somatic DNA-repeat expansion drives neurodegeneration in Huntington’s disease. Cell. 2025;188(3):623-639.e19. doi: 10.1016/j.cell.2024.11.038, PMID 39824182.
McColgan P, Tabrizi SJ. Huntington’s disease: a clinical review. Eur J Neurol. 2018;25(1):24-34. doi: 10.1111/ene.13413, PMID 28817209.
Alborghetti M, Nicoletti F. Different generations of type-B monoamine oxidase inhibitors in Parkinson’s disease: from bench to bedside. Curr Neuropharmacol. 2019;17(9):861-73. doi: 10.2174/1570159X16666180830100754, PMID 30160213.
Abusrair AH, Elsekaily W, Bohlega S. Tremor in Parkinson’s disease: from pathophysiology to advanced therapies. Tremor Other Hyperkinet Mov (NY). 2022;12:29. doi: 10.5334/tohm.712, PMID 36211804.
Masrori P, Van Damme P. Amyotrophic lateral sclerosis: a clinical review. Eur J Neurol. 2020;27(10):1918-29. doi: 10.1111/ene.14393, PMID 32526057.
Vitturi BK, Montecucco A, Rahmani A, Dini G, Durando P. Occupational risk factors for multiple sclerosis: a systematic review with meta-analysis. Front Public Health. 2023;11:1285103. doi: 10.3389/fpubh.2023.1285103, PMID 38054069.
Tateishi H, Monde K, Anraku K, Koga R, Hayashi Y, Ciftci HI. A clue to unprecedented strategy to HIV eradication: “Lock-in and apoptosis”. Sci Rep. 2017;7(1):8957. doi: 10.1038/s41598-017-09129-w, PMID 28827668.
Raju C, Sivagami B. Validation of a stability-indicating analytical method development for simultaneous estimation of sodium phenylbutyrate and taurursodiol in bulk and formulation using UPLC method. Iran J Pharm Sci. 2025;21(1):70-81. doi: 10.22037/ijps.v21i1.45528.
Beludari MI, Chedela HK, Lingareddy SS, Dara CB, Karimulla S. Development and validation of a stability-indicating analytical method for simultaneous determination of sodium phenylbutyrate and taurursodiol in bulk and formulation using reverse phase ultra-performance liquid chromatography. Egypt Pharm J. 2024;23(2):264-71. doi: 10.4103/epj.epj_295_23.
Malyaadri M, NL Janaki. Analytical method development and validation of sodium phenyl butyrate and taurursodiol by using RP-UPLC in bulk and pharmaceutical dosage form. High Technol Lett. 2024;30:164-77.
Karishma SK, Anusha B, Vegesna S. Stability indicating method devleopment and validation for the estimation of sodium phenyl butyrate and taurursodilol by using RP-HPLC. Afr J Biomed Res. 2024;27(4S):15422-32. doi: 10.53555/AJBR.v27i4S.7699.
Bhavani P, Prasada Rao K, Mohan S. Novel validated reversed-phase high-performance liquid chromatography method for determination of glucosamine diacerein and methyl sulfonyl methane in micro sample rat plasma and its application to pharmacokinetic and dissolution studies. Asian J Pharm Clin Res. 2020;13(12):50-63. doi: 10.22159/ajpcr.2020.v13i12.36547.
Gomathy S, Narenderan ST, Meyyanathan SN, Gowramma B. Development and validation of HPLC method for the simultaneous estimation of apigenin and luteolin in commercial formulation. J Crit Rev. 2020;7(19):4785-90. doi: 10.31838/jcr.07.19.560.
Supriya T, Naresh D, Vijaya Kumar G, Haneer MA. Stability indicating RP-HPLC method development and validation for simultaneous estimation of escitalopram and flupentixol pure and marketed formulation. Asian J Pharm Res. 2018;8:4-10.
Naykode MD, Bhagwat DA, Jadhav SD, More HN. Analytical and bioanalytical method for quantification of pure azilsartan not its salts by RP-HPLC. Res J Pharm Technol. 2017;10(3):708-14. doi: 10.5958/0974-360X.2017.00133.0.
Singh M, Charde M, Shukla R, Rita MC. Determination of calcipotriene in calcipotriene cream 0.05% w/w by RP-HPLC method development and validation. Res J Pharm Technol. 2011;4(8):1219-23.
Kumar SA, Debnath A, Rao JV, Sankar DG. Development and validation of a sensitive RP-HPLC method for simultaneous estimation of rosuvastatin and fenofibrate in tablet dosage form by using PDA detector in Gradient mode. Res J Pharm Technol. 2016;9(5):549-54. doi: 10.5958/0974-360X.2016.00104.9.
Manoranjani M. A study of method development validation and forced degradation for simultaneous quantification of cisplatin and fluorouracil in bulk and pharmaceutical dosage form by RP-HPLC. J Pharm Sci Res. 2021;13:155-61.
Prasada Rao PT. A study of method development and validation for simultaneous estimation of pemetrexed and cisplatin using RP-HPLC. J Pharm Sci Res. 2021;13:143-8.
Satyadev TN. A new selective separation method development and validation of cabozantinib and Nivolumab using HPLC. J Pharm Sci Res. 2021;13:188-92.
David Raju M. Development and validation of HPLC method for the determination of lasmiditan drug in bulk and tablet dosage form. J Pharm Sci Res. 2021;13(3):170-3.
Baje Syed IB, Nannapaneni M. Bioanalytical validation method for Capmatinib and Spartalizumab in rabbit plasma by using highly effective mass spectrophotometric method. Rasayan J Chem. 2022;15(4):2748-55. doi: 10.31788/RJC.2022.1547098.
Shivani CP, Maheshwari DG. Development and validation of UV spectrometric and HPLC method for estimation of escitalopram oxalate and flupentixol dihydrochloride in combined dosage form. AJPTI. 2016;4(17):59-70.
Shanmugasundaram P, Kamarapu SK. RP-HPLC method for the simultaneous estimation and validation of amlodipine besylate and atenolol in bulk and tablet dosage form in biorelevant dissolution medium (Fassif). Res J Pharm Technol. 2017;10(10):3379-85. doi: 10.5958/0974-360X.2017.00601.1.
ICH harmonized tripartite guideline. Validation of analytical procedures: text and methodology Q2(R1) International conference on the harmonization; 2005.
Raziq A, Jan SU. Relative comparison of stability and degradation of methylcobalamin tablets of different brands at different storage settings. Int J Appl Pharm. 2021;13:171-75.
Rafi S, Rambabu K. Stability indicating validated HPLC method for the determination of aceclofenac and misoprostol in bulk and pharmaceutical formulation. IJRPS. 2020;11(4):7848-53. doi: 10.26452/ijrps.v11i4.4669.
Swati K, Abhishek P, Sushank S, Bothiraja C, Atmaram P. High-performance liquid chromatography for the simultaneous estimation of cefoperazone and sulbactam in rat plasma and its importance in therapeutic drug monitoring. Int J Pharm Pharm Sci. 2020;12(10):92-7. doi: 10.22159/ijpps.2020v12i10.38638.
Vejendla A, Talari S, Moturu R, Murthy Boddapati SN, Kola AE. Method development and validation for Cabotegravir and Rilpivirine by using HPLC and its degradants are characterized by LCMS and FTIR. Futur J PharmSci. 2021;7:1-18. doi: 10.1186/s43094‑021‑00355‑8.
Charu Pandya P, Sadhana Rajput J. Development and validation of stability indicating method RP-HPLC method of acotiamide. Int J Pharm Pharm Sci. 2018;10(9):1-8. doi: 10.22159/ijpps.2018v10i9.24925.
Athavia BA, Dedania ZR, Dedania RR, Swamy SM, Prajapati CB. Stability indicating HPLC method for determination of vilazodone hydrochloride. Int J Curr Pharm Sci. 2017;9(4):123-9. doi: 10.22159/ijcpr.2017v9i4.20975.