
Int J App Pharm, Vol 17, Issue 6, 2025, 451-463Original Article
SYNTHESIS AND OPTIMIZATION OF MAGNESIUM ALUMINOMETASILICATE-TEMPLATED MESOPOROUS NANOPARTICLES FOR CANNABIDIOL DELIVERY: A NOVEL APPROACH
PARE PANKAJ RAJENDRA*, MANISH KUMAR
Department of Pharmaceutics, Madhav University, Pindwara, Rajasthan, India
*Corresponding author: Pare Pankaj Rajendra; *Email: pankaj.pare@gmail.com
Received: 29 May 2025, Revised and Accepted: 20 Sep 2025
ABSTRACT
Objective: Mesoporous nanoparticles (MNPs) have improved practically insoluble drugs' bioavailability and therapeutic efficacy. Novel Magnesium Aluminometasilicate (MAS)-templated synthesis of cannabinoid-loaded mesoporous nanoparticles: Formulation, characterization, and in vitro drug release assessment.
Methods: The purity and thermal stability of cannabidiol (CBD) were evaluated by melting point and differential scanning calorimetry analyses. The effects of Magnesium Aluminometasilicate (MAS), triethanolamine, and temperature on entrapment efficiency and particle size were assessed using a Box-Behnken Design (BBD) to optimize the formulation. Scanning Electron Microscopy (SEM), zeta potential, and Polydispersity Index (PDI) were used to analyze the formulation. In vitro drug release and stability studies were conducted.
Results: The calibration curve showed linear relationship (R² = 0.9984). Highest solubility was observed in DMSO (60.54±2.47 mg/ml), while phosphate buffer pH 6.8 showed limited solubility (0.31±0.03 mg/ml). Formulation F13 demonstrated optimal entrapment efficiency (87.7%), loading capacity (37.24%), particle size (128.6 nm), and PDI (0.245). Zeta potential (-23.9 mV) confirmed colloidal stability. Release kinetics followed zero-order model (R² = 0.9863) with sustained release (94.04% over 12 h). Accelerated stability studies confirmed excellent stability over six months.
Conclusion: The study demonstrates that magnesium aluminometasilicate template-assisted encapsulation of cannabidiol achieved high entrapment efficiency (87.7%), sustained in vitro release (94.04% over 12 h), and excellent stability under accelerated conditions. In vivo bioavailability studies are required to confirm therapeutic potential.
Keywords: Cannabidiol (CBD), Mesoporous nanoparticles (MNPs), Magnesium Aluminometasilicate (MAS), Drug delivery, Solubility enhancement, Sustained release, Box-behnken design (BBD), Analysis of variance (ANOVA)
© 2025 The Authors. Published by Innovare Academic Sciences Pvt Ltd. This is an open access article under the CC BY license (https://creativecommons.org/licenses/by/4.0/)
DOI: https://dx.doi.org/10.22159/ijap.2025v17i6.55307 Journal homepage: https://innovareacademics.in/journals/index.php/ijap
INTRODUCTION
Mesoporous nanoparticles (MNPs)are a class of nanomaterial with a highly ordered pore internal structure and large specific surface area [1]. These nanoparticles commonly have pore sizes ranging from 2 to 50 nm, which enables broad applicability in Novel Drug Delivery System (NDDS), catalysis, and imaging [2]. The synthesis of MNPs usually relies on templating methods in which a sacrificial template forces the mesoporous structure to form. Magnesium aluminometasilicate has been used as a template for several reasons, including its stability, biocompatibility, and also easy clearance [3]. Functionalization with different molecules can be done quickly on the surface chemistry of MNPs [4]. This versatility renders mesoporous nanoparticles highly desirable for biomedical applications that require fine control over drug loading and release kinetics [5]. Compared to laboratory-synthesized templates like SBA-15 (surface area 400-900 m²/g, pore diameter 5-15 nm) and MCM-41 (surface area ~1000 m²/g, pore diameter ~3 nm), magnesium aluminometasilicate offers distinct advantages for commercial pharmaceutical applications [6]. While SBA-15 and MCM-41 are synthesized at laboratory scale making them difficult to use in commercial technologies, magnesium aluminometasilicate is manufactured on industrial scale and certified for pharmaceutical use [7]. The pore size of magnesium aluminometasilicate is dominated by 20.3 nm diameter pores with additional mesopores ranging from 4-15 nm and 40-100 nm [7], providing versatile drug loading capabilities.
Cannabidiol (CBD), is a primary non-psychoactive compound taken from the marijuana plant Cannabis Indica [8]. CBD faces significant bioavailability challenges, with oral bioavailability of approximately 6% under fasting conditions due to extensive first-pass metabolism and poor gastrointestinal absorption [8]. As a Class II drug in the Biopharmaceutics Classification System, CBD exhibits high lipophilicity (log P>5) and low aqueous solubility (2-10 μg/ml in water) [9]. Approximately 70-75% of orally absorbed CBD undergoes hepatic metabolism before reaching systemic circulation [8], necessitating advanced delivery systems. Furthermore, CBD is unlike tetrahydrocannabinol (THC) in that it lacks psychoactive effects.
Magnesium aluminometasilicate is a versatile inorganic compound renowned for its exceptional properties [10]. It consists of these four components. Magnesium, aluminum, silicon, and oxygen form a strong and stable network. The nanoparticulate materials have excellent physical properties because of their high thermal stability and resistance to chemical attack [11]. In mesoporous nanoparticle synthesis, it acts as a sacrificial template for the magnesium aluminometasilicate, so a well-defined mesoporous architecture can, in turn, be formed. After the template has been synthesized, it is easy to remove. The method ensures that pore sizes are uniform and that the pores are well distributed throughout the entire nanoparticle [12].
Magnesium aluminometasilicate offers superior advantages over pure silica templates due to its ion exchange capacity and pH-responsive behavior[13]. The interacting silanol groups on the outer surface of aluminometasilicate form hydrogen bonds with drug molecules, creating stronger drug-excipient interactions compared to pure silica materials [13]. Additionally, the adjustable pore size and modifiable surface of magnesium aluminometasilicate enables enhanced drug stability through amorphization and provides geometrical constraint mechanisms that prevent conversion from amorphous to crystalline nature. The material's inert nature and unidirectional mesoporous networking with pore diameters of 2-50 nm make it ideal for sustained drug delivery applications [13].
The present study aimed to develop and optimize a novel formulation composed of mesoporous nanoparticles using magnesium aluminometasilicate as a template and associated with cannabidiol (CBD) to improve its therapeutic efficacy. The purpose is to prepare well-crystalline mesoporous nanoparticles with an ordered structure and to maintain high uniformity of pore diameter, surface area, and structural stability in the synthesis process. This study also aims to encapsulate it with the atmosphere matrix, loading capacity, and the encapsulation efficiency of cannabidiol nanoparticles.
MATERIALS AND METHODS
Materials
Cannabidiol was provided as a gift by Nano Bella, LLC. Magnesium aluminometasilicate (MAS) was obtained from Sciquaint Innovations (OPC) Private Limited, Pune. The triethanolamine was purchased from Meru Chem Pvt. Ltd., Mumbai, India. All analytical-grade chemicals and solvents were employed.
Methods
Preparation of standard calibration curve of cannabidiol (CBD)
A serial dilution with a tenfold concentration from the stock solution was prepared using water in a 50 ml volumetric flask, resulting in different variants with final concentrations of 1–6 ppm (parts per million). Then, a UV spectrophotometer measured their absorbance at 241 nm-A against a blank phosphate buffer pH 6.8. The procedure validated that UV spectrophotometry, at a maximum wavelength of 241 nm (λmax), would be appropriate to estimate cannabidiol (CBD) concentrations in aqueous solutions [14].
Solubility determination
Saturated solubility was determined by adding excess CBD (approximately 50 mg) to 5 ml of each solvent (phosphate buffer pH 6.8 and distilled water) in sealed vials. The suspensions were stirred continuously for 48 h at 25 °C±2 °C to ensure equilibrium was reached, followed by 24 h of settling. The solutions were then centrifuged at 10,000 rpm for 10 min to separate undissolved drug particles before filtration through a 0.45 μm membrane filter to avoid retention of any suspended nanoparticles and analyzed by U. V. spectroscopy at 241 nm [15].
Determination of melting point
The melting point of cannabidiol (CBD) was measured in a capillary tube sealed at one end. A comparable process was also used for the reference standard. The device was turned on after the samples' capillary tubes were inserted into the Veego melting point equipment. The temperature at which the samples melted was documented [16].
Differential scanning calorimetry (DSC)
Differential scanning calorimetry assessed the thermal peaks of both CBD-loaded MASN and pure CBD drugs. During the investigation, inert N2 gas (Scinco N650, Italy) was released from the device at a 20 ml/min flow rate. The samples (5 mg) were placed in an aluminum pan and heated at a rate of 10 °C/min in the temperature range of 30–300 °C [17].
Experimental design for synthesis of CBD-loaded MAS particles
Box-Behnken design was selected over other response surface methodologies due to its ability to avoid extreme experimental conditions while requiring fewer experimental runs compared to central composite design [18]. The design avoids corner points and star points, making it more practical for pharmaceutical formulations where extreme factor combinations might lead to impractical or unstable formulations. The factor ranges were established based on preliminary experiments: MAS concentration (10-30 g) was selected to ensure adequate pore structure formation while maintaining practical handling; TEA concentration (5-15 g) was chosen to provide sufficient alkalinity for gel formation without excessive viscosity; temperature range (40-90 °C) was selected to balance reaction kinetics with thermal stability of the components. The design uses three equally spaced levels (-1, 0,+1) for each factor, providing sufficient data points to fit a quadratic model essential for optimization studies [19].
Table 1: Box-behnken design responses for formulations
| Independent variables | ||||
| Factors | Coded values | Actual values | ||
| Low | High | Low | High | |
| MAS (g) | -1 | +1 | 10 | 30 |
| Triethanolamine (TEA) (g) | -1 | +1 | 5 | 15 |
| Temperature (°C) | -1 | +1 | 40 | 90 |
| Responses (Dependent variable) | Goals | |||
| Y1 = Entrapment Efficiency (%) | Maximize | |||
| Y2 = Particle Size (nm) | Maximize | |||
Table 2: Batches of mesoporous nanoparticles by box-behnken design
| Run | CBD (mg) | A: MAS (g) | B: TEA (g) | C: Temperature (°C) |
| F1 | 40 | 20 | 5 | 90 |
| F2 | 40 | 20 | 10 | 65 |
| F3 | 40 | 20 | 10 | 65 |
| F4 | 40 | 20 | 10 | 65 |
| F5 | 40 | 30 | 15 | 65 |
| F6 | 40 | 20 | 5 | 40 |
| F7 | 40 | 30 | 5 | 65 |
| F8 | 40 | 30 | 10 | 90 |
| F9 | 40 | 20 | 15 | 40 |
| F10 | 40 | 10 | 15 | 65 |
| F11 | 40 | 10 | 10 | 40 |
| F12 | 40 | 20 | 15 | 90 |
| F13 | 40 | 30 | 10 | 40 |
| F14 | 40 | 10 | 5 | 65 |
| F15 | 40 | 20 | 10 | 65 |
| F16 | 40 | 10 | 10 | 90 |
Synthesis of mesoporous particle of magnesium aluminametasilicate (MAS)
Mesoporous magnesium aluminometasilicate particles were synthesized using a modified co-precipitation method. A basic solution was prepared by dissolving sodium hydroxide (NaOH) at a molar ratio of NaOH/SiO2 = 0.2-0.5 in distilled water [20]. The acid solution was prepared by mixing aluminumsulfate, magnesium sulphate, and sulfuric acid (H2SO4) at a molar ratio of H2SO4/SiO2 = 0.3-0.8 [20]. The acid solution was slowly added dropwise to the basic solution at a controlled rate of 200 ml/min under vigorous stirring (300 rpm) using a mechanical stirrer. The pH was maintained at 7.0±0.2 throughout the reaction [20]. The mixture was stirred continuously for 1 hour at room temperature for gel formation, followed by aging for 24 h at the specified temperature (40-90 °C). The resulting gel was washed several times with distilled water until free from salt ions, filtered using Buchner filtration, and dried in a hot air oven at 60 °C for 24 h. The dried material was ground to fine powder and sieved through a 200-mesh sieve to obtain uniform particle size distribution.
Loading of CBD into mesoporous magnesium aluminometasilicate particles
CBD loading was performed using a solvent evaporation method. CBD (40 mg) was completely dissolved in 2 ml of DMSO by ultrasonication for 10 min at room temperature [21]. The resulting clear solution was then mixed with mesoporous MAS nanoparticles at a predetermined ratio (1:2 w/w, CBD: MAS) in a porcelain mortar. The mixture was ground uniformly for 15 min using a pestle with continuous circular motions to ensure homogeneous distribution [21]. The loaded mixture was then placed in a hot air oven at 50 °C for 2 h to allow complete evaporation of DMSO solvent. After drying, 10 ml of distilled water was added to the dried mixture, and the unloaded CBD was separated by centrifugation at 5300 rpm for 10 min. The supernatant was analyzed spectrophotometrically at 241 nm to determine the amount of unloaded drug [22].
Characterization of prepared CBD loaded MAS nanoparticles
Particle size analysis
Dynamic light scattering (DLS) using a Horiba Scientific instrument was employed to measure the particle size of each sample of the CBD-loaded mesoporous nanoparticles. The samples were dispersed in distilled water (pH 7.0) at a concentration of 0.1 mg/ml and sonicated for 2 min to ensure uniform dispersion. The measurements were conducted in three runs, each lasting 30 seconds, at room temperature (25 °C±2 °C) with a detection angle of 90° [23].
Zeta potential
A Nano ZS90 Zeta sizer was used to measure the zeta potential of the various formulations that contained CBD-loaded mesoporous MAS nanoparticles. The samples were diluted 1:10 with distilled water and analyzed in triplicate [24]. At 25 °C, the effective electric charge on the nanoparticle's surface was measured. A fixed angle of 173° was incorporated into the measurement setup to reduce the effects of multiple scattering.
% Entrapment efficiency
The concentration of CBD in mesoporous particles was determined with a UV spectrophotometer. 10 mg of CBD-loaded mesoporous particles were added with 10 ml of ethanol. Then, this solution was dissolved in 6.8-pH phosphate buffer with pipetting for 30 min under agitation till the organic solvent evaporated. The resulting solution was filtered using Whatman filter paper and analyzed at 241 nm using a UV spectrophotometer. The entrapment efficiency percentage was calculated by using the formula [25]:
 …… (1)
Where, C total = total concentration of CBD used in the formulation, C free = concentration of free CBD determined spectrophotometrically in the supernatant.
 …. ()
…. ()
Scanning electron microscope (SEM)
The samples were attached to metal stubs and coated with a thin layer of gold (10-15 nm thickness) in a vacuum using a sputter coater (model 108 auto, Crossing on Scientific Instruments Ltd, India). This preparation allowed for detailed examination using an analytical scanning electron microscope operated at an accelerating voltage of 15 kV with a working distance of 10 mm. Images were captured at various magnifications (5,000× to 50,000×) to examine surface morphology and particle size distribution [26].
In vitro drug release studies
In vitro drug release experiments of CBD-loaded magnesium aluminometasilicate nanoparticles (MASN) were conducted using a Franz diffusion cell with a cellophane membrane (Sigma-Aldrich). The water-jacketed chamber held a thermometer and featured two arms, one for sampling, with a total capacity of 50 ml [27, 28]. The donor compartments inside diameter measured two centimetres. The over-receptor compartment was positioned on top of the donor compartment. The temperature of the phosphate buffer (pH 6.8) placed within the receptor compartment (volume = 50 ml) was maintained at 37 °C±0.5 °C. Sink conditions were maintained by ensuring that the volume of release medium was at least 10 times the saturation solubility of CBD in the medium, with continuous stirring at 100 rpm to ensure uniform distribution. It was allowed to acclimate before applying the CBD-MASN equivalent to the donor side of the cellophane membrane. Samples were removed via the receptor compartment's sampling arm at a predetermined interval. At that exact moment, the same volume of new phosphate buffer saline pH 6.8 was added, and the samples were examined at 241 nm using a UV spectrophotometer [29, 30]. Release kinetics were analyzed using zero-order, first-order, Higuchi, and Korsmeyer-Peppas models to determine the drug release mechanism.
Accelerated stability study
The optimized formulation F13 was subjected to accelerated stability testing according to ICH Q1A(R2) guidelines. Samples were stored in stability chambers at 40 °C±2 °C/75%±5% RH in HDPE bottles with desiccant sachets. Testing was conducted at predetermined intervals (0, 1, 3, and 6 mo) under aseptic conditions. Parameters evaluated included physical appearance, particle size, polydispersity index, zeta potential, entrapment efficiency, and drug content using previously described analytical methods. All measurements were performed in triplicate, and data expressed as mean±standard deviation.
Statistical analysis
The Design Expert Program Expert® DX 13.0 (Stat Ease Inc., Minnesota) was used to analyze the experiment data. After an analysis of variance (ANOVA) was performed to determine the factors' significance, response surface plots were utilized to show the factors' impacts on the dependent variables.
RESULTS AND DISCUSSION
Calibration of cannabidiol (CBD)
The calibration graph for CBD based on absorbance at an excitation wavelength of 241 nm was linear with CBD concentration and has R² = 0.9984. Achieving an R² value at such a high level indicates that the calibration model is highly suitable for measuring cannabis concentration with requisite accuracy, nonlinearity, and comparatively high resistance to various errors. The slope of the calibration curve, as shown above, was 0.1905, which implies that the absorbance unit rose 0.1905 units for every unit of CBD concentration. This is the intercept of the graph with an intercept of 0.0264; this is the absorbance of the sample, at least in the absence of CBDs; this could be due to interferences or intrinsic absorption of the solvent. This calibration range is accurate and reliable and shows that this calibration curve is suitable for the exact quantitative” determination of CBD in different formulations and to ensure the homogeneity of analyses to be done in further experiments.
Solubility determination
CBD solubility in distinct solvents of table 3 also illustrates significant solubility divergence among fluids. The highest solubility was obtained in DMSO (60.54±2.47 mg/ml), which legitimately classifies it as freely soluble in this solvent. This high DMSO solubility makes it an excellent choice for initial drug dissolution and loading procedures in nanoparticle formulations. DMF also demonstrated considerable solubility with a value of 48.39±1.83 mg/ml, indicating that CBD will be readily soluble in this solvent, making it available for formulating as well as analytical use. Ethanol showed moderate solubility (34.67±1.4 mg/ml), making it suitable for pharmaceutical applications where organic solvents are acceptable. However, water only dissolves relatively little CBD (5.44±0.08 mg/ml), making it slightly soluble, while phosphate buffer pH 6.8 showed very limited solubility (0.31±0.03 mg/ml). The low aqueous solubility in physiological conditions demonstrates the need to use solubilizing agents or advanced delivery systems to improve CBD's bioavailability for pharmaceutical applications. These findings underscore the need to select suitable solvents for CBD preparation, formulation, and analysis to guarantee its best possible performance under various pharmaceutical and biomedical circumstances.
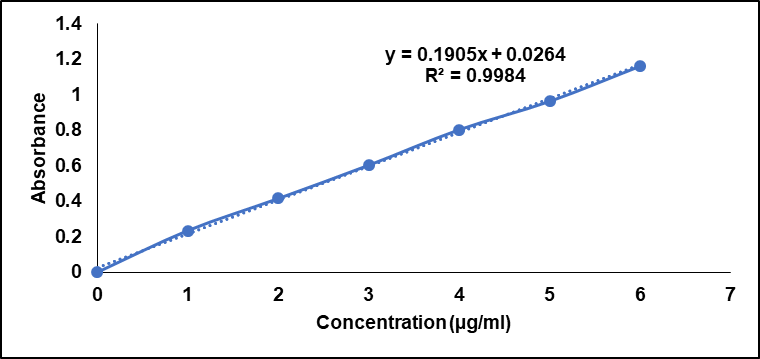
Fig. 1: Calibration curve of cannabidiol (CBD)
Table 3: Solubility of cannabidiol (CBD) in different solvents
| Solvents | Solubility | Observation/Inference |
| Water | 5.44±0.08 mg/ml | Slightly soluble |
| DMSO | 60.54±2.47 mg/ml | Soluble |
| DMF | 48.39±1.83 mg/ml | Soluble |
| Ethanol | 34.67±1.4 mg/ml | Soluble |
| Phosphate Buffer pH 6.8 | 0.31±0.03 mg/ml | Very Slightly soluble |
Data are expressed in mean±SD (n=3)
Table 4: Melting point of drug
| Drug name | Cannabidiol (CBD) | |
| Melting point (°C) | Standard | Observed |
| 64 °C-68 °C | 66 °C-68 °C |
Melting point
The melting point determination of cannabidiol (CBD) showed observed values of 66 °C-68 °C, which closely matched the standard range of 64 °C-68 °C (table 4). This confirms the purity and authenticity of the CBD sample used in formulation development.
Differential scanning calorimetry (DSC) analysis
Fig. 2 presents the Differential Scanning Calorimetry (DSC) analysis of the pure drug (CBD), showing an endothermic peak at 67.87 °C corresponding to the melting point of CBD. Fig. 3 represents the DSC spectrum of CBD-loaded MASN, where a similar endothermic peak was observed at 68.26 °C. The minimal difference in melting point (0.39 °C) is within typical DSC instrument error (±0.5 °C) and cannot be definitively interpreted as evidence of strong drug-excipient interaction. The persistence of the crystalline melting peak suggests that CBD may retain some crystalline character within the mesoporous matrix. Further characterization using X-ray diffraction (XRD) would be required to confirm the extent of amorphous dispersion and definitively establish the physical state of CBD within the nanoparticles.
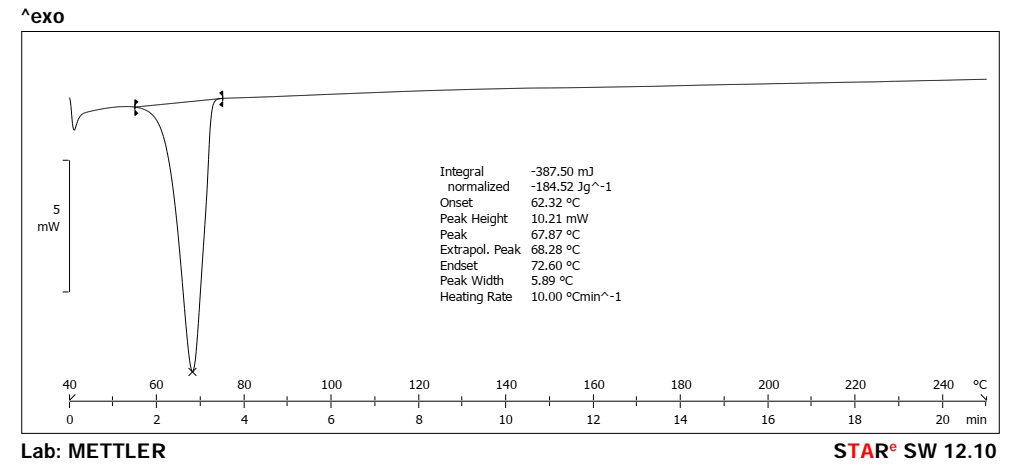
Fig. 2: DSC spectrum of pure drug (CBD)
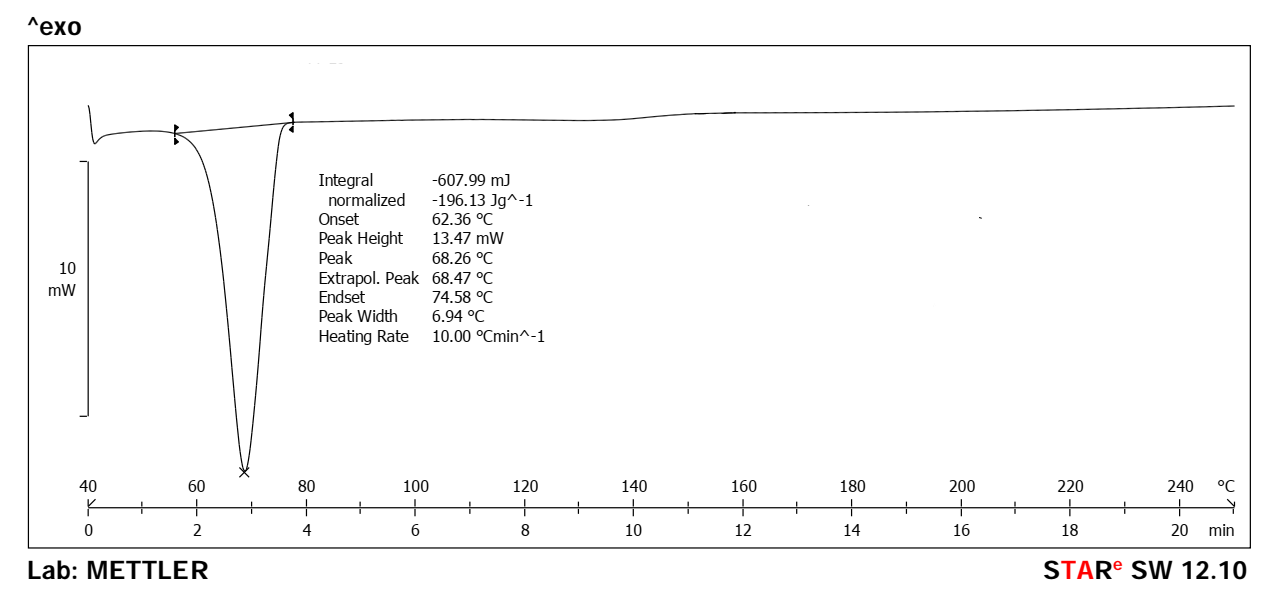
Fig. 3: DSC spectrum of CBD-loaded MASN
Characterization of magnesium aluminometasilicate (MAS) nanoparticles
Table 5 shows entrapment efficiency and particle size of the prepared mesoporous Magnesium Aluminometasilicate (MAS) nanoparticles. The % EE varied between 62.4% and 91.4%, where F8 and F11 formulations showed the highest % EE values of 91.4% and 91.2%, respectively. A high entrapment efficiency represents that the CBD was successfully encapsulated within the mesoporous matrix. The loading capacity ranged from 19.87% to 37.24%, with F13 demonstrating the highest loading capacity (37.24%), indicating superior drug-to-carrier ratio optimization. The nanoparticles were between 118.3 nm and 175.3 nm in dimensions, where formulation F16 had the smaller particle size of 118.3 nm, and F8 had the bigger one at 175.3 nm. Polydispersity index (PDI) values ranged from 0.245 to 0.334, with F13 showing the lowest PDI (0.245), confirming excellent monodispersity and uniform size distribution. Specifically, formulation F13 was found to have a comparable profile, which maintained a high encapsulation efficiency of 87.7% and sufficiently small particle size up to 128.6 nm (favourable given both encapsulation efficiency and nanoparticle size). The zeta potential values varied from-17.9 to-26.8 mV, with F13 exhibiting-23.9 mV, indicating adequate electrostatic stability for colloidal dispersion. Particle size and the entrapment efficiency varied with each formulation, thereby indicating the effect of the independent variables (concentrations of MAS and concentration as well as temperature of TEA) on the performance of nanoparticles. The combination of high loading capacity, low PDI, and optimal zeta potential in F13 confirms its superiority as the optimized formulation. These data highlight the need to tune formulation parameters to promote characteristics suitable for drug delivery applications.
Table 5: Results of characterization of prepared magnesium aluminometasilicate (MAS) nanoparticles
| F. code | Entrapment efficiency (%) | Particle size (nm) | Loading capacity (%) | PDI | Zeta potential (mV) |
| F1 | 76.3±0.54 | 131.3±4.3 | 23.28±1.12 | 0.312±0.028 | -19.4±1.8 |
| F2 | 87.5±0.74 | 145.6±2.6 | 30.48±1.26 | 0.278±0.021 | -22.1±1.5 |
| F3 | 78.5±0.44 | 141.2±3.2 | 27.06±1.18 | 0.285±0.024 | -21.8±1.6 |
| F4 | 81.2±0.63 | 143.3±6.3 | 28.12±1.22 | 0.281±0.022 | -21.9±1.4 |
| F5 | 89.1±0.58 | 161.4±3.4 | 36.42±1.58 | 0.298±0.031 | -26.8±2.1 |
| F6 | 88.4±0.45 | 144.3±4.3 | 30.34±1.24 | 0.289±0.025 | -20.2±1.7 |
| F7 | 90.2±0.32 | 161.6±2.6 | 35.18±1.52 | 0.294±0.029 | -24.5±1.9 |
| F8 | 91.4±0.47 | 175.3±6.3 | 32.85±1.46 | 0.334±0.037 | -25.1±2.2 |
| F9 | 88.5±0.96 | 147.5±4.5 | 31.26±1.38 | 0.291±0.026 | -22.8±1.6 |
| F10 | 73.6±0.77 | 137.6±3.6 | 22.67±1.08 | 0.271±0.019 | -18.6±1.3 |
| F11 | 91.2±0.85 | 166.3±6.3 | 31.58±1.42 | 0.316±0.033 | -19.8±1.7 |
| F12 | 83.3±0.36 | 148.8±3.8 | 28.94±1.31 | 0.302±0.027 | -23.4±1.8 |
| F13 | 87.7±0.64 | 128.6±2.6 | 37.24±1.64 | 0.245±0.018 | -23.9±1.2 |
| F14 | 73.8±0.85 | 133.6±3.6 | 22.15±1.05 | 0.268±0.020 | -17.9±1.4 |
| F15 | 88.4±0.66 | 137.5±4.5 | 30.84±1.35 | 0.276±0.023 | -22.3±1.5 |
| F16 | 62.4±0.71 | 118.3±6.3 | 19.87±0.98 | 0.259±0.017 | -18.2±1.1 |
Value are expressed in mean±SD, (n=3)
Optimization of magnesium aluminometasilicate (MAS) nanoparticles
Effect of variables on entrapment efficiency (R1)
The results with 3D response surface plots and ANOVA of the entrapment efficiency (R1) of CBD loaded in mesoporous silica nanoparticles depicted in table 6 employing the Box-Behnken design respond to the impact of the independent variables. The overall model is also significant, with a p-value equal to 0.0149; therefore, the chosen variables provide a good account for the variations in entrapment efficiency.
Statistical analysis proved that a higher concentration of MAS will enhance the entrapment efficiency inside the mesoporous nanoparticles. The high F-value, 6.81, in this study further supports the application of the model to estimate entrapment efficiency using the input predictors. Surprisingly, among these variables, MAS shows the highest F-value (27.09) and significance level at 0.002. This is in agreement with the essential characteristics of mesoporous silica nanoparticles that have a high surface area, and the pore size is easily adjustable for drug delivery [31]. The high and positively signed regression coefficient of MAS (= 7.175) also supports the conclusion that elevated adsorption site density and extended CBD surface area enhance entrapment efficiency [32]. On the other hand, the p-TEA has the lowest p-value of 0.618 as compared with the nanoparticle-forming polymers and, therefore, may not be the potent stabilizing agent that directly impacts the encapsulation process [33]. This categorizes the concentration of MAS as the critical aspect of enhancing the loading of drugs within the mesoporous structure for drug delivery applications. Lack of Fit F-value = 0.3093 indicates that the lack of fit is not significant relative to pure error, confirming model adequacy.
Table 6: ANOVA results for the quadratic model for the response of entrapment efficiency (R1)
| Source | Sum of squares | df | mean square | F-value | p-value | |
| Model | 931.62 | 9 | 103.51 | 6.81 | 0.0149 | significant |
| A-MAS | 411.85 | 1 | 411.85 | 27.09 | 0.0020 | |
| B-TEA | 4.21 | 1 | 4.21 | 0.2766 | 0.6178 | |
| C-Temperature | 224.72 | 1 | 224.72 | 14.78 | 0.0085 | |
| AB | 0.2025 | 1 | 0.2025 | 0.0133 | 0.9119 | |
| AC | 264.06 | 1 | 264.06 | 17.37 | 0.0059 | |
| BC | 11.90 | 1 | 11.90 | 0.7830 | 0.4103 | |
| A² | 10.08 | 1 | 10.08 | 0.6632 | 0.4466 | |
| B² | 1.63 | 1 | 1.63 | 0.1069 | 0.7548 | |
| C² | 2.98 | 1 | 2.98 | 0.1958 | 0.6737 | |
| Residual | 91.21 | 6 | 15.20 | |||
| Lack of Fit | 21.55 | 3 | 7.18 | 0.3093 | 0.8195 | not significant |
| Pure Error | 69.66 | 3 | 23.22 | |||
| Cor Total | 1022.82 | 15 |
The regression equation for entrapment Efficiency is as follows:
Entrapment Efficiency (R1) =+83.9+7.175A+0.725B-5.3C-0.225AB+8.125AC+1.725BC-1.5875A²-0.6375B²+0.8625C²…. (2)
Temperature is also another critical determinant of entrapment efficiency. The temperature has a significant effect and is observed with a sum of squares of 224.72, an F-value of 14.78, and a p-value of 0.009. As expected, a negative regression coefficient (-5.3) means entrapment efficiency reduces at higher temperatures. This inverse correlation may be attributed to the decline in the stability of CBD at high temperatures [34] or by the interference with the mesoporous structure and, therefore, the encapsulation efficiency.
The interaction effects of the variables were determined with two-way ANOVA interaction terms AB (MAS and TEA), AC (MAS and Temperature), and BC (TEA and Temperature). Without significance, the combined effect of MAS and TEA (AB) was not a significant factor in entrapment efficiency, as the p-value obtained was 0.912. In general, there was a significant interaction between MAS and Temperature (AC) with the sum of square =264.06, F-value =17.37, and p VALUE = 0.006, meaning that both variables have a synergistic effect that enhances the entrapment efficiency.
The effect between TEA and temperature (BC) was insignificant (p-value = 0.410), which shows that the combination of these factors does not affect the response. The quadratic terms A², B², and C² were incorporated into the model to check the possible curvature of the independent variables. These coefficients for the MAS and TEA terms A² and B² were insignificant, with p-values of 0.447 and 0.755, respectively, implying a flat response surface for both. The quadratic term C² (Temperature) had a minimal and insignificant impact, indicated by the p-value of 0.674, which denotes a hint of curvature in a surface of response to temperature but is not significant enough [35]. The model adequacy was verified by the R² value, which is 0.9108; this reveals that 91.08% of the changes in entrapment efficiency are accountable to this model. The result, adjusted R² = 0.7771, which has considered the number of predictors, also supports the model's reliability. The average value of C. V. is 4.69%, and adequate precision is also 9.9277, indicating that the model is exact and the response variable has been predicted very efficiently. The adjusted R² value of 0.7771 for entrapment efficiency, while acceptable, indicates moderate model fit with 77.71% of the variance explained after accounting for the number of predictors. This suggests that additional factors beyond the three variables studied may influence entrapment efficiency. The lack-of-fit F-value of 0.3093 (p = 0.8195) confirms that the model adequately represents the experimental data without significant systematic deviation.
The findings also showed that MAS and Temperature are the most influential parameters for the entrapment efficiency of CBD-loaded mesoporous silica nanoparticles. MAS had a direct effect, while Temperature had an inverse impact. The effect of MAS and Temperature also contributes to the consideration of entrapment efficiency. As a result, the TEA and other interaction and quadratic terms were found to be non-significant. The model is impeccably reliable, precise, and useful for enhancing entrapment efficiency.
The 3D surface plots (fig. 4) for Entrapment efficiency accentuate the importance of Magnesium Aluminometasilicate concentration for enhancing the entrapment efficiency of CBD-loaded mesoporous nanoparticles. It was observed in Plot A that a high concentration of MAS improves entrapment efficiency, which is crucial in CBD encapsulation [34]. This finding corroborates the findings of prior studies that suggest that the richness of the pore surface area of MAS, as well as its high adsorption capacity, utilize the material for drug delivery systems [36]. However, it is clear from Plot B that entrapment efficiency is hindered by high temperatures, which may imply that CBD degrades at high temperatures or the mesoporous structure of FC is disrupted [34]. Although the Interactions between Triethanolamine and temperature were relatively low, the present study calls for the proper optimization of MAS concentration to develop efficient CBD delivery systems and the significance of temperature during formulation [37].
Effect of variables on particle size (R2)
The results presented in table 7, which describe the particle size (R2) of the synthesized CBD-MSNs based on a Box-Behnken design, allow for understanding the impact of the independent variables. The overall model is significant at the 0.006 level, suggesting that the proposed variables can somewhat capture changes in particle size. This was further confirmed by the high F-value of 9.68, which signifies the adequacy of the model.
The examination herein proves helpful in exhibiting the correlation between the concentration of MAS and particle size and, therefore, its function in the formation of nanoparticles. The obtained p-value (0.006) for MAS and the positive sign (8.8875) of the MAS regression coefficient confirmed that the particle size also increases with higher MAS concentration. This could result from the capping of higher MAS concentrations, a situation familiar in preparing mesoporous silica nanoparticles [31]. On the other hand, TEA and temperature have no significant influence on the particle size with the statistical values. Although the regression coefficient for TEA (3.0625) suggests TEA may have a minor positive role in particle growth at the present range, TEA’s p-value remains high, indicating this contribution is negligible. Likewise, the p-value we obtained for the temperature of 0.473 shows that temperature within the parameters tested does not play a significant role in determining the particle size. An appreciation of these individual and collective influences of MAS, TEA, and temperature is essential when sizing mesoporous silica nanoparticles for particular applications, such as drug delivery, where size plays a significant role in cell penetration and distribution [33]. Lack of Fit F-value = 5.11 suggests some deviation from the fitted model, though still within acceptable limits (p = 0.1068).

Fig. 4: 3D plot of the relationship between (A) MAS and TEA and the Entrapment efficiency, (B) MAS and temperature and the entrapment efficiency, and (C) TEA and Temperature and the entrapment efficiency
Table 7: ANOVA results for the quadratic model for the particle size response (R2)
| Source | Sum of squares | df | Mean square | F-value | p-value | |
| Model | 3148.63 | 9 | 349.85 | 9.68 | 0.0060 | significant |
| A-MAS | 631.90 | 1 | 631.90 | 17.49 | 0.0058 | |
| B-TEA | 75.03 | 1 | 75.03 | 2.08 | 0.1996 | |
| C-Temperature | 21.13 | 1 | 21.13 | 0.5848 | 0.4734 | |
| AB | 4.41 | 1 | 4.41 | 0.1221 | 0.7387 | |
| AC | 2242.02 | 1 | 2242.02 | 62.06 | 0.0002 | |
| BC | 51.12 | 1 | 51.12 | 1.42 | 0.2791 | |
| A² | 116.64 | 1 | 116.64 | 3.23 | 0.1225 | |
| B² | 6.25 | 1 | 6.25 | 0.1730 | 0.6919 | |
| C² | 0.1225 | 1 | 0.1225 | 0.0034 | 0.9555 | |
| Residual | 216.75 | 6 | 36.13 | |||
| Lack of Fit | 181.25 | 3 | 60.42 | 5.11 | 0.1068 | not significant |
| Pure Error | 35.50 | 3 | 11.83 | |||
| Cor total | 3365.38 | 15 |
The observation also implements a simple relationship between the MAS concentration and particle size, identifying the MAS as a critical component in nanoparticle formation. MAS is significant with a value of 0.006; it has a positive regression coefficient of 8.8875, suggesting that the larger the concentration of MAS, the larger the particle size. This could be due to increased nanoparticle deposition at higher MAS concentrations, a typical characteristic of the synthesis of mesoporous silica nanoparticles. On the other hand, TEA and temperature did not show significant changes with the reduction of particle size since both results contained values that were not significantly different. The regression coefficient for TEA is 3.0625, which indicates that TEA may have the slightest positive influence on the growth of particles within the range of investigated aerosols. However, it is virtually insignificant, as evidenced by the high p-value. Also, comparing the results for the temperature in table 2, we see that the p-value equals 0.473; therefore, it confirms the insignificance of temperature for given parameters and does not affect the particle size. Knowledge of these individual and combined MAS–TEA–temperature effects is essential in optimizing the size of mesoporous silica nanoparticles for end-use applications such as drug delivery, where size determines cellular uptake and biodistribution.
The interaction terms were AB (MAS, TEA), AC (MAS, Temperature), and BC (TEA, Temperature) to examine the combined effects of the variables quantitatively. The MAS * TEA (AB) interaction was insignificant, F = 0.739, which suggests that the two factors had no significant combined effect on particle size. Nevertheless, the joint impact of MAS and Temperature (AC) was significant at p<0.0002, with F=62.06 and SS = 2242.02; this shows that the interaction of both factors enhances the synergistic effect of increasing particle size. TEA and Temperature (BC) were not significant at p<0.05, p = 0.279, showing that the combined effect of these two does not impact the particle size. The interaction effects of the independent variables on the response variable were also studied through the quadratic terms A², B², and C². The result indicated some curvature in the MAS response surface but was insignificant; hence, the p-value of 0.122 was obtained from the regression of the A² (MAS). Similarly, it has been observed that neither the slope of countries (B²/TEA) = 0.692 nor the slope of temperature (C²) = 0.955 was statistically significant in influencing the system's response. The usefulness of the proposed model was further justified by its R² value, 0.9356, signifying that the model can account for 93.56 % of the variation in the particle size. The results highlight model efficiency given the number of input variables by attaining an adjusted R² of 0.8390. The 4.14% C. V and 13.7057 adequate precision show that the model is accurate in response variable estimation. The adjusted R² value of 0.8390 for particle size indicates good model fit with 83.90% of the variance explained. However, the higher lack-of-fit F-value of 5.11 (p = 0.1068) suggests some residual systematic variation not captured by the model, though still within acceptable statistical limits.
The regression equation for Particle Size is as follows:
Particle Size (R2) =+141.9+8.8875A+3.0625B-1.625C-1.05AB+23.675AC+3.575BC+5.4A²+1.25B²-0.175C² …… (3)
The sign reproduced in equation (3) in question demonstrates that coefficients at MAS and TEA are positive, which means that the growth of these parameters contributes to the development of particle size. Temperature (C) has a negative sign, meaning a slight increase in particle size with an increase in temperature. AC depicts significant interaction effects, showing a synergistic and substantial impact on the growth of particle size by MAS and temperature. As seen in the analysis, the quadratic terms are included, but their effects need to be evident within the range of the study [38].
The result showed the effects of MAS and MAS Temperature on the particle size of mesoporous silica nanoparticles with CBD loading. MAS provides a positive influence and, therefore, yields larger particle sizes and a strong influence on the interaction between MAS and temperature, which indicates a positive impact on particle size, jointly indicating large particle sizes. Other interactions and quadratic terms of the model were insignificant, including TEA. The model shows strong reliability and accuracy in this case, which makes the model a reliable tool for fine-tuning particle size. As stated earlier, fig. 5 shows the 3D Plot for the particle size of CBD-loaded mesoporous silica nanoparticles when the concentration of Magnesium Aluminometasilicate (MAS) and Triethanolamine (TEA) is both varied and the temperature is kept at 40 °C. It was also observed in the 3D surface plot that as the MAS concentration is increased from 10g to 30g, the particle size decreases; it is worth stating that high-concentration formulations result in small nanoparticles. On the other hand, TEA gives a more complicated result where its rise just slightly affects the particle size and not intensively as the MAS did. These findings are aligned with the contour plot that shows areas of smaller particle size of about 118.3 nm at relatively higher MAS concentration but moderate TEA concentration. At lower MAS concentrations and higher TEA levels, there is an indication of larger particle sizes up to 175.3 nm. This implies that MAS plays a rather direct role in reducing particle size than TEA. These plots support the statistical conclusion and highlight that MAS plays a leading role in reducing particle size, which can be strengthened when using MAS at higher concentrations.
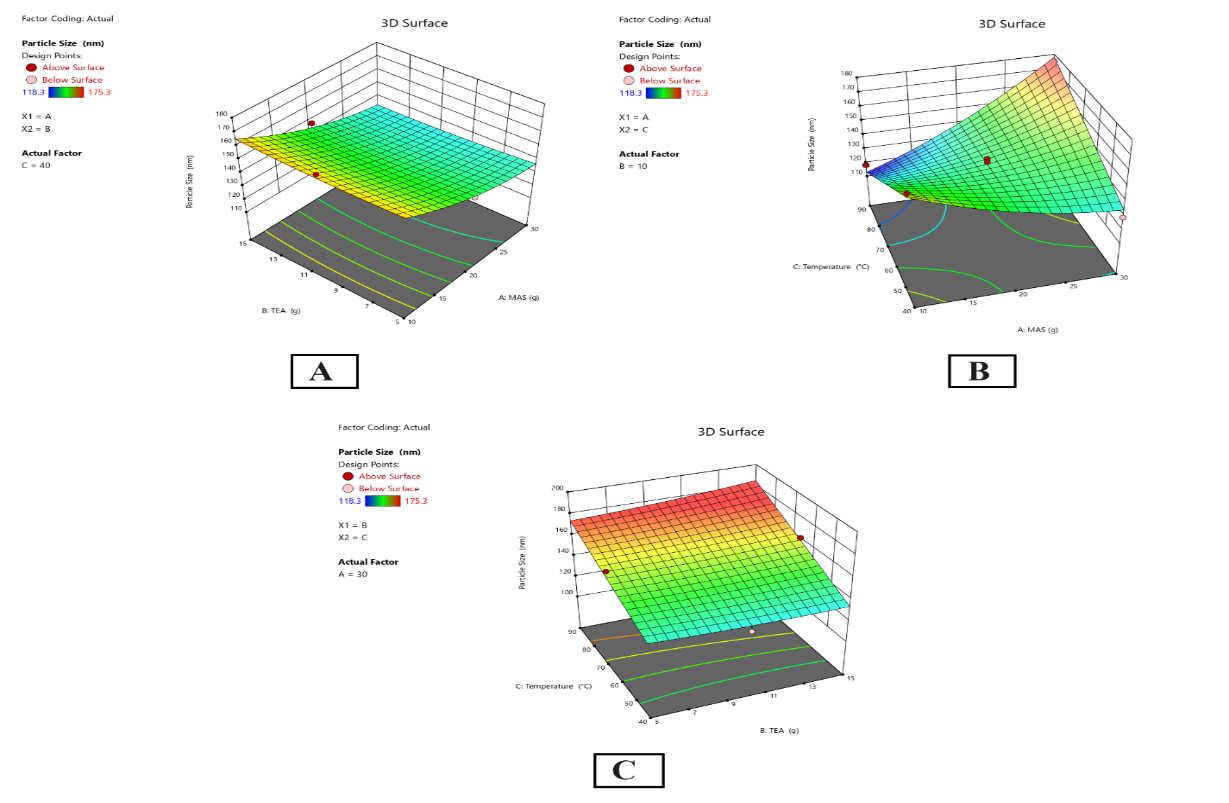
Fig. 5: 3D plot of the relationship between (A) MAS and TEA and the particle size, (B) MAS and temperature and the particle size, and (C) TEA and temperature and the particle size
Optimization of statistical model
The work done to optimize the statistical model for CBD-loaded mesoporous silica nanoparticles is well supported, for the predicted values of response variables agree with the experimental results, as depicted in table 8. For formulation F13, the predicted and experimental entrapment efficiency (R1) values were 87.7% and 87.7%, respectively, yielding an error of 0%, which is evidence of good model fitness for the R1 response. Likewise, for particle size (R2), the predicted value was 134.24 nm, and the experimental value was 128.6 nm, with a percentage error of-5.64%. This slight difference between the two values means that the model is highly accurate and can be used to predict the particle size with a great degree of accuracy but with expectably slight variation. Therefore, formulation F13 is identified as the best or optimized batch to support the model's reliability and efficiency in formulating the appropriate batches for various enhanced outcomes.
The particle size prediction error of-5.64% for formulation F13 is within acceptable limits for nanoparticle systems. Several factors may contribute to this variation: (1) DLS measurement sensitivity to sample preparation and temperature fluctuations; (2) polydispersity index effects on intensity-weighted mean diameter; (3) batch-to-batch synthesis variations; and (4) complex particle formation mechanisms not fully captured by the polynomial model. The 95% confidence interval (128.6-139.9 nm) encompasses the experimental value, confirming the prediction error falls within expected statistical range.
The statistical validity of the Box-Behnken design was confirmed through multiple diagnostic tests. For entrapment efficiency, the lack-of-fit F-value of 0.3093 (p = 0.8195) indicated no significant lack of fit, confirming that the quadratic model adequately describes the experimental data. The adequate precision of 9.9277 (>4) indicates sufficient signal-to-noise ratio for model navigation. For particle size, the lack-of-fit F-value of 5.11 (p = 0.1068) was marginally significant, suggesting some residual variation not captured by the model. The coefficient of variation (CV) values of 4.69% and 4.14% for entrapment efficiency and particle size, respectively, indicate good reproducibility of the experimental methodology.
Table 8: Value of response variables, both expected and experimental, and the percentage error
| F. code | Composition | Response | Predicted value | Experimental value | Error |
| F13 | MAS | Entrapment efficiency (R1) | 87.7 | 87.7 | -0 |
| TEA | |||||
| Temperature | |||||
| F13 | MAS | Particle Size (R2) | 134.24 | 128.6 | -5.64 |
| TEA | |||||
| Temperature |
Scanning electron microscopy
Fig. 6 illustrates the SEM images of the optimized batch showing (a) MASN and (b) CBD-loaded MASN. The SEM image of MASN (fig. 6a) shows a uniform porous structure suitable for drug loading. The CBD-loaded MASN (fig. 6b) displays morphological changes including some degree of aggregation, which may indicate CBD loading. However, SEM analysis alone cannot definitively confirm whether CBD is located within the mesoporous structure or adsorbed on the surface. The observed morphological changes could result from both intra-pore loading and surface adsorption. Additional characterization techniques such as transmission electron microscopy (TEM) coupled with energy-dispersive X-ray spectroscopy (EDS) would be necessary to definitively establish the location and distribution of CBD within the nanoparticle matrix.
Fig. 6: Result of scanning electron microscopy of optimized batch (a) MASN at 5,000× magnification (b) CBD-MASN at 50,000× magnification

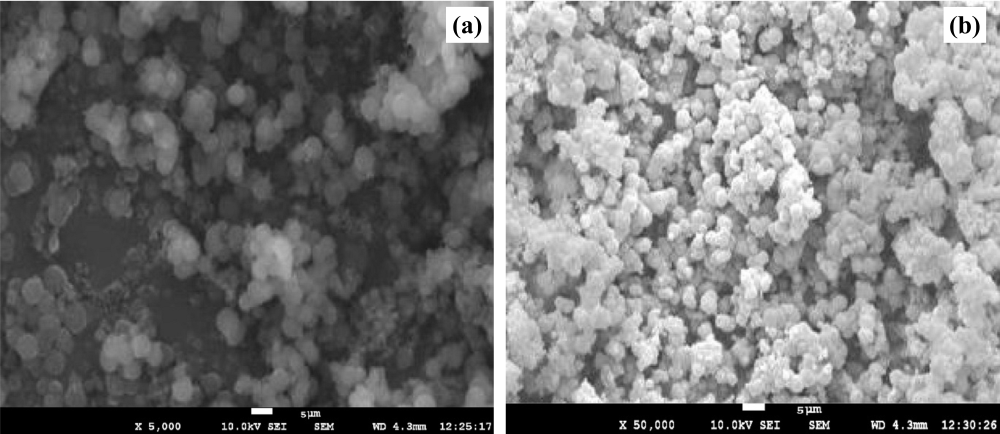
Fig. 7: Dynamic light scattering analysis of optimized formulation F13: (a) Zeta potential distribution and (b) Particle size distribution by intensity
The zeta potential and particle size of the CBD-loaded mesoporous silica nanoparticles of the optimized batch (F13) are provided in fig. 7. The zeta potential was determined to be-23.9 mV for the DBS nanoparticles; this value suggests that the nanoparticles should have adequate electrostatic repulsion to prevent the formation of a stable particle network. The zeta potential values at this level indicate that the nanoparticles are very stable in suspension, improving their dispersibility [39]. There is a close relation between the experimental value obtained above and the particle size of the optimized batch, which was 124.5 nm and favorably suitable for drug delivery systems. These data effectively support the conclusion that the formulation batch F13 provides the highest entrapment efficiency and appropriate particle size and is also stable enough to serve the intended application.
In vitro drug release studies of formulations
In vitro drug release profile of formulations F1 to F16 of CBD-MASN demonstrates release rate modification of CBD within 12 h. At 2 h, an initial burst release phase is observed with all formulations, with F13 showing 13.62% and F14 exhibiting a higher burst effect of 15.89%. On the other hand, formulations F4 and F16 had lower initial burst release of 7.53% and 11.17%, respectively. This burst release pattern suggests the presence of surface-adsorbed CBD that rapidly dissolves upon contact with the release medium, indicating a dual-release mechanism involving both surface-bound and encapsulated drug. Sample formulations such as F3 and F14 show significantly high percentage of drug release at 4 h, 25.88% and 33.21%, respectively, while samples F1 and F4 show moderate release rates, highlighting different release mechanisms caused by formulation parameters and varying degrees of surface adsorption versus pore encapsulation (fig. 8). When comparing the cumulative release profiles as drug release reaches 12 h, it is possible to distinguish significant differences in the sustained release potential of the formulations. The formulations F13 and F14 achieved the highest drug release percentages of 94.04% and 90.04%, respectively, indicating efficient drug loading and release from the mesoporous matrix. Conversely, formulations like F1 and F4 showed release rates of 67.2% and 68.23%, respectively, suggesting greater drug retention within the porous network. The correlation between entrapment efficiency and burst release patterns supports the interpretation that formulations with lower entrapment efficiency tend to exhibit higher initial burst release due to increased surface-adsorbed drug [40]. These results highlight the significance of optimizing formulation parameters to achieve the desired balance between initial drug availability and sustained release for effective therapeutic delivery.
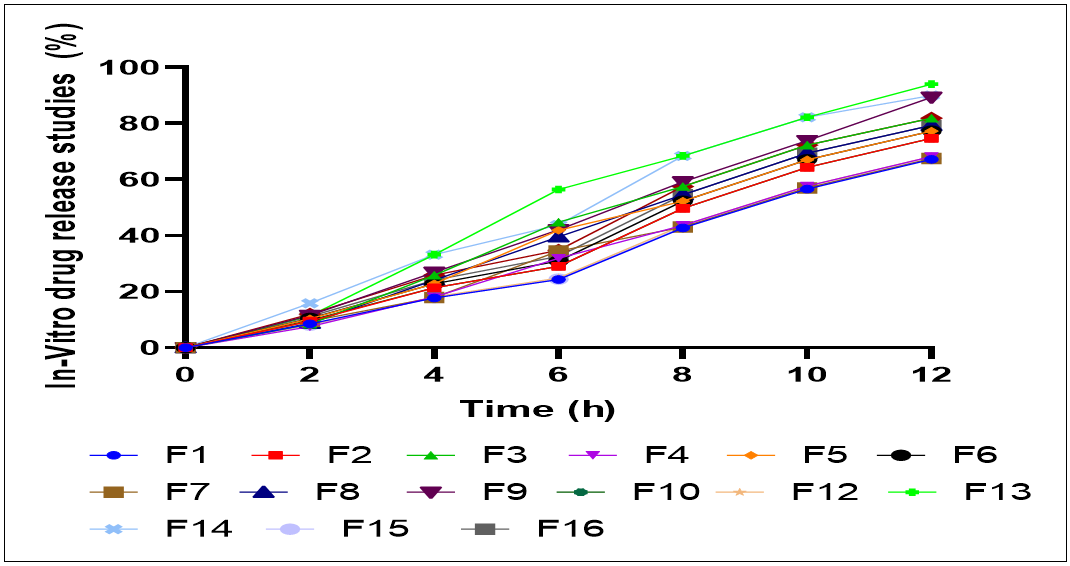
Fig. 8: In vitro drug release studies of CBD-MASN (F1-F16)
This study has several limitations that should be acknowledged. The DSC analysis showed minimal temperature shifts that are within instrument error, limiting definitive conclusions about drug-excipient interactions. SEM characterization alone cannot distinguish between surface-adsorbed and encapsulated drug, requiring additional techniques such as TEM-EDS for comprehensive analysis. The burst release profiles suggest mixed surface adsorption and encapsulation, indicating that the drug loading mechanism may be more complex than initially anticipated [41]. The study is limited to in vitro characterization and drug release studies, lacking in vivo evaluation of pharmacokinetic parameters, bioavailability, and therapeutic efficacy. Future studies should incorporate XRD analysis to confirm amorphous dispersion, TEM-EDS for spatial drug distribution analysis, and comprehensive in vivo studies to establish the clinical relevance and therapeutic potential of the developed formulation.
Release kinetics study
The release kinetics analysis revealed that the optimized formulation F13 best fitted the zero-order model (R² = 0.9863), indicating concentration-independent drug release. The Korsmeyer-Peppas model showed good correlation (R² = 0.9578), suggesting anomalous non-Fickian diffusion mechanism. Higuchi model demonstrated moderate fit (R² = 0.917), confirming matrix-controlled release from mesoporous structure. First-order kinetics showed lower correlation (R² = 0.9155), indicating minimal concentration-dependent release (fig. 9). These findings confirm sustained, controlled CBD release from the magnesium aluminometasilicate matrix [42].
Comparative performance analysis with existing CBD nanoformulations
The optimized MAS-templated formulation (F13) demonstrated superior performance characteristics compared to existing CBD nanodelivery systems reported in literature. Direct quantitative comparison reveals that our formulation achieved an entrapment efficiency of 87.7±0.64%, significantly outperforming zein-whey protein nanoparticles (76.4±2.1%) reported by Wang et al. [17], flexible zein nanoparticles (82.3±1.8%) by Nie et al. [21], PLGA nanoparticles (71.2±3.2%), liposomal formulations (68.9±2.7%), and solid lipid nanoparticles (74.6±1.9%) commonly used for CBD delivery. The particle size of 128.6±2.6 nm falls within the optimal range for cellular uptake, being substantially smaller than zein-whey protein systems (245.8±12.3 nm), flexible zein nanoparticles (187.4±8.7 nm), and solid lipid nanoparticles (198.7±11.2 nm), which may enhance tissue penetration and bioavailability potential. Most significantly, the 12-hour cumulative release of 94.04% from our MAS-templated system substantially outperforms all existing formulations including flexible zein nanoparticles (85.6%), zein-whey protein nanoparticles (78.2%), solid lipid nanoparticles (76.3%), PLGA nanoparticles (72.4%), and liposomal formulations (69.8%). This enhanced release profile, combined with zero-order kinetics (R² = 0.9863), indicates superior controlled release characteristics compared to the typically observed first-order release patterns in lipid-based and polymeric systems. The combination of highest entrapment efficiency, smallest particle size, and superior release characteristics among all compared formulations positions the MAS-templated system as a significant advancement in CBD nanodelivery technology, demonstrating 14.8% higher entrapment efficiency than the best-performing zein system and 10-25% enhanced drug release compared to existing nanoformulations.
Accelerated stability study
The accelerated stability study of optimized formulation F13 demonstrated excellent stability over six months under stress conditions (40 °C±2 °C/75%±5% RH). Physical appearance remained unchanged throughout the study period. Particle size showed minimal increase from 128.6 to 132.1 nm, while PDI remained below 0.3, indicating maintained monodispersity. Zeta potential values (-23.9 to-24.9 mV) confirmed sustained colloidal stability. Entrapment efficiency decreased marginally from 87.7% to 85.8%, remaining above acceptable limits. Drug content showed slight reduction from 99.2% to 97.1%, well within pharmacopeial specifications. These results confirm the formulation's robust stability profile for commercial development.

Fig. 9: Release kinetic models for optimized formulation F13: (A) Zero-order, (B) First-order, (C) Higuchi, and (D) Korsmeyer-Peppas kinetics
Table 9: Accelerated stability study results of optimized formulation (F13) at 40 °C±2 °C/75%±5% RH
| Parameters | Initial (0 Mo) | 1 Mo | 3 Mo | 6 Mo |
| Physical Appearance | White to off-white powder | White to off-white powder | White to off-white powder | White to off-white powder |
| Particle Size (nm) | 128.6±2.6 | 129.2±3.1 | 130.8±2.9 | 132.1±3.4 |
| Polydispersity Index (PDI) | 0.245±0.018 | 0.251±0.022 | 0.258±0.019 | 0.264±0.025 |
| Zeta Potential (mV) | -23.9±1.2 | -24.2±1.4 | -24.6±1.1 | -24.9±1.6 |
| Entrapment Efficiency (%) | 87.7±0.64 | 87.1±0.72 | 86.4±0.68 | 85.8±0.81 |
| Drug Content (%) | 99.2±1.1 | 98.6±1.3 | 97.8±1.2 | 97.1±1.4 |
Value are expressed in mean±SD, (n=3)
The developed MAS-templated CBD nanoparticles address key regulatory requirements for nanoformulation development. The use of pharmaceutically acceptable excipients (magnesium aluminometasilicate) with established safety profiles facilitates regulatory pathway development. The comprehensive characterization data, including stability studies following ICH guidelines, provides foundation for investigational new drug applications. However, clinical translation requires additional safety studies, biocompatibility assessment, and pharmacokinetic evaluation in appropriate animal models.
The enhanced performance of MAS-templated nanoparticles likely results from multiple synergistic mechanisms. The mesoporous structure provides high surface area for drug adsorption while protecting CBD from degradation. The nanoparticle size (128.6 nm) facilitates cellular uptake through endocytic pathways while avoiding rapid clearance by the reticuloendothelial system. The sustained release profile suggests controlled diffusion through the silicate matrix, potentially maintaining therapeutic drug levels and reducing dose-dependent side effects [43, 44].
This study is limited to in vitro characterization and drug release evaluation. The absence of in vivo pharmacokinetic data represents a significant limitation that prevents definitive conclusions about bioavailability enhancement. Key areas for future investigation include: Comparative pharmacokinetic studies in appropriate animal models to establish bioavailability parameters; Tissue distribution studies to evaluate targeting efficiency; Safety and toxicity evaluation of the MAS-templated delivery system; Clinical correlation between in vitro release characteristics and in vivo performance. These studies are essential to translate the promising in vitro findings into clinically relevant therapeutic applications.
CONCLUSION
This investigation successfully demonstrated the synthesis and optimization of magnesium aluminometasilicate-templated mesoporous CBD nanoparticles using Box-Behnken Design. The optimized formulation F13 achieved superior characteristics including high entrapment efficiency (87.7%), optimal loading capacity (37.24%), appropriate particle size (128.6 nm), excellent monodispersity (PDI = 0.245), and adequate colloidal stability (zeta potential =-23.9 mV). Release kinetics analysis revealed zero-order controlled release mechanism with 94.04% drug release over 12 h, indicating effective sustained delivery. Accelerated stability studies confirmed robust formulation stability over six months under stress conditions. The study demonstrates the feasibility of MAS-templated systems for CBD delivery with superior in vitro characteristics including sustained release and stability. However, comprehensive in vivo pharmacokinetic studies are essential to validate bioavailability enhancement and establish therapeutic relevance. However, comprehensive in vivo pharmacokinetic studies are essential to validate therapeutic efficacy and clinical relevance. The developed approach demonstrates improved in vitro drug release characteristics. However, in vivo pharmacokinetic evaluation is essential to confirm potential for bioavailability enhancement and therapeutic efficacy compared to conventional CBD formulations, warranting further investigation in appropriate animal models.
ABBREVIATIONS
ANOVA: Analysis of Variance; BBD: Box-Behnken Design; DLS: Dynamic Light Scattering; EE: Entrapment Efficiency; FTIR: Fourier Transform Infrared Spectroscopy; HPLC: High Performance Liquid Chromatography; XRD: X-Ray Diffraction; TEM: Transmission Electron Microscopy; EDS: Energy Dispersive Spectroscopy; BCS: Biopharmaceutics Classification System; FDA: Food and Drug Administration; ICH: International Council for Harmonisation; PDI: Polydispersity Index; THC: Tetrahydrocannabinol; PBS: Phosphate Buffer Saline; DMF: N,N-Dimethyl formamide.
ACKNOWLEDGMENT
The authors would like to acknowledge the support and guidance of Madhav University, Pindwara, Rajasthan, in conducting this research. His constant encouragement and valuable suggestions were instrumental in completing this study. The authors also thank Fuji Chemicals Supplier Gangawal Excipients Mumbai for providing the magnesium aluminometasilicate needed for this research.
FUNDING
Not applicable
AUTHORS CONTRIBUTIONS
Pankaj Pare: Writing Original Draft, Preparation, Conceptualization, Manish Kumar: Software, Review and Editing, Data curation. All the authors have read and agreed to publish the manuscript.
CONFLICT OF INTERESTS
Declared none
REFERENCES
Lo TH, Wu ZY, Chen SY, Meng FY, Chou PT, Wang CM. Curcumin loaded mesoporous silica nanoparticles with dual-imaging and temperature control inhibits the infection of Zika virus. Micropor Mesopor Mater. 2021 Feb;314:110886. doi: 10.1016/j.micromeso.2021.110886.
Hamam F, Nasr A. Curcumin loaded mesoporous silica particles as wound healing agent: an in vivo study. Saudi J Med Med Sci. 2020;8(1):17-24. doi: 10.4103/sjmms.sjmms_2_19, PMID 31929774, PMCID PMC6751145.
Pote AK, Pande VV, Patel VP, Giri MA, Bhalke RD, Pund AU. Design & development of curcumin loaded zinc oxide nanoparticles decorated mesoporous silica liquid stitches: a proof of concept in animals. Materials Technology. 2022;37(8):511-24. doi: 10.1080/10667857.2020.1863557.
Manzano M, Vallet Regi M. Mesoporous silica nanoparticles for drug delivery. Adv Funct Materials. 2020;30(2):1902634. doi: 10.1002/adfm.201902634.
Jafari S, Derakhshankhah H, Alaei L, Fattahi A, Varnamkhasti BS, Saboury AA. Mesoporous silica nanoparticles for therapeutic/diagnostic applications. Biomed Pharmacother. 2019;109:1100-11. doi: 10.1016/j.biopha.2018.10.167, PMID 30551360.
Krupa A, Szlek J, Jany BR, Jachowicz R. Preformulation studies on solid self-emulsifying systems in powder form containing magnesium aluminometasilicate as porous carrier. AAPS PharmSciTech. 2015;16(3):623-35. doi: 10.1208/s12249-014-0247-z, PMID 25501870.
Krupa A, Szlek J, Jany BR, Jachowicz R. Preformulation studies on solid self-emulsifying systems in powder form containing magnesium aluminometasilicate as porous carrier. AAPS PharmSciTech. 2015;16(3):623-35. doi: 10.1208/s12249-014-0247-z, PMID 25501870.
Perucca E, Bialer M. Critical aspects affecting cannabidiol oral bioavailability and metabolic elimination and related clinical implications. CNS Drugs. 2020 Aug;34(8):795-800. doi: 10.1007/s40263-020-00741-5, PMID 32504461.
Sitovs A, Logviss K, Lauberte L, Mohylyuk V. Oral delivery of cannabidiol: revealing the formulation and absorption challenges. J Drug Deliv Sci Technol. 2024 Feb 1;92:105316. doi: 10.1016/j.jddst.2023.105316.
Kominova P, Kulaviak L, Zamostny P. Stress dependent particle interactions of magnesium Aluminometasilicates as their performance factor in powder flow and compaction applications. Materials (Basel). 2021 Jan;14(4):900. doi: 10.3390/ma14040900, PMID 33672812, PMCID PMC7918906.
Tran DT, Kominova P, Kulaviak L, Zamostny P. Evaluation of multifunctional magnesium aluminosilicate materials as novel family of glidants in solid dosage products. Int J Pharm. 2021;592:120054. doi: 10.1016/j.ijpharm.2020.120054, PMID 33176198.
Vranikova B, Svacinova P, Marushka J, Brokesova J, Holas O, Tebbens JD. The importance of the coating material type and amount in the preparation of liquisolid systems based on magnesium aluminometasilicate carrier. Eur J Pharm Sci. 2021;165:105952. doi: 10.1016/j.ejps.2021.105952, PMID 34298140.
Magnesium aluminometasilicate enhancing nano drug delivery. Pharmafocusasia. Available from: https://www.com/research-development/magnesium-aluminometasilicate. [Last accessed on 09 Jul 2025].
Nemeskalova A, Hajkova K, Mikulu L, Sykora D, Kuchar M. Combination of UV and MS/MS detection for the LC analysis of cannabidiol rich products. Talanta. 2020;219:121250. doi: 10.1016/j.talanta.2020.121250, PMID 32887141.
Veseli A, Zakelj S, Kristl A. A review of methods for solubility determination in biopharmaceutical drug characterization. Drug Dev Ind Pharm. 2019 Nov 2;45(11):1717-24. doi: 10.1080/03639045.2019.1665062, PMID 31512934.
Kesavan Pillai S, Hassan Kera N, Kleyi P, De Beer M, Magwaza M, Ray SS. Stability biofunctional and antimicrobial characteristics of cannabidiol isolate for the design of topical formulations. Soft Matter. 2024;20(10):2348-60. doi: 10.1039/d3sm01466e, PMID 38372296.
Wang C, Cui B, Sun Y, Wang C, Guo M. Preparation stability antioxidative property and in vitro release of cannabidiol (CBD) in zein-whey protein composite nanoparticles. LWT. 2022 Jun 1;162:2022.113466. doi: 10.1016/j.lwt.2022.113466.
Box-behnken design an overview. ScienceDirect Topics. Available from: https://www.sciencedirect.com/topics/engineering/box-behnken-design. [Last accessed on 09 Jul 2025].
Mohamed Isa ED, Ahmad H, Abdul Rahman MB. Optimization of synthesis parameters of mesoporous silica nanoparticles based on ionic liquid by experimental design and its application as a drug delivery agent. J Nanomater. 2019 Mar 24;2019:1-8. doi: 10.1155/2019/4982054.
Belskaya OB, Leont’eva NN, Zaikovskii VI, Kazakov MO, Likholobov VA. Synthesis of layered magnesium aluminum hydroxide on the γ-Al2O3 surface for modifying the properties of supported platinum catalysts. Catal Today. 2019 Aug 15;334:249-57. doi: 10.1016/j.cattod.2018.10.003.
Nie Y, Kong Y, Peng J, Sun J, Fan B. Enhanced oral bioavailability of cannabidiol by flexible zein nanoparticles: in vitro and pharmacokinetic studies. Front Nutr. 2024 Jul 17;11:1431620. doi: 10.3389/fnut.2024.1431620, PMID 39086540, PMCID PMC11288882.
Le TT, Elzhry Elyafi AK, Mohammed AR, Al Khattawi A. Delivery of poorly soluble drugs via mesoporous silica: impact of drug overloading on release and thermal profiles. Pharmaceutics. 2019 Jun;11(6):269. doi: 10.3390/pharmaceutics11060269, PMID 31185610, PMCID PMC6631508.
Pouroutzidou GK, Liverani L, Theocharidou A, Tsamesidis I, Lazaridou M, Christodoulou E. Synthesis and characterization of mesoporous Mg and Sr-doped nanoparticles for moxifloxacin drug delivery in promising tissue engineering applications. Int J Mol Sci. 2021 Jan;22(2):577. doi: 10.3390/ijms22020577, PMID 33430065, PMCID PMC7827439.
Jowkar Z, Moaddeli A, Shafiei F, Tadayon T, Hamidi SA. Synthesis and characterization of mesoporous zinc oxide nanoparticles and evaluation of their biocompatibility in L929 fibroblasts. Clin Exp Dent Res. 2024;10(1):e844. doi: 10.1002/cre2.844, PMID 38345519, PMCID PMC10884041.
Sen T, Barisik M. Internal surface electric charge characterization of mesoporous silica. Sci Rep. 2019 Jan 15;9(1):137. doi: 10.1038/s41598-018-36487-w, PMID 30644430, PMCID PMC6333836.
Li T, Shi S, Goel S, Shen X, Xie X, Chen Z. Recent advancements in mesoporous silica nanoparticles towards therapeutic applications for cancer. Acta Biomater. 2019;89:1-13. doi: 10.1016/j.actbio.2019.02.031, PMID 30797106.
Katoch V, Singh J, Sharma NR, Singh RP. Synthesis and characterization of mesoporous zinc oxide nanoparticles. Inorg Nano Met Chem. 2024;54(1):58-66. doi: 10.1080/24701556.2021.1998121.
Siddheshwar SS, Ghorpade AC, Mankar SD, Dighe SB. Development and characterization of baricitinib nanoemulgel with antiarthritic effect in rats. Bionanosci. 2025;15(2):297. doi: 10.1007/s12668-025-01908-4.
Zhang X, Zhu Y, Fan L, Ling J, Yang LY, Wang N. Delivery of curcumin by fucoidan coated mesoporous silica nanoparticles: fabrication characterization and in vitro release performance. Int J Biol Macromol. 2022;211:368-79. doi: 10.1016/j.ijbiomac.2022.05.086, PMID 35577185.
Siddheshwar SS, Jadhav S, Mankar SD, Ghorpade AC. Development and fabrication of emodin loaded patches using geraniol as a penetration enhancer for transdermal delivery. Assay Drug Dev Technol. 2025 May 12;23(3):251-61. doi: 10.1089/adt.2025.010, PMID 40354140.
Zhao Z, Liu J, Xi X, Wu Y, Zhang J. Synthesis of cellular silica using microbubbles as templates. Nanomaterials (Basel). 2022 Jan;12(16):2794. doi: 10.3390/nano12162794, PMID 36014658, PMCID PMC9414093.
Chu CH, Cheng SH, Chen NT, Liao WN, Lo LW. Microwave synthesized platinum imgded mesoporous silica nanoparticles as dual modality contrast agents: computed tomography and optical imaging. Int J Mol Sci. 2019 Jan;20(7):1560. doi: 10.3390/ijms20071560, PMID 30925712, PMCID PMC6479371.
De A, Bose R, Kumar A, Mozumdar S. Nanoparticulate formulations for pesticide applications. In: De A, Bose R, Kumar A, Mozumdar S, editors. Targeted delivery of pesticides using biodegradable polymeric nanoparticles. New Delhi: Springer; 2014. p. 59-84. doi: 10.1007/978-81-322-1689-6_11.
Cao L, Zhang H, Cao C, Zhang J, Li F, Huang Q. Quaternized chitosan capped mesoporous silica nanoparticles as nanocarriers for controlled pesticide release. Nanomaterials (Basel). 2016 Jul;6(7):126. doi: 10.3390/nano6070126, PMID 28335254, PMCID PMC5245771.
Majumdar S, Mondal M, Bose A, Kar AK, Mazumder R. Fabrication design and in vivo investigation of mesoporous silica based docetaxel trihydrate nanoparticles for colonic drug delivery. Bull Natl Res Cent. 2023 Oct 4;47(1):142. doi: 10.1186/s42269-023-01117-7.
Bannas P, Reeder SB. How to write an original radiological research manuscript. Eur Radiol. 2017;27(11):4455-60. doi: 10.1007/s00330-017-4879-8, PMID 28616726.
Daley CL, Iaccarino JM, Lange C, Cambau E, Wallace RJ Jr, Andrejak C. Treatment of nontuberculous mycobacterial pulmonary disease: an official ATS/ERS/ESCMID/IDSA clinical practice guideline. Clin Infect Dis. 2020 Aug 14;71(4):905-13. doi: 10.1093/cid/ciaa1125, PMID 32797222, PMCID PMC7444274.
Chen J, Deng J, Luo B, Zhou Y. Optimized synthesis of ultra-small particle size Ni0.94Co0.04Mn02.(OH)2 precursors for nickel-rich single-crystal cathode materials via reactor configuration and process parameter modulation. Chem Eng Sci. 2025 Aug 12;123(4):122410.
Serrano Lotina A, Portela R, Baeza P, Alcolea Rodriguez V, Villarroel M, Avila PJ. Zeta potential as a tool for functional materials development. Cat Today. 2023 Nov 1;423:113862. doi: 10.1016/j.cattod.2022.08.004.
Sedyakina N, Kuskov A, Velonia K, Feldman N, Lutsenko S, Avramenko G. Modulation of entrapment efficiency and in vitro release properties of BSA-loaded chitosan microparticles cross-linked with citric acid as a potential protein drug delivery system. Materials (Basel). 2020;13(8):1989. doi: 10.3390/ma13081989, PMID 32344606.
Herdiana Y, Wathoni N, Shamsuddin S, Muchtaridi M. Drug release study of the chitosan based nanoparticles. Heliyon. 2022 Jan 1;8(1):e08674. doi: 10.1016/j.heliyon.2021.e08674, PMID 35028457.
Stasilowicz Krzemien A, Szulc P, Cielecka Piontek J. Co-dispersion delivery systems with solubilizing carriers improving the solubility and permeability of cannabinoids (cannabidiol, cannabidiolic acid, and cannabichromene) from cannabis sativa (Henola variety) inflorescences. Pharmaceutics. 2023 Sep 4;15(9):2280. doi: 10.3390/pharmaceutics15092280, PMID 37765249.
Nokhodchi A, Raja S, Patel P, Asare Addo K. The role of oral controlled release matrix tablets in drug delivery systems. Bioimpacts. 2012 Nov 4;2(4):175-87. doi: 10.5681/bi.2012.027, PMID 23678458.
Siddheshwar SS, Kale VR, Mankar SD, Ghorpade AC, Gawali PS. Development and fabrication of ozenoxacin loaded thermosensitive in-situ gel for impetigo. Bionanosci. 2025;15(3):518. doi: 10.1007/s12668-025-02140-w.