
Int J App Pharm, Vol 17, Issue 6, 2025, 381-387Original Article
OPTIMIZATION AND VALIDATION OF ULTRA PERFORMANCE LIQUID CHROMATOGRAPHY COUPLED WITH TANDEM MASS SPECTROMETRY FOR QUANTIFICATION OF EFAVIRENZ IN HUMAN PLASMA
GAYATRI S.1*, SURYA M.1, KARTHIK R.2, VASUNDRA L.1
1Sri Ramachandra Faculty of Pharmacy, SRIHER (DU), Chennai-600116, Tamil Nadu, India. 2Bioanalytical and Analytical, Scitus Pharma Services Private Ltd, Thirumazhisai-600124, Tamil Nadu, India
*Corresponding author: Gayatri S.; *Email: gayatrisru@yahoo.co.in
Received: 31 May 2025, Revised and Accepted: 03 Sep 2025
ABSTRACT
Objective: This study presents the optimization and validation of a sensitive, rapid, and reliable ultra-performance liquid chromatography method for the quantification of efavirenz in human plasma, using efavirenz 13C6 as the internal standard.
Method: The liquid-phase extraction technique was used to isolate the internal standard and the analyte from human plasma. The extracted samples were analyzed using chromatography on an Acentis® Express 90 Å C18 column (5 cm x 4.6 mm, 2.7µm), elution carried out using a mixture of ammonium acetate buffer (5 mmol) and acetonitrile as the mobile phase (70:30). The flow rate was maintained at 0.6 ml/min with an injection volume of 5 µl. The ionization mode was negative ion electrospray, with a source energy of 150 °C.
Results: The linearity of the method was confirmed by a correlation coefficient of 0.9979, and the calibration range for efavirenz was found to be 50.00-5000 ng/ml. The precision and accuracy for both intra-day and inter-day measurements showed a %CV of less than 2.3% which is within the acceptable limit. The total run time was 3 min. The mean percentage recovery was 83.9 %.
Conclusion: The developed method offers a significantly reduced run time, enhancing analytical throughput and efficiency compared to previously reported methods with longer durations. This makes it particularly suitable for high-throughput analysis in routine quality control or pharmacokinetic studies.
Keywords: FDA guidelines, Internal standard, Non-nucleoside reverse transcriptase inhibitor, QC samples
© 2025 The Authors. Published by Innovare Academic Sciences Pvt Ltd. This is an open access article under the CC BY license (https://creativecommons.org/licenses/by/4.0/)
DOI: https://dx.doi.org/10.22159/ijap.2025v17i6.55345 Journal homepage: https://innovareacademics.in/journals/index.php/ijap
INTRODUCTION
Efavirenz (EF), chemically known as (4S)-6-chloro-4-(2-cyclopropylethynyl)-4-(trifluoromethyl)-1H-3,1-benzoxazin-2-one is a non-competitive inhibitor of the reverse transcriptase enzyme in HIV-1. It is a non-nucleoside reverse transcriptase inhibitor (NNRTI) with activity against HIV-1 and used as a first-line treatment of HIV infection worldwide [1, 2]. Recent advancements in the analysis of EF in human plasma have led to the development of various chromatographic techniques. However, the HPLC methods developed so far have longer retention time [3-10]. Previously, EF was extracted using both protein precipitation and liquid-liquid extraction methods and quantified using different internal standards [8]. HPLC/UV-based assays have been used to quantify multiple drugs in combined dosage forms. However, these methods have several disadvantages, including the need for a large sample volume, relatively long run times, and lower sensitivity and selectivity. Now-a-days, LC-MS/MS procedures are gaining importance due to their high sensitivity, selectivity and shorter run time [8-10]. Several analytical methods for the determination of EF, either alone or in combination with other drugs, have been developed using HPLC with UV detection. Some methods using UPLC have relatively long run time and, in addition, involve complicated processing of samples, are expensive, and have high quantification limit [9].
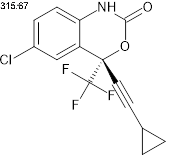
Fig. 1: The chemical structure of efavirenz
HPLC assays for EF often run for 10–25 min, with retention times around 21–22 min, including column re-equilibration. Traditional protocols typically require injection volumes of ≥100 µl and substantial sample pre-processing. Hence, it is necessary to develop an analytical method for the speedy and accurate determination of EF.
This proposed study aims to develop a bioanalytical method for speedy and accurate determination of EF in human plasma using ultra-performance liquid chromatography tandem mass spectrometry with high resolution. FDA guidelines were followed for the validation of the proposed analytical method [11, 12].
MATERIALS AND METHODS
Chemicals reagents, and reference compounds
Efavirenz (99.97%) and Efavirenz 13C6 (99.32 %) (EFIS) were purchased from Vivian Life Sciences, India. Acetonitrile, methyl tert-butyl ether (TBME), and methanol of LCMS grade were obtained from JT Baker Mumbai, India. Ammonium acetate and sodium hydroxide were purchased from Merck Limited, India. Human plasma (K2EDTA) was obtained from Scitus Pharma Services Pvt. Ltd., Chennai.
Preparation of stock solution
Stock solutions were prepared separately for calibration standards (CC) and quality control (QC) samples. The weighed analytes were dissolved in methanol to obtain a concentration of 1000 µg/ml. A 100 µg/ml internal standard solution was prepared by dissolving the appropriate weighed quantity in methanol. All stock solutions were stored at-20 °C.
Calibration and quality control solution preparation
Spiking solutions for CC and QC samples were prepared in 50 % methanol. CC working solutions were prepared from nine standards (Std 01 to Std 09) with concentration ranging from 50 ng/ml to 5000 ng/ml. Similarly, QC working solutions were prepared at five levels: lower limit of quantification (LLOQQC), low QC (LQC), mid QC (MQC), mid QC 1 (MQC1) and high QC (HQC), with concentrations of 50 ng/ml, 146 ng/ml, 365 ng/ml, 1662 ng/ml and 3777 ng/ml respectively. The working internal standard was prepared to give a final concentration of 1000 ng/ml.
Sample extraction protocol
Plasma samples were collected from individual donors and were stable for three months when stored at −20 °C. To extract EF from 0.100 ml of plasma in a polypropylene tube, 0.050 ml of EFIS working solution was added, followed by 100 µl of 2M sodium hydroxide. The mixture was vortexed thoroughly. Raising the plasma pH to approximately pH 11.0–11.5 enhances liquid–liquid extraction efficiency of efavirenz (a lipophilic weak acid), promoting better partitioning into organic solvents. To this 2.5 ml of extraction solvent, TBME was added, capped, and vortexed for 5 min at 1500-2000 rpm, then centrifuged for 5 min at 4000 rpm at 4±2 °C [13, 14]. The sample was then flash-frozen for 30 s in an ice/dry ice bath to solidify the residual aqueous layer, ensuring a clean decant of the organic phase. This step minimizes cross-contamination improves recovery and enhances assay precision. The supernatant was transferred to another polypropylene tube and evaporated using a low-volume evaporator for evaporation. The dried samples were reconstituted with 0.500 ml of reconstitution solution (Acetonitrile: 5 mmol Ammonium acetate in the ratio of 80:20 v/v) and vortexed. Finally, the sample solutions were transferred to vials and 10 μL was injected into LC-MS/MS for quantification.
Instrumentation
A Waters AcquityTMUPLC-Xevo TQ-S micro-Mass spectrometer system was used. It was equipped with electrospray ionization operated in negative ionization mode. Chromatographic separation was achieved on Acentis® Express 90 Å C18 column, 5 cm × 4.6 mm, 2.7µm. The mobile phase comprised of acetonitrile and ammonium acetate in 70:30 (v/v) ratio, with a flow rate of 0.6 ml/min and an injection volume of 5µl.
The source temperature was set to 150 °C, with a capillary voltage of 2.50 kV, cone gas flow of 100 l/h, desolvation gas flow of 1000 l/h, and probe flow rate of 600 μl/min. Unit mass resolution was employed, and the dwell time was set to 0.1 seconds. The collision energy was optimized to –24 eV for EF and-22 eV for EFIS. Multiple reaction monitoring (MRM) mode was used to detect the following ion transitions: m/z 315.67 → 243.97 and EFIS: m/z 321.6 → 250.1. MassLynzTM software version 4.2 was used to control all parameters of UPLC and MS. The column was equilibrated with the initial mobile phase conditions for 5 min prior to each injection.
Method validation
Method validation is used to show that the quantitative measurements in the specified matrix are accurate and reproducible as per United States Food and Drug Administration guidance for industry bioanalytical method validation and ICH M10 guideline [11].
Method linearity
A calibration curve was established using nine different concentration levels arranged in increasing order, along with a blank sample. The double blank sample was extracted with an internal standard and measured before the LLOQ sample. Less than 20% of the peak area as determined at the LLOQ can be carried over. The calibration curve was constructed by plotting the nominal concentrations of the calibration standards against the ratio of the analyte peak area to the IS peak area using linear regression analysis. A weighing factor of 1/x2 was applied to reduce inaccuracy at lower concentration levels. The percentage difference between the measured and nominal concentrations was used to calculate the accuracy for each CC point. The acceptance criteria for accuracy ranges from 85 to 115% for calibration points and 80 to 120% for the LLOQ. The calibration curve can be accepted only if the correlation coefficient (r2) is ≥0.99.
Auto sampler carry-over test
Carryover was evaluated by injecting an extracted ULOQ sample followed by a blank and an LLOQ sample. The blank sample, injected immediately after the ULOQ, was assessed to determine any carryover at the beginning of method validation.
Intra-assay precision and accuracy
Intra and inter-assay-based precision and accuracy were established using matrix samples obtained from pre-planned P and A extraction runs at various EF concentrations. Each run included six replicates of each QC level, including the LLOQ and LLOQ along with the calibration curve. The coefficient of variation was used as measurement of method precision.

A precision of ≤15% and an accuracy of 85 – 115% (LLOQ: 80 – 120%) is acceptable.
Sensitivity-limit of quantification
The quantitative precision and accuracy of the LLOQ were assessed on an inter-assay basis (only with the acceptable P and A runs). Sensitivity was experimentally assessed by injecting six LLOQ quality control samples and comparing each sample's signal to its background noise.
Recovery
Recovery of analyte was assessed by comparing the analytical outcomes for extracted samples at three concentration levels with the mean peak area of six post-extracted samples spiked with neat standards at equivalent concentrations (low, medium, and high EF QC samples). The recovery of EF was calculated accordingly. Between different plasma batches and QC levels, the recovery should be consistent (% CV ≤ 15%).
Recovery was calculated using the formula

Matrix factor
This test is performed to determine the possible suppression or enhancement of the ionization of the analyte and internal standard by co-eluting matrix components during mass spectrometric detection.
One lipemic (L) and one hemolyzed (H) and six lots of blank biological matrix were extracted and spiked at low and high QC levels with the neat spiking standard solution, and then compared with neat standards of the same concentration in consecutive injections.
Stability
Stability testing included assessment of benchtop stability, freeze-thaw stability, dry extract, processed sample stability, and frozen stability. Furthermore, the stability of EF in the stock solution and in human whole blood was assessed. Human plasma and whole blood samples were spiked with EF at low (146.00 ng/ml) and high (3777.00 ng/ml) concentrations. The samples were then kept for stability assessment at the designated times and temperatures. For bench-top stability, whole blood samples were kept at room temperature for two hours, while plasma samples were maintained at room temperature for 24 h. Freeze/Thaw stability was assessed by freezing samples at −20 °C and thawing them through three complete cycles. A storage temperature of−20 °C or −70 °C was used for the assessment of frozen long-term stability, for a duration of 113 d.
RESULTS
Method development
The key goal in mass spectrometry tuning is to acquire appropriate fragmented ions and response for both EF and EFIS (fig. 2), by adjusting the mass spectrometer parameters, fragmentation patterns and ionization mode [13, 14]. ESI-LC-MS/MS has proven to be an effective method for pharmacokinetic studies due to its ability to meet the sensitivity and selectivity criteria of bioanalytical approaches. The assay development employed the MRM technique, with parameters fine-tuned to enhance the analyte’s response.
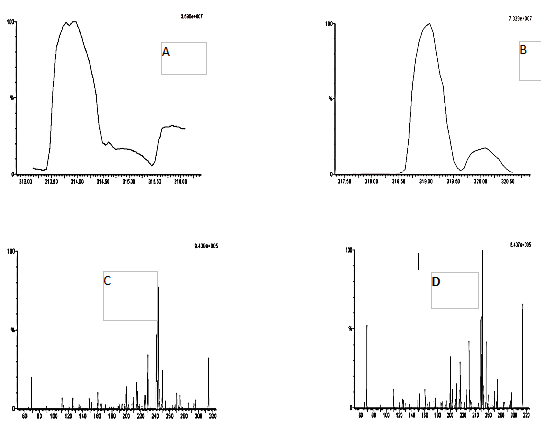
Fig. 2: Mass spectral area of efavirenz (A), efavirenz 13C6 (B) and daughter ion of efavirenz (C) and efavirenz 13C6 (D)
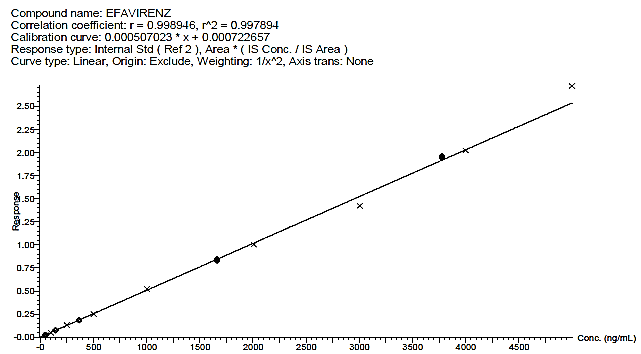
Fig. 3: Calibration curve of efavirenz
Table 1: Calibration curve concentration
| Concentration of calibration curve (ng/ml) | Mean±SD | % CV | % Accuracy | % Deviation |
STD 1 50.00 |
50.81±0.650 | 1.28 | 101.62 | 1.62 |
STD 2 100.00 |
98.01±2.903 | 2.96 | 98.01 | -1.99 |
STD 3 250.00 |
250.27±4.852 | 1.94 | 100.11 | 0.11 |
STD 4 500.00 |
505.38±8.601 | 1.7 | 101.08 | 1.08 |
STD 5 1000.00 |
1005.15±15.082 | 1.5 | 100.52 | 0.52 |
STD 6 2000.00 |
1981.69±11.893 | 0.6 | 99.08 | -0.92 |
STD 7 3000.00 |
2945.78±82.431 | 2.8 | 98.19 | -1.81 |
STD 8 4000.00 |
3976.57±54.980 | 1.38 | 99.41 | -0.59 |
STD 9 5000.00 |
5225.35±148.964 | 2.85 | 104.51 | 4.51 |
n=5. STD=standard, SD=standard deviation, % CV=percent coefficient of variation

Fig. 4: Chromatogram of A) Blank human plasma B) Blank human plasma spiked with the internal standard, C) LLOQ level D) ULOQ level
Method validation
Linearity
The method was found to be linear over the concentration range of 50.00 to 5000.00 ng/ml for EF and EFIS. Calibration curves were constructed using linear regression with a 1/x² weighting factor to enhance accuracy at lower concentrations.
Calibration curve
The developed method was found to be linear, with a slope of 0.00050702, an intercept of 0.0007226, and a determination coefficient r2of 0. 99789. These finding shows that the present approach is reliable and reproducible within the range of 50 to 5000 ng/ml. The back-calculated concentrations of the calibration standards are presented in table 1 and illustrated in fig. 3.
Inter-assay precision and accuracy
The method's reproducibility was tested using three precision and accuracy batches, consisting of both intraday and interday batches. The observed accuracy ranged between 98.1 and 100 %.
Sensitivity limit of quantification
The LOQ signal-to-noise (S/N) value for 6 injections of EF was determined and found to be within the acceptance criteria, with a mean S/N ≥ 5:1.
Table 2: Intra and Inter-assay precision and accuracy of QC samples
| Type of assay | Parameters | LLOQQC 50.00 ng/ml |
LQC 146.00 ng/ml |
MQC 1660.00 ng/ml |
HQC 3777.00 ng/ml |
| Inter-assay P and A1# | Inter run mean | 49.05 | 145.96 | 1636.67 | 3774.88 |
| Inter run SD | 1.142 | 1.746 | 16.149 | 73.505 | |
| Inter run % CV | 2.3 | 1.2 | 1.0 | 2.0 | |
| Inter run % Accuracy | 98.1 | 100.0 | 98.6 | 99.9 | |
| Inter run % deviation | -1.9 | 0.0 | -1.4 | -0.1 | |
| Intra-assay P and A2# | Intra run mean | 50.12 | 148.40 | 1619.12 | 3775.88 |
| Intra run SD | 1.101 | 2.380 | 13.148 | 63.901 | |
| Intra run % CV | 2.19 | 1.6 | 0.8 | 1.7 | |
| Intra run % Accuracy | 100.24 | 101.6 | 97.4 | 100.0 | |
| Intra run % deviation | 0.24 | 1.6 | -2.6 | 0.0 |
1#n=6 and 2#n=18, P and A= Precision and Accuracy, LLOQQC =l ower limit of quantification quality control, LQC =low quality control, MQC=mid quality control, HQC=high quality control, SD=standard deviation, % CV=percent coefficient of variation
Recovery
Recovery of EF and EFIS were assessed by comparing the mean peak areas of six extracted LQC, MQC, and HQC samples to those of six post-extraction samples spiked with neat standards containing equivalent amounts of low, medium, and high EF QC samples. Recovery was calculated using the following formula,
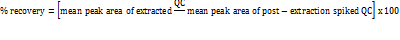
Results were shown in table 3
Matrix factor
The matrix effect performance was assessed. Both the intra-batch mean accuracy and precision were found to be within specifications, indicating the absence of ion enhancement or suppression. The results were presented in table 4.
Stability
Stability experiments included dry extract stability, processed sample stability, short-term stability and long-term stability, auto sampler stability, freeze-thaw stability, bench-top stability, whole blood stability, and in-solution stability. The analyte was detected with good precision and consistent percentage recoveries, passing all stability tests. According to the results of the freeze-thaw stability test, EF remained stable for three cycles. The results demonstrated that plasma samples could undergo freezing and thawing without compromising the reliability of the analyte, according to the conditions outlined in the optimized method. The observed findings were given in table 5.
Table 3: Recovery studies
| Sample | Sample level | % Recovery | Mean±SD | % CV |
| Efavirenz | HQC | 81.81 | 83.9±1.9 | 2.2 |
| MQC | 85.19 | |||
| LQC | 84.81 | |||
| Efavirenz 13C6 | HQC | 94.61 | 94.1±0.5 | 0.5 |
n=6, SD=standard deviation, % CV=percent coefficient of variation, LQC =low quality control, MQC=mid quality control, HQC=high quality control
Table 4: Matrix effect
| Matrix lot no | LOW | HIGH | ||
| 146.00 | Accuracy | 3777.00 | Accuracy | |
| (ng/ml) | (ng/ml) | |||
| 1 | 142.07 | 97.31 | 3543.26 | 93.81 |
| 140.92 | 96.52 | 3582.03 | 94.84 | |
| 139.16 | 95.32 | 3552.30 | 94.05 | |
| Intra-run Mean±SD | 140.7190±1.46569 | 3559.1950±20.28218 | ||
| Intra-run CV% | 1.04 | 0.57 | ||
| Intra-run % nominal | 96.38 | 94.23 | ||
| Intra-run % deviation | -3.62 | -5.77 | ||
| 2 | 142.69 | 97.73 | 3610.15 | 95.58 |
| 138.28 | 94.71 | 3488.24 | 92.35 | |
| 141.38 | 96.83 | 3550.90 | 94.01 | |
| Intra-run mean±SD | 140.7803±2.26376 | 3549.7650±60.96394 | ||
| Intra-run CV% | 1.61 | 1.72 | ||
| Intra-run % nominal | 96.42 | 93.98 | ||
| Intra-run % deviation | -3.58 | -6.02 | ||
| 3 | 141.38 | 96.84 | 3540.29 | 93.73 |
| 141.05 | 96.61 | 3533.40 | 93.55 | |
| 142.00 | 97.26 | 3599.17 | 95.29 | |
| Intra-run mean±SD | 141.4757±0.47907 | 3557.6200±36.14463 | ||
| Intra-run CV% | 0.34 | 1.02 | ||
| Intra-run % nominal | 96.90 | 94.19 | ||
| Intra-run % deviation | -3.10 | -5.81 | ||
| 4 | 142.45 | 97.57 | 3599.58 | 95.30 |
| 143.28 | 98.14 | 3585.81 | 94.94 | |
| 141.27 | 96.76 | 3590.34 | 95.06 | |
| Intra-run mean±SD | 142.3313±1.01048 | 3591.9103±7.01982 | ||
| Intra-run CV% | 0.71 | 0.20 | ||
| Intra-run % nominal | 97.49 | 95.10 | ||
| Intra-run % deviation | -2.51 | -4.90 | ||
| 5 | 141.50 | 96.92 | 3578.60 | 94.75 |
| 140.10 | 95.96 | 3557.78 | 94.20 | |
| 142.23 | 97.42 | 3616.59 | 95.75 | |
| Intra-run mean±SD | 141.2783±1.08171 | 3584.3220±29.82119 | ||
| Intra-run CV% | 0.77 | 0.83 | ||
| Intra-run % nominal | 96.77 | 94.90 | ||
| Intra-run % deviation | -3.23 | -5.10 | ||
| 6 | 141.97 | 97.24 | 3572.39 | 94.58 |
| 144.88 | 99.23 | 3587.96 | 94.99 | |
| 142.90 | 97.88 | 3627.15 | 96.03 | |
| Intra-run mean±SD | 143.2507±1.48667 | 3595.8323±28.21749 | ||
| Intra-run CV% | 1.04 | 0.78 | ||
| Intra-run % nominal | 98.12 | 95.20 | ||
| Intra-run % deviation | -1.88 | -4.80 | ||
| L | 148.65 | 101.82 | 3586.42 | 94.95 |
| 141.30 | 96.78 | 3600.42 | 95.32 | |
| 143.73 | 98.45 | 3606.97 | 95.50 | |
| Intra-run mean±SD | 144.5620±3.74365 | 3597.9367±10.49766 | ||
| Intra-run CV% | 2.59 | 0.29 | ||
| Intra-run % nominal | 99.02 | 95.26 | ||
| Intra-run % deviation | -0.98 | -4.74 | ||
| H | 143.31 | 98.16 | 3630.10 | 96.11 |
| 141.77 | 97.10 | 3569.91 | 94.52 | |
| 145.61 | 99.73 | 3573.03 | 94.60 | |
| Intra-run mean±SD | 143.5620±1.93435 | 3591.0123±33.88340 | ||
| Intra-run CV% | 1.35 | 0.94 | ||
| Intra-run % nominal | 98.33 | 95.08 | ||
| Intra-run % deviation | -1.67 | -4.92 | ||
n = 3, SD=standard deviation, % CV=percent coefficient of variation, L=lipemic and H= hemolyzed
Table 5: Stability data
| Drug | Nominal concentration (ng/ml) | Stability | Accuracy (%) | Precision (% CV) |
| EF LOW | 146.00 | 21.5 h at RT (Bench top) | 100.9 | 1.6 |
| 146.00 | 26.5 h at RT (Processed sample) | 99.8 | 1.4 | |
| 146.00 | 25.0 h at RT (Dry extract) | 101.4 | 1.9 | |
| 146.00 | 113 d in-20 °C (LT) | 100.9 | 2.0 | |
| 146.00 | 113 d in-70 °C (LT) | 101.4 | 1.8 | |
| 146.00 | 2.0 H at RT (whole blood) | 99.9 | 1.0 | |
| 146.00 | 2.0 H at ice bath (whole blood) | 100.4 | 0.6 | |
| EF HIGH | 3777.00 | 21.5 h at RT (Bench top) | 100.3 | 0.3 |
| 3777.00 | 26.5 h at RT (Processed sample) | 100.0 | 0.8 | |
| 3777.00 | 25.0 h at RT (Dry extract) | 98.3 | 0.8 | |
| 3777.00 | 113 d in-20 °C (long term) | 101.0 | 0.8 | |
| 3777.00 | 113 d in-70 °C (long term) | 99.5 | 2.0 | |
| 3777.00 | 2.0 H at RT (whole blood) | 100.1 | 0.7 | |
| 3777.00 | 2.0 H at ice bath(4–6 °C) (whole blood) | 100.0 | 0.2 |
% CV=percent coefficient of variation, RT=Room temperature, LT=Long term
Ruggedness
Various analytical columns and instruments were used to evaluate the method’s ruggedness. It was found that changes in column type and instrument did not significantly affect the method’s performance, demonstrating the robustness across different laboratory setups.
DISCUSSION
The MRM transition for EF was selected based on the fragmentation pattern. The precursor ion at m/z 314.1 (corresponding to the [M–H]⁻ ion) produces a dominant and consistent product ion at m/z 244.1. The optimized collision energy of –24 eV determined through direct infusion of EF standard solution yielded the highest signal intensity for the product ion with minimal background interference. This transition aligns with previously published and validated methods.
For the internal standard, a fluorinated analog of EF, was chosen due to its similar physicochemical properties, retention behaviour, and ionization efficiency. The selected transition provides a strong and stable signal intensity with negligible cross-talk with the EF transition. The collision energy was optimized to –22 eV to maximize sensitivity while maintaining peak symmetry and reproducibility.
The technique showed strong linearity for EF across the 50.00–5000.00 ng/ml concentration range, suitable for pharmacokinetic and therapeutic drug monitoring (TDM) studies. Strong linearity and high reliability, necessary for reproducible results within the validated range, were indicated by the calibration curve's high determination coefficient (r2 = 0.99789).
In the earlier methods [4-9], sample preparation techniques included protein precipitation, solid-phase extraction, or liquid-liquid extraction using TBME or ethyl acetate, typically following alkalinization. Most methods employed gradient elution, and mobile phase additives commonly included ammonium formate, ammonium acetate, formic acid, or acetic acid. C18 reversed-phase columns were predominantly used, although phenyl-modified silica phases were occasionally reported. A previously reported UPLC–MS/MS method employing a fluorinated internal standard achieved a higher sensitivity [10]. However, it demonstrated comparatively lower precision (CV<8%) and accuracy (95.2–108%), along with a longer run time. In contrast, the present method offers significant advantages, including reduced analysis time (3 min), cost-effectiveness, and improved throughput, making it more suitable for high-volume bioanalytical applications.
The reported methods with LC MS/MS and UPLCMS/MS offer high sensitivity and precision but requires a higher cost and complexity of the instrument [8, 10]. The inter-assay variability was found to be high in some earlier reported methods due to multi-drug interferences [3, 7]. Evaluations conducted for the present method, within and between days, verified precision and accuracy, revealing an accuracy range of 98.1 % to 100 % and inter-assay precision (CV ≤ 2.3 %). The method's suitability for routine clinical application, where reproducibility is essential for patient care, is supported by its high degree of consistency.
The method's sensitivity to identify low quantities of EF was confirmed when the LOQ, as measured by the signal-to-noise (S/N) ratio, satisfied the S/N ≥ 5:1 acceptance threshold. In clinical settings, particularly those with low drug concentrations, this guarantees precise monitoring of therapeutic medication levels.
The matrix factor assessment confirms the absence of matrix effect due to ion suppression. Bhargavi et al. [4] focused more on impurities than bioanalytical recovery and Adegbola et al. [5] provided acceptable recovery but lacked detailed variability across different concentrations. The recovery consistency in the present method is better than many earlier HPLC methods, particularly because it focuses solely on EF without interference from co-administered drugs. Recovery trials showed stable and repeatable recovery rates across different concentrations, proving that the extraction procedure has no discernible impact on analyte quantification.
Long term or handling-based stability was not explored in most of the reported methods, whereas, in the present, EF's stability in samples under standard handling and storage settings was confirmed by validating the method's stability under a variety of conditions, including freeze-thaw cycles. In regular clinical practice, this is essential for guaranteeing the precision and dependability of results. Ruggedness demonstrated the method's great adaptability to various lab settings. Very few studies [3, 4, 6] explicitly tested ruggedness; most were performed under controlled lab conditions, limiting real-world reliability. The present method's ruggedness adds significant practical value, especially in decentralized clinical labs, making it better suited for widespread implementation.
CONCLUSION
We created, optimized and verified a very trustworthy bioanalytical approach to measure EF in human plasma. Our approach is unique in that it only needs a small amount of plasma, which is processed in three minutes using liquid-liquid extraction. Analyte recovery was consistent with the extraction technique, and there was no matrix suppression. Notably, the plasma batch had no effect on either metric. Furthermore, the method's accuracy and precision adhered to regulatory criteria. The measured analytes are demonstrated to be stable under stress conditions that might arise during the implementation of this approach.
FUNDING
Nil
AUTHORS CONTRIBUTIONS
Gayatri S Conceptualized the study, designed the method development plan, and supervised the overall project. Surya M: Performed the LC-MS/MS method development, optimization and validation. Karthik R: Analyzed data, interpreted results, and contributed to troubleshooting analytical issues. Vasundra L: Prepared figures, tables, and contributed to drafting the manuscript. All authors read and approved the final manuscript.
CONFLICT OF INTERESTS
No conflict of interest
REFERENCES
Adkins JC, Noble S. Efavirenz. Drugs. 1998;56(6):1055-65. doi: 10.2165/00003495-199856060-00014, PMID 9878993.
World Health Organization. HIV/AIDS; 2023 Jul 13. Available from: https://www.who.int/news-room/fact-sheets/detail/hiv-aids. [Last accessed on 19 Jul 2024].
Choi SO, Rezk NL, Kashuba AD. High-performance liquid chromatography assay for the determination of the HIV-protease inhibitor tipranavir in human plasma in combination with nine other antiretroviral medications. J Pharm Biomed Anal. 2007 Mar 12;43(4):1562-7. doi: 10.1016/j.jpba.2006.11.017, PMID 17236737.
Bhargavi D, Rao BB, Kiran G, Gouthami T, Bakshi V. Method development and validation for related impurities of efavirenz by RP-HPLC method. Anal Chem Lett. 2017 Sep 3;7(5):737-47. doi: 10.1080/22297928.2017.1366870.
Adegbola AJ, Ogboye RM, Soyinka JO, Bolaji OO. A simple high-performance liquid chromatographic assay for concurrent quantification of lumefantrine and efavirenz in human plasma from malaria HIV co-infected individuals. Futur J Pharm Sci. 2023 Jul 20;9(1):59. doi: 10.1186/s43094-023-00508-x.
Aymard G, Legrand M, Trichereau N, Diquet B. Determination of twelve antiretr viral agents in human plasma sample using reversed phase high performance liquid chromatography. J Chromatogr B Biomed Sci Appl. 2000 Jul;744(2):227-40. doi: 10.1016/s0378-4347(00)00225-5, PMID 10993510.
Rezk NL, Tidwell RR, Kashuba AD. Simple and rapid quantification of the non-nucleoside reverse transcriptase inhibitors nevirapine, delavirdine and efavirenz in human blood plasma using high-performance liquid chromatography with ultraviolet absorbance detection. J Chromatogr B Analyt Technol Biomed Life Sci. 2002 Jul;774(1):79-88. doi: 10.1016/s1570-0232(02)00210-6, PMID 12052725.
Avery LB, Parsons TL, Meyers DJ, Hubbard WC. A highly sensitive ultra-performance liquid chromatography tandem mass spectrometric (UPLC–MS/MS) technique for quantitation of protein-free and bound efavirenz (EFV) in human seminal and blood plasma. J Chromatogr B Analyt Technol Biomed Life Sci. 2010 Dec 1;878(31):3217-24. doi: 10.1016/j.jchromb.2010.09.011, PMID 21036679.
Tyagi I, Nagarajan K, Bhardwaj S. Analytical method development and validation of efavirenz by using RP-HPLC. Int J Pharm Investigation. 2024 Dec 5;15(1):159-69. doi: 10.5530/ijpi.20251789.
Srivastava P, Moorthy GS, Gross R, Barrett JS. A sensitive and selective liquid chromatography/tandem mass spectrometry method for quantitative analysis of efavirenz in human plasma. PLoS One. 2013 Jun 5;8(6):e63305. doi: 10.1371/journal.pone.0063305, PMID 23755102.
U.S. Food and Drug Administration. M10 bioanalytical method validation and study sample analysis; 2022. Available from: https://www.fda.gov/regulatory-information/search-fda-guidance-documents/m10-bioanalytical-method-validation-and-study-sample-analysis. [Last accessed on 28 Jun 2025].
U.S. Department of health and Human Services, food and drug administrtion, center for Drug Evaluation and research (CDER), center for Veterinary Medicine (CVM). Guidance for Industry: Bioanalytical Method Validation; 2018 May. Available from: https://www.fda.gov/downloads/drugs/guidances/ucm070107. [Last accessed on 28 Jun 2025].
Reddy S, Thomas L, Nayak N, Damatoti S, Mukhopadhyay A, Thangam S. Development and validation of liquid chromatography tandem mass spectrometry method for baloxavir estimation in human plasma. Asian J Pharm Res. 2025 Mar 3;15(1):13-21. doi: 10.52711/2231-5691.2025.00004.
Palnati N, Kotapati N, Vaidyanathan G. Liquid chromatography mass spectrometry/mass spectrometry method for the determination of lapatinib in rat plasma: application to pharmacokinetic studies in Wistar rats. Asian J Pharm Clin Res. 2021 Jan 7;14(2):74-7. doi: 10.22159/ajpcr.2021.v14i2.39660.