
Int J App Pharm, Vol 17, Issue 6, 2025, 512-525Original Article
DEVELOPMENT AND VALIDATION OF STABILITY-INDICATING RP-HPLC METHOD FOR SIMULTANEOUS DETERMINATION OF DORZOLAMIDE HYDROCHLORIDE AND TIMOLOL MALEATE IN OPHTHALMIC DOSAGE FORM
RAMAKRISHNA K.*, SRUJAN KUMAR M.
Institute of Pharmaceutical Sciences and Research, Bhagwant University, Sikar Road, Ajmer-305023, Rajasthan, India
*Corresponding author: Ramakrishna K.; *Email: krishna20.pharma@gmail.com
Received: 02 Jun 2025, Revised and Accepted: 30 Aug 2025
ABSTRACT
Objective: This new reverse phase high-performance liquid chromatography (RP-HPLC) method demonstrates superiority over the methods found in official monographs, as it is not included in the United States Pharmacopeia, British Pharmacopeia, or European Pharmacopeia (USP, B. P, Ph Eur). It effectively separates all impurities with excellent resolution from the main analyte, and the spectral purity of the main analyte was confirmed through peak purity analysis in specificity studies involving spiked sample solutions and degradation studies. According to the British Pharmacopeia, impurities B and D are associated with dorzolamide hydrochloride (DZH), while timolol maleate (TIM) includes Impurity G. The USP lists maleic acid and DZH-related compounds B and D for DZH, along with G, B, and D for TIM.
Methods: Chromatographic separation was carried out on a Symmetry C8 column using buffer pH 3.0, acetonitrile, and methanol (50:40:10 v/v/v) as mobile phase, at a flow rate of 1.2 ml/min, and a step gradient elution was used. DZH and TIM were detected at 253 nm and 295 nm, respectively, with retention times of 17.6 and 28.4 min.
Results: The method was found to be linear (r²>0.999) in the concentration ranges of 50-400 μg/ml for DZH and 12-100 μg/ml for TIM. It was validated for precision (both analytes %RSD = 0.3%), accuracy (recoveries 98.7-100.5%), specificity, and robustness. Forced degradation studies also showed the validity of the method with good resolution between the degradation products and the main peaks.
Conclusion: The developed RP-HPLC method is novel, simple, sensitive, precise, accurate, and robust for DZH and TIM in ophthalmic formulations as per the International Council for harmonisation (ICH) for stability studies to perform Quality control (QC) of bulk and finished dosage forms.
Keywords: COSOPT® PF (RLD), Dorzolamide hydrochloride (DZH), Timolol maleate (TIM), RP-HPLC, Stability-indicating method, Forced degradation, Ophthalmic solution, Method validation
© 2025 The Authors. Published by Innovare Academic Sciences Pvt Ltd. This is an open access article under the CC BY license (https://creativecommons.org/licenses/by/4.0/)
DOI: https://dx.doi.org/10.22159/ijap.2025v17i6.55359 Journal homepage: https://innovareacademics.in/journals/index.php/ijap
INTRODUCTION
Glaucoma represents a group of eye disorders characterized by progressive optic neuropathy and visual field loss, often associated with elevated intraocular pressure (IOP) [1]. Fixed-dose combination drug products for glaucoma therapy have demonstrated improved efficacy in lowering IOP compared to monotherapy regimens [2]. Dorzolamide hydrochloride (DZH) and timolol maleate (TIM) combination therapy is one such widely used treatment option.
DZH is a carbonic anhydrase inhibitor that decreases aqueous humor secretion, thereby reducing IOP [3]. Chemically, it is (4S,6S)-4-(ethylamino)-6-methyl-5,6-dihydro-4H-thieno[2,3-b]thiopyran-2-sulfonamide 7,7-dioxide hydrochloride. TIM is a non-selective beta-adrenergic receptor blocking agent that reduces the production of aqueous humor [4]. Chemically, it is (S)-1-(tert-butylamino)-3-[(4-morpholin-4-yl-1,2,5-thiadiazol-3-yl)oxy]propan-2-ol maleate.
The combination of these agents in ophthalmic solutions, such as COSOPT® PF (RLD) (preservative-free dorzolamide hydrochloride-timolol maleate ophthalmic solution 2% and 0.5%), provides a synergistic IOP-lowering effect [5]. Quality control (QC) of such pharmaceutical formulations requires accurate and reliable analytical methods for quantification of the active ingredients.
Several analytical methods like (ultraviolet) UV spectroscopy [6], RP-HPLC [7], and ultra-performance liquid chromatography (UPLC) [8] have been reported in the literature for the estimation of dorzolamide hydrochloride (DZH) and timolol maleate (TIM) either alone or in combination with other drugs. However, there is limited information available on stability-indicating analytical methods for the simultaneous estimation of DZH and TIM in ophthalmic formulations. Therefore, this study focuses on developing and validating a robust, specific, and sensitive RP-HPLC method for the simultaneous estimation of these active ingredients in their combined dosage form, along with identification using infrared spectroscopy.
The method is Capable of separating all possible degradants and related to process from main analytes and quantifying both analytes in a single method for bulk formulations, finished dosage forms, and even quantifying the reference listed drugs COSOPT® PF (RLD).
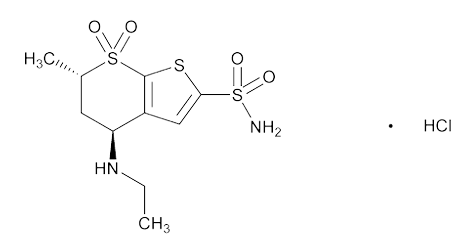
Dorzolamide HCL (DZH) structure from USP
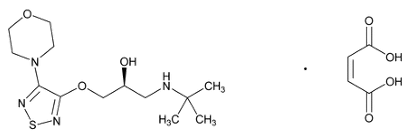
Timolol maleate (TIM) structure from USP
MATERIALS AND METHODS
Materials
Drug samples
DZH and TIM ophthalmic solution samples and placebos were received as gift samples from Biogenico Private Limited.
Name of reference list drug
COSOPT® PF (Preservative-free) (dorzolamide hydrochloride-timolol maleate ophthalmic solution 2% and 0.5%) Ophthalmic Solution. (20 mg of dorzolamide and 5 mg of timolol maleate).
Chemicals and solvents
All chemicals and solvents used were of analytical or HPLC grade. Acetonitrile (HPLC grade and AR grade), methanol (HPLC grade and AR grade), orthophosphoric acid (HPLC grade), sodium hydroxide (EMPARTA ACS grade), and HPLC-grade water were procured from S. D. Fine Chemicals Ltd., India; Qualigens Fine Chemicals Ltd., Mumbai, India; Merck Specialities Private Limited, Mumbai; and Ranbaxy Chemicals Ltd., New Delhi, India.
Instruments
Various analytical instruments were used in this study, including a Sartorius MSA6.6S-000DM analytical balance, a Lab India® Thermoscientific Orians tar H211 pH meter, a Life care equipment Pvt ltd fast clean ultra-sonic cleaning system, and a Value 1 stage vacuum pump. For spectroscopic analysis, a Shimadzu model affinity-1 Fourier Transform Infrared spectroscopy (FTIR) Spectrometer and a Shimadzu UV-1800 UV-Visible Spectrophotometer were used. Chromatographic analyses were performed using two HPLC systems: a Waters alliance e 2695 equipped with 2488 UV and Photodiode Array (PDA) Detectors running empower 3 software, and a Shimadzu (Japan) liquid chromatography system featuring an LC–20 AD pump, LC-20A UV/Vis detector, and rheodyne 7725 injection with 100 µl** loop, operated using LC solutions software.
Spectroscopic identification of DZH and TIM
FTIR analysis
The identification of DZH and TIM was performed using FTIR Spectrophotometer (Shimadzu model Affinity-1) with ATR technique. The instrument was configured to operate in % transmittance intensity mode with Happ-General apodization, scanning across a wavenumber range of 650-4000 cm⁻¹. The analysis parameters included 16 scans per sample at a resolution of 4 cm⁻¹. For analysis, approximately 2 mg of each standard (USP) and sample was individually placed under the pressure knob, and their respective spectra were recorded [9]. The identity of the compounds was confirmed by comparing the spectral patterns of the standards with the corresponding samples [10, 11].
Fig. 1: FT-IR stretching frequency data for dorzolamide hydrochloride (DZH)
| S. No. | Standard (USP) | Sample |
| 1 | 3369.65 | 3367.72 |
| 2 | 3045.60 | 3045.60 |
| 3 | 2451.53 | 2451.53 |
| 4 | 2285.65 | 2337.73 |
| 5 | 2007.90 | 2073.48 |
| 6 | 1587.42 | 1587.42 |
| 7 | 1535.34 | 1535.34 |
| 8 | 1446.62 | 1446.62 |
| 9 | 1384.89 | 1384.89 |
| 10 | 1321.24 | 1321.24 |
Table 2: FT-IR stretching frequency data for timolol maleate (TIM)
| S. No. | Standard (USP) | Sample |
| 1 | 2964.59 | 2964.59 |
| 2 | 2889.37 | 2889.37 |
| 3 | 2852.72 | 2852.72 |
| 4 | 1703.15 | 1705.08 |
| 5 | 1618.28 | 1618.28 |
| 6 | 1585.49 | 1583.56 |
| 7 | 1406.11 | 1406.11 |
| 8 | 1379.11 | 1379.11 |
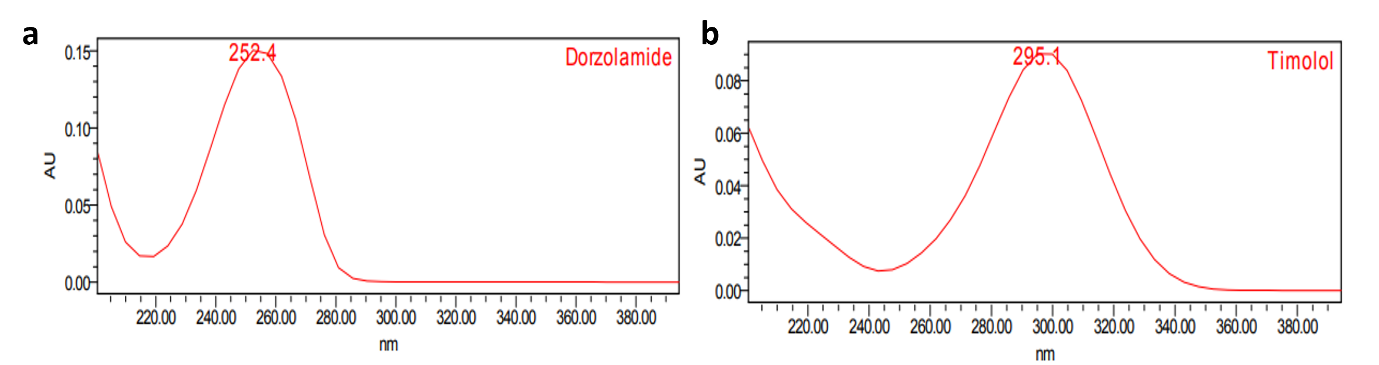
Fig. 1: UV spectra of a. dorzolamide hydrochloride (DZH) and b. timolol maleate (TIM) standards
Method development for RP-HPLC
Selection of wavelength
Based on the UV absorption characteristics, 253 nm was selected as the detection wavelength for dorzolamide hydrochloride (DZH) and 295 nm for timolol maleate (TIM) [12].
Chromatographic conditions
The chromatographic conditions were optimized through multiple experimental trials for efficient separation of DZH and TIM. The final method utilized a Waters Symmetry C8 column (250×4.6 mm, 5 μm) as the stationary phase. The mobile phase consisted of a ternary mixture of buffer pH 3.0 (0.2% orthophosphoric acid adjusted with 5N sodium hydroxide solution), acetonitrile, and methanol in a ratio of 50:40:10% v/v/v. Detection was performed at dual wavelengths: 253 nm for DZH and 295 nm for TIM. The method parameters included a flow rate of 1.2 ml/min, operating pressure of 92 kgf, and column temperature maintained at 37 °C. Sample analysis was conducted using a 10 μl injection volume with a gradient elution mode and a total run time of 55 min [13, 14].
Table 3: Gradient program for HPLC method
| Time (min) | Mobile phase-A (%) | Mobile phase-B (%) |
| 0 | 98 | 2 |
| 18 | 98 | 2 |
| 25 | 50 | 50 |
| 45 | 5 | 95 |
| 46 | 98 | 2 |
| 55 | 98 | 2 |
Where, mins; minutes, % of means: Ratio of mobile phase form-A and B
Preparation of solutions
Diluent preparation
Buffer of pH 3.0 was mixed with acetonitrile in the ratio 95:5 % (v/v), respectively and sonicated to degas for about 5 min.
Standard solution preparation
Standard solutions of DZH and TIM were prepared by accurately weighing and transferring appropriate amounts to volumetric flasks [15] and diluting with diluent to obtain concentrations of approximately 200 μg/ml for DZH and 50 μg/ml for TIM.
Sample solution preparation
About 1.0 g of DZH and TIM ophthalmic solution was accurately weighed and transferred to a 100 ml volumetric flask, diluted to volume with diluent, and mixed well to obtain concentrations of approximately 200 μg/ml for DZH and 50 μg/ml for TIM.
Method validation
The developed method was validated according to ICH guidelines for specificity, linearity, precision, accuracy, solution stability, and robustness [16, 17].
System suitability
System suitability parameters such as retention time, number of theoretical plates (N), tailing factor, and % RSD of peak areas from five replicate injections of standard solutions were evaluated [18].
Specificity
The specificity of the method was established by analyzing blank, standard, placebo, control sample, and spiked sample solutions. Individual impurity stocks were prepared, and impurities were spiked at 1% level of targeted test concentration. Peak purity was assessed using the PDA detector [19].
Linearity and range
Linearity was evaluated by analyzing standard solutions at concentration levels ranging from 50-400 μg/ml for DZH and 12-100 μg/ml for timolol maleate. Calibration curves were plotted with concentration versus peak area, and the correlation coefficient, slope, and y-intercept were calculated [20].
Precision
Method precision was established by analyzing six replicate sample preparations. The % RSD of assay results was calculated [21].
Accuracy
Recovery studies were performed by spiking known quantities of standard drugs at 50%, 100%, and 150% levels of the target concentration. Each level was analyzed in triplicate, and the percentage recovery was calculated [22].
Solution stability
The stability of standard and sample solutions was evaluated at room temperature and under refrigerated conditions for 24 h [23].
Forced degradation studies
Forced degradation studies were conducted under acid hydrolysis (0.5N HCl at 60 °C), base hydrolysis (0.5N NaOH at 60 °C), and oxidative (3% H₂O₂ at 60 °C) conditions at different time intervals (30 min, 1 hour, and 2 h). The percentage assay and formation of degradation products were monitored [24].
Robustness
The robustness of the method was assessed by deliberately varying the chromatographic conditions such as flow rate (±0.2 ml/min), pH of the buffer (±0.2 units), column temperature (±5 °C), and composition of the mobile phase (±5%) [25].
RESULTS AND DISCUSSION
Identification of dorzolamide hydrochloride (DZH) and timolol maleate (TIM)
FTIR spectroscopy
The FTIR spectra of DZH standard (USP) and sample of active pharmaceutical ingredient (api) showed characteristic peaks at 3369.65/3367.72, 3045.60, 2451.53, 2285.65/2337.73, 2007.90/2073.48, 1587.42, 1535.34, 1446.62, 1384.89, and 1321.24 cm⁻¹, confirming the identity of DZH.
Similarly, the FTIR spectra of TIM standard (USP) and sample of api showed characteristic peaks at 2964.59, 2889.37, 2852.72, 1703.15/1705.08, 1618.28, 1585.49/1583.56, 1406.11, and 1379.11 cm⁻¹, confirming the identity of TIM.
The overlay spectra of standards and samples for both drugs showed good correlation, indicating the authenticity of the drug samples used in the study [26]. The discrepancy was observed in DZM at FTIR Stretching frequency at 2285.65 vs. 2337.73 cm⁻¹ in both USP standard and Sample due to sample matrix and has no impact the quality of product.
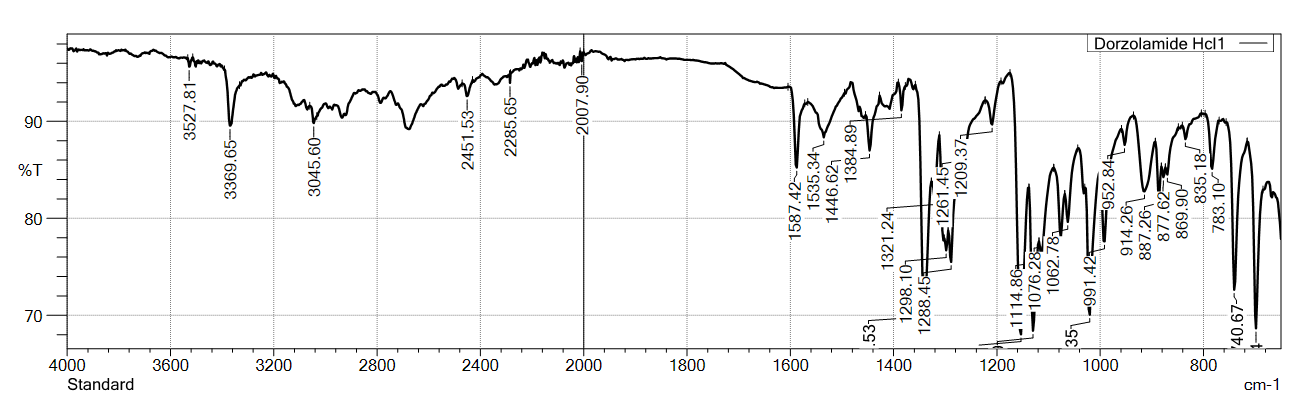
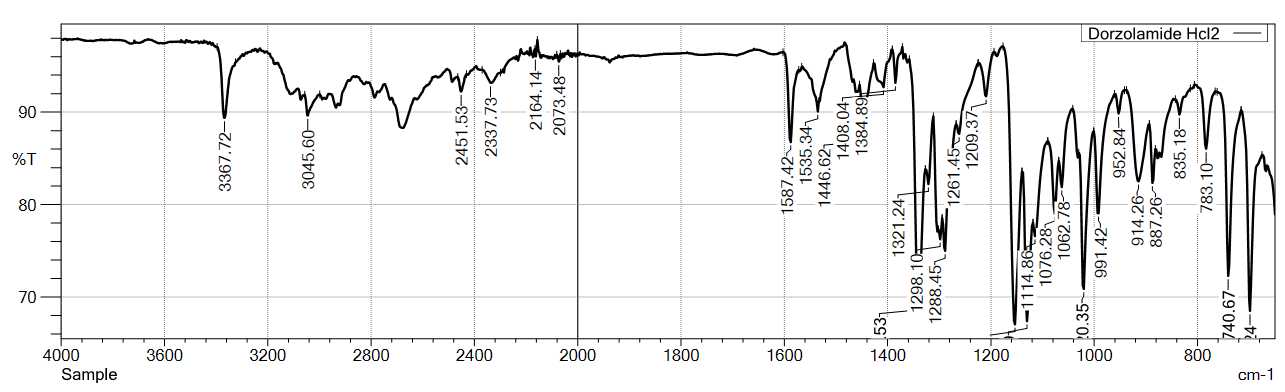
Fig. 2: FTIR-spectra of standard (USP) VS sample for dorzolamide hydrochloride (DZH)
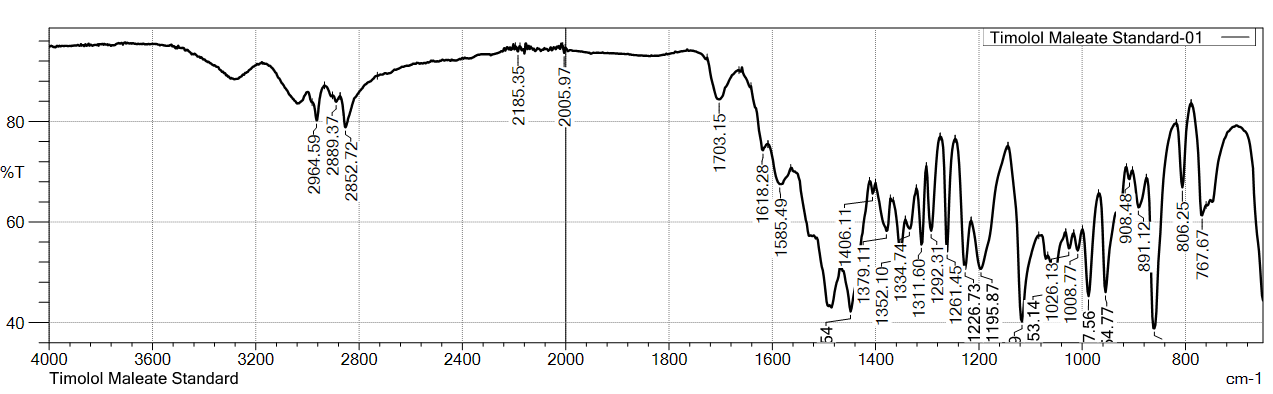
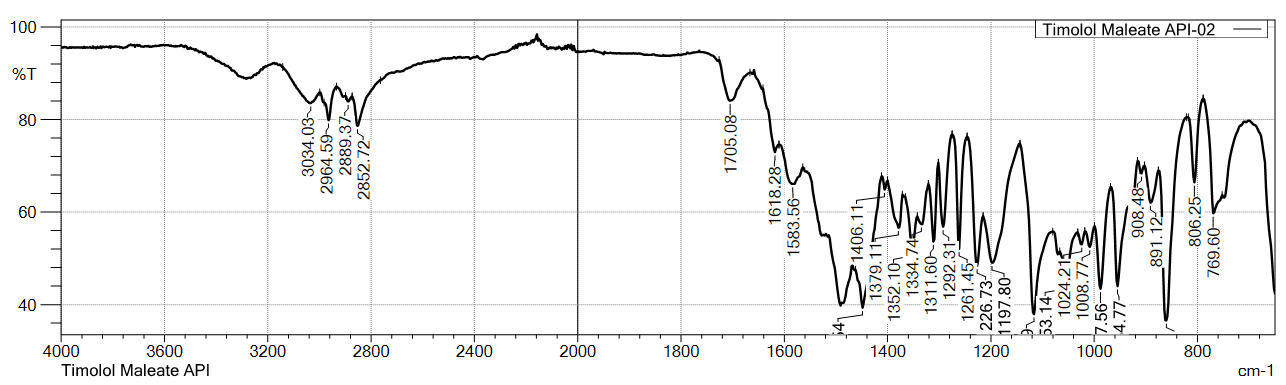
Fig. 3: FTIR-spectra of standard (USP) VS sample for timolol maleate (TIM)
Method development
The method development process involved a systematic approach to achieve optimal separation of DZH and TIM. Various mobile phase compositions, flow rates, column temperatures, and pH conditions were evaluated. The selection of appropriate wavelengths (253 nm for DZM and 295 nm for TIM) was based on the UV absorption maxima of the compounds.
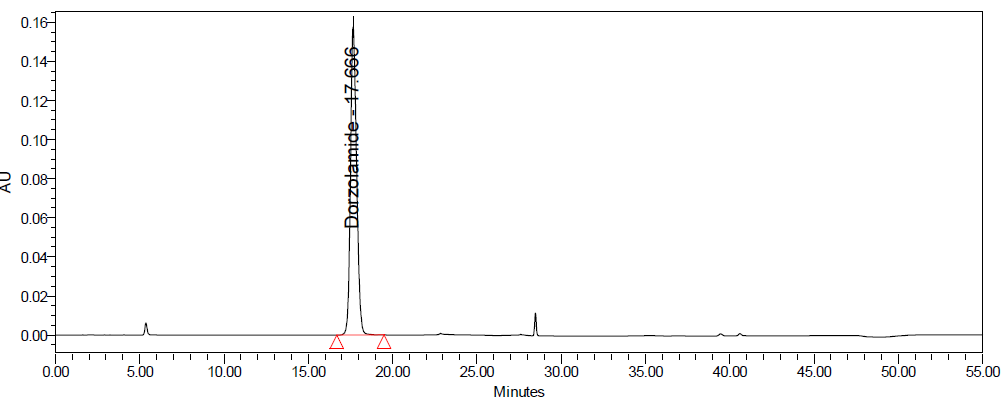
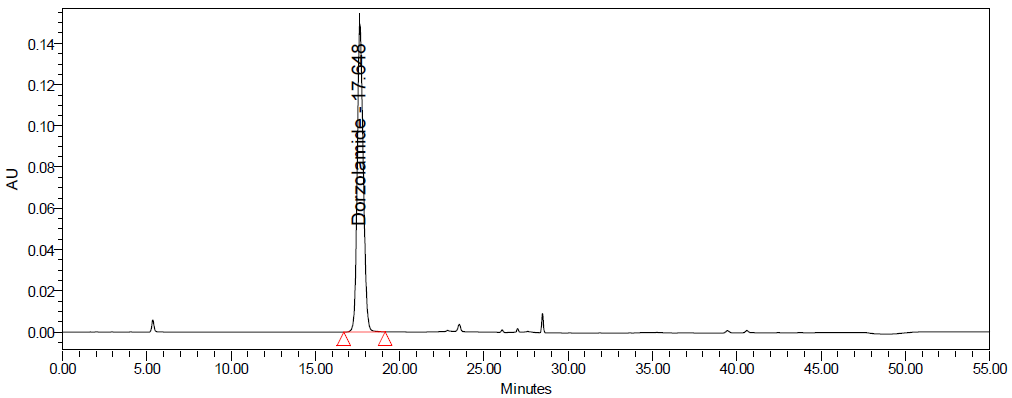
Initial trials showed that a mobile phase composed of buffer pH 3.0, acetonitrile, and methanol (50:40:10% v/v/v) with gradient elution on a Symmetry C8 column provided good symmetric peaks with adequate resolution. The optimized method resulted in retention times of 17.6 min for DZH and 28.4 min for TIM.
Method validation
System suitability
The system suitability parameters met the acceptance criteria, indicating the suitability of the chromatographic system for analysis. The tailing factors for DZH and TIM were 1.2 and 1.1, respectively, which are well within the acceptance limit of NMT 2.0. The theoretical plate counts were 5543 for DZH and 7850 for TIM, exceeding the minimum requirement of 2,000. The % RSD values for peak areas from five replicate injections were 0.3% for both compounds, indicating good precision of the injection system [27].
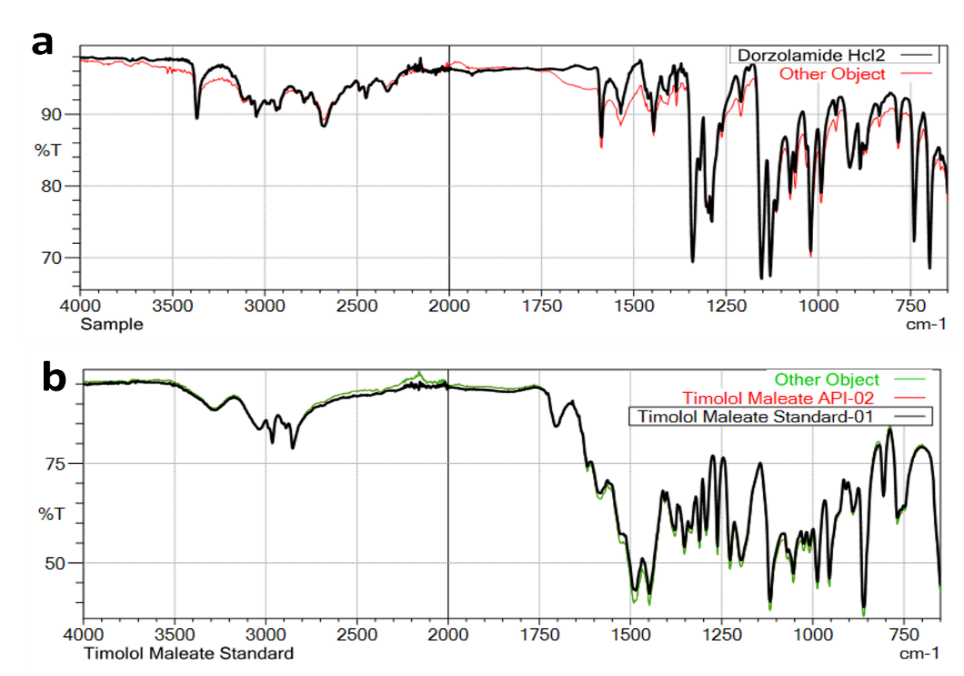
Fig. 4: Overlay FTIR-spectra comparison of standard vs sample for a. dorzolamide hydrochloride (DZH) and b. timolol maleate (TIM)
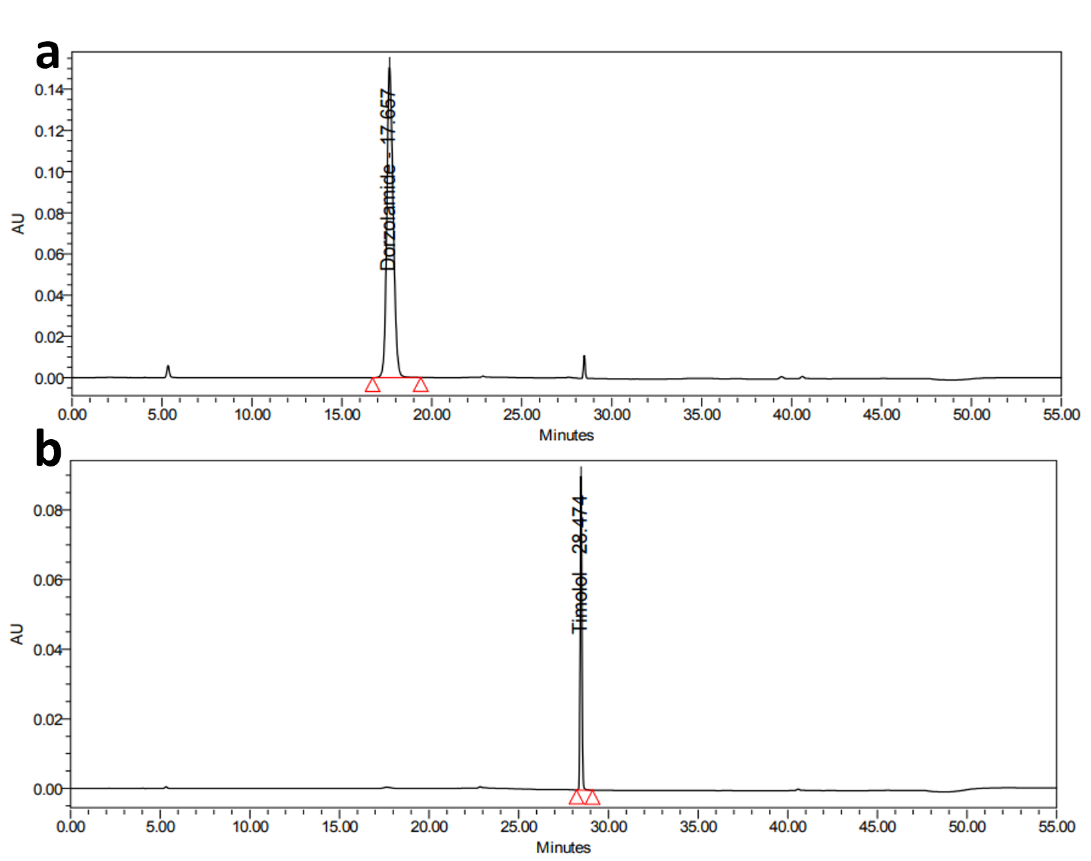
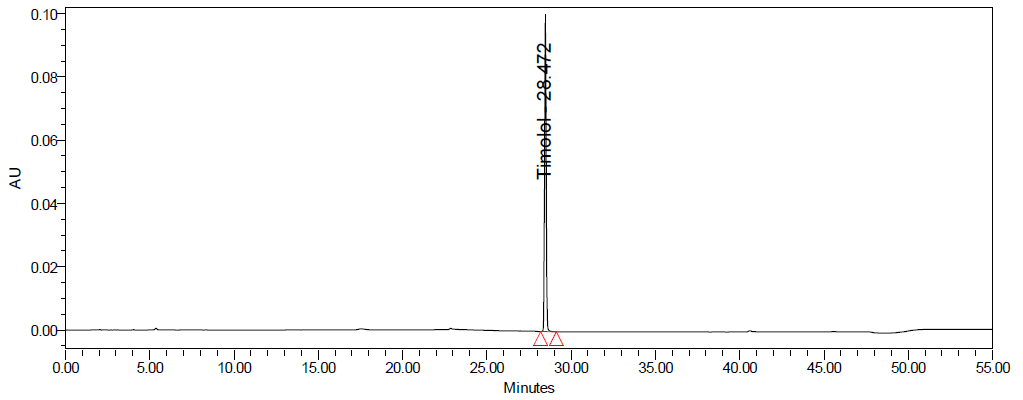
Fig. 5: Representative chromatograms of a. dorzolamide hydrochloride (DZH) at 253 nm and b. timolol maleate (TIM) at 295 nm
Table 4: System suitability parameters for dorzolamide hydrochloride (DZH) and timolol maleate (TIM)
| S. No. | System suitability parameter | Acceptance criteria | Dorzolamide | Timolol maleate |
| 1 | For Interference check | No interference should be observed | No interference | No interference |
| 2 | The USP Tailing factor | NMT 2.0 | 1.2 | 1.1 |
| 3 | The USP plate count | NLT 2000 | 5543 | 7850 |
| 4 | The %RSD of peak | NMT 2.0 | 0.3 | 0.3 |
| 5 | % Recovery of Standard solution against check standard | 98-102% | 99.9 | 100.0 |
| 6 | % RSD of peak area standard against standard preparation | NMT 2.0 | 0.3 | 0.3 |
| 7 | Bracketing standard | NMT 2.0% | 0.2 | 0.2 |
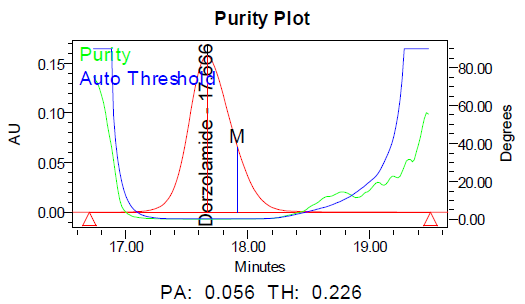
Specificity
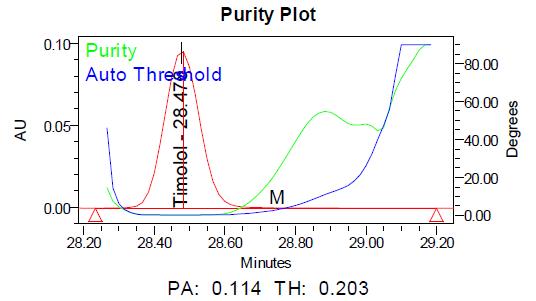
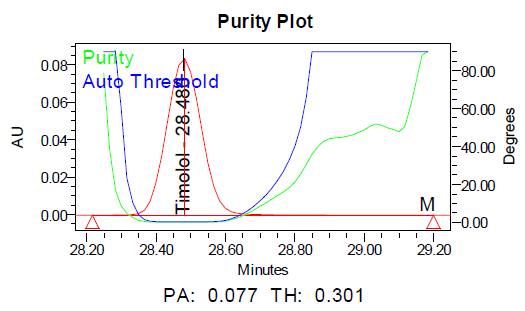
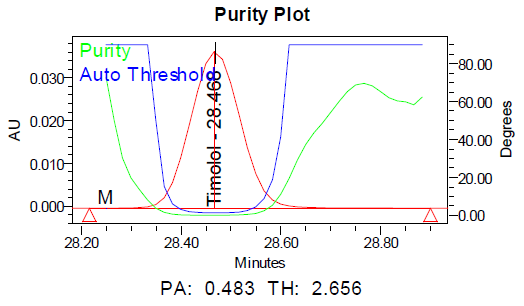
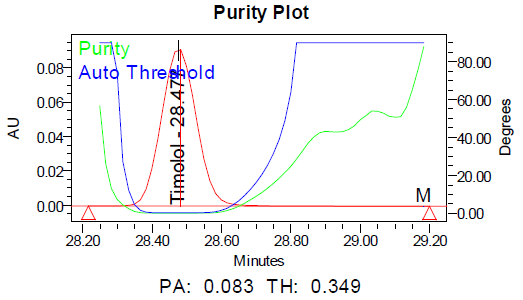
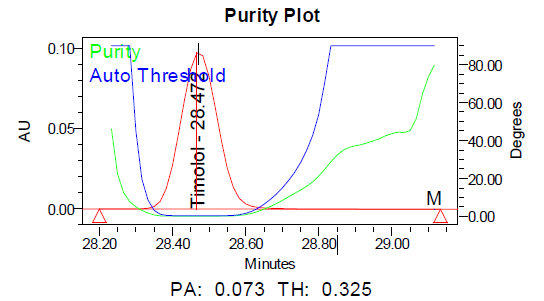
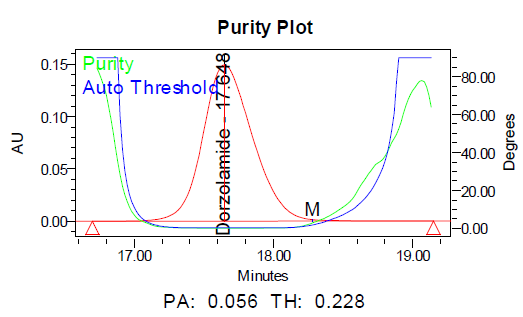
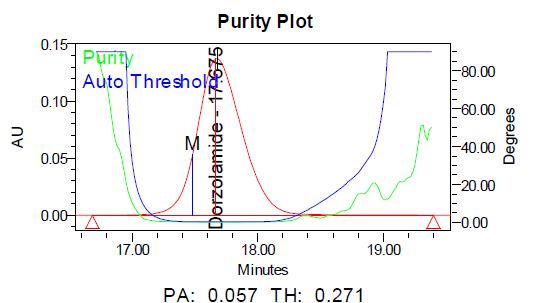
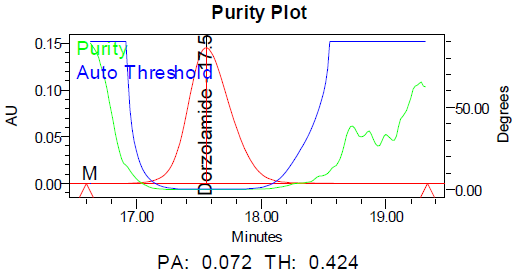
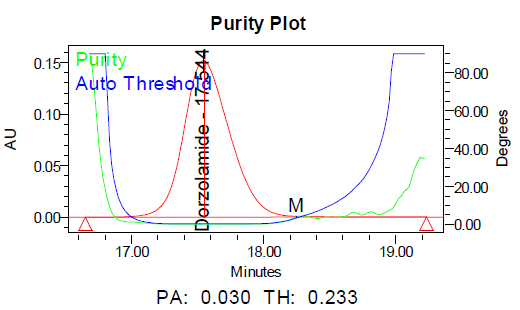
The specificity of the method was demonstrated by the absence of interference from placebo components, degradation products, and impurities at the retention times of dorzolamide hydrochloride (DZH) and timolol maleate (TIM). Peak purity analysis using the PDA detector showed purity angles less than purity thresholds for both compounds in standard solutions, control samples, and spiked samples, confirming the specificity of the method.
The retention times for DZH and its related impurities (DZH RC-D, DZH RC-B (In-house-C), Maleic Acid Adducts-A, Maleic Acid Adducts-B, and DZH In-house-B) were well separated from the main peak. Similarly, timolol maleate (TIM) and its related impurities (TIM Imp-G, TIM Imp-B, TIM Imp-D, TIM Imp-F, TIM Imp-C, TIM imp-J, TIM Imp-H, and TIM Imp-I) showed adequate separation.
Linearity and range
The calibration curves for DZH and timolol maleate TIM showed excellent linearity in the concentration ranges of 50-200 μg/ml and 12-100 μg/ml, respectively. The correlation coefficients (r²) were 0.9999 for both compounds, indicating a strong linear relationship between concentration and peak area. The slopes and intercepts of the calibration curves were 13,160.89275 and 10,101.18953 for TIM, and 19,859.50102 and 48,164.58577 for DZH, respectively. (The Linearity was performed as per the specification limits is related to specification limits for both components i.e.) 2.0% of DZH is 20 mg/ml and 0.5% of TIM is 5 mg/ml).
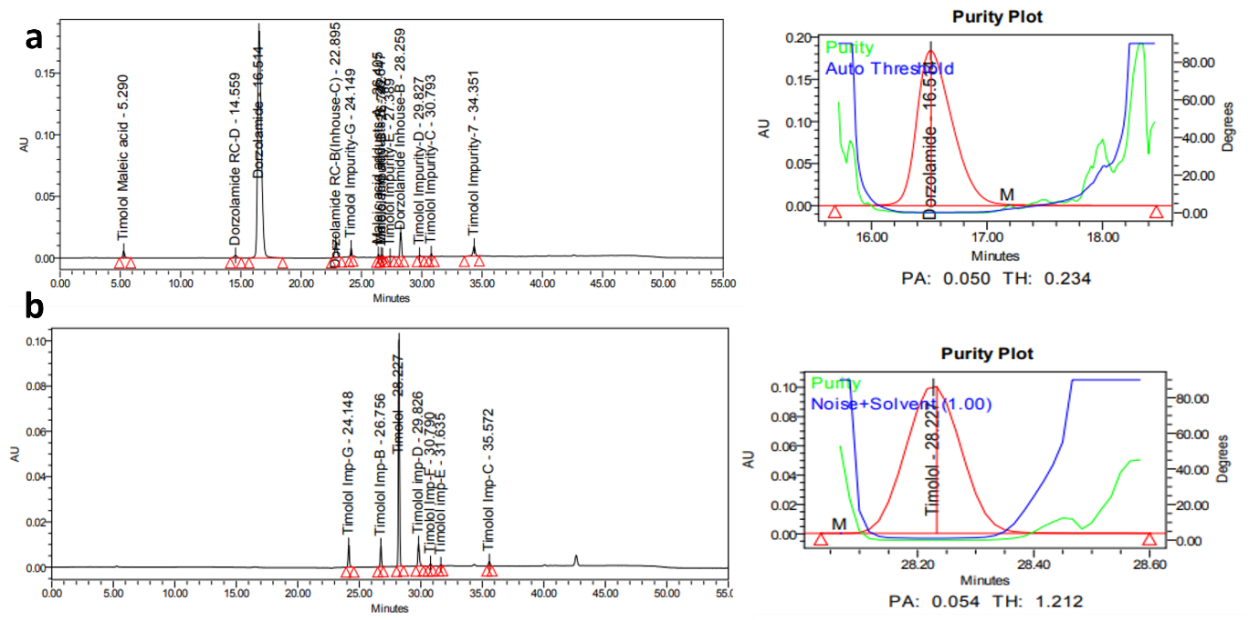
Fig. 6: Specimen chromatogram for purity plot of spiked sample of a. dorzolamide hydrochloride (DZH) and b. timolol maleate (TIM)
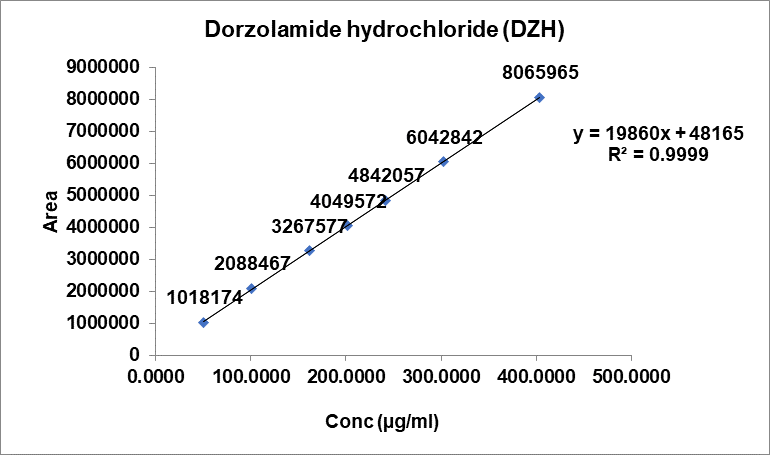
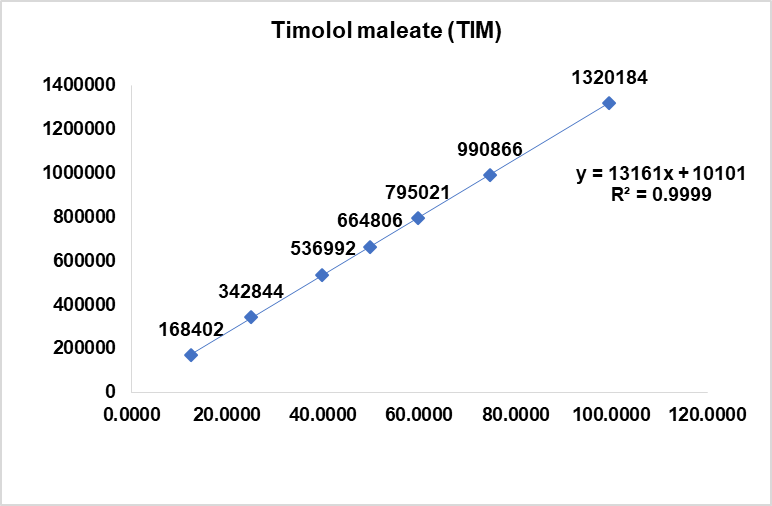
Fig. 7: Linearity plot of dorzolamide hydrochloride (DZH) and timolol maleate (TIM)
Limit of detection (LOD) and limit of quantification (LOQ)
The LOD is calculated using the formula 3.3 times σ/s, where “σ” is the standard deviation of the intercept obtained for calibration curve and “s” is the slope of the calibration curve. Similarly, LOQ is calculated using the formula 10 times σ/s. The calculated LOD and LOQ is for DZH is 5.3 µg/ml and 16.2µg/ml and for TIM is 1.6 µg/ml and 4.9µg/ml, which is 0.5% of DZH and 0.1% for TIM for specification level.
Precision
The method precision was evaluated by analyzing six replicate sample preparations. The % RSD values for the assay results were 0.001% for both DZH and TIM, which are well below the acceptance criterion of NMT 2.0%, indicating the precision of the method [28].
Accuracy
The accuracy of the method was assessed through recovery studies at three concentration levels (50%, 100%, and 150% of the target concentration). The mean recoveries for dorzolamide hydrochloride (DZH) were 99.2%, 99.2%, and 98.7% at the 50%, 100%, and 150% levels, respectively, with overall %RSD values ranging from 0.1% to 0.2%. For timolol maleate, the mean recoveries were 100.5%, 99.0%, and 99.1% at the 50%, 100%, and 150% levels, respectively, with overall %RSD values ranging from 0.1% to 0.3%. These results demonstrate the accuracy of the method within the specified range [29]. We acknowledge the observation of slightly low recovery for dorzolamide (DZH) at the 100% accuracy level. Upon further investigation, we considered potential contributing factors such as matrix effects, which is having the acceptable limit is 98.0 to 102.0 and the samples shows precise in replicate injections in table 7.
Table 6: Method precision results
| Name of the preparation | Dorzolamide area | Timolol maleate area | Dorzolamide (% assay) | Timolol maleate (% assay) |
| Sample Preparation-1 | 3690022 | 630064 | 101.7 | 99.3 |
| Sample Preparation-2 | 3679044 | 627620 | 101.4 | 99.0 |
| Sample Preparation-3 | 3678772 | 627927 | 101.4 | 99.0 |
| Sample Preparation-4 | 3683306 | 628801 | 101.5 | 99.2 |
| Sample Preparation-5 | 3672121 | 627186 | 101.2 | 98.9 |
| Sample Preparation-6 | 3677702 | 628052 | 101.3 | 99.0 |
| AVG | 101.4 | 99.1 | ||
| SD | 0.1722 | 0.1506 | ||
| %RSD | 0.2 | 0.2 |
Where, AVG; average, SD; standard deviation, RSD; Related standard deviation, All the values are presented as mean±SD, n=6
Table 7: Accuracy (Recovery) results for dorzolamide hydrochloride (DZH)
| % Recovery for dorzolamide | |||||||
| Recovery level | Sample no | Amount added (µg/ml) | Amount found (µg/ml) | % Recovery | Average mean | SD | %RSD |
| 50% | 1 | 101.15 | 100.32 | 99.2 | 99.2 | 0.1 | 0.1 |
| 2 | 101.12 | 100.25 | 99.1 | ||||
| 3 | 101.23 | 100.57 | 99.3 | ||||
| 100% | 1 | 200.65 | 198.83 | 99.1 | 99.2 | 0.2 | 0.2 |
| 2 | 200.56 | 199.52 | 99.5 | ||||
| 3 | 200.38 | 198.79 | 99.2 | ||||
| 4 | 200.47 | 198.50 | 98.9 | ||||
| 5 | 200.38 | 198.27 | 98.9 | ||||
| 6 | 200.56 | 198.93 | 99.3 | ||||
| 150% | 1 | 310.15 | 306.47 | 98.8 | 98.7 | 0.2 | 0.2 |
| 2 | 310.24 | 306.16 | 98.7 | ||||
| 3 | 310.42 | 305.84 | 98.5 | ||||
Where, AVG; average, SD; standard deviation, RSD; Related standard deviation, All the values are presented as mean±SD, n=3 and 6
Table 8: % Accuracy (recovery) results for timolol maleate (TIM)
| % Recovery for timolol maleate | |||||||
| Recovery level | Sample no (n) | Amount added (µg/ml) | Amount found (µg/ml) | % Recovery | Average mean | SD | %RSD |
| 50% | 1 | 25.25 | 25.41 | 100.6 | 100.5 | 0.3 | 0.3 |
| 2 | 25.25 | 25.31 | 100.2 | ||||
| 3 | 25.25 | 25.45 | 100.8 | ||||
| 100% | 1 | 50.50 | 49.97 | 98.95 | 99.0 | 0.3 | 0.3 |
| 2 | 50.50 | 50.15 | 99.31 | ||||
| 3 | 50.50 | 50.02 | 99.05 | ||||
| 4 | 50.50 | 50.04 | 99.09 | ||||
| 5 | 50.50 | 49.73 | 98.48 | ||||
| 6 | 50.50 | 49.94 | 98.89 | ||||
| 150% | 1 | 75.75 | 75.18 | 99.25 | 99.1 | 0.1 | 0.1 |
| 2 | 75.75 | 75.06 | 99.09 | ||||
| 3 | 75.75 | 75.07 | 99.10 | ||||
Where, AVG; average, SD; standard deviation, RSD; Related standard deviation, All the values are presented as mean±SD, n= 3 and 6
Solution stability
The stability of standard and sample solutions was evaluated at room temperature and under refrigerated conditions for 24 h. The % difference in peak areas between initial and 24 h measurements was less than 1% for both compounds under both storage conditions, indicating that the solutions are stable for at least 24 h.
Table 9: Solution stability data for check standard vs calibration standard
| Solution stability for dorzolamide check standard | ||||
| Condition | Standard at room temperature | Standard at Refrigerator | ||
| Area | % Difference | Area % recovery | % Difference | |
| Initial | 4241158 | NA | 4241158 | NA |
| 24Hrs | 4243218 | -0.05 | 4227893 | 0.31 |
| Solution stability for calibration standard | ||||
| Initial | 3956116 | NA | 3956116 | NA |
| 24Hrs | 3959482 | -0.09 | 3926178 | 0.76 |
| Solution stability for timolol check standard | ||||
| Initial | 694375 | NA | 694375 | NA |
| 24Hrs | 695149 | -0.11 | 692017 | 0.34 |
| Solution stability for timolol calibration standard | ||||
| Initial | 674038 | NA | 674038 | NA |
| 24 H | 677773 | -0.55 | 671713 | 0.34 |
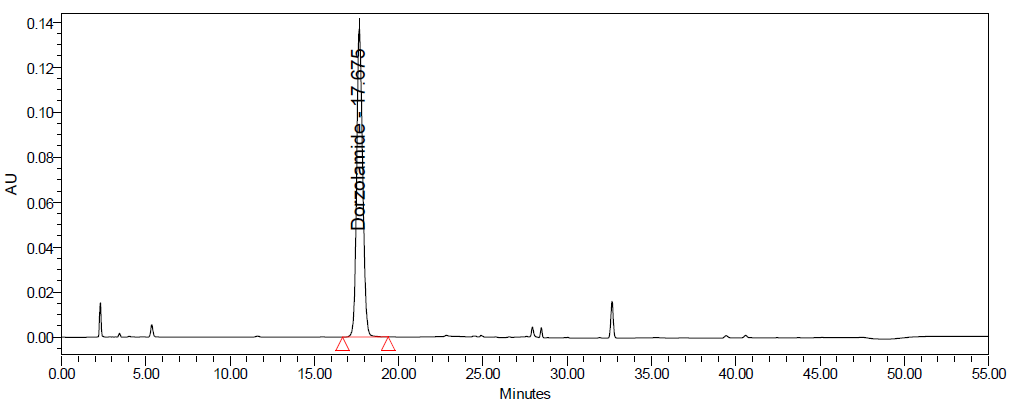
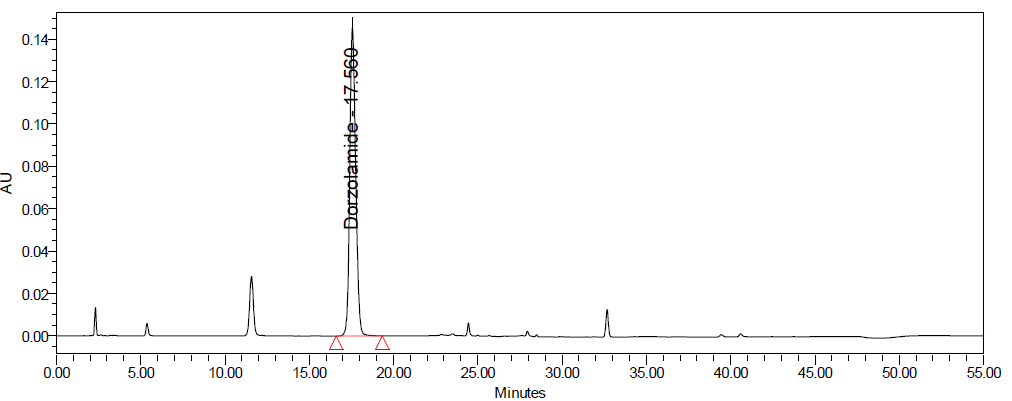
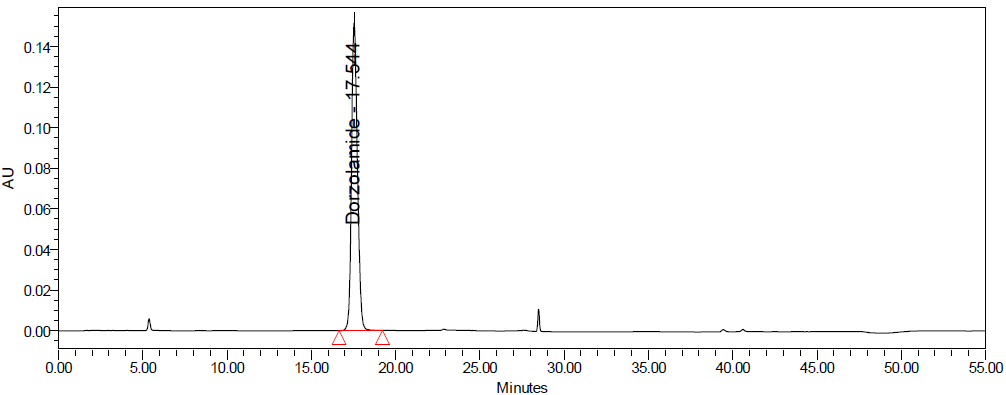
Forced degradation studies
Forced degradation studies were conducted to evaluate the stability-indicating nature of the method. DZH showed minimal degradation under acid hydrolysis (approximately 1-3% degradation) and moderate degradation under basic and oxidative conditions (approximately 2-8% degradation). TIM was more susceptible to degradation, particularly under basic and oxidative conditions, with degradation ranging from approximately 10% to 92% depending on the stress conditions and duration.
The chromatographic method was capable of resolving the degradation products from the main peaks, confirming its stability-indicating nature. Peak purity analysis showed that the peaks of interest remained pure even in the presence of degradation products [30].
A B
C D
E
Fig. 8: Degradation chromatograms of timolol maleate (TIM) at @ 293 nm A Acid, B Base, C Peroxide, D Thermal, E Photolytic
Table 10: Forced degradation study results
S. No. |
Degradation mechanism/Condition |
% Assay dorzolamide |
% Assay timolol maleate |
| 1 | Control Sample | 101.7 | 99.3 |
| 2 | Acid_60 °C_0.5N HCl _2H | 103.2 | 100.6 |
| 3 | Base_60 °C_0.5N NaOH_2H | 99.3 | 83.0 |
| 4 | Peroxide_60 °C_0.5N HCl_2H | 93.2 | 40.0 |
| 5 | Acid_60 °C_0.5N HCl _1H | 101.3 | 98.9 |
| 6 | Base_60 °C_0.5N NaOH_1H | 103. | 90.1 |
| 7 | Peroxide_60 °C_3% H2O2_1H | 97.1 | 65.0 |
| 8 | Acid_60 °C_0.5N HCl _30 min | 101.4 | 97.1 |
| 9 | Base_60 °C_0.5N NaOH_30 min | 95.3 | 7.7 |
| 10 | Peroxide_60 °C_0.5N HCl_30 min | 99.9 | 82.0 |
| 11 | Base_2 ml spl_60 °C_0.5N precisionNaOH_30 min | 100.6 | 82.5 |
| 12 | Thermal sample 60 °C_10 d | 97.5 | 96.8 |
| 13 | Humidity_75% RH _10 d | 97.6 | 97.1 |
| 14 | Photolytic UV_10 d | 97.5 | 97.0 |
Where, H; hours, min; minutes
a b
c d
e
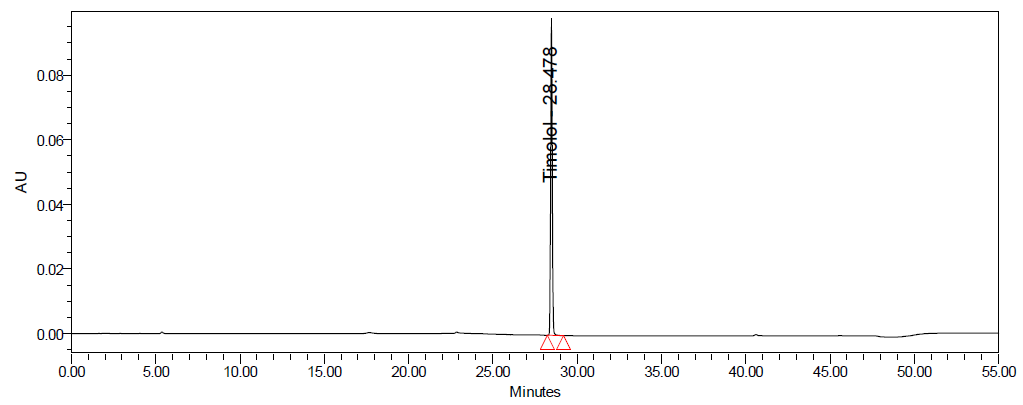
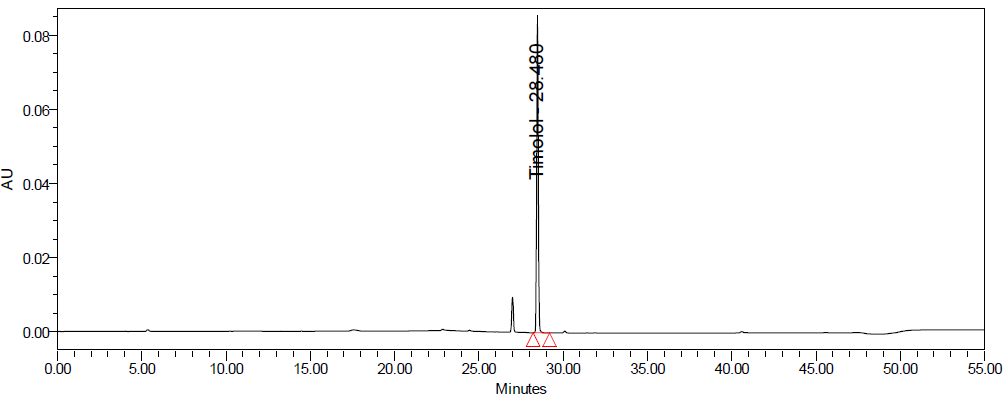
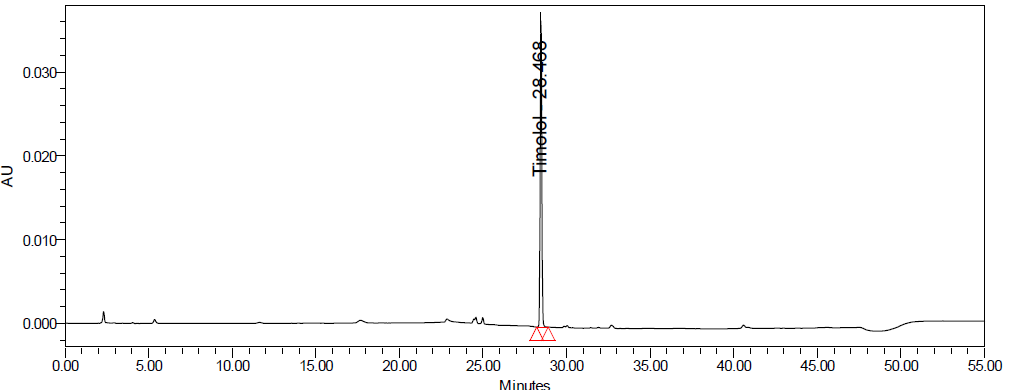
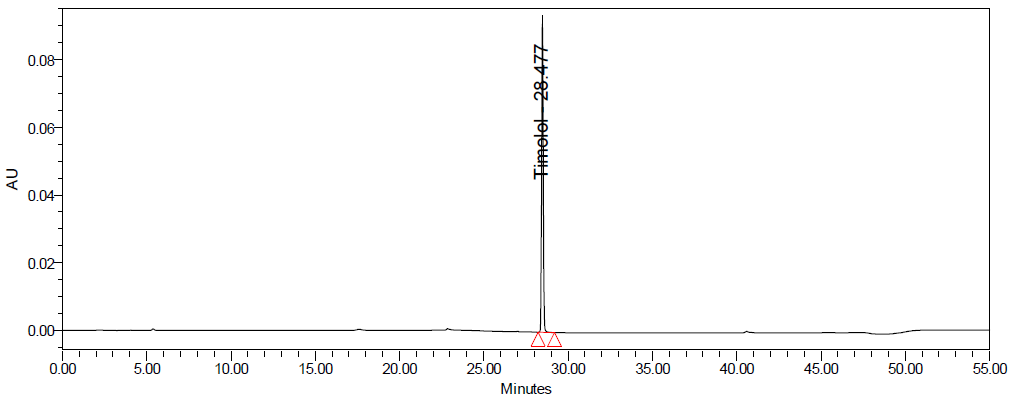
Fig. 9: Purity plots of timolol maleate (TIM) at @ 295 nm a Acid, b Base, c Peroxide, d Thermal, e Photolytic
A B
C D
E
Fig. 10: Degradation chromatograms of dorzolamide hydrochloride (DZH) at @ 253 nm A Acid, B Base, C Peroxide, D Thermal, E Photolytic
Table 11: Robustness data for critical parameters
| Parameters | Retention time (min) | |
| Mobile phase composition | Dorzolamide (DZH) | Timolol maleate (TIM) |
| 85:15%v/v | 16.3 | 27.7 |
| 95:5%v/v | 16.9 | 28.9 |
| pH of buffer | ||
| pH2.8 | 16.2 | 28.2 |
| pH3.2 | 17.3 | 28.4 |
| Flow Rate Variation | ||
| 1.0 ml/min | 20.0 | 29.3 |
| 1.4 ml/min | 15.2 | 27.7 |
| Column Temperature Variation | ||
| 32 °C | 17.6 | 27.8 |
| 42 °C | 13.2 | 27.5 |
Robustness
The robustness of the method was assessed by deliberately varying the chromatographic conditions. Small changes in flow rate (±0.2 ml/min), pH of the buffer (±0.2 units), column temperature (±5 °C), and composition of the mobile phase (±5%) did not significantly affect the system suitability parameters such as retention time, tailing factor, and theoretical plate count. This demonstrates the robustness of the method within the studied range of variations.
The most significant changes were observed with variations in flow rate and column temperature and mobile phase pH, which affected the retention times of both compounds. However, the method remained suitable for analysis as the system suitability criteria were still met.
a b
c d
e
Fig. 11: Purity plots of dorzolamide hydrochloride (DZH) at @ 253 nm a Acid, b Base, c Peroxide, d Thermal, e Photolytic
Table 12: Robustness data for DZH As such method
| Name | Area | RT | USP Tailing | USP plate count |
| Average of Six Standards | 4018132 | 17.406 | 1.3 | 10709 |
| Control sample | 3863672 | 17.308 | 1.2 | 12611 |
| BKT Standard | 3996407 | 17.313 | 1.3 | 12602 |
Table 13: Robustness data for DZH low flow method_1.0 ml
| Name | Area | RT | USP tailing | USP plate count |
| Average of Six Standards | 4832292 | 20.037 | 1.3 | 9332 |
| Control sample | 4668216 | 19.984 | 1.2 | 7681 |
| BKT Standard | 4816460 | 18.437 | 1.3 | 8758 |
Table 14: Robustness data for DZH high flow method_1.4 ml
| Name | Area | RT | USP Tailing | USP Plate count |
| Average of Six Standards | 3434829 | 15.243 | 1.5 | 5792 |
| Control sample | 3333998 | 15.228 | 1.6 | 6100 |
| BKT Standard | 3441024 | 15.277 | 1.6 | 6383 |
Table 15: Robustness data for DZH low temperature method_32 °C
| Name | Area | RT | USP Tailing | USP Plate count |
| Average of Six Standards | 3450509 | 17.655 | 1.8 | 5616 |
| Control sample | 3339747 | 17.640 | 1.8 | 5656 |
| BKT Standard | 1709857 | 17.730 | 1.7 | 6044 |
Table 16: Robustness data for DZH high temperature method_42 °C
| Name | Area | RT | USP Tailing | USP Plate count |
| Average of Six Standards | 3462632 | 13.241 | 1.7 | 5592 |
| Control sample | 3338902 | 13.213 | 1.7 | 5433 |
| BKT Standard | 3463786 | 13.169 | 1.8 | 5325 |
Table 17: Robustness data for DZH low pH-2.8
| Name | Area | RT | USP tailing | USP plate count |
| Average of Six Standards | 4016582 | 16.207 | 1.5 | 9291 |
| Control sample | 3917791 | 16.163 | 1.5 | 9059 |
| BKT Standard | 4016274 | 16.212 | 1.5 | 9422 |
Table 18: Robustness data for DZH high pH-3.2
| Name | Area | RT | USP Tailing | USP Plate count |
| Average of Six Standards | 4018798 | 17.344 | 1.5 | 7186 |
| Control sample | 3911586 | 17.325 | 1.6 | 6880 |
| BKT Standard | 4013318 | 17.307 | 1.6 | 7084 |
Table 19: Robustness data for DZH low organic
| Name | Area | RT | USP tailing | USP plate count |
| Average of Six Standards | 4825354 | 16.352 | 1.5 | 11040 |
| Control sample | 4516177 | 16.420 | 1.4 | 11570 |
| BKT Standard | 4749970 | 16.508 | 1.5 | 11362 |
Table 20: Robustness data for DZH organic
| Name | Area | RT | USP tailing | USP plate count |
| Average of Six Standards | 4393697 | 16.939 | 1.4 | 10324 |
| Control sample | 3948760 | 16.945 | 1.3 | 9923 |
| BKT Standard | 4107294 | 16.944 | 1.3 | 8578 |
Table 21: Robustness data for TIM as such method
| Name | Area | RT | USP tailing | USP plate count |
| Average of Six Standards | 658730 | 28.380 | 1.0 | 7521 |
| Control sample | 655387 | 28.380 | 1.0 | 7514 |
| BKT Standard | 658650 | 28.386 | 1.0 | 7554 |
Table 22: Robustness data for TIM Flow method_1.0 ml
| Name | Area | RT | USP Tailing | USP Plate count |
| Average of Six Standards | 794461 | 29.302 | 1.0 | 4548 |
| Control sample | 790318 | 29.302 | 1.0 | 4498 |
| BKT Standard | 794346 | 29.282 | 1.0 | 4588 |
Table 23: Robustness data for TIM flow method_1.4 ml
| Name | Area | RT | USP Tailing | USP Plate count |
| Average of Six Standards | 565869 | 27.710 | 1.1 | 4588 |
| Control sample | 565495 | 27.705 | 1.1 | 4598 |
| BKT Standard | 568649 | 27.721 | 1.1 | 4578 |
Table 24: Robustness data for TIM temperature method_32 °C
| Name | Area | RT | USP Tailing | USP Plate count |
| Average of Six Standards | 568272 | 27.833 | 1.2 | 4896 |
| Control sample | 568508 | 27.831 | 1.2 | 4856 |
| BKT Standard | 290311 | 27.845 | 1.2 | 4825 |
Table 25: Robustness data for TIM temperature method_42 °C
| Name | Area | RT | USP Tailing | USP Plate count |
| Average of Six Standards | 570896 | 27.586 | 1.1 | 4514 |
| Control sample | 566612 | 27.574 | 1.2 | 4514 |
| BKT Standard | 570923 | 27.600 | 1.2 | 4572 |
Table 26: Robustness data for TIM pH-2.8
| Name | Area | RT | USP Tailing | USP Plate count |
| Average of Six Standards | 676376 | 28.295 | 1.1 | 4112 |
| Control sample | 678216 | 28.301 | 1.1 | 4115 |
| BKT Standard | 675360 | 28.283 | 1.1 | 4105 |
Table 27: Robustness data for TIM pH-3.2
| Name | Area | RT | USP tailing | USP plate count |
| Average of Six Standards | 663475 | 28.467 | 1.1 | 4512 |
| Control sample | 667968 | 28.457 | 1.1 | 4514 |
| BKT Standard | 663275 | 28.469 | 1.1 | 4517 |
Table 28: Robustness data for TIM low organic
| Name | Area | RT | USP tailing | USP plate count |
| Average of Six Standards | 794177 | 27.780 | 1.0 | 4507 |
| Control sample | 767106 | 27.779 | 1.0 | 4498 |
| BKT Standard | 782625 | 27.768 | 1.0 | 4857 |
Table 29: Robustness data for TIM high organic
| Name | Area | RT | USP tailing | USP plate count |
| Average of Six Standards | 725438 | 28.971 | 1.0 | 4758 |
| Control sample | 669571 | 28.964 | 1.0 | 4728 |
| BKT Standard | 669571 | 28.964 | 1.0 | 4799 |
CONCLUSION
A Novel, simple, sensitive, precise, accurate, and robust RP-HPLC method has been developed and validated for the simultaneous estimation of DZH and TIM in ophthalmic formulations. The method is superior compared with others and provides good resolution between the two active ingredients and their degradation products as per the USP, BP, and Ph. Eur. The validation studies demonstrate that the method is specific, linear, precise, accurate, and stability-indicating as per the ICH guidelines. The developed method can be effectively applied for routine quality control analysis of DZH and TIM in their combined ophthalmic formulations and bulk dosages. The stability-indicating nature of the method makes it particularly suitable for stability studies and for the analysis of samples that may contain degradation products. FTIR (Fourier Transform Infrared) spectroscopy is indeed used to compare dorzolamide hydrochloride (DZH) and timolol maleate (TIM), both in their standard forms and in a sample to identify similarities and differences in their molecular structures. This technique helps confirm the identity of the api and assess the purity and stability of the pharmaceutical formulation.
ACKONWLEDMENT
The authors would like to express their gratitude to Biogenico Private Limited for providing the drug samples and technical support provided by the analytical instrumentation facility.
FUNDING
Nil
AUTHORS CONTRIBUTIONS
Ramakrishna K Conceptualized the study, methodology, formal analysis, investigation, writing-original draft and Validation, data curation, writing-review and editing and Software, resources, visualization, Srujan Kumar M: Supervised the project.
CONFLICT OF INTERESTS
The authors report that there is no conflict of interest
REFERENCES
1. Weinreb RN, Aung T, Medeiros FA. The pathophysiology and treatment of glaucoma: a review. JAMA. 2014;311(18):1901-11. doi: 10.1001/jama.2014.3192, PMID 24825645.
2. Razeghinejad MR, Sawchyn AK, Katz LJ. Fixed combinations of dorzolamide timolol and brimonidine timolol in the management of glaucoma. Expert Opin Pharmacother. 2010;11(6):959-68. doi: 10.1517/14656561003667540, PMID 20307220.
3. Balfour JA, Wilde MI. Dorzolamide a review of its pharmacology and therapeutic potential in the management of glaucoma and ocular hypertension. Drugs Aging. 1997;10(5):384-403. doi: 10.2165/00002512-199710050-00006, PMID 9143858.
4. Zimmerman TJ, Kaufman HE. Timolol a beta-adrenergic blocking agent for the treatment of glaucoma. Arch Ophthalmol. 1977;95(4):601-4. doi: 10.1001/archopht.1977.04450040067008, PMID 322648.
5. Strohmaier K, Snyder E, DuBiner H, Adamsons I. The efficacy and safety of the dorzolamide timolol combination versus the concomitant administration of its components. Ophthalmology. 1998;105(10):1936-44. doi: 10.1016/S0161-6420(98)91045-4.
6. Pannu S, Sharma A, Goyal RK, Kapoor A, Sharma Y, Kaur R. Development and validation of UV spectrophotometric and RP-HPLC methods for estimation of lifitegrast in bulk and dosage form. Int J Pharm Pharm Sci. 2019;11(4):88-93. doi: 10.22159/ijpps.2019v11i4.32194.
7. Patel DB, Patel NJ. Validated RP-HPLC and TLC methods for simultaneous estimation of tamsulosin hydrochloride and finasteride in combined dosage forms. Acta Pharm. 2010;60(2):197-205. doi: 10.2478/v10007-010-0013-z, PMID 21134856.
8. Sarkar M, Khandavilli S, Panchagnula R. Development and validation of RP-HPLC and ultraviolet spectrophotometric methods of analysis for the quantitative estimation of antiretroviral drugs in pharmaceutical dosage forms. J Chromatogr B Analyt Technol Biomed Life Sci. 2006;830(2):349-54. doi: 10.1016/j.jchromb.2005.11.014, PMID 16330261.
9. Kumar N, Sangeetha D, Kalaiselvi P, Saravanakumar M. Development and validation of a stability indicating RP-UPLC method for the determination of potential impurities and degradation products of irinotecan hydrochloride. J Liq Chromatogr Relat Technol. 2016;39(8):427-36. doi: 10.1080/10826076.2016.1174693.
10. Tekade SR, Sonawane YS, Jadhav SB, Chabukswar AR. Development and validation of a HPLC method for simultaneous estimation of methyl paraben and propyl paraben in ophthalmic solution. Int J Pharm Pharm Sci. 2018;10(3):11-5. doi: 10.22159/ijpps.2018v10i3.22976.
11. Savadkouhi MB, Vahidi O, Rahmani A, Ayati N. Stability indicating HPLC method for determination of eptifibatide acetate in pharmaceutical dosage forms. Iran J Pharm Res. 2017;16(1):163-70. doi: 10.22037/ijpr.2017.1993.
12. Pan C, Liu F, Ji Q, Wang W, Drinkwater D, Vivilecchia R. The use of LC/MS, GC/MS, and LC/NMR hyphenated techniques to identify a drug degradation product in pharmaceutical development. J Pharm Biomed Anal. 2006;40(3):581-90. doi: 10.1016/j.jpba.2005.08.020, PMID 16242883.
13. Cabrales Rico A, Ramos Y, Besada V, Del Carmen Dominguez M, Lorenzo N, Garcia O. Development and validation of a bioanalytical method based on LC-MS/MS analysis for the quantitation of CIGB-814 peptide in plasma from Rheumatoid Arthritis patients. J Pharm Biomed Anal. 2017;143:130-40. doi: 10.1016/j.jpba.2017.05.030, PMID 28595106.
14. El Bagary RI, Elkady EF, Ayoub BM. Spectrophotometric methods for the determination of timolol maleate in bulk and in pharmaceutical formulations. Can J Anal Sci Spectrosc. 2011;56(3):169-78. doi: 10.1080/10826076.2011.607713.
15. Elzanfaly ES, Saad AS, Abd Elaleem AE. Simultaneous determination of retinoic acid and hydroquinone in skin ointment using spectrophotometric technique (ratio difference method). Saudi Pharm J. 2012;20(3):249-53. doi: 10.1016/j.jsps.2012.03.004, PMID 23960798.
16. Rahman MA, Iqbal Z, Mirza MA, Hussain A. Estimation of sertraline by chromatographic (HPLC-UV273 nm) technique under hydrolytic stress conditions. Pharm Methods. 2012;3(2):62-7. doi: 10.4103/2229-4708.103874, PMID 23781480.
17. Sharma A, Jain C. Carvedilol cyclodextrin systems: preparation characterization and in vitro evaluation. Dhaka Univ J Pharm Sci. 2013;12(1):51-8. doi: 10.3329/dujps.v12i1.16300.
18. Erk N. Simultaneous determination of dorzolamide HCl and timolol maleate in eye drops by two different spectroscopic methods. J Pharm Biomed Anal. 2002;28(2):391-7. doi: 10.1016/s0731-7085(01)00627-6, PMID 11929684.
19. Barot TG, Patidar K, Kshartri N, Vyas N. Development and validation of LC method for the determination of amphotericin-B in pharmaceutical formulation using an experimental design. EJ Chem. 2009;6(2):590-600. doi: 10.1155/2009/509414.
20. Hassib ST, Elkady EF, Sayed RM. Simultaneous determination of timolol maleate in combination with some other anti-glaucoma drugs in rabbit aqueous humor by high-performance liquid chromatography tandem mass spectroscopy. J Chromatogr B Analyt Technol Biomed Life Sci. 2016;1022:109-17. doi: 10.1016/j.jchromb.2016.04.012, PMID 27085020.
21. Shah PA, Gandhi MS, Shah C, Shah DR, Shah S. Application of stability indicating HPTLC method for quantitative determination of dorzolamide hydrochloride and timolol maleate in pharmaceutical dosage form. Pharma Sci Monitor. 2014;5(2):197-212. doi: 10.17727/PUQR.2014.5.2.197.
22. Shrivastava A, Gupta V. Methods for the determination of limit of detection and limit of quantitation of the analytical methods. Chron Young Sci. 2011;2(1):21-5. doi: 10.4103/2229-5186.79345.
23. Puente B, Hernandez E, Perez S, Pablo L, Prieto E, Garcia MA. Determination of memantine in plasma and vitreous humour by HPLC with precolumn derivatization and fluorescence detection. J Chromatogr Sci. 2011;49(10):745-52. doi: 10.1093/chrsci/49.10.745, PMID 22080801.
24. Ahmed IS, Aboul Einien MH. In vitro and in vivo evaluation of a fast-disintegrating lyophilized dry emulsion tablet containing griseofulvin. Eur J Pharm Sci. 2007;32(1):58-68. doi: 10.1016/j.ejps.2007.05.114, PMID 17628451.
25. Ibrahim MM, El Nabarawi MA, El Setouhy DA, Fadlalla MA. Polymeric surfactant-based etodolac chewable tablets: formulation and in vivo evaluation. AAPS PharmSciTech. 2010;11(4):1730-7. doi: 10.1208/s12249-010-9548-z, PMID 21136309.
26. Hertzog DL, McCafferty JF, Fang X, Tyrrell RJ, Reed RA. Development and validation of a stability-indicating HPLC method for the simultaneous determination of losartan potassium hydrochlorothiazide and their degradation products. J Pharm Biomed Anal. 2002;30(3):747-60. doi: 10.1016/s0731-7085(02)00385-0, PMID 12367701.
27. Patadia R, Pal A, Vyas M, Sharma P, Mukherjee R, Gupta S. A stability indicating UPLC method for the determination of glucosamine, vancomycin and related impurities. J Pharm Biomed Anal. 2015;114:210-22. doi: 10.1016/j.jpba.2015.05.022.
28. Shaalan RA, Belal TS, El Yazbi FA, Elonsy SM. Validated stability indicating HPLC-DAD method of analysis for the antihypertensive triple mixture of amlodipine besylate valsartan and hydrochlorothiazide in their tablets. Arab J Chem. 2017;10:S1381-94. doi: 10.1016/j.arabjc.2013.04.012.
29. Bojic M, Simon Haas V, Saric D, Males Z. Determination of flavonoids, phenolic acids and xanthines in mate tea (Ilex paraguariensis St.-Hil.). J Anal Methods Chem. 2013;2013:658596. doi: 10.1155/2013/658596, PMID 23841023.
30. Krishnaiah Ch, Reddy AR, Kumar R, Mukkanti K. Stability indicating UPLC method for determination of valsartan and their degradation products in active pharmaceutical ingredient and pharmaceutical dosage forms. J Pharm Biomed Anal. 2010;53(3):483-9. doi: 10.1016/j.jpba.2010.05.022, PMID 20646890.