
Int J App Pharm, Vol 17, Issue 6, 2025, 538-550Original Article
NANOEMULSION-BASED DELIVERY OF TERMINALIA ARJUNA BARK EXTRACT: SNEDDS FORMULATION, OPTIMIZATION, AND IN VIVO EVALUATION
PANKAJ1, MANISH VYAS1,2*, SANJEEV KUMAR SAHU1, PALWINDER KAUR1
1Pharmaceutical Sciences, Lovely Professional University, Phagwara-144411, Punjab, India. 2Development Cell, Parul University, Vadodara-391760, Gujarat India
*Corresponding author: Manish Vyas; *Email: vymanish@gmail.com
Received: 02 Jun 2025, Revised and Accepted: 23 Aug 2025
ABSTRACT
Objective: Terminalia arjuna (T. arjuna), the stem bark of which has long been valued for its strong cardioprotective and antioxidant effects, primarily due to its diverse range of bioactive compounds. Despite its potential, its clinical use has been limited due to its poor water solubility and low oral bioavailability.
Methods: In this study, an optimized Self-Nanoemulsifying Drug Delivery System (SNEDDS) of T. arjuna extract was developed to overcome these limitations and improve the oral delivery of the extract. Later, the formulation was subjected to stability analysis and preclinical analysis to check the effectiveness of the developed dosage form.
Results: In this research, the SNEDDS formulation was optimized using a reference ratio of the oil (Labrafil), surfactant (Tween 80), and co-surfactant (Transcutol P). The resulting formulation displayed a globule size of 325.66 nm, a polydispersity index (PDI) of 0.252, and a zeta potential of-29.7 mV. The results of the in vivo study showed significant improvements for all groups compared to the control. The standard drug and high-dose SNEDDS groups had the most pronounced effects, while the crude extract and low-dose SNEDDS (500 mg/kg) showed milder responses. The SNEDDS formulation of T. arjuna enhanced both efficacy and safety, highlighting its potential for improving the bioavailability of natural extracts.
Conclusion: Overall, the SNEDDS approach is a promising method for enhancing the therapeutic effectiveness of T. arjuna, particularly in managing cardiovascular conditions.
Keywords: Arjuna, SNEDDS, Nanoemulsion, Stability, Antihypertensive activity
© 2025 The Authors. Published by Innovare Academic Sciences Pvt Ltd. This is an open access article under the CC BY license (https://creativecommons.org/licenses/by/4.0/)
DOI: https://dx.doi.org/10.22159/ijap.2025v17i6.55374 Journal homepage: https://innovareacademics.in/journals/index.php/ijap
INTRODUCTION
Terminalia arjuna (T. arjuna) (Roxb.) is used in Ayurvedic medicine, commonly known as Arjuna. It is one of the extensively utilized herbal medicinal plants in the Indian subcontinent for treating disorders related to the cardiovascular system. The bark of T. arjuna contains bioactive phytoconstituents that possess cardiotonic, antioxidant, anti-inflammatory, and hypocholesterolemic properties [1]. The composition of various extracts of T. arjuna consists of triterpenoids (arjunic acid, arjunolic acid), Flavonoids, Tannins, Glycosides, etc. Although T. arjuna has substantial medicinal value, it lacks clinical efficacy because none of its major phytoconstituents are water-soluble or orally bioavailable. The adoption of the Self-Nanoemulsifying Drug Delivery System (SNEDDS) approach is primarily driven by the limitations associated with conventional drug delivery routes, particularly oral administration, and the inherently low aqueous solubility of lipophilic drugs. Conversely, hydrophilic drugs also pose formulation challenges due to their unfavorable physicochemical properties and molecular characteristics, which hinder their effectiveness when delivered in conventional oral dosage forms, whether in solid, solution, or suspension form [2].
To address these issues, SNEDDS formulations are carefully designed by combining the drug with an appropriate aqueous phase, oil, surfactant, and co-surfactant under well-defined formulation parameters, ensuring optimal drug solubilization and delivery performance [3]. Self-nanoemulsifying drug delivery systems (SNEDDS) are modern formulations designed to significantly enhance the release and absorption of a wide range of therapeutic agents, including chemotherapy drugs, immunotherapies, antidiabetics, and plant-based bioactive compounds with various health benefits. SNEDDS are anhydrous, uniform blends of drugs, oils, surfactants, and co-emulsifiers or solubilizers [4]. When mixed with water under gentle stirring, these systems quickly form fine oil-in-water nanoemulsions, typically with droplet sizes of less than 200 nm. The selection of SNEDDS components largely depends on the physicochemical properties of the drug [5]. Compared to earlier self-emulsifying formulations, SNEDDS have demonstrated improved effectiveness across various drug types, particularly for lipophilic compounds classified under the Biopharmaceutics Classification System (BCS) [6]. Nearly half of newly developed drugs suffer from poor water solubility, which limits their absorption and bioavailability when taken orally [7, 8]. SNEDDS are particularly advantageous in such cases, as they enhance the drug's dissolution rate, improve absorption, and produce more consistent plasma concentration profiles. Their stability and capacity to form fine nanoemulsions provide a large surface area, promoting efficient drug release between the oil and water phases. Including surfactants and co-surfactants stabilizes these emulsions, forming clear or slightly hazy dispersions that are thermodynamically stable. Ultimately, this system helps improve drug solubility, increase bioavailability, and enhance treatment efficacy [9].
MATERIALS AND METHODS
Preparation of extract
Methanolic extraction was carried out to prepare the stem bark extract for further studies. Stem bark of T. arjuna was collected from the local market in Jalandhar. The stem bark was authenticated by the National Institute of Pharmaceutical Education and Research (NIPER), Mohali, India, and assigned the authentication number NIP-M-1011. The collected stem bark was thoroughly cleaned and shade-dried for several days. Once dried, it was coarsely powdered and placed into a thimble for further processing. Using methanol as the solvent, the extraction was performed continuously for 24 h in a Soxhlet apparatus. The solvent was then evaporated in a water bath, and the concentrated extract was stored for future use [10].
Characterization of extract using thin-layer chromatography
In this study, the extract of T. arjuna was analyzed using thin-layer chromatography (TLC). The chromatography was performed using a Chloroform: Methanol (8:2) solvent system and silica gel G (SiO2) as the stationary phase to identify the presence of phytoconstituents in the extract [10].
Solubility studies of T. arjuna extract in oils, surfactants, and co-surfactants
To design effective SNEDDS formulations, the solubility of the methanolic extract was evaluated in a range of oils, surfactants, and co-surfactants. Each extract was thoroughly mixed with individual vehicles, followed by vortexing for 15 min. The mixtures were then placed in a water bath and gently agitated at 25 °C for three days to ensure proper interaction. After incubation, the samples were centrifuged at 3500 rpm for 15 min. The clear supernatant was collected, appropriately diluted, and analyzed using a ultra-violet (UV)-visible spectrophotometer at a wavelength of 275 nm. This procedure was repeated three times to ensure accuracy, and the average solubility values were recorded (table 5) [11, 12].
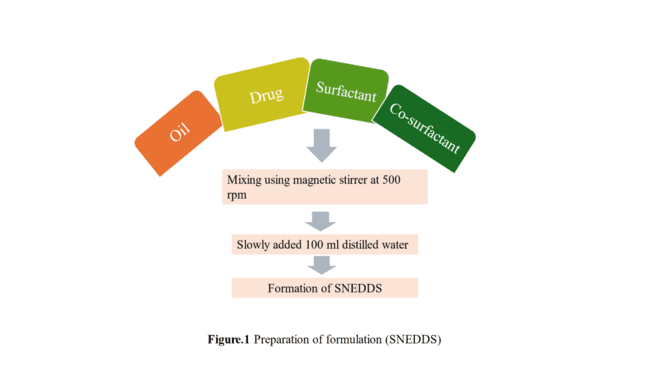
Fig. 1: Processing of SNEDDS formulation
Construction of ternary phase diagram
To identify the concentration range for forming spontaneous nanoemulsions, a ternary phase diagram of surfactant, oil, and co-surfactant is essential. This diagram helps locate the self-emulsifying region. By mixing different compositions with an equal volume of water, droplet sizes are measured. A spontaneous nanoemulsion with droplets under 200 nm confirms the self-emulsifying zone. The ternary phase diagram was created using the Ternaryplot. com online software (table 6) [13, 14].
Quality by design (QbD)-based formulation optimization studies
The SNEDDS formulation was optimized using Response Surface Methodology (RSM) with a Central Composite Design (CCD) to investigate how varying ratios of oil, surfactant, and co-surfactant affect the formulation. The concentration ranges for each component were selected based on a ternary phase diagram [15]. In the CCD model, three formulation factors were studied along with four axial points, using an alpha value (α) of 1.414 to ensure statistical accuracy. Throughout the optimization process, the amount of extract used remained constant (table 1).
A 20-run experimental design, including five replicates, was created using coded factors through Design-Expert® software (version 11), as outlined in table 2. Each SNEDDS formulation was then evaluated for key quality parameters, including globule size, polydispersity index (PDI), and zeta potential. These attributes were used to assess the formulation's performance, stability, and overall suitability for drug delivery.
Design-Expert® software was used to perform multiple linear regression, generating polynomial coefficients that relate formulation variables to critical quality attributes (CQAs). Model fit was evaluated using p-values, R-values, and PRESS. Interactions between variables were visualized through 3D response surfaces and 2D contour plots. Numerical optimization was then applied to achieve maximum desirability, aiming for a value as close to 1 as possible.
Optimized formulation and validation studies
The formulation was optimized to determine the ideal levels of factors A, B, and C. During the optimization process, the globule size varied between 311.2 and 924.8 nm, the zeta potential ranged from -28.7 to -58.2 mV, and the polydispersity index (PDI) fell within the range of 0.225 to 0.866.
Table 1: Experimental variables of CCD for SNEDDS
| Variables | Design level | ||
| Uncoded | Coded | Low | High |
| Oil | A | 0.1 | 0.2 |
| Surfactant | B | 0.1 | 0.3 |
| Co-surfactant | C | 0.6 | 0.8 |
Table 2: Summary of all the SNEDDS formulations as suggested by DoE for CCD
| Run | Factor 1 | Factor 2 | Factor 3 |
| A: Oil | B: Surfactant | C: Co-surfactant | |
| 1 | 0.1 | 0.3 | 0.6 |
| 2 | 0.15 | 0.03 | 0.7 |
| 3 | 0.15 | 0.2 | 0.86 |
| 4 | 0.2 | 0.1 | 0.8 |
| 5 | 0.15 | 0.2 | 0.7 |
| 6 | 0.15 | 0.2 | 0.7 |
| 7 | 0.1 | 0.3 | 0.8 |
| 8 | 0.06 | 0.2 | 0.7 |
| 9 | 0.15 | 0.2 | 0.7 |
| 10 | 0.1 | 0.1 | 0.6 |
| 11 | 0.23 | 0.2 | 0.7 |
| 12 | 0.15 | 0.2 | 0.53 |
| 13 | 0.15 | 0.2 | 0.7 |
| 14 | 0.15 | 0.2 | 0.7 |
| 15 | 0.2 | 0.1 | 0.6 |
| 16 | 0.15 | 0.2 | 0.7 |
| 17 | 0.2 | 0.3 | 0.8 |
| 18 | 0.2 | 0.3 | 0.6 |
| 19 | 0.15 | 0.36 | 0.7 |
| 20 | 0.1 | 0.1 | 0.8 |
Characterization of SNEDDS
Globule size analysis, PDI, zeta potential
The optimized SNEDDS batch was analyzed for globule size, PDI, and zeta potential using a Malvern Nano Zetasizer (DTS Ver. 5.10) at the Central Instrumentation Facility (CIF) of Lovely Professional University [16].
The entrapment efficiency of the formulation
To determine drug encapsulation, the SNEDDS was centrifuged at 15,000 rpm for 3 h at room temperature. The clear supernatant was collected, mixed with ethanol to break vesicles, and analyzed using UV spectrophotometry at 275 nm. Entrapment efficiency was calculated using a standard formula.

High-performance thin-layer chromatography (HPTLC) study
HPTLC analysis was performed using an extract obtained through Soxhlet extraction. The resulting HPTLC fingerprint helped confirm the identity of the plant material. Quantitative analysis was conducted using densitograms and image profiles derived from hyperspectral data. As a reliable analytical technique, HPTLC depends on sophisticated instrumentation, standardized procedures, and well-established protocols to ensure precision and reproducibility. Its strength lies in delivering consistent results, even when the same samples and plates are analyzed multiple times. Marker compounds play a vital role in this process-they are specific, chemically identified components used to verify the authenticity of herbal materials, detect adulteration, and evaluate overall quality [17]. These markers are chosen for quality control rather than therapeutic effects. In this study, the Retention factor (Rf) value of the extract was measured and compared with that of a known standard to verify the authenticity and quality of the plant sample.
In vitro drug release study
The in vitro drug release was carried out using a dialysis membrane (pore size: 12 kDa) pre-soaked in Simulated Intestinal Fluid (SIF) (pH 6.8) overnight and rinsed to remove glycerin [14]. A nanoemulsion containing 80 mg of the formulation was loaded into the membrane and placed in 150 ml of 1 N SIF at 37±0.5 °C with stirring at 50 rpm. Samples were taken at set intervals, replaced with fresh SIF, and then filtered and analyzed at 207 nm using a UV-Vis spectrophotometer with blanks for comparison [18].
Scanning electron microscopy (SEM)
For the optimized batch of SNEDDS, an SEM study was conducted at the CIF of Lovely Professional University [17].
Accelerated stability study
An accelerated stability study was conducted to evaluate the shelf life of the SNEDDS formulation and ensure that its physicochemical properties remained consistent over time. The optimized formulation was stored in a stability chamber (Remi Electro Technique, India) at controlled conditions of 40±2 °C and 75±5% relative humidity for three months [19]. Throughout the study, samples were regularly monitored for any drug precipitation or changes in droplet size, which could signal potential instability in the formulation.
Evaluation of test formulation
HPTLC on the aged formulation
First, the sample was evaporated, and the residue left behind was dissolved in 1 ml of methanol. This solution was then passed through a 0.45 μm membrane filter to eliminate any solid particles. The clear filtrate obtained was used for HPTLC fingerprint analysis. To prepare the derivatizing reagent, 10 ml of glacial acetic acid was mixed with 0.5 ml of anisaldehyde, 85 ml of methanol, and 5 ml of concentrated sulfuric acid (98%). For the chromatography, the mobile phase consisted of toluene, methyl acetate, and methanol mixed in a ratio of 8:2:0.5 (v/v). Before starting the development, the chamber was saturated with this mobile phase for 30 min to promote better separation. After the chromatographic run, the sample spots were observed under UV light at 254 nm and 366 nm, as well as under visible light at 540 nm, for further visualization.
Microbial analysis
Take 1 gm/ml final formulation and extract in 10 ml sterile soybean casein digest broth. Mixing the samples by using a cyclomixture. –The plate method was used in microbial analysis.
Table 3: Summary of microbial limit test
| Test microorganism | Sample preparation/Procedure | Incubation conditions | Observation/Result criteria |
| Total microbial count | 1 ml of sample into two sterile plates, add 25 ml Soybean Casein Digest Agar, mix, solidify | 30–35 °C for 3–5 d | Count colonies (≤250/plate), calculate CFU |
| Yeast and Mold count | 1 ml sample into two sterile plates, add 25 ml Sabouraud Dextrose Agar, mix, solidify | 20–25 °C for 5 d | Count colonies (20–25/plate), calculate CFU |
| E. coli | 0.1 ml into MacConkey Broth → subculture on MacConkey Agar → EMB agar → Peptone broth+Kovac’s reagent | Broth: 42–44 °C (24–48 h); Agar: 30–35 °C | Pink colonies (MacConkey); green metallic sheen (EMB); pink ring (Indole test) |
| Salmonella | 0.1 ml into Rappaport Broth → Wilson and Blair BBS/XLDA agar → TSI slant for confirmation | 30–35 °C for 24–48 h | Black-centered/black colonies (BBS); red/black (XLDA); acid/gas production (TSI) |
| P. aeruginosa | Loopful sample on Cetrimide agar → Fluorescein/Pyocyanin agar → Oxidase test | 30–35 °C for 18–72 h | Green colonies (Cetrimide); fluorescence/ yellow (pyocyanin); blue oxidase disc |
| S. aureus | Loopful sample on Mannitol Salt Agar → Catalase test using hydrogen peroxide | 30–35 °C for 18–72 h | Yellow zone colonies; bubble formation in catalase test |
| Positive control | Known organism samples on all media | Standard conditions per test | Should show expected growth to confirm media quality |
| Negative control | Sterile media/diluent without organisms | Same as test samples | No microbial growth should occur |
In vivo anti-hypertension activity
This study evaluated the antihypertensive effects of a self-nanoemulsifying drug delivery system (SNEDDS) of T. arjuna extract in male Wistar rats (8–12 w old, weighing 150–200 g), which were procured from the in-house animal facility of Pinnacle Biomedical Research Institute (PBRI), Bhopal, Madhya Pradesh, India. All experimental procedures were conducted with the approval of the relevant ethics committee under the protocol approval number PBRI/IAEC/30-09-24-015. The rats were acclimated to laboratory conditions for a period of 5–7 d prior to the commencement of the study. Hypertension was induced by administering daily subcutaneous injections of Dexamethasone at a dose of 30 μg/kg body weight for 14 consecutive days. Dexamethasone administration is a valuable model for studying the vaso-modulatory effects of plant-based formulations. Especially where there is a complex interplay of hypertension, insulin resistance, and sympathetic nervous system activation [20]. The rats were then divided into three groups: a negative control group that received only Dexamethasone, a preventive group that was given the SNEDDS formulation starting before and continuing throughout the dexamethasone treatment, and a curative group that received a standard antihypertensive medication orally from day 8 to day 14, once hypertension had been established.
Table 4: Design of experiment for animal study
| S. No. | Treatment group | No of animals | Dose |
| Group 1 | Control | 6/M | Treated with Dexamethasone (30 μg/kg body weight) |
| Group 2 | Standard | 6/M | Dexamethasone+5 mg/kg Enalapril Maleate |
| Group 3 | Test sample | 6/M | Dexamethasone+SNEDDS formulation |
Evaluation of blood pressure and body weight
Systolic blood pressure was measured using a non-invasive tail-cuff plethysmography system. Readings were taken on days 4, 7, 14, and 18 to monitor the effectiveness of the treatments. Body weight was measured to detect changes in body weight.
RESULTS AND DISCUSSION
Extraction
The extraction process was conducted in six separate batches, each using 100 gm of coarsely powdered dried bark and 500 ml of methanol in a Soxhlet apparatus. This method ensured efficient extraction of the active constituents. The average yield obtained from all batches was 29.06±1.7%, indicating consistent extraction efficiency throughout the process.

Fig. 2: TLC plate A at 210 nm and B at 254 nm
Thin-layer chromatography (TLC)
The concentration and absorbance of the T. arjuna extract were analyzed using a solvent system composed of chloroform and methanol in an 8:2 ratio. Following vaporization in an iodine chamber, the extract displayed Rf values of 0.92 and 0.97. Among these, the Rf value of 0.92 matched that of the standard and produced a characteristic violet color, indicating the presence of cardiac glycosides in the T. arjuna extract (fig. 2).
Solubility study of T. arjuna SNEDDS
Therefore, based on these findings, Labrafil M 1994 CS, Tween 80, and Transcutol P were chosen for their highest solubility compared to other options, such as oil, surfactant, and co-surfactant, in the formulation of T. arjuna SNEDDS (fig. 3). Selection of three components on this basis will help increase the solubility of the drug and maintain fine globules of optimum fluidity.
Table 5: Solubility study of nanoemulsion vehicles
| Vehicle | Solubility in mg/ml (mean±SD)# |
| Oil | |
| Castor oil | 0.147±0.002 |
| Coconut oil | 0.337±0.002 |
| Sunflower oil | 0.189±0.001 |
| Sesame oil | 0.97±0.010 |
| Labrafil M 1994 CS | 15.199±0.001 |
| Labrafac CC | 0.332±0.002 |
| Surfactant | |
| Tween 60 | 0.785±0.013 |
| Tween 20 | 0.886±0.001 |
| Tween 80 | 8.866±0.152 |
| Co-surfactant | |
| Transcutol P | 8.785±0.012 |
| PEG 400 | 7.073±0.002 |
| Labrasol | 0.397±0.001 |
#Sample size (n) =3
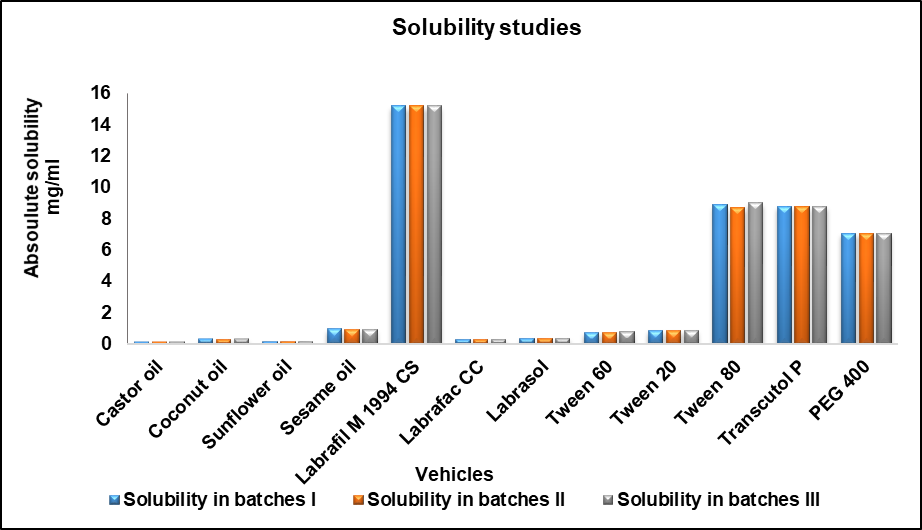
Fig. 3: Solubility of various oils, surfactants, and co-surfactants
Table 6: Results of different ratios of oil, surfactant, and co-surfactant
| Batch no. | Oil (μl) | Surfactant (μl) | Co-surfactant (μl) | Sample (μl) | Distilled water (ml) | Result |
| 1. | 0.1 | 0.5 | 0.4 | 150 | 100 | Turbid |
| 2. | 0.2 | 0.6 | 0.2 | 150 | 100 | Creaming |
| 3. | 0.3 | 0.35 | 0.35 | 150 | 100 | Cracking |
| 4. | 0.2 | 0.2 | 0.6 | 150 | 100 | Clear |
| 5. | 0.6 | 0.2 | 0.2 | 150 | 100 | Cracking |
| 6. | 0.2 | 0.4 | 0.4 | 150 | 100 | Turbid |
| 7. | 0.3 | 0.3 | 0.4 | 150 | 100 | Creaming |
| 8. | 0.2 | 0.7 | 0.1 | 150 | 100 | Creaming |
| 9. | 0.5 | 0.1 | 0.4 | 150 | 100 | Turbid |
| 10. | 0.2 | 0.53 | 0.27 | 150 | 100 | Creaming |
| 11. | 0.1 | 0.1 | 0.8 | 150 | 100 | Clear |
| 12. | 0.3 | 0.23 | 0.47 | 150 | 100 | Cracking |
| 13. | 0.4 | 0.27 | 0.33 | 150 | 100 | Cracking |
| 14. | 0.2 | 0.5 | 0.3 | 150 | 100 | Creaming |
| 15. | 0.1 | 0.4 | 0.5 | 150 | 100 | Turbid |
| 16. | 0.5 | 0.2 | 0.3 | 150 | 100 | Cracking |
| 17. | 0.3 | 0.6 | 0.1 | 150 | 100 | Creaming |
| 18. | 0.4 | 0.3 | 0.3 | 150 | 100 | Creaming |
| 19. | 0.1 | 0.6 | 0.3 | 150 | 100 | Cracking |
| 20. | 0.4 | 0.2 | 0.4 | 150 | 100 | Very turbid |
| 21. | 0.3 | 0.47 | 0.23 | 150 | 100 | Creaming |
| 22. | 0.4 | 0.40 | 0.2 | 150 | 100 | Very turbid |
| 23. | 0.1 | 0.3 | 0.6 | 150 | 100 | Clear |
| 24. | 0.4 | 0.5 | 0.1 | 150 | 100 | Very turbid |
| 25. | 0.3 | 0.5 | 0.2 | 150 | 100 | Cracking |
| 26. | 0.3 | 0.2 | 0.5 | 150 | 100 | creaming |
| 27. | 0.9 | 0.37 | 0.53 | 150 | 100 | Turbid |
Based on these results, a ternary phase diagram was created to identify the optimal SNEDDS region. Among them, samples 4, 11, and 23 exhibited transparent emulsions, whereas turbidity was observed in samples 6, 9, 15, 20, 22, 24, 26, and 27. Creaming was observed in samples 1, 2, 7, 8, 10, 14, 17, 18, and 21. Meanwhile, phase separation occurred in samples 3, 5, 12, 13, 19, and 25. A detailed record of all batch observations is provided in table 6.
Ternary phase diagram

Fig. 4: Ternary phase diagram showing oil, surfactant, and co-surfactant phase
The ternary phase diagram displays a distinct, clear emulsion region, marked by red dots (fig. 4). The area between these produces a clear and transparent emulsion. This region ratio lies in the range of 0.1 to 0.2 for oil, 0.1 to 0.3 for surfactant, and 0.6 to 0.8 for co-surfactant. The region outside this area corresponds to the biphasic system.
QbD-based formulation optimization studies
Several SNEDDS formulations were created by adjusting the ratios of oil, surfactant, and co-surfactant according to the Design of Experiments (DoE) approach. The findings indicated that the data aligned closely with a quadratic model based on the independent variables, as detailed in table 7.
Table 7: Response of CQAs of SNEDDS
| Run | Factor 1 | Factor 2 | Factor 3 | Response 1 | Response 2 | Response 3 |
| A: Oil | B: surfactant | C: Co-surfactant | Globule size nm | Zeta potential mV | PDI | |
| 1 | 0.1 | 0.3 | 0.6 | 329.5 | -29.7 | 0.233 |
| 2 | 0.15 | 0.03 | 0.7 | 717 | -33.2 | 0.367 |
| 3 | 0.15 | 0.2 | 0.86 | 789.5 | -47.8 | 0.814 |
| 4 | 0.2 | 0.1 | 0.8 | 668.4 | -30.2 | 0.528 |
| 5 | 0.15 | 0.2 | 0.7 | 702.8 | -31.9 | 0.497 |
| 6 | 0.15 | 0.2 | 0.7 | 702.8 | -31.9 | 0.497 |
| 7 | 0.1 | 0.3 | 0.8 | 924.8 | -58.2 | 0.866 |
| 8 | 0.06 | 0.2 | 0.7 | 461.3 | -37.5 | 0.621 |
| 9 | 0.15 | 0.2 | 0.7 | 702.8 | -31.9 | 0.497 |
| 10 | 0.1 | 0.1 | 0.6 | 311.2 | -33.9 | 0.288 |
| 11 | 0.23 | 0.2 | 0.7 | 843.7 | -53.9 | 0.746 |
| 12 | 0.15 | 0.2 | 0.53 | 427.7 | -30.9 | 0.52 |
| 13 | 0.15 | 0.2 | 0.7 | 702.8 | -31.9 | 0.497 |
| 14 | 0.15 | 0.2 | 0.7 | 702.8 | -31.9 | 0.497 |
| 15 | 0.2 | 0.1 | 0.6 | 712.9 | -39.9 | 0.574 |
| 16 | 0.15 | 0.2 | 0.7 | 702.8 | -31.9 | 0.497 |
| 17 | 0.2 | 0.3 | 0.8 | 576.4 | -37.4 | 0.675 |
| 18 | 0.2 | 0.3 | 0.6 | 655 | -34.7 | 0.726 |
| 19 | 0.15 | 0.36 | 0.7 | 717 | -33.3 | 0.548 |
| 20 | 0.1 | 0.1 | 0.8 | 338.5 | -30.4 | 0.225 |
The globule size varied across formulations, with the largest being 924.8 nm in run seven and the smallest at 311.2 nm in run 10 (fig. 5). It was noted that keeping the amounts of oil, surfactant, and co-surfactant within the lower ranges-specifically, oil between 0.1 to 0.15, surfactant from 0.1 to 0.2, and co-surfactant between 0.6 to 0.65-helped achieve smaller globule sizes. Additionally, a strong interaction among all three components contributed to further reducing the size of the globule.
The zeta potential ranged from -29.7 mV in run 1 to a maximum of -58.7 mV (fig. 5). Lower zeta potential values were observed when the oil content was low (between 0.1 and 0.12). At the same time, the surfactant and co-surfactant levels were higher, at approximately 0.25 to 0.3 and 0.75 to 0.8, respectively. This trend was also clearly visible in the contour plots. The primary reason for negative zeta potential can be attributed to the deprotonation of hydroxyl and carboxyl functional groups in alkaline media. Their deprotonation and thus adsorption on the globules can impart a negative charge to the globules.
Regarding the PDI, the lowest value recorded was 0.16 in run 10, and the highest was 0.51 in run 13. PDI indicates the particle size distribution pattern. For run 13, a broader PDI, along with a larger average particle size, suggests a higher chance of instability and faster sedimentation. In contrast, the lower PDI of run 10 shows that the average particle size is close to the median size, implying better stability for that formulation.
Statistical analysis of the model was conducted using Design of Experiments (DoE) tools, which included a fit summary, sequential model sum of squares, lack-of-fit tests, and model summary statistics, as shown in table 8. The evaluation of responses revealed strong evidence for selecting a quadratic model, supported by very low p-values (Prob>F less than 0.0001), high R-squared values, low standard deviations, and a low predicted residual error sum of squares (PRESS). ANOVA was used to assess the significance and influence of the main factors and their interactions (table 8). For the responses Y1, Y2, and Y3, the F-values were 5.69, 4.09, and 4.21, respectively, all with p-values less than 0.05, confirming that these models were statistically significant. The adequacy of the models was also checked through the adequate precision metric, which reflects the signal-to-noise ratio. The values for Y1, Y2, and Y3-8.905, 7.174, and 7.404, respectively-were well above the minimum requirement of 4, indicating that the models provided reliable predictions within the design space.
Moreover, the difference between the adjusted R² and predicted R² values was less than 0.2 for all responses, which further supported the accuracy of the models. In summary, the quadratic model was considered suitable since its overall p-values were below the 0.05 threshold.
Table 8: Summary of ANOVA of CCD for optimized formulation
| Responses | Regression parameters | Observed P-value* | |
| R2 | Fcal | ||
| Globule size | 0.8365 | 5.69 | 0.0060 |
| Zeta potential | 0.7863 | 4.09 | 0.0193 |
| PDI | 0.7912 | 4.21 | 0.0175 |
*Indicates statistical significance at P<0.05.
The DOE software determined the final mathematical model in terms of coded factors (Y1 to Y3), as shown below. The positive sign in the equation indicates the synergistic effect, whereas the negative sign indicates an antagonistic effect.
Y1 (Globule Size) =+705.78+98.98 A+33.29 B+81.13 C-94.31 AB-93.21 AC+66.74 BC-37.23 A²-14.42 B²-52.75 C²
The positive coefficients for each factor suggest that increasing their amounts individually tends to increase the globule size. On the other hand, the negative coefficients with higher values highlight the strong interactive effects between oil and surfactant, as well as oil and co-surfactant, which work together to reduce the globule size. This relationship is clearly illustrated in the perturbation plot. A high negative coefficient of oil and surfactant means that they synergistically reduce the globule size as their amount increases. Similarly, increasing oil and co-surfactant together have an antagonistic effect it. Which means an increase in oil and co-surfactant will produce larger globules, possibly due to an increase in fluidity of the globules (fig. 6).
Y2 (Zeta potential) =-32.00-1.29 A-1.89 B-3.40 C+2.70 AB+4.00 AC-5.55 BC-4.23 A²+0.1748 B²-1.98 C²
The decrease in zeta potential with increasing amounts of oil, surfactants, and co-surfactants suggests that lower levels of these components lead to reduced zeta potential values. Among them, the co-surfactant has the most significant impact, as shown by its higher coefficient value. This is clearly illustrated in the perturbation plot (fig. 5). The analysis also revealed strong self-interactions and a notable interaction between oil and co-surfactant. Co-surfactants play a key role in controlling zeta potential because they help stabilize the globules by acting at their interfaces (fig. 7).
Y3 (PDI) =+0.5001+0.0806 A+0.0871 B+0.0708 C-0.0359 AB-0.0834 AC+0.0864 BC+0.0460 A²-0.0339B²+0.0401 C²
A similar mutual interaction between oil-surfactant and oil-co-surfactant was observed for the PDI, where an increase in all factors led to a rise in PDI values. The self-interactions of each factor were relatively weak (fig. 8).
To better understand how these factors influenced the responses, perturbation plots were created. In these plots, flat lines suggest that a factor has little to no effect, while pronounced curves indicate a significant impact. As shown in the perturbation plot (fig. 9), each factor, when considered individually, had only a slight effect on the responses. However, strong interactions between the oil-surfactant and the oil-co-surfactant significantly influenced globule size, zeta potential, and PDI. The polynomial equations derived from this data were then used to generate 2D contour and 3D response surface plots, which aligned well with the predicted outcomes from the equations.
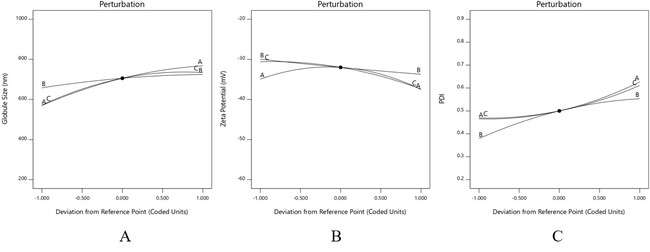
Fig. 5: Perturbation plot for globule size (A), Zeta potential (B), PDI (C), the polynomial equations generated were used to create 2D contour plots and 3D response surface plots, which closely matched and confirmed the results predicted by the equations

Fig. 6: 2D contour plot (A) and 3D response surface plots (B) for globule size
The effect on globule size is predominantly controlled by phospholipids rather than SDC (fig. 6). At concentrations above 85 % of phospholipids, Globule size is expected to decrease, i.e., at higher phospholipids and lower amounts of edge activator. The interaction plot indicates that both factors play a role in determining globule size, with a low interaction between them. Whereas, at a soy lecithin concentration below 85%, both factors exhibit a strong interplay of interactions that impact globule size.

Fig. 7: 2D contour plot and 3D response surface plots for zeta potential, for zeta potential, both factors contribute to imparting stability to the globules. Therefore, both factors are important in imparting stability to the dispersion (fig. 7)
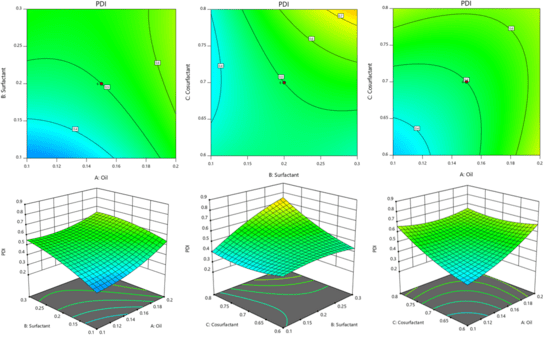
Fig. 8: 2D contour plot and 3D response surface plots for PDI
Like globule size, the impact of both factors is evident in PDI (fig. 8). The effect is more significant when the amount of phospholipids and edge activator is increased beyond 85 mg and 15 mg, respectively. Although the impact is less significant, it is similar when the concentration of both factors decreases linearly.
Optimized formulation and validation studies
The optimized overlay plot was generated using Design of Experiments (DoE) software, as shown in fig. 9. According to the CCD model, the predicted particle size was 325.668 nm, the zeta potential was -29.37 mV, and the PDI was 0.252. Using a graphical optimization approach, the optimal formulation was identified as having an oil, surfactant, and co-surfactant ratio of 0.1:0.1:0.8. The fig. highlights this optimized formulation within the designated optimal area of the overlay plot. A comparison between the experimental and predicted results, along with the percentage error, is presented in table 9. The percentage errors ranged between % and %, staying comfortably within ±10%. These results demonstrate that most of the predicted values closely matched the experimental data, highlighting the strong predictive power of the experimental design used for optimizing the SNEDDS formulation.

Fig. 9: Overlay plot indicating the location of optimized SNEDDS formulation
Characterization of globule size, zeta potential, and PDI
Table 9: Validation of experimental results with predicted values and percentage error
| Response | Predicted value | Average experimental value | % Error |
| Globule size (nm) | 325.66 | 329.5 | 1.17% |
| Zeta potential (mV) | -29.37 | -29.7 | 1.12% |
| PDI | 0.25 | 0.239 | -4.4% |
Entrapment efficiency
The entrapment efficiency evaluated by UV spectrophotometry comes out to be 60.66%.
HPTLC study
The HPTLC analysis of T. arjuna bark extract and its SNEDDS formulation revealed clear separation of three key phytoconstituents-gallic acid, quercetin, and arjunolic acid-with consistent retention factor (Rf) values around 0.50–0.55, confirming the specificity and reproducibility of the chromatographic method. The area under the curve (AUC) values were used to estimate the relative concentrations of these compounds. For gallic acid (Rf = 0.50), the extract showed a higher AUC (252.0) compared to SNEDDS (236.0), translating to 0.090% and 0.013% content, respectively. This suggests that gallic acid is better retained in the raw extract than in the formulation. In the case of quercetin (Rf = 0.50), despite its low reference AUC (26.0), the extract exhibited a significantly higher content (0.042%) than the SNEDDS (0.0007%), indicating potential degradation or poor entrapment during the formulation process. Arjunolic acid, with an Rf of 0.55, also showed a prominent difference; its AUC in the extract was 454.7 (0.268%), whereas in SNEDDS, it was only 26.6 (0.0024%). Overall, the higher AUCs and % content in the extract across all three markers indicate a likely reduction in phytoconstituent concentration in the SNEDDS, possibly due to formulation losses, lower entrapment efficiency, or interference from the delivery matrix (fig. 10).
RESULTS
The collected samples were filtered and analyzed for drug concentration at 207 nm using a UV-visible spectrophotometer, with appropriate blanks used for comparison (fig. 11). The maximum amount of drug release is calculated as 96.89% for SNEDDS and 62.28% for extract.
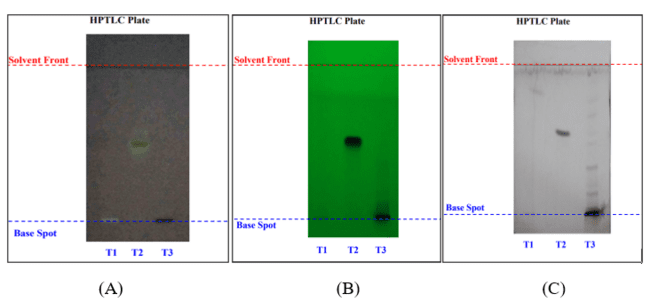
Fig. 10: HPTLC of SNEDDS and extract: (A) Gallic acid, (B) Quercetin and (C) Arjunolic acid
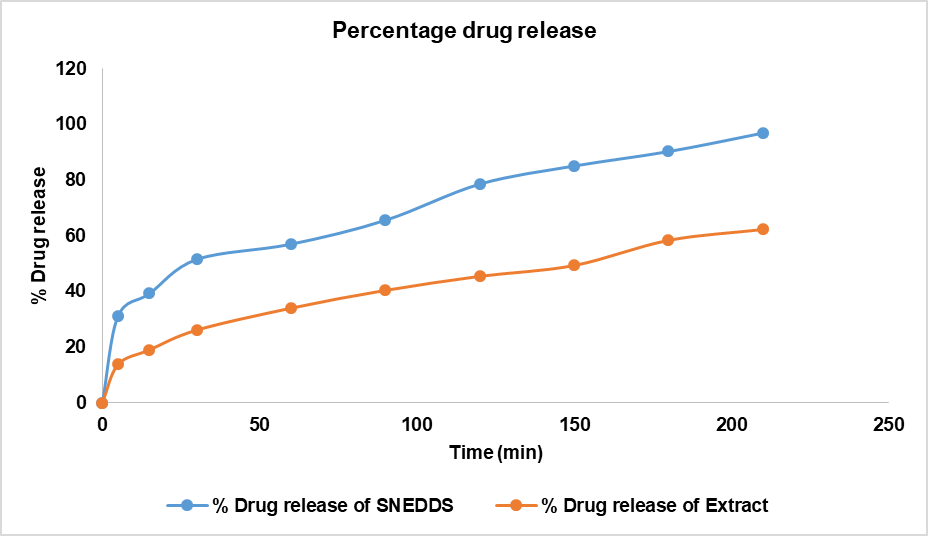
Fig. 11: In vitro drug release studies of SNEDDS vs extract
SEM (Scanning electron microscope)
The scanning electron microscope image of the SNEDDS loaded with T. arjuna extract (fig. 12) at 200,000x magnification showed particles ranging in size from 81.1 nm to 164 nm, with an average size of 117.57 nm (fig. 12). The decrease in size is expected due to dehydration of globules, showing the collapsed structure of the globule. Whereas the actual globule size, as in Gastrointestinal (GI)-like conditions, is represented by the Malvern Nano Zetasizer as mentioned previously.

Fig. 12: SEM image of SNEDDS loaded with the extract of T. arjuna
Table 10: Stability study of T. arjuna SNEDDS
| Accelerated stability study (temp: 40± 2 °C,75 ±5% RH) | (Mean±SD)# | |||
| S. No. | Parameters | 0 Mo | 3rd Mo | |
| Organoleptic analysis | ||||
| 1 | Description | Brown coloured, transparent liquid | Brown coloured, transparent liquid | _ |
| 2 | Odour | Characteristic | Characteristic | |
| Physico-chemical analysis | ||||
| 1 | Specific Gravity | 1.000 | 0.990 | 0.995±0.007 |
| 2 | pH (Direct) | 9.04 | 8.95 | 8.995±0.06 |
| 3 | Viscosity by ostwald | 0.79 cps | 0.76cps | 0.775±0.02 |
| Instrumental analysis | ||||
| 1 | %Quercetin by HPTLC | 0.00007% | 0.00006% | 0.000065±0.000005 |
| 2 | % Gallic acid by HPTLC | 0.0013% | 0.0011% | 0.0012±0.000141 |
| 3 | % Arjunolic acid by HPTLC | 0.00024% | 0.00023% | 0.00235±0.000071 |
| Microbiological analysis | ||||
| 1 | Total microbial plate count | 290 cfu/g | <105cfu/g | _ |
| 2 | Total Yeast and Mold Count | Absent | Absent | _ |
| 3 | Staphylococcus aureus | Absent | Absent | _ |
| 4 | Salmonella sp. | Absent | Absent | _ |
| 5 | Pseudomonas aeruginosa | Absent | Absent | _ |
| 6 | Escherichia coli | Absent | Absent | _ |
| Kewword: API–Ayurvedic Pharmacopoeia of India; %-Percentage w/w, ppm-Parts per million, NA–Not applicable, ND-Not detected, cfu/gm– Colony forming unit per g | ||||
#Sample size (n) =3
There were no observable changes in organoleptic properties, such as color and odor. Physico-chemical parameters, including specific gravity, pH, and viscosity (table 10). Specific gravity decreased from 1.000 to 0.990, likely due to thermal expansion or evaporation of volatile components. pH dropped marginally from 9.04 to 8.95, which is still within the acceptable range, suggesting minimal chemical degradation.
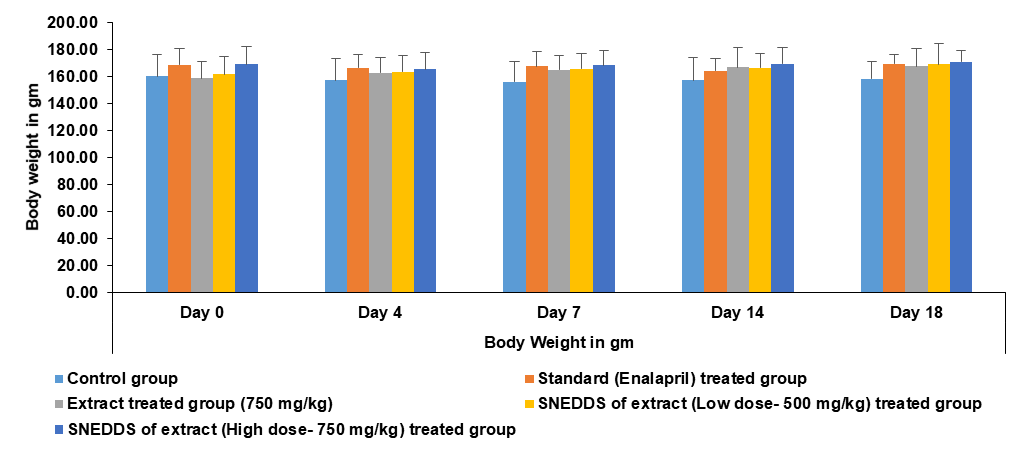
Fig. 13: Effect of different treatments on body weight of rats: Data represented by mean±SEM, (n=3)
Animal study
Physical parameters
The following results were obtained after evaluating body weight and Blood pressure.
Body weight
The statistical data shown in the graph indicates that none of the groups experienced any significant changes due to the treatment. From day 0 to day 18, the body weight of all the rats remained nearly the same. Throughout the treatment period, no noticeable impact on their weight was observed. The slight weight gain suggests that the rats remained healthy and that the treatment did not cause any harmful effects (fig. 13).
Systolic blood pressure assessment
The symbols*, **, and *** represent statistically significant differences compared to the control group, with p-values of<0.05, <0.01, and<0.001, respectively. On day 14, significant differences were seen in the standard treatment group (Enalapril) and the high-dose SNEDDS extract group (750 mg/kg), while the other two groups showed no significant changes. By day 18, all treatment groups demonstrated significant differences compared to the control (fig. 14). The standard drug and the high-dose SNEDDS extract groups showed the most pronounced effects, whereas the extract alone and the low-dose SNEDDS group (500 mg/kg) showed a slightly milder response. These results indicate that even at higher doses, the test drug did not cause any harmful effects, suggesting that it is both safe and effective.
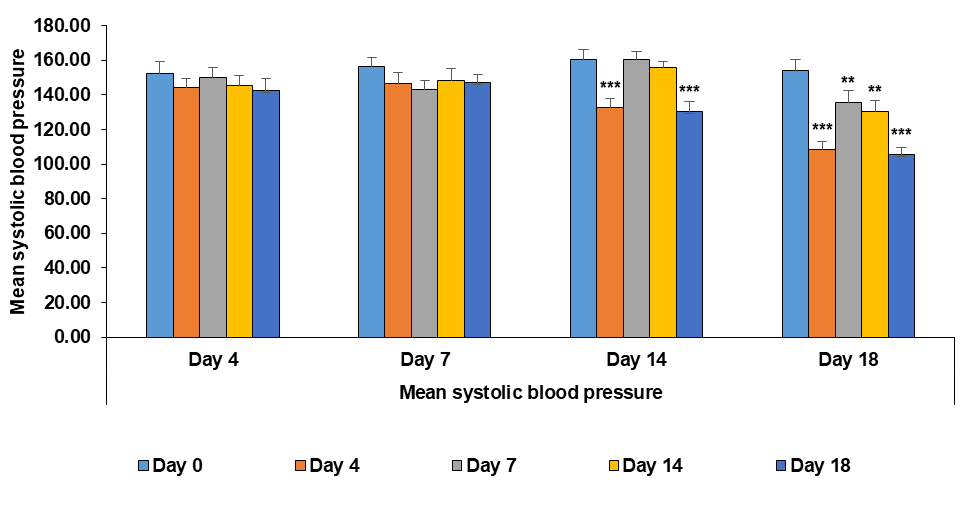
Fig. 14: Effect of different treatments on systolic blood pressure of wistar rats after the induction of hypertension: data represented by means±SEM (n=3). Statistical significance level was considered as p<0.05(*), p<0.01(**) and p<0.001 (***)
DISCUSSION
The study investigates the formulation and characterization of a self-nanoemulsifying drug delivery system (SNEDDS) using a methanolic extract of T. arjuna, with a focus on its potential to enhance the bioavailability and therapeutic efficacy of the extract [21]. SNEDDS represents a promising strategy in pharmaceutical formulation, particularly for poorly soluble compounds, as they facilitate the absorption of the active ingredients by promoting a fine, stable emulsion upon contact with gastrointestinal fluids [22]. In this research, the SNEDDS formulation was optimized using a reference ratio of the oil (Labrafil), surfactant (Tween 80), and co-surfactant (Transcutol P). The resulting formulation displayed a globule size of 325.66 nm, a polydispersity index (PDI) of 0.252, and a zeta potential of -29.7 mV. These parameters indicate a stable and homogenous emulsion system, which is critical for optimized pharmacokinetic parameters in vivo. The in vitro drug release study further substantiates the efficacy of the SNEDDS formulation, demonstrating a remarkable 96.89% drug release compared to 62.28% for the methanolic extract alone. The improvement in release profiles of SNEDDS formulations could be due to the enhanced solubility and permeability of the active compounds compared to traditional formulations [23-25]. Accelerated stability studies conducted under controlled conditions (40±2 °C and 75±5% relative humidity) over a three-month period revealed no significant changes in the characteristics of both fresh and aged formulations. Findings from multiple studies underscore the therapeutic potential of SNEDDS-based formulations in the management of hypertension. The collective findings from SNEDDS formulations of ginger extract demonstrated significantly improved antihypertensive activity compared to the crude extract [26]. Meanwhile, SNEDDS loaded with the major metabolites of Psiadia paniculata showed potent blood pressure-lowering effects through vasodilation and a reduction in peripheral resistance, without inducing reflex tachycardia [27]. Comparative SNEDDS containing T. arjuna extract exhibited enhanced therapeutic efficacy and safety, even at high doses, with results comparable to standard drugs. The results demonstrate significant differences between treatment groups by day 18, indicating that the SNEDDS extract exhibits enhanced therapeutic effects relative to controls. Notably, the high-dose SNEDDS group and the standard drug group exhibited pronounced effects, indicating that the extract's bioactivity was enhanced when delivered through the SNEDDS system. Notably, the safety of the test drug was affirmed as the extract did not induce harmful effects, even at higher doses. Together, these studies highlight the SNEDDS system as a promising nano-pharmaceutical platform that enhances the bioactivity and safety of natural compounds, offering effective and potentially safer alternatives for treating hypertensive conditions.
CONCLUSION
The comprehensive studies carried out demonstrated that the UV absorption analysis effectively confirmed the presence of essential phytoconstituents in both the extract and the SNEDDS formulation, ensuring their successful incorporation. Characterization work, guided by the Design of Experiments (DoE), helped optimize the formulation to achieve ideal particle size, zeta potential, and overall stability. The in vitro drug release tests showed a steady and controlled release from the SNEDDS, suggesting improved bioavailability. Accelerated stability testing demonstrated that the optimized SNEDDS retained its key physicochemical properties even under stress conditions, indicating a favorable shelf life. Additionally, animal studies confirmed that the SNEDDS formulation is both safe and effective, producing significant antihypertensive effects without negatively affecting body weight or general health. Taken together, these results demonstrate that the developed SNEDDS is a promising, stable, and safe delivery system for T. arjuna stem bark extract.
ABBREVIATIONS
Terminalia arjuna: T. arjuna, Self-Nanoemulsifying Drug Delivery System: SNEDDS, Nanometers: nm, Millivolts: mV, Poly Dispersity Index: PDI, Milliliters: ml, Milligram: mg, Kilogram: kg, Biopharmaceutics Classification System: BCS, Thin-layer chromatography: TLC, Rotations per minute: rpm, Ultra-violet: UV, Quality by Design: QbD, Response Surface Methodology: RSM, Central Composite Design: CCD, Critical quality attributes: CQAs, High Performance Thin Layer Chromatography: HPTLC, Retention factor: Rf, Simulated intestinal fluid: SIF, Scanning Electron Microscopy: SEM, Central Instrumentation Facility: CIF, Micrometer: μm, Volume/volume: v/v, Gram: gm, Colony Forming Units: CFU, Eosin Methylene Blue Aga: EMB agar, Xylose Lysine Deoxycholate Agar: XLDA Agar, Triple Sugar Iron Agar Slant: TSI Slant, Institutional Animal Ethics Committee: IAEC,Male: M, Thin-layer Chromatography: TLC, Design of Experiments: DoE, Analysis of Variance: ANOVA, Area under the curve: AUC, Minutes: min, Gastrointestinal: GI, Standard Deviation: SD, Ayurvedic Pharmacopoeia of India: API, Percentage: %, Parts per million-ppm, Not applicable: NA, Not detected: ND, Colony-forming unit per g: cfu/gm, Figure: Fig.
FUNDING
Nil
AUTHORS CONTRIBUTIONS
Pankaj: Original manuscript writing, MV: Supervision and data analysis, SKS: Data representation and visualization, PK: Editing and reviving of manuscript
CONFLICT OF INTERESTS
Declared none
REFERENCES
Singh P, Sharma D, Singh A, Singh A. A comprehensive review for drug target on Terminalia arjuna (roxb.): ethnopharmacological, phytochemical, pharmacognostical and clinical significance. Asian J Res Chem. 2023 Nov 28;16(6):448-52. doi: 10.52711/0974-4150.2023.00074.
Ameta RK, Soni K, Bhattarai A. Recent advances in improving the bioavailability of hydrophobic/lipophilic drugs and their delivery via self-emulsifying formulations. Colloids Interfaces. 2023 Feb 17;7(1):16. doi: 10.3390/colloids7010016.
Jain AK, Jain S, Abourehab MA, Mehta P, Kesharwani P. An insight on topically applied formulations for management of various skin disorders. J Biomater Sci Polym Ed. 2022 Dec 12;33(18):2406-32. doi: 10.1080/09205063.2022.2103625, PMID 35848901.
Kesharwani P, Sheikh A, Abourehab MA, Salve R, Gajbhiye V. A combinatorial delivery of survivin targeted siRNA using cancer-selective nanoparticles for triple negative breast cancer therapy. J Drug Deliv Sci Technol. 2023 Feb;80:104164. doi: 10.1016/j.jddst.2023.104164.
Date AA, Desai N, Dixit R, Nagarsenker M. Self-nanoemulsifying drug delivery systems: formulation insights, applications and advances. Nanomedicine (Lond). 2010 Dec 14;5(10):1595-616. doi: 10.2217/nnm.10.126, PMID 21143036.
Liu Z, Parveen N, Rehman U, Aziz A, Sheikh A, Abourehab MA. Unravelling the enigma of siRNA and aptamer-mediated therapies against pancreatic cancer. Mol Cancer. 2023 Jan 12;22(1):8. doi: 10.1186/s12943-022-01696-5, PMID 36635659.
Stegemann S, Leveiller F, Franchi D, De Jong H, Linden H. When poor solubility becomes an issue: from early stage to proof of concept. Eur J Pharm Sci. 2007 Aug;31(5):249-61. doi: 10.1016/j.ejps.2007.05.110, PMID 17616376.
Merisko Liversidge EM, Liversidge GG. Drug nanoparticles: formulating poorly water-soluble compounds. Toxicol Pathol. 2008 Jan 1;36(1):43-8. doi: 10.1177/0192623307310946, PMID 18337220.
Ateeq MA, Aalhate M, Mahajan S, Kumar GS, Sen S, Singh H. Self nanoemulsifying drug delivery system (SNEDDS) of docetaxel and carvacrol synergizes the anticancer activity and enables safer toxicity profile: optimization and in vitro ex vivo and in vivo pharmacokinetic evaluation. Drug Deliv Transl Res. 2023 Oct 17;13(10):2614-38. doi: 10.1007/s13346-023-01342-7, PMID 37067745.
Mandal S, Patra A, Samanta A, Roy S, Mandal A, Mahapatra TD. Analysis of phytochemical profile of Terminalia Arjuna bark extract with antioxidative and antimicrobial properties. Asian Pac J Trop Biomed. 2013 Dec;3(12):960-6. doi: 10.1016/S2221-1691(13)60186-0, PMID 24093787.
Kazi M, Al Swairi M, Ahmad A, Raish M, Alanazi FK, Badran MM. Evaluation of self-nanoemulsifying drug delivery systems (SNEDDS) for poorly water-soluble talinolol: preparation in vitro and in vivo assessment. Front Pharmacol. 2019 May 2;10:459. doi: 10.3389/fphar.2019.00459, PMID 31118895.
Larsen AT, Ohlsson AG, Polentarutti B, Barker RA, Phillips AR, Abu Rmaileh R. Oral bioavailability of cinnarizine in dogs: relation to SNEDDS droplet size, drug solubility and in vitro precipitation. Eur J Pharm Sci. 2013 Jan;48(1-2):339-50. doi: 10.1016/j.ejps.2012.11.004, PMID 23178440.
Kavitha K, Kanagathara N. Optimization and solubilization study of novel nanoemulsion formulation for 5-fluorouracil by applying pseudoternary phase diagram. Asian J Pharm Clin Res. 2014;7(2):137-9.
Katoch P, Singh R, Kaur P, Vyas M, Gulati M, Singh S. Development and characterization of self-nanoemulsifying drug delivery system loaded with fixed oil of Semecarpus anacardium linn. Asian J Pharm. 2016 Jun 28;10(2):144-53. doi: 10.22377/ajp.v10i2.614.
Ishak W WM, Zulfakar MH. Optimization development and safety evaluation of olive oil nanoemulsion for topical application: a response surface methodology. Asian J Pharm Clin Res. 2022 Sep 7;15(9):167–73. doi: 10.22159/ajpcr.2022.v15i9.45964.
Gupta S, Kesarla R, Omri A. Formulation strategies to improve the bioavailability of poorly absorbed drugs with special emphasis on self-emulsifying systems. ISRN Pharm. 2013 Dec 26;2013:848043. doi: 10.1155/2013/848043, PMID 24459591.
Inugala S, Eedara BB, Sunkavalli S, Dhurke R, Kandadi P, Jukanti R. Solid self-nanoemulsifying drug delivery system (S-SNEDDS) of Darunavir for improved dissolution and oral bioavailability: in vitro and in vivo evaluation. Eur J Pharm Sci. 2015 Jul;74:1-10. doi: 10.1016/j.ejps.2015.03.024, PMID 25845633.
Laxmi M, Bhardwaj A, Mehta S, Mehta A. Development and characterization of nanoemulsion as carrier for the enhancement of bioavailability of artemether. Artif Cells Nanomed Biotechnol. 2015;43(5):334-44. doi: 10.3109/21691401.2014.887018, PMID 24641773.
Farooqui H, Upadhyay S, Upadhyay P. Transdermal patches approach towards self-nano-emulsifying drug delivery system (SNEDDS) using essential oil as penetration enhancer. Micro Nanosystems. 2022 Dec;14(4):314-40. doi: 10.2174/1876402914666220221105304.
Soto Pina AE, Franklin C, Rani CS, Gottlieb H, Hinojosa Laborde C, Strong R. A novel model of dexamethasone-induced hypertension: use in investigating the role of tyrosine hydroxylase. J Pharmacol Exp Ther. 2016 Sep;358(3):528-36. doi: 10.1124/jpet.116.234005, PMID 27405316.
Ramesh P, Palaniappan A. Terminalia arjuna a cardioprotective herbal medicine relevancy in the modern era of pharmaceuticals and green nanomedicine a review. Pharmaceuticals (Basel). 2023 Jan;16(1):126. doi: 10.3390/ph16010126, PMID 36678623.
Baloch J, Sohail MF, Sarwar HS, Kiani MH, Khan GM, Jahan S. Self-nanoemulsifying drug delivery system (SNEDDS) for improved oral bioavailability of chlorpromazine: in vitro and in vivo evaluation. Medicina (Kaunas). 2019 May;55(5):210. doi: 10.3390/medicina55050210, PMID 31137751.
Buya AB, Beloqui A, Memvanga PB, Preat V. Self-nano-emulsifying drug-delivery systems: from the development to the current applications and challenges in oral drug delivery. Pharmaceutics. 2020 Dec;12(12):1194. doi: 10.3390/pharmaceutics12121194, PMID 33317067.
Cherniakov I, Domb AJ, Hoffman A. Self-nano-emulsifying drug delivery systems: an update of the biopharmaceutical aspects. Expert Opin Drug Deliv. 2015 Jul 3;12(7):1121-33. doi: 10.1517/17425247.2015.999038, PMID 25556987.
Zafar F, Jahan N, Khalil Ur Rahman AM, Asi M, Zafar WU. Nanosuspension enhances dissolution rate and oral bioavailability of Terminalia arjuna bark extract in vivo and in vitro. Asian Pac J Trop Biomed. 2020;10(4):164. doi: 10.4103/2221-1691.280293.
Prihapsara F, Ifrian Wijayanti I, Budiharjo A, Pangastut A, Nur Artanti A. Characterization and antihypertensive activity of ginger extract-eel bone oil SNEDDS (self-nanoemulsifying drug delivery system). Pharm Sci Asia. 2021;48(1):90-8. doi: 10.29090/psa.2021.01.19.120.
Abdallah HM, El Bassossy HM, El Halawany AM, Ahmed TA, Mohamed GA, Malebari AM. Self-nanoemulsifying drug delivery system loaded with Psiadia punctulata major metabolites for hypertensive emergencies: effect on hemodynamics and cardiac conductance. Front Pharmacol. 2021;12:681070. doi: 10.3389/fphar.2021.681070, PMID 34177590.