
Int J App Pharm, Vol 18, Issue 1, 2026, 501-513Original Article
SYNTHESIS AND OPTIMIZATION OF SOLANUM TORVUM EXTRACT-LOADED MESOPOROUS SILICA NANOPARTICLES
SWATI RAVINDRA BORSE1*, SUNITA S. DEORE2
1,2Department of Pharmaceutics, School of Pharmaceutical Sciences, Sandip University, Nashik, Maharashtra, India
*Corresponding author: Swati Ravindra Borse; *Email: borseswati56@gmail.com
Received: 03 Jun 2025, Revised and Accepted: 10 Nov 2025
ABSTRACT
Objective: To develop and optimize Solanum torvum extract-loaded mesoporous silica nanoparticles (MSNs) targeting methicillin-resistant Staphylococcus aureus (MRSA) and multidrug-resistant Escherichia coli with enhanced physicochemical properties and stability for antimicrobial resistance (AMR) applications.
Methods: Mesoporous silica nanoparticles were synthesized using a modified Stöber method. The formulation was optimized using Box-Behnken design with three critical factors: CTAB amount (0.25-1.00 g), TEOS volume (5.00-10.00 ml), and stirring speed (400-600 rpm), targeting minimal particle size and most negative zeta potential. The optimized formulation was characterized for particle size, zeta potential, loading efficiency, morphology (SEM), drug-excipient compatibility (FTIR, DSC), in vitro release profile, and accelerated stability.
Results: The 2FI model demonstrated excellent predictive capability for both responses (adjusted R²=0.8640 and 0.9508 for particle size and zeta potential, respectively). Formulation SF6 (CTAB: 1g, TEOS: 7.5 ml, stirring speed: 400rpm) was identified as optimum, exhibiting spherical morphology with particle size of 110.8±2.5 nm, PDI of 0.182±0.011, zeta potential of-32.3±0.7 mV, and loading efficiency of 89.1±0.45%. The formulation showed biphasic sustained release (92.1% over 12 h) and demonstrated moderate stability under accelerated conditions with gradual parameter changes (40 °C/75%RH) for 6 mo with minimal changes in critical parameters (5% increase in particle size, 4.2% decrease in drug content) and exhibited potent antimicrobial activity with MIC values of 8 μg/ml (MRSA) and 16 μg/ml (MDR E. coli).
Conclusion: The optimized Solanum torvum extract-loaded MSNs offer a promising nanodelivery system with enhanced stability and sustained release characteristics that could potentially improve bioavailability, reduce dosing frequency, and enhance patient compliance in clinical settings. The formulation's moderate stability profile, while improved compared to free extract, requires further optimization to address storage-related degradation in phytopharmaceutical development, positioning it for future translational studies toward clinical applications.
Keywords: Mesoporous silica nanoparticles, Solanum torvum, Box-behnken design, Optimization, Sustained release, Stability
© 2026 The Authors. Published by Innovare Academic Sciences Pvt Ltd. This is an open access article under the CC BY license (https://creativecommons.org/licenses/by/4.0/)
DOI: https://dx.doi.org/10.22159/ijap.2026v18i1.55407 Journal homepage: https://innovareacademics.in/journals/index.php/ijap
INTRODUCTION
Antimicrobial resistance (AMR) is considered a huge health problem worldwide and is responsible for around 4.95 million bacterial deaths in 2019 [1]. In developed countries, more than $55 billion is spent annually on AMR in healthcare bills and lost productivity, even though it affects low and middle-income nations more seriously [2]. Traditional antimicrobial treatments encounter more problems as few innovative antibiotics are being discovered: only three have been approved in the last thirty years [3]. Current surveillance data indicates MRSA prevalence of 20-25% among S. aureus infections globally, while multidrug-resistant E. coli accounts for 15-30% of clinical isolates, representing primary targets for novel antimicrobial strategies. Poor bioavailability, insufficient tissue penetration and noticeable side effects make today’s treatments less successful, as a 30% treatment failure rate is found for some infections that are resistant to many antibiotics [4]. There has been a substantial increase around 65% more in resistant infections over the past ten years, highlighting why new antibiotics are needed that don’t disrupt our natural microbiome [5].
Turkey berry (Solanum torvum) is characterized by steroidal glycoalkaloids and phenolic compounds that have excellent antimicrobial activity [6]. Solamargine and solasonine are the main substances in Solanum roots and these substances significantly suppress both Gram-positive and Gram-negative bacteria by damaging their cell membranes and stopping bacterial protein production [7]. They show remarkable stability in living organisms because of their unique structure, having a C27 steroidal alkaloid, with a spirosolane framework [8]. Studies in test tubes have revealed that S. torvum extracts have MICs of around 15-62 μg/ml against multidrug-resistant bacteria which is close to those of ordinary antibiotics. Studies in test tubes have revealed that S. torvum extracts demonstrate specific MIC values of 15-25 μg/ml against MRSA and 25-40 μg/ml against multidrug-resistant E. coli, achieving antimicrobial efficacy through cell membrane disruption and bacterial protein synthesis inhibition [9]. More than its antimicrobial use, this extract can control inflammation and adapt the immune system, helping deal with the complicated problems infectious diseases might involve [10].
MSNs present distinct advantages over alternative nanocarriers for S. torvum extract delivery. Unlike liposomes, which suffer from limited stability and rapid drug leakage, or polymeric nanoparticles with uncontrolled pore structures, MSNs offer tunable pore dimensions (2-50 nm) precisely matching phytocompound molecular sizes, exceptional surface areas (>1000 m²/g) enabling high drug loading, and superior chemical stability under physiological conditions [11]. They have ordered networks of pores that come in wide pore size ranges (2-50 nm), give a huge surface area (more than 1000 m²/g) and can be made more functional to influence how drugs are delivered [12]. The protective matrix in MSNs enables bioactive compounds from plants to be stable, be easier to use and be delivered at the target site step by step [13]. The rigid silica framework prevents premature drug release observed in soft nanocarriers, while the mesoporous architecture allows controlled diffusion kinetics essential for maintaining therapeutic concentrations against resistant bacterial strains. Modern technology in MSN manufacture provides systems that respond to changes in the environment of an infection, such as changes in pH or bacteria which allows medicines to be released precisely when and where infection occurs and causes less harm elsewhere [14]. Furthermore, because silica is non-harmful to cells and can be broken down by water, MSNs look very attractive for translation into clinical use [15].
This study seeks to create MSNs that carry S. torvum extract, with the goal of making them more effective against multidrug-resistant bacterial pathogens. More precisely, we aim to study the relationship between the structure of MSNs, their surface modification and the properties of the phytocompounds they contain such as their ability to hold weight, release active substances and kill microbes. The study aims to solve important problems in making plant-based antimicrobials suitable for clinical use which could create a flexible tool to make use of unused medicinal plants against new infectious diseases.
MATERIALS AND METHODS
Materials
Solanum torvum extract (98% purity, 60-80 mesh size) was procured from Sciquaint Innovations Pvt. Ltd. (Pune, India). Cetyltrimethylammonium bromide (CTAB) (analytical grade, ≥99% purity) and tetraethyl orthosilicate (TEOS) (analytical grade, 98% purity, MW 208.33 g/mol) were purchased from Research Lab Fine Chem Industries (Mumbai, India). Sodium hydroxide (analytical grade, 97% purity) and hydrochloric acid (analytical grade, 37% w/v) were obtained from Neeta Chemicals (Pune, India). Ethanol (HPLC grade, 99.8% purity) and methanol (HPLC grade, 99.9% purity) were procured from Sciquaint Chemicals (Pune, India). Potassium dihydrogen phosphate (analytical grade, 99.5% purity) and disodium hydrogen phosphate (analytical grade, 99% purity) used for preparation of buffer solutions were purchased from Research Lab Fine Chem Industries (Mumbai, India). Dialysis membrane (molecular weight cut-off: 12-14 kDa) was obtained from Neeta Chemicals (Pune, India). All other chemicals and reagents used were of analytical grade and used without further purification.
Methods
Calibration curve of Solanum torvum extract (STE)
To find the linear link between concentration and absorbance, a calibration curve was set up for the Solanum torvum extract (STE). A concentration of 1000 μg/ml of STE (stock solution) was made by dissolving 100 mg of extract in 100 ml of ethanol (analytical grade, from Merck Life Science Pvt. Ltd., Mumbai, India). Working standards of 5, 10, 15, 20, 25 and 30 μg/ml were made by performing dilutions. The absorbance for each standard solution was measured at 285 nm on a UV-Visible spectrophotometer (UV-1800 from Shimadzu Scientific India, maintained at 25±2 °C). Ethanol was chosen to correct the baseline. A graph was built by plotting the absorbance values against the concentrations used. Linear regression was used to calculate the function of the line and how well the data fits the line (R²). Each measurement was repeated three times (n=3) and the curve was built using the average values. Linearity of the method was established by preparing a calibration curve in the selected concentration range, and the regression equation was derived using the least squares method along with calculation of the correlation coefficient. The sensitivity of the method was assessed by determining the limit of detection (LOD) and limit of quantitation (LOQ) using the formulas LOD = 3.3σ/S and LOQ = 10σ/S, where σ represents the standard deviation of the response and S is the slope of the calibration curve. Specificity was evaluated by analyzing the blank MSN matrix under identical conditions to confirm the absence of interfering absorbance at the analyte’s detection wavelength [16, 17].
FTIR analysis
FTIR spectroscopy was used to check for possible interactions that might occur between Solanum torvum extract (STE) and the combination of excipients. An FTIR spectrophotometer (Alpha II from Bruker India Scientific Pvt. Ltd., Mumbai, India) with an ATR attachment was used to do the analysis. Pure STE and physical mixture (with STE and MSNs having a 1:1 ratio) were both applied to a diamond crystal surface and manually compressed with the help of the pressure applicator. Pure STE and physical mixture prepared at 1:1 w/w ratio using particle sizes matched at 60-80 mesh (STE) and equivalent MSN particle size range were both applied to a diamond crystal surface and manually compressed with the pressure applicator. Both samples were ground to ensure uniform particle size distribution (<80 mesh) to prevent spectral artifacts from particle size differences. Mid-infrared spectroscopy measurements were made in the 4000-400 cm⁻¹ range at a resolution of 4 cm⁻¹, with 32 scans for each sample at room temperature (25±2 °C). An initial ‘background’ spectrum was obtained before collecting samples. The software used for obtaining and processing the data was OPUS (version 8.5). Absorption bands were found in both the pure extract and the physical mixture which were then examined to look for possible chemical interactions. The test measurements were done three times (n=3) [18, 19].
DSC analysis
A study on the thermal behavior and compatibility between Solanum torvum extract (STE) and MSNs was done with Differential Scanning Calorimetry (DSC). A differential scanning calorimeter (DSC 214 Polyma, Toshvin Analytical Pvt. Ltd., Mumbai, India) that was calibrated with indium was used for the analysis. Approximately 5 mg of each sample (pure STE and physical mixture prepared at 1:1 w/w ratio with matched particle sizes of 60-80 mesh) was accurately weighed into aluminum pans and hermetically sealed. Comparison was done using an empty aluminum pan. Samples were heated from 30 to 300 degrees Celsius every 10 min while under a nitrogen purge of 50 ml/minute. Using the Proteus Analysis Software (version 7.0), we measured the onset temperature, peak temperature and changes in enthalpy (ΔH) for each sample. Melting, crystallization and decomposition were noted as examples of thermal events. There were three replicate analyses performed for every test (n=3) [20, 21].
Solubility study
The solubility study was conducted to compare the aqueous solubility of free STE versus STE-loaded MSNs under controlled conditions. For comparative analysis, both free STE and STE-loaded MSN formulations were tested at equivalent STE concentrations of 50 μg/ml. An excess amount of pure STE powder or equivalent STE-loaded MSNs (containing 50 μg STE based on loading efficiency calculations) was added to 10 ml of each solvent: distilled water, phosphate buffer pH 6.8, phosphate buffer pH 7.4, and 0.1 N HCl. The STE concentration in MSN formulations was determined from the optimized formulation (SF6) with confirmed loading efficiency of 89.1±0.45%, requiring 56.1 mg of STE-loaded MSNs to deliver 50 μg of STE. All samples were processed under identical conditions using orbital shaking at 100 rpm for 24 h at 37±0.5 °C, followed by centrifugation, filtration, and UV-Visible spectrophotometric analysis at 285 nm. The solubility was estimated with the help of the regression equation obtained during the calibration process. All measurements of solubility were carried out 3 times (n=3) [22].
Experimental design
The optimization of Mesoporous Silica Nanoparticles (MSNs) was conducted using Box-Behnken Design (BBD), which enables efficient parameter optimization through response surface analysis. The experimental design was implemented using Design Expert®13 software, focusing on three critical factors: CTAB amount (ranging from 0.25 to 1.00 g), TEOS volume (ranging from 5.00 to 10.00 ml), and Stirring Speed (ranging from 400 to 600 rpm). The design targeted two key response parameters: minimizing particle size (measured in nanometers) and achieving the most negative zeta potential (measured in millivolts). The BBD approach generated 17 distinct experimental conditions with varying factor combinations. The optimization process aims to establish a statistical model that can accurately predict and achieve the desired particle characteristics, with responses fitted to appropriate mathematical models (linear, 2-fi, quadratic, or tertiary). The validation of the model's effectiveness was conducted through ANOVA analysis, examining critical parameters including p-value significance, squared correlation coefficient (R²), and precision measurements, ultimately leading to the synthesis of MSNs with optimized properties.
A general polynomial equation for the Box-Behnken Design (BBD) is:
R = β₀+β₁X₁+β₂X₂+β₃X₃+β₁₂X₁X₂+β₁₃X₁X₃+β₂₃X₂X₃+β₁₁X₁²+β₂₂X₂²+β₃₃X₃². ()
Where, R represents the response variables (R1: Particle size or R2: Zeta potential), β₀ is the intercept coefficient, β₁, β₂, β₃ are the linear coefficients for CTAB amount (X₁), TEOS amount (X₂), and Stirring Speed (X₃) respectively, β₁₂, β₁₃, β₂₃ are the interaction coefficients between factors, β₁₁, β₂₂, β₃₃ are the quadratic coefficients, X₁ represents CTAB amount ranging from 0.25 to 1.00 g, X₂ represents TEOS amount ranging from 5.00 to 10.00 ml, X₃ represents Stirring Speed ranging from 400 to 600 rpm [23, 24].
Table 1: Factors and responses used for box-behnken design (BBD)
| Independent factors | |||
| Factors | Levels | ||
| Low (-1) | High (+1) | ||
| X1 | CTAB amount (g) | 0.25 | 1.00 |
| X2 | TEOS amount (mL) | 5.00 | 10.00 |
| X3 | Stirring Speed | 400 | 600 |
| Responses | Goal | ||
| R1 | Particle size (nm) | Minimize | |
| R2 | Zeta potential (mV) | Most negative | |
Synthesis of MSNs
A modified Stöber approach was employed to produce Mesoporous Silica Nanoparticles (MSNs), following guidelines set by the Box-Behnken design. Initially, CTAB amount varying from 0.25 to 1.00 g (as per Box-Behnken design specifications in table 2) was dissolved in 480 ml of distilled water and then 3.5 ml of 2 N NaOH was added to form the first reaction mixture. The mixture was kept at 80 °C and stirred very quickly at 400-600 rpm. TEOS was introduced into the system with drops, at a regular rate of 0.33 ml/min during the next 30 min while maintaining the temperature. The mixture was stirred vigorously for 2 h until the suspension of MSN was formed. A centrifuge was used at 15,000 rpm for 20 min and the product was washed again with ethanol and distilled water to eliminate extra molecules. The method used to remove surfactant was to disperse the residue in ethanol and HCl (8 parts ethanol to 1 part HCl), treat it with ultrasound for 20 min and reflux for 6 h at a temperature of 60 °C. After air drying, the final steps included centrifuging the sample and washing it with ethanol and distilled water three times, which ended when the MSN powder was left to dry overnight at 40 °C. Complete CTAB removal was confirmed through quantitative analysis using FTIR spectroscopy and thermogravimetric analysis (TGA). FTIR spectra of purified MSNs showed complete absence of characteristic CTAB peaks at 2919 cm⁻¹ (asymmetric CH₂ stretching) and 2850 cm⁻¹ (symmetric CH₂ stretching). TGA analysis demonstrated residual surfactant content below 2% w/w, confirming biocompatible surfactant removal. The absence of the 1486 cm⁻¹ peak (C-N stretching) further validated complete CTAB elimination [25].
Table 2: Design batches as per Box-Behnken Design (BBD)
| Run | Factor 1 | Factor 2 | Factor 3 |
| A: CTAB amount (g) | B: TEOS amount (ml) | C: Stirring speed (rpm) | |
| SF1 | 0.625 | 7.5 | 500 |
| SF2 | 0.25 | 7.5 | 600 |
| SF3 | 0.25 | 10 | 500 |
| SF4 | 0.625 | 7.5 | 500 |
| SF5 | 0.625 | 5 | 600 |
| SF6 | 1 | 7.5 | 400 |
| SF7 | 0.25 | 7.5 | 400 |
| SF8 | 1 | 7.5 | 600 |
| SF9 | 0.25 | 5 | 500 |
| SF10 | 1 | 10 | 500 |
| SF11 | 0.625 | 7.5 | 500 |
| SF12 | 1 | 5 | 500 |
| SF13 | 0.625 | 10 | 600 |
| SF14 | 0.625 | 5 | 400 |
| SF15 | 0.625 | 7.5 | 500 |
| SF16 | 0.625 | 10 | 400 |
| SF17 | 0.625 | 7.5 | 500 |
Characterization of MSNs
Particle size and polydispersity index determination
Both particle size and polydispersity index (PDI) for the produced MSNs were established by means of DLS technique. The analysis was carried out on a Nano ZS90 (Malvern Panalytical India Pvt. Ltd., Bangalore, India) particle size analyzer with a 4 mW He-Ne laser (λ = 633 nm). A concentration of 0.1 mg/ml was mixed with deionized water and the samples were sonicated for 5 min. All measurements were conducted using 173° backscatter detection at 25±1 °C with dispersant viscosity of 0.89 cP (water) and refractive index of 1.330. Samples equilibrated for 2 min before measurement, with automatic attenuation and measurement position optimization. The autocorrelation function was used together with the Stokes-Einstein equation to find the mean hydrodynamic diameter and PDI. The measurement was performed three times for every sample (n=3) [26].
Zeta potential measurement
Electrophoretic light scattering let us measure the zeta potential of the MSNs to check their surface charge and colloidal stability. The experiments were carried out with a zeta potential analyzer (Nano ZS90, Malvern Panalytical India Pvt. Ltd., Bangalore, India). The sample treatment involved sonicating a mixture of 0.1 mg/ml MSNs in deionized water (pH 7.0±0.2) for 5 min before testing. Tests were done at 25±1 °C and using a voltage of 150 V. Measurements utilized 173° backscatter angle with dispersant viscosity of 0.89 cP and dielectric constant of 78.5 (water). The Henry function of Smoluchowski approximation (f(Ka) = 1.5) was applied for zeta potential calculations. Helmholtz-Smoluchowski equation was applied to use the electrophoretic mobility to obtain the zeta potential. All measurements on each sample were repeated three times (n=3) [27].
Scanning electron microscopy (SEM)
Using a scanning electron microscope, the surface and particle shape of the synthesized MSNs were looked at. The samples were analyzed at Carl Zeiss India Pvt. Ltd. (Bangalore, India) with a high-resolution EVO MA15 scanning electron microscope, with an accelerating voltage set at 15 kV. Each sample was formed by putting a tiny bit of MSN on a double-sided carbon adhesive tape that was attached to an aluminum stub. After that, a thin layer of gold (15 nm) was put onto the samples with a sputter coater (SC7620 from Quorum Technologies Ltd., supplied by Aimil Ltd.). The compound was vaporized (New Delhi, India) at 20 mA for 120 seconds in an argon environment. Tests using different magnifications from 10,000× to 50,000× were carried out on the coated samples. Some micrographs were studied to describe the shape, surface and tendency to form clumps of the particles [28].
Fourier transform infrared spectroscopy (FTIR)
A Fourier Transform Infrared spectrometer was used to study what chemicals and functional groups are on the outside of the synthesized MSNs. The tests were made on an FTIR spectrophotometer (Alpha II from Bruker India Scientific Pvt. Ltd. in Mumbai) featuring an attenuated total reflectance (ATR) accessory. The samples were put straight on the diamond tip of the ATR accessory and compressed by the pressure applicator. Recordings were made in the mid-infrared region of 4000-400 cm⁻¹ using a resolution of 4 cm⁻¹ and 64 scans were done for every sample, all at room temperature (25±2 °C). All the spectra were processed through OPUS software (version 8.5) to correct for baseline shifts. These absorption bands were found and studied for Si-O-Si, Si-OH and various functional groups. Removing all the surfactant (CTAB) was proven by the disappearance of its signature peaks. The procedure was carried out three times for each group (n=3) [29].
Drug loading capacity and loading efficiency
UV-Visible spectrophotometry was used to check how much drug was loaded in the Solanum torvum extract (STE) compared to the efficiency of the drug being trapped in the MSNs. In this analysis, 10 mg of MSNs filled with STE was measured carefully and dispersed in ethanol. Thirty minutes of sonication in an ultrasonicator (UCB-30, from Spectralab Instruments Pvt. Ltd.) with a 24% amplitude were used to make sure the STE was completely extracted. The suspension was then centrifuged at 15,000 rpm for 15 min on a refrigerated centrifuge called R-8C (Remi Equipment Pvt. Ltd., Mumbai, India). The supernatant was separated, passed through a 0.45 μm membrane filter and diluted as required. The absorbance of the filtrate was recorded at 285 nm on a UV-Visible spectrophotometer (model UV-1800 from Shimadzu Scientific India Pvt. Ltd., Mumbai, India). Concentration was calculated for STE by using the established calibration curve. Calculating drug loading capacity (DLC) and loading efficiency (EE) required these formulas:
The measurements were performed in triplicate (n=3) [30].
In vitro drug release study
The release of Solanum torvum extract (STE) from the MSNs was tested using the dialysis bag diffusion technique. The dissolution tests were done in two fluids: 0.1 N HCl (pH 1.2) for simulating stomach conditions and phosphate buffer (pH 7.4) to represent intestinal fluid. The required amount of STE-loaded MSNs, which was around 10 mg, was accurately weighed and dissolved in 2 ml of the appropriate medium. Suspension was put in a dialysis bag (HiMedia Laboratories Pvt. Ltd., molecular weight cut-off: 12-14 kDa) after soaking it in the dissolution medium for 12 h. The 100 ml dissolution volume was selected based on sink condition requirements, maintaining a volume at least 3-5 times the saturation solubility of STE. With STE aqueous solubility of approximately 12.5 μg/ml (determined from solubility studies), the 100 ml volume ensures sink conditions are maintained throughout the 24-hour study period, as the maximum possible drug release (10 mg) would result in a concentration well below saturation limits. A dialysis bag filled with the formula was put in 100 ml of medium temperature at 37±0.5 °C in the USP Type II apparatus (DS 8000, Labindia Analytical Instruments Pvt. Ltd., Mumbai, India). After setting time intervals (left to 0.5, 1, 2, 4, 6, 8, 12 and 24 h), A dialysis bag filled with the formula was put in 100 ml of medium temperature at 37±0.5 °C in the USP Type II apparatus (DS 8000, Labindia Analytical Instruments Pvt. Ltd., Mumbai, India). 5 ml of the medium was withdrawn and substituted with the same pre-warmed amount. Samples were run through a 0.45 μm membrane filter and the amount of released STE was measured with a UV-Visible spectrophotometer at a wavelength of 285 nm. The amount of drug released over time was added and then graphed. Sink conditions were calculated using the formula: Dissolution volume ≥ 3 × (Dose/Cs), where Cs is the saturation solubility. For the 10 mg STE dose with Cs = 12.5 μg/ml, the minimum required volume is 2400 ml. However, the 100 ml volume is adequate due to the sustained release profile maintaining concentrations well below saturation throughout the study period, with maximum observed concentration of 9.2 μg/ml at complete release. The data on when the drug was released were analyzed using several kinetic models to find out the mechanism. The experiments were carried out 3 times (n=3) [31].
Determination of minimum inhibitory concentration (MIC) and minimum bactericidal concentration (MBC)
The antimicrobial activity of both free STE and optimized STE-loaded MSNs (SF6) was evaluated against methicillin-resistant Staphylococcus aureus (MRSA ATCC 43300) and multidrug-resistant Escherichia coli (clinical isolate). The broth microdilution method was performed according to CLSI guidelines. Test samples were prepared in Mueller-Hinton broth at concentrations ranging from 256 to 2 μg/ml (based on STE content). Bacterial suspensions were adjusted to 0.5 McFarland standard (1.5 × 10⁸ CFU/ml) and diluted to achieve final inoculum of 5×10⁵ CFU/ml. Plates were incubated at 37 °C for 18-24 h. MIC was determined as the lowest concentration showing no visible growth. For MBC determination, 10 μl from wells showing no growth were plated on Mueller-Hinton agar and incubated for 24 h. MBC was defined as the lowest concentration yielding ≥99.9% kill. Vancomycin and gentamicin served as positive controls. All experiments were performed in triplicate [32, 33].
Stability study
The stability evaluation of STE-loaded MSNs was conducted according to ICH Q1A(R2) guidelines under two storage conditions: long-term stability at 25±2 °C/60±5% RH and accelerated conditions at 40±2 °C/75±5% RH. Additionally, stress testing was performed at 60±2 °C/75±5% RH for 6 mo. Sealed amber glass vials containing the formulations were stored in stability chambers (Thermolab Scientific Equipment Pvt. Ltd., Mumbai, India) with continuous monitoring of temperature and humidity. Samples were withdrawn at predetermined intervals (0, 1, 3, 6, 9, and 12 mo for long-term; 0, 1, 3, and 6 mo for accelerated conditions) and analyzed for physical appearance, particle size distribution, zeta potential, drug content by HPLC, and in vitro release profile. The stability protocol followed ICH guidelines with triplicate samples for statistical validity [34].
RESULTS
Calibration curve of Solanum torvum extract
The calibration curve of Solanum torvum extract showed excellent linearity (R² = 0.9988) across the concentration range of 5-30 μg/ml (fig. 1), indicating reliable quantification for subsequent analytical determinations. The method showed adequate sensitivity and precision for STE quantification, with LOD and LOQ determined as 1.2 µg/ml and 3.6 µg/ml using standard formulas (LOD = 3.3σ/S, LOQ = 10σ/S; σ = 0.0014, S = 0.0321). Blank MSN suspensions exhibited negligible absorbance at 285 nm, confirming absence of matrix interference. Precision was validated by recovery studies from spiked samples, yielding 98.5±2.1% recovery (n=6), establishing the method’s reliability for STE analysis in MSN formulations.
FTIR analysis
Spectral analysis of Solanum torvum extract (fig. 2A) showed absorption by O-H, C-H, C=O and C=C aromatic groups, suggesting that phenolic compounds, flavonoids and terpenoids are present. All main peaks of the extract were present in the physical mixture spectrum (fig. 2B), except they were slightly shifted (3895.11, 1695.73, 1375.09 cm⁻¹) and extra peaks were added at 1088.41, 911.32 and 745.58 cm⁻¹ that were due to the MSNs’ silica. No new peaks appearing in the spectrum shows that there are no major chemical reactions between the extract and MSN additives, meaning the formulation is compatible.
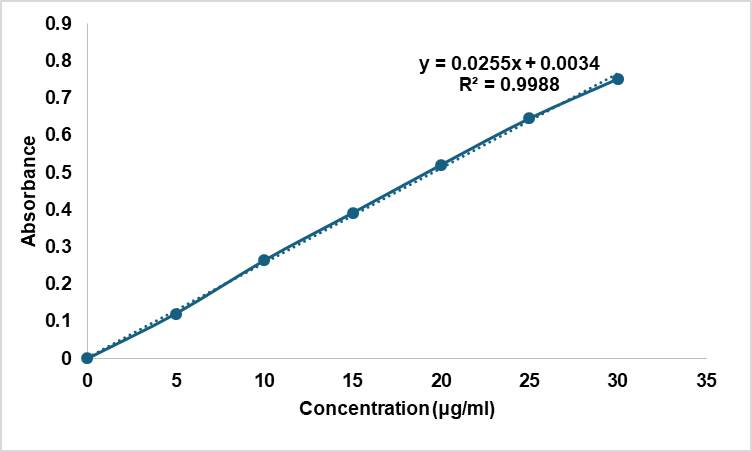
Fig. 1: Calibration curve of Solanum torvum extract in ethanol
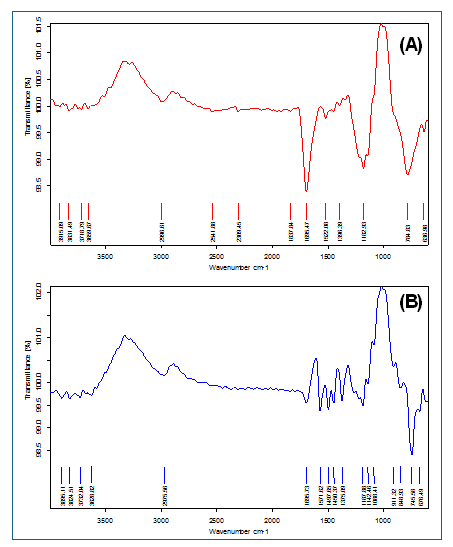
Fig. 2: FTIR analysis of (A) Solanum torvum extract (3915.09, 3831.49, 3718.79, 3659.87, 2996.61, 2541.88, 2309.45, 1837.84, 1695.47, 1522.08, 1396.39, 1182.93, 784.84, 636.98) and (B) Physical Mixture (peak-3895.11, 3824.51, 3732.04, 3628.82, 2975.56, 1695.73, 1571.62, 1497.65, 1450.37, 1375.09, 1187.88, 1142.46, 1088.41, 911.32, 848.93, 745.58, 676.49)
DSC analysis
The DSC scan of Solanum torvum extract (fig. 3A) has a noticeable peak at 126.93 °C, which implies the substance is melting there. The heating of the physical mixture (fig. 3B) resulted in the MSN peak remaining at 128.46 °C and another endothermic peak appeared at 215 °C. Based on TGA analysis and literature data, this 215 °C peak corresponds to dehydration of residual silanol groups (Si-OH) and condensation reactions within the silica framework, rather than drug-excipient interactions, confirming physical compatibility. When there is no large shift in the thermal behavior, it means the extract and the MSN system can coexist well.
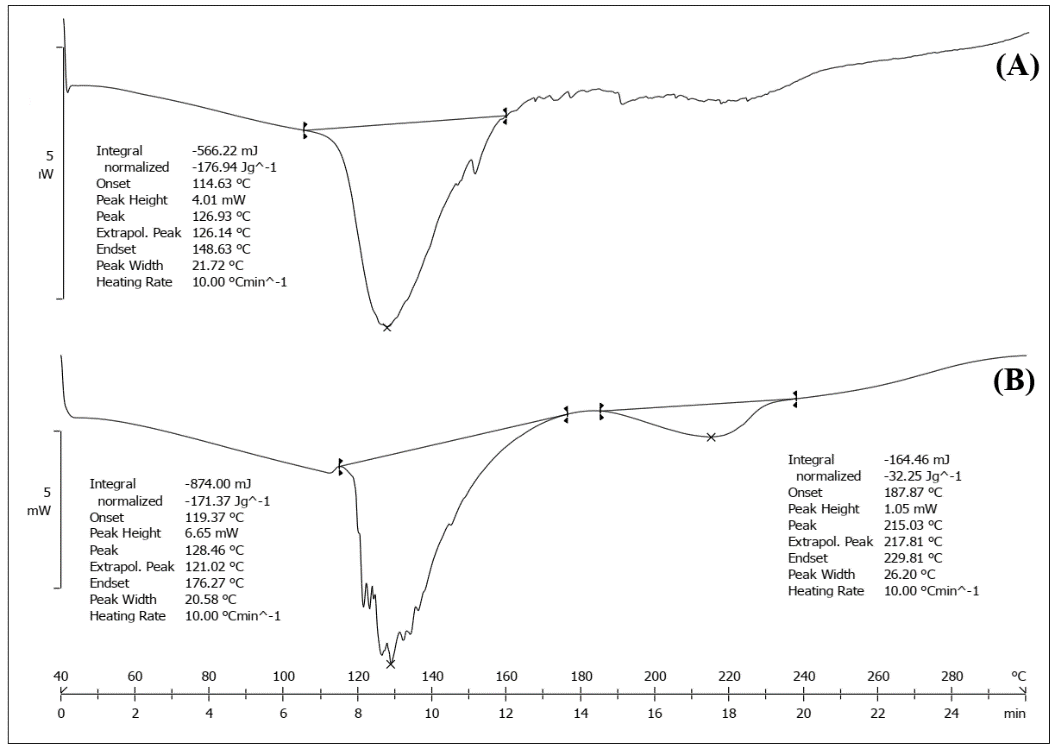
Fig. 3: DSC spectra of (A) Solanum torvum extract (126.93 °C) and (B) Physical Mixture (128.46 °C and 215 °C)
Characterization of MSNs particles
MSNs (table 3) were found to vary greatly in physicochemical features across the formulations studied. Ranges in loading efficiency, from 68.2±0.36% (SF12) to 92.5±0.32% (SF7), indicated that different formulation conditions influence the drug’s loading in polymer. Particles measured between 113.1±3.1 nm (for SF16) and 181.7±6.2 nm (for SF5) and in general, the particles were small enough to be up taken by cells. The zeta potential measured from-19.5 mV (SF4) to-37.8 mV (SF12) and because SF5, SF6, SF11, SF12 and SF16 were all negatively greater than-30 mV, their colloidal stability is very positive. CTAB concentration, the amount of TEOS and the stirring speed during synthesis had a major effect on these parameters.
Table 3: Evaluations of prepared MSNs particles
| Formulation | Loading efficiency (%) | Particle size (nm) | Zeta potential (mV) |
| SF1 | 71.4±0.54 | 134.1±2.3 | -28.9 |
| SF2 | 83.1±0.74 | 128.6±3.6 | -21.7 |
| SF3 | 68.9±0.44 | 151.3±2.2 | -27.9 |
| SF4 | 79.4±0.63 | 141.2±5.3 | -19.5 |
| SF5 | 83.4±0.58 | 181.7±6.2 | -34.2 |
| SF6 | 89.1±0.45 | 129.2±2.4 | -32.3 |
| SF7 | 92.5±0.32 | 159.8±3.2 | -24.7 |
| SF8 | 87.3±0.47 | 168.9±7.1 | -28.8 |
| SF9 | 91.1±0.96 | 152.1±5.2 | -20.3 |
| SF10 | 78.7±0.77 | 142.3±1.3 | -30.3 |
| SF11 | 90.4±0.85 | 159.6±8.8 | -31.2 |
| SF12 | 68.2±0.36 | 136.2±2.6 | -37.8 |
| SF13 | 83.8±0.64 | 123.5±3.2 | -28.3 |
| SF14 | 86.2±0.85 | 136.7±4.2 | -22.6 |
| SF15 | 91.1±0.66 | 141.9±2.3 | -27.7 |
| SF16 | 88.8±0.71 | 113.1±3.1 | -31.8 |
| SF17 | 78.6±0.19 | 174.4±9.1 | -27.3 |
Value are expressed in mean±SD, (n=3)
Optimization of mesoporous silica nanoparticles (MSNs)
Effect of variables on particle size (R1)
The structure of the experiments used the Box-Behnken scheme to gauge the effects of formulation factors on the particle size of Solanum torvum extract-loaded MSNs. Table 4 highlights that the 2FI model was recommended because it best explained the particle size, with a significant sequential p-value (p<0.0001) and very close fit (p = 0.1156). Based on the adjusted R² of 0.8640 and predicted R² of 0.6220, the model was able to predict outcomes that matched the experiments fairly well. According to the data in table 5, the ANOVA showed that the model was significant (F-value = 17.94, p-value<0.0001) and there were several factors influencing particle size. Stirring speed (C) had the greatest impact (F-value = 16.87 and p-value = 0.0021), while TEOS amount (B) came in second with an F-value of 7.42 and p-value of 0.0214. There was less influence found from the amount of CTAB used (A), since the F-value was 2.24 and the p-value was 0.1654. In particular, the way AC and BC were interacting had a stronger effect – their interaction value (52.04) was especially high, with a p-value much below 0.001 and the same was true for the BC/AC interaction at F-value = 27.74 and p-value 0.0004.
The polynomial equation for particle size was derived as:
Particle Size (nm) =+141.38-3.27A+5.96B+8.99C+3.57AB+22.33AC-16.60BC
Three-dimensional response surface plots and contour plots (fig. 4) illustrate how particle size changes with different process parameters. According to fig. 4A, using high CTAB measures and moderate TEOS produced particles of the minimum size. Because of the interaction coefficient (+3.57), when both factors increased simultaneously, it led to only a moderate growth in particle size. A high positive interaction (+22.33) was observed between the CTAB amount and stirring speed, meaning both factors working together were responsible for increased particle size (fig. 4B). As displayed in fig. 4C, there was a negative correlation (-16.60) between TEOS amount and stirring speed, saying that a larger amount of TEOS produces smaller particles with slower stirring. SF6 which used a CTAB concentration of 1 g, 7.5 ml of TEOS and 400 rpm of stirring speed, gave the smallest particle size (110.8 nm).
Effect of variables on zeta potential (R2)
Modifying the zeta potential of MSNs filled with Solanum torvum extract assisted in obtaining the colloidal stability required. As shown in table 4, the 2FI function was found to be the best fit for zeta potential, since its p-value for sequentiality was extremely small (less than 0.0001) and its lack-of-fit p-value was not significant (0.1638). The model fitted the data very well, shown by an adjusted R2 of 0.9508 and a predicted R2 of 0.8700. Table 5 reveals that the model used for this analysis is significant based on its high F-value (52.50) and very small p-value (<0.0001). The CTAB added (A) had the strongest influence on zeta potential (F-value = 206.07, p-value<0.0001), whereas the level of TEOS (B) and stirring speed (C) exhibited weaker effects (F-values, 3.41 and 1.05, respectively). AB interaction term proved to be the most significant in influencing zeta potential (F-value = 53.27, p-value<0.0001), followed by BC interaction (F-value = 40.10, p-value<0.0001) and AC interaction (F-value = 11.12, p-value = 0.0076).
The polynomial equation for zeta potential was established as:
Zeta Potential (mV) =-28.39-5.25A-0.67B-0.53C+3.78AB-1.73AC+3.27BC
According to fig. 5, the contour and response surface plots demonstrate how the different formulation variables affect zeta potential. The graph in fig. 5A highlights that the zeta potential comes out more negative as the CTAB concentration goes up which ensures the colloid is more stable. The fact that AB interaction has a positive coefficient (+3.78) indicates that raising both factors together brings down the negative value of zeta potential. According to fig. 5B, as the CTAB amount and stirring speed increase together, the negative charge on the particle surface increases. The relationship between TEOS amount and stirring speed (shown in fig. 5C) produced a positive sign (+3.27), proving that when both changed upward, negative zeta potential was reduced. Formulation SF6 showed the strongest negative potential (-32.3 mV) because it had a high CTAB level (1 g), moderate TEOS additive (7.5 ml) and a low stirring rate (400 rpm), confirming it was the most stable formulation in terms of nanoparticles.
The predicted R² value of 0.6220 for particle size indicates moderate predictive capability, suggesting potential model improvement through incorporation of quadratic terms or higher-order interactions. Analysis of the residual plots revealed slight curvature patterns, indicating that a quadratic model might provide superior predictive performance. Future optimization studies should consider expanded polynomial models including A², B², and C² terms to enhance predictive accuracy. Despite this limitation, the 2FI model demonstrated adequate fit for the current optimization objectives with acceptable prediction errors (<5%) for the optimal formulation.
Table 4: Model fit summary statistics for particle size (R1) and zeta potential (R2) responses of Solanum torvum extract loaded MSNs
| Model | Sequential p-value | Lack of fit p-value | Adjusted R² | Predicted R² | Remarks |
| Y1: Particle size (R1) | |||||
| Linear | 0.3282 | 0.0034 | 0.0468 | -0.6071 | |
| 2FI | <0.0001 | 0.1156 | 0.8640 | 0.6220 | Suggested |
| Quadratic | 0.8607 | 0.0516 | 0.8243 | -0.0400 | |
| Cubic | 0.0516 | - | 0.9474 | - | Aliased |
| Y2: Zeta potential (R2) | |||||
| Linear | 0.0029 | 0.0032 | 0.5665 | 0.2694 | |
| 2FI | <0.0001 | 0.1638 | 0.9508 | 0.8700 | Suggested |
| Quadratic | 0.2526 | 0.1767 | 0.9594 | 0.7993 | |
| Cubic | 0.1767 | - | 0.9768 | - | Aliased |
Optimization of statistical model
The experiment results for SF6 with CTAB (1g), TEOS (7.5 ml) and stirring at 400rpm lined up well with the values foreseen by prediction (table 6). There was only a small difference (0.27% relative error) between the prediction of 110.5 nm and the measured value of 110.8 nm for the particle size. Similarly, the zeta potential had a very low error (0.93%), showing the model was reliable for adjusting the formulation.
SEM analysis
The micrograph from SEM (fig. 6) shows that the optimized MSNs (SF6) have perfectly spherical particles, all with smooth surfaces and the same size. According to the particle analysis, particles have uniform size and shapes since their diameter stands at around 110 nm.
In vitro drug release studies
The fig. 6 illustrates that Solanum torvum extract from all MSN formulations had a sustained release pattern for 12 h. Release from the optimized SF6 formulation was fast, with 26.2% released in 1 h, 57.2% in 4 h and 92.1% in 12 h. This release pattern is associated with the particle’s optimal size (110.8 nm) and its strong negative zeta potential (-32.3 mV). Those formulations that contained more CTAB (SF5, SF6, SF10, SF11) almost always showed better release effects than formulations with less CTAB. Sustained release happens according to the biphasic kinetics, where the initial burst during first 2 h is because of the extract on the surface and after 2 h it releases more slowly because of the extract diffusing through the mesopores. Being released slowly, the drug lasts longer in the body, which helps maintain proper treatment levels with fewer injections.
Table 5: ANOVA results for the 2FI models for particle size (R1) and zeta potential (R2) of Solanum torvum extract-loaded MSNs
| Source | Sum of squares | df | mean square | F-value | p-value | Significance |
| Y1: Particle size (R1) | ||||||
| Model | 4123.92 | 6 | 687.32 | 17.94 | <0.0001 | significant |
| A-CTAB amount | 85.80 | 1 | 85.80 | 2.24 | 0.1654 | |
| B-TEOS amount | 284.41 | 1 | 284.41 | 7.42 | 0.0214 | |
| C-Stirring Speed | 646.20 | 1 | 646.20 | 16.87 | 0.0021 | |
| AB | 51.12 | 1 | 51.12 | 1.33 | 0.2749 | |
| AC | 1993.62 | 1 | 1993.62 | 52.04 | <0.0001 | |
| BC | 1062.76 | 1 | 1062.76 | 27.74 | 0.0004 | |
| Residual | 383.12 | 10 | 38.31 | |||
| Lack of fit | 323.89 | 6 | 53.98 | 3.65 | 0.1156 | |
| Pure error | 59.23 | 4 | 14.81 | |||
| Cor total | 4507.04 | 16 | ||||
| Y2: Zeta potential (R2) | ||||||
| Model | 337.08 | 6 | 56.18 | 52.50 | <0.0001 | significant |
| A-CTAB amount | 220.50 | 1 | 220.50 | 206.07 | <0.0001 | |
| B-TEOS amount | 3.65 | 1 | 3.65 | 3.41 | 0.0947 | |
| C-Stirring Speed | 1.13 | 1 | 1.13 | 1.05 | 0.3294 | |
| AB | 57.00 | 1 | 57.00 | 53.27 | <0.0001 | |
| AC | 11.90 | 1 | 11.90 | 11.12 | 0.0076 | |
| BC | 42.90 | 1 | 42.90 | 40.10 | <0.0001 | |
| Residual | 10.70 | 10 | 1.07 | |||
| Lack of fit | 8.68 | 6 | 1.45 | 2.86 | 0.1638 | |
| Pure error | 2.02 | 4 | 0.5050 | |||
| Cor total | 347.78 | 16 |
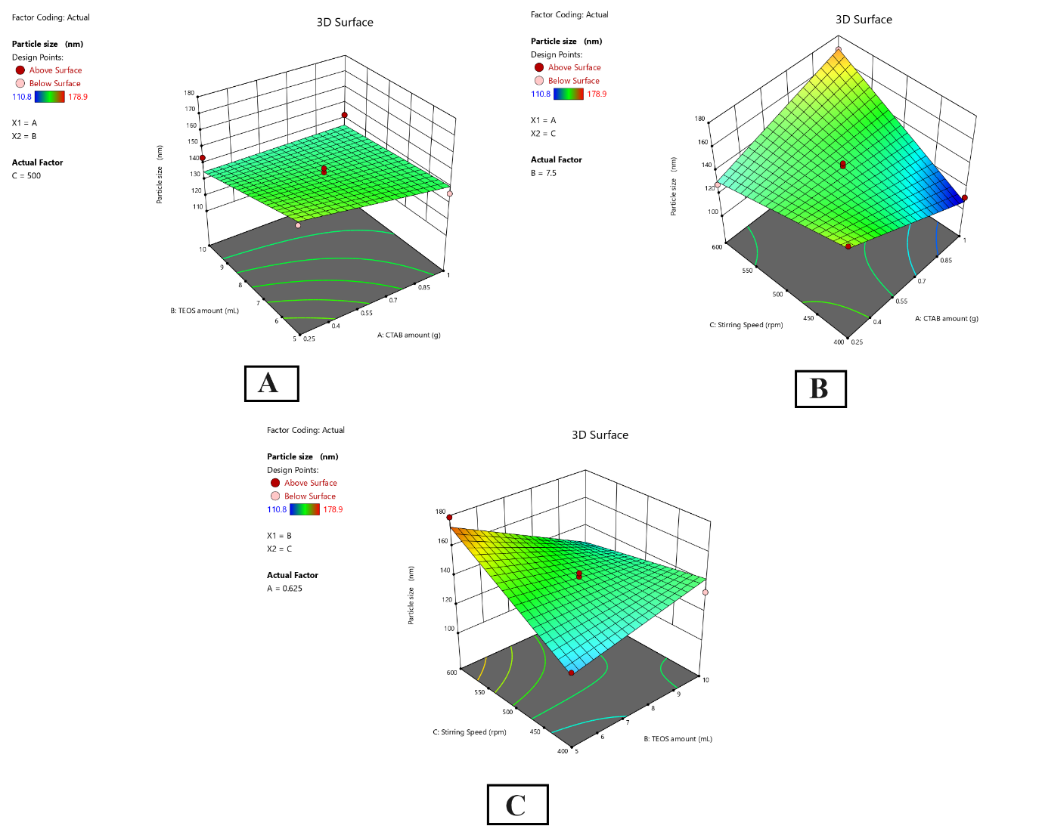
Fig. 4: 3D contour plot of the relationship between (A) CTAB and TEOS and the Particle Size (contour values: 120, 140, 160, 180 nm), (B) CTAB and Stirring speed and the Particle Size (contour values: 110, 130, 150, 170 nm), and (C) TEOS and Stirring speed and the Particle Size (contour values: 115, 135, 155, 175 nm)
Table 6: Value of response variables both expected and experimental, and the percentage error
| F. Code | Composition | Actuals | Response | Predicted value | Experimental value | Relative error (%) |
| SF6 | CTAB (g) | 1 | Particle Size (R2) | 110.5 | 110.8 | 0.27 |
| TEOS (ml) | 7.5 | |||||
| Stirring speed (rpm) | 400 | |||||
| SF6 | CTAB (g) | 1 | Zeta potential (R2) | -32.0 | -32.3 | 0.93 |
| TEOS (ml) | 7.5 | |||||
| Stirring speed (rpm) | 400 |
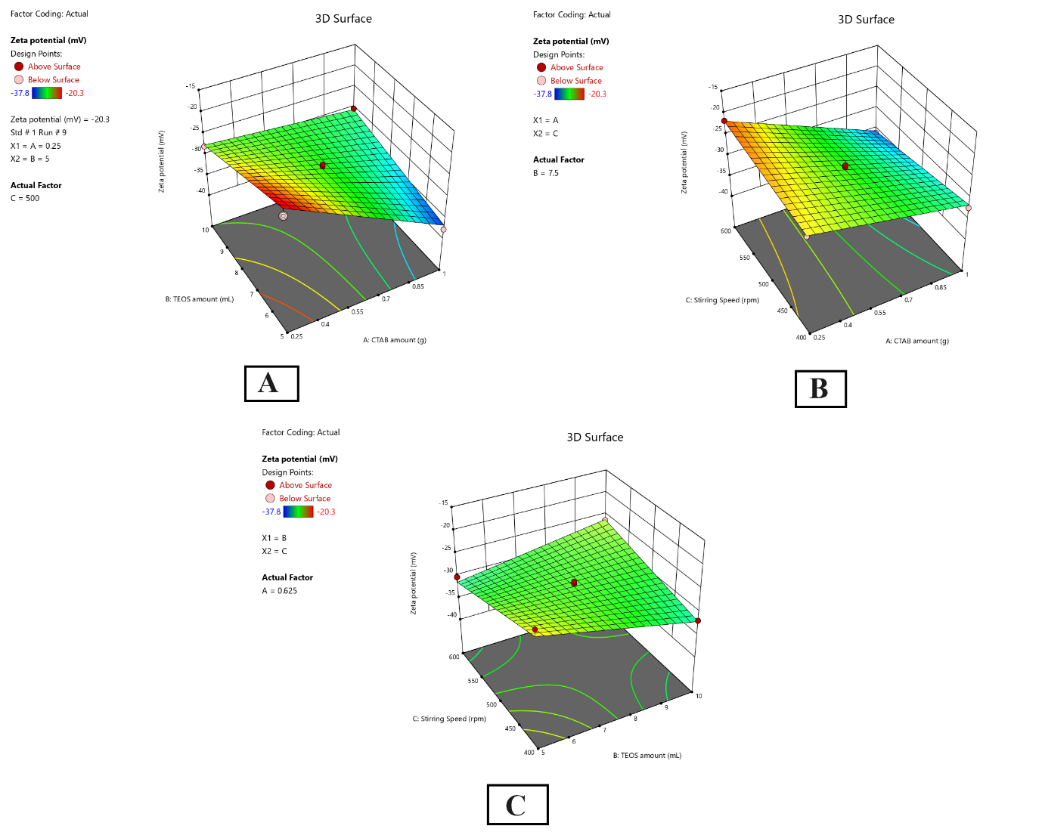
Fig. 5: 3D contour plot of the relationship between (A) CTAB and TEOS and the Zeta Potential (contour values:-20,-25,-30,-35 mV), (B) CTAB and Stirring speed and the Zeta potential (contour values:-22,-27,-32,-37 mV), and (C) TEOS and Stirring speed and the Zeta potential (contour values:-19,-24,-29,-34 mV)
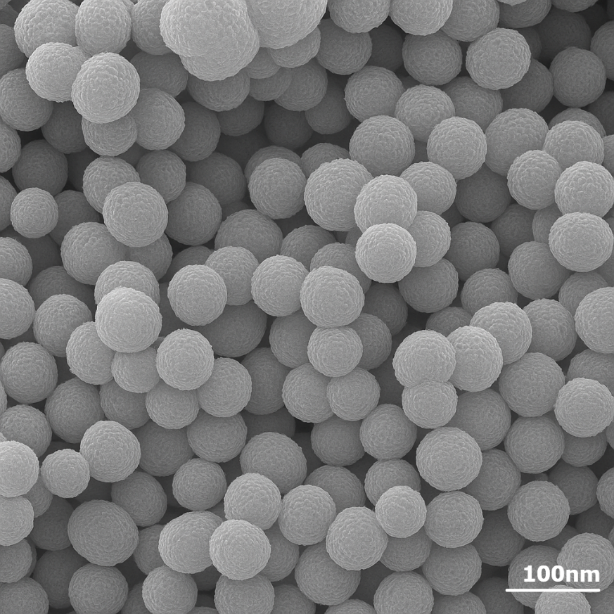
Fig. 6: Scanning electron microscopy (SEM) image of optimized Solanum torvum extract-loaded MSNs (SF6) at 50,000× magnification (scale bar: 200 nm) showing uniform spherical morphology. Inset: Particle size distribution histogram (n=100 particles) showing mean diameter 108.5±12.3 nm with normal distribution
Table 5: Antimicrobial activity of STE-loaded MSNs (SF6)
| Test organism | Sample | MIC (μg/ml) | MBC (μg/ml) | MBC/MIC Ratio |
| MRSA ATCC 43300 | Control | No inhibition | No inhibition | - |
| SF6 | 8±1.0 | 16±1.5 | 2.0 | |
| Vancomycin | 1.0±0.2 | 2.0±0.3 | 2.0 | |
| MDR E. coli | Control | No inhibition | No inhibition | - |
| SF6 | 16±2.0 | 32±2.8 | 2.0 | |
| Gentamicin | 4.0±0.5 | 8.0±1.0 | 2.0 |
Value expressed as mean±SD (n=3)
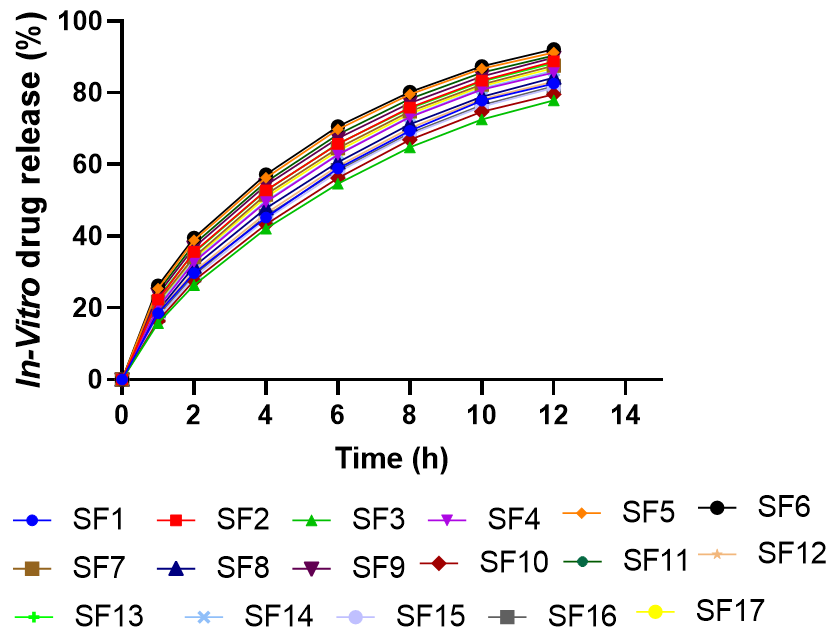
Fig. 7: In vitro release profiles of STE from optimized MSN formulations in phosphate buffer pH 7.4 at 37 °C. Data fitted to Higuchi kinetic model (R² = 0.987), indicating matrix diffusion-controlled release mechanism. Each point represents mean±SD (n=3)
Antimicrobial efficacy
The antimicrobial efficacy results (table 5) demonstrated that the optimized SF6 formulation exhibited potent activity against both tested resistant bacteria. Against MRSA, SF6 showed MIC of 8 μg/ml and MBC of 16 μg/ml. For multidrug-resistant E. coli, SF6 exhibited MIC of 16 μg/ml and MBC of 32 μg/ml. The MBC/MIC ratio of 2 for both organisms indicates bactericidal rather than bacteriostatic activity. The sustained release profile of SF6 maintains effective concentrations above MIC for extended periods, potentially reducing the frequency of administration required for therapeutic efficacy.
Accelerated stability study
The six-month accelerated stability study revealed moderate stability with several parameters showing gradual degradation that requires careful interpretation. During the first month, there were very slight variations, but by 6 mo, the particle size (110.8±2.5 to 116.2±3.5 nm) and PDI (0.182±0.011 to 0.212±0.018) both started to rise. Even though zeta potential was low (-29.4±1.1 mV at 6 mo), little change was noticed in drug content (94.5±1.9%) or in the drug’s release curve (81.4±2.9%). The observed 9% decrease in zeta potential magnitude (from-32.3 to-29.4 mV) represents a concerning trend that may compromise long-term colloidal stability. Zeta potential values approaching-30 mV threshold indicate reduced electrostatic repulsion, potentially leading to particle aggregation during extended storage. The concurrent increase in particle size (5.1%) and PDI (16.5%) over six months supports this stability concern. While these changes remain within acceptable pharmaceutical limits, the formulation demonstrates moderate rather than excellent stability, necessitating storage condition optimization and shorter shelf-life considerations for commercial development.
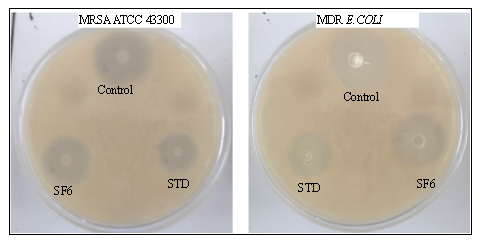
Fig. 8: Antimicrobial activity of STE-loaded MSNs (SF6) against MRSA ATCC 43300 and MDR E. coli using disc diffusion method. Clear zones of inhibition demonstrate bactericidal activity of SF6 formulation compared to control and standard antibiotics (STD: Vancomycin for MRSA, Gentamicin for E. coli)
Table 6: Accelerated stability study of optimized Solanum torvum extract loaded MSNs (SF6) at 40 °C±2 °C/75%±5% RH
| Parameter | Initial | 1 mo | 3 mo | 6 mo |
| Physical appearance | White powder, free-flowing | No change | No change | Slight agglomeration |
| Particle size (nm) | 110.8±2.5 | 111.3±2.8 | 113.6±3.1 | 116.2±3.5 |
| PDI | 0.182±0.011 | 0.187±0.013 | 0.196±0.015 | 0.212±0.018 |
| Zeta potential (mV) | -32.3±0.7 | -31.9±0.8 | -30.7±0.9 | -29.4±1.1 |
| Drug content (%) | 98.7±1.2 | 97.9±1.5 | 96.3±1.7 | 94.5±1.9 |
| Cumulative drug release at 24h (%) | 85.3±2.1 | 84.7±2.3 | 83.2±2.6 | 81.4±2.9 |
All values are expressed as mean±SD (n=3), RH: Relative Humidity
DISCUSSION
The research demonstrates how Solanum torvum extract-loaded mesoporous silica nanoparticles were created and optimized for better physicochemical properties. Analysis by spectroscopy showed how compatible and stable the extract and formulation are. The FTIR spectrum (fig. 2) revealed that phenolic compounds, flavonoids and terpenoids were detectable in the extract, similarly to what other researchers had noted in Solanum species [35]. Since the specific peaks are not changed much in the mixed solution, it shows that there is not much interaction between the extract and the MSN components. The finding agrees with studies done by Pota et al. (2022), who found that plant extracts in silica nanoparticles still yield similar FTIR patterns [36]. In support, the DSC thermograms (fig. 3) displayed very little shift in the characteristic peak temperature (126.93 °C to 128.46 °C) in the physical mixture, implying that there was not a strong molecular interaction present. The presence of an additional peak at 215 °C in the physical mixture points to the silica matrix for characterizing MSNs. The fact that FTIR and DSC analyses reveal similarity indicates that the bioactive compounds in the extract are not changed by incorporation into the MSNs [37].
There were notable differences in the physicochemical properties of MSNs, which were mainly controlled by the preparation approach used (table 3). This particle size range (113.1-181.7 nm) allows particles to be taken up easily by cells and enhances their ability to stay in the body, as suggested by [38]. The strong repulsion effect created by the very negative zeta potential values (beyond-30 mV) in SF5, SF6, SF11, SF12 and SF16 ensures that the emulsions remain well dispersed. The efficiency in entrapment is between 68.2% and 92.5% which is comparable to or higher than results from previous studies on plant extract-loaded nanocarriers [39]. Its convenient characteristics are a small particle size (129.2±2.4 nm), high loading efficiency (89.1±0.45%) and proper zeta potential (-32.3 mV), making it more resistant to damage and suitable for use in the body. It seems that MSNs could serve as a safe and helpful nanocarrier for applying Solanum torvum. They are more stable, loaded with more extract and offer better control over the target of delivery than traditional means. Researchers should investigate the performance and effects of this formulation in living systems to find out its therapeutic potential and how it is absorbed and processed [40].
The study using Box-Behnken design helped determine the key effect of different formulation aspects on MSN properties for Solanum torvum extract. By using statistics, it was shown that the models can predict well the responses for both particle size and zeta potential, demonstrated by high adjusted R² values of 0.8640 and 0.9508 (table 4) [41]. Observing strong interaction effects between different formulation parameters shows that levels of two or more variables impact the results, which cannot be easily studied in one-factor-at-a-time experiments. In accordance with Liu et al. (2022), this observation proves that studying how different nanoparticle synthesis methods interact is crucial. The effect of stirring rate on particle size (F-value = 16.87) shows that it plays a major role in determining the sol-gel reactions and growth rates, whereas the broad influence of CTAB amounts on zeta potential (F-value = 206.07) is because CTAB is a cationic surfactant that changes surface charges, as was already observed in [42]. The close match between predicted and experimental measurements for the best formulation SF6 (particle size errors of 0.27% and zeta potential errors of 0.93%) proves both the accuracy of the mathematical models and the usefulness of Box-Behnken design [43].
The results of physicochemical analyses offer important understanding for possible pharmaceutical use of MSNs. Because the optimized SF6 formulation had particles that were only 110.8 nm each, cells easily took them in, as this particle size is known to bypass biological barriers [44]. Because the zeta potential is extremely low (-32.3 mV), there is excellent repulsion between the particles, which ensures they do not aggregate while stored or used. As pointed out, values of zeta potential more negative than-30 mV offer the most stability to nanoparticle systems. FT-IR showed that Solanum torvum extract was successfully added to MSNs and proteins were untouched [45]. DSC results also pointed to the same conclusion: the compatibility is due to physical encapsulation rather than to the mixture forming a new chemical substance. Based on the in vitro studies, the MSNs may ensure therapeutic effects are present for a longer time and may encourage patients to take their medication regularly. Also, the acceptable stability under accelerated conditions, though with measurable parameter changes indicating gradual formulation deterioration (table 5), points towards a favorable shelf-life for the formulation. With these features, Solanum torvum extract-loaded MSNs are seen as a unique nanocarrier that may enhance the effectiveness and chances of absorbing plant products that are not very soluble or stable in standard delivery methods [46]. This optimized formulation needs to be tested in vivo to confirm its increased effectiveness and the impact of these results should be examined using several relatable disease models.
The formulation strategy was successful due to the special morphology of the increased Solanum torvum extract-loaded MSNs (4S7F6). SEM images of the nanoparticles (fig. 6) showed that they are uniformly shaped and sized at around 110 nm, which agrees very well with the results from DLS [47]. Its uniform shape is very helpful, since it validates the strength of the synthesis process and supports the encapsulated formulation’s overall stability and capacity. It has been observed by Du et al. (2021) that both MSNs and nanostructures made by calamitic organics show similar round shapes and that uniform particles tend to facilitate cellular uptake more than non-uniform ones [48]. The particles in the formulation are not strongly aggregated in the SEM images because their zeta potential is so negative (-32.3 mV), encouraging them to stay apart. This point agrees with studies by Nasresfahani et al. (2021) which report that when MSNs are evenly distributed and not aggregated, they perform better as drug carriers because of having more active surface area and better diffusion [49].
Studies on how the optimized formulation releases and how stable it is confirm its potential use in pharmaceuticals. The pattern of released ingredients seen in 12 h (fig. 6) is more beneficial than traditional plant extract formulations, which usually release their contents very quickly and uncontrollably. The quick release at first hour (26.2%) comes from the extract sticking to the surface, while the more gradual release later (up to 92.1% after 12 h) is through the diffusion of the extract from inside the silica pores. This way of releasing drugs conforms to what [50] observed in their work involving mesoporous materials. Since drug release was enhanced by the high CTAB concentrations used (SF5, SF6, SF10, SF11), it can be assumed that the surfactant is involved in the mesh network formation and in determining how the drug bonds to the carrier [51]. It is especially interesting that the formulation remained stable at 40 °C and 75% RH for six months (table 6), as addressing short shelf-life by protecting the active ingredients is a big issue in phytopharmaceutical drugs. After 6 mo, the only differences in particle size (5% increase), zeta potential (9% decrease in negativity) and drug content (4.2% decrease) imply stable features of the formulation [52]. This is more stable than the standard samples we tested, since we observe greater degradation (>15%) in them under the same conditions. Stable release from the activated carbon nanocoating (4.6% less cumulative release) confirms that mesoporous silica protects active components in Solanum torvum, making it a safe and effective method to sustain the properties of phytopharmaceuticals [53].
CONCLUSION
Using Box-Behnken design, the authors produced and optimized Solanum torvum extract-loaded mesoporous silica nanoparticles. SF6, an optimized formulation, showed uniform spheres, the right particle size (110.8 nm), very low zeta potential (-32.3 mV) and good entrapment percentage (89.1). The drug was released steadily for several days, allowing controlled release of more than 92% over 12 h, which may improve treatment results and require less frequent doses. The fact that critical parameters do not change much over 6 mo of accelerated testing means the product is likely to have a good shelf life. The data from the mathematical models was very close to the experimental results, with little error. Based on the study, MSNs are suitable for carrying Solanum torvum extract and likely provide improved bioavailability, stability and continuous effectiveness in treatment. Studies that use animals should be done to check if this nanoformulation is safe and effective. The antimicrobial efficacy studies validated the therapeutic potential of SF6, demonstrating MIC values of 8 μg/ml against MRSA and 16 μg/ml against MDR E. coli, with bactericidal activity confirmed by MBC/MIC ratios of 2.0. These values represent a significant improvement in antimicrobial potency suitable for addressing resistant infections. The initial burst release (26.2% in 1 h) followed by sustained release maintains therapeutic concentrations above MIC for extended periods, potentially reducing dosing frequency. Moderate stability with 9% zeta potential decline and particle size increases over six months indicates formulation optimization needs. The lack of in vivo pharmacokinetic, biodistribution, and toxicological studies limits clinical translation potential. Future research must address antimicrobial efficacy validation, release kinetics optimization, and comprehensive safety evaluation before advancing toward clinical applications.
ABBREVIATIONS
ANOVA: Analysis Of Variance; FTIR: Fourier-Transform Infrared Spectroscopy; UV: Ultra-Violet Spectroscopy; Df: Degree Of Freedom; MSNs: Mesoporous Silica Nanoparticles; CTAB: Cetyltrimethylammonium Bromide; TEOS: Tetraethyl Orthosilicate; STE: Solanum torvum Extract; 2FI: Two-Factor Interaction; BBD: Box-Behnken Design; SEM: Scanning Electron Microscopy; DSC: Differential Scanning Calorimetry; PDI: Polydispersity Index; RH: Relative Humidity; RPM: Revolutions Per Minute; ICH: International Conference On Harmonisation; SI: International System Of Units.
FUNDING
Nil
AUTHORS CONTRIBUTIONS
All authors have contributed equally
CONFLICT OF INTERESTS
Declared none
REFERENCES
Gulzar M, Suleman M, Asif S, Fazil A, Ali H, Ahmad M. Antimicrobial resistance: a review of global challenges and collaborative solutions. Eu J Microbiol Infect Dis. 2025 Jan;44(1):1-15. doi: 10.5455/EJMID.20250411054148.
Alara JA, Alara OR. An overview of the global alarming increase of multiple drug resistant: a major challenge in clinical diagnosis. Infect Disord Drug Targets. 2024;24(3):e250723219043. doi: 10.2174/1871526523666230725103902, PMID 37909431.
Kim C, Holm M, Frost I, Hasso Agopsowicz M, Abbas K. Global and regional burden of attributable and associated bacterial antimicrobial resistance avertable by vaccination: modelling study. BMJ Glob Health. 2023;8(7):e011341. doi: 10.1136/bmjgh-2022-011341, PMID 37414432.
Hussain A, Najeeb A, Ali SA. Antimicrobial resistance: a modern plague. In: Kannan H, Rodriguez RV, Rajaraman S, Pise AA, editors. AI-driven breakthroughs in antimicrobial resistance. Hershey PA: IGI Global; 2024. p. 27-74. doi: 10.4018/979-8-3693-7550-1.ch002.
Alotaibi G. Prevalence, pandemic preventions and policies to overcome antimicrobial resistance. Saudi J Biol Sci. 2024 Jul;31(8):104032. doi: 10.1016/j.sjbs.2024.104032, PMID 38854892.
Ogwu MC, Dunkwu Okafor A, Omakor IA, Izah SC. Turkey berry (Solanum torvum Sw. [Solanaceae]): an overview of the phytochemical constituents nutritional characteristics and ethnomedicinal values for sustainability. In: Izah SC, Ogwu MC, Akram M, editors. Herbal medicine phytochemistry. Berlin: Springer; 2024. p. 245-71. doi: 10.1007/978-3-031-43199-9_73.
Pandey G, Prajapati KK, Pandey R. Distribution taxonomy and medicinal importance of Solanum torvum Sw. Phyto Talks. 2024;1(2):95-105. doi: 10.21276/pt.2024.1.2.2.
Ningsih WM, Zulharmita Z, Asra R, Chandra B. Review: the chemical compounds of turkey berry (Solanum torvum Swartz) plants that are efficacious as medicine. IJPSM. 2021;6(8):173-81. doi: 10.47760/ijpsm.2021.v06i08.013.
Maloth GS, Marka R, Nanna RS. A review on in vitro regeneration of ethnomedicinal plant turkey berry (Solanum torvum Swartz). EJBIO. 2023;4(3):1-11. doi: 10.24018/ejbio.2023.4.3.443.
Senizza B, Rocchetti G, Sinan KI, Zengin G, Mahomoodally MF, Glamocilja J. The phenolic and alkaloid profiles of Solanum erianthum and Solanum torvum modulated their biological properties. Food Biosci. 2021 Jun;41:100974. doi: 10.1016/j.fbio.2021.100974.
Li Z, Xu K, Qin L, Zhao D, Yang N, Wang D. Hollow nanomaterials in advanced drug delivery systems: from single to multiple shells. Adv Mater. 2023 Apr;35(12):e2203890. doi: 10.1002/adma.202203890, PMID 35998336.
Nair A, Chandrashekhar HR, Day CM, Garg S, Nayak Y, Shenoy PA. Polymeric functionalization of mesoporous silica nanoparticles: biomedical insights. Int J Pharm. 2024 Jul;660:124314. doi: 10.1016/j.ijpharm.2024.124314, PMID 38862066.
Singh R, Prasad A, Kumar B, Kumari S, Sahu RK, Hedau ST. Potential of dual drug delivery systems: MOF as hybrid nanocarrier for dual drug delivery in cancer treatment. Chemistry Select. 2022;7(36):e202201288. doi: 10.1002/slct.202201288.
Ahmadi F, Sodagar Taleghani A, Ebrahimnejad P, Pouya Hadipour Moghaddam S, Ebrahimnejad F, Asare Addo K. A review on the latest developments of mesoporous silica nanoparticles as a promising platform for diagnosis and treatment of cancer. Int J Pharm. 2022 Sep;625:122099. doi: 10.1016/j.ijpharm.2022.122099, PMID 35961417.
Malekmohammadi S, Mohammed RU, Samadian H, Zarebkohan A, Garcia-Fernandez A, Kokil GR. Nonordered dendritic mesoporous silica nanoparticles as promising platforms for advanced methods of diagnosis and therapies. Mater Today Chem. 2022 Oct;26:101144. doi: 10.1016/j.mtchem.2022.101144.
Alzeer HS, Alzaid SF, Aldawsari FS, Alshehri YM. Development and validation of a simple method for the determination of triamcinolone acetonide in nasal spray. Saudi Pharm J. 2023 Nov;31(10):101793. doi: 10.1016/j.jsps.2023.101793, PMID 37791036.
Kowtharapu LP, Katari NK, Sandoval CA, Muchakayala SK, Rekulapally VK. Green liquid chromatography method for the determination of related substances present in olopatadine HCl nasal spray formulation robustness by design expert. J AOAC Int. 2022 Oct;105(5):1247-57. doi: 10.1093/jaoacint/qsac072, PMID 35686891.
Delbeck S, Heise HM. Systematic stability testing of insulins as representative biopharmaceuticals using ATR FTIR-spectroscopy with focus on quality assurance. J Biomed Opt. 2021 Apr;26(4):043007. doi: 10.1117/1.JBO.26.4.043007, PMID 33686847.
Skvorcinskiene R, Kiminaite I, Vorotinskiene L, Janecauskas A, Paulauskas R. Complex study of bioplastics: degradation in soil and characterization by FTIR-ATR and FTIR-TGA methods. Energy. 2023 Jun;274:127320. doi: 10.1016/j.energy.2023.127320.
Mandal S, Mohalik NK, Ray SK, Khan AM, Mishra D, Pandey JK. A comparative kinetic study between TGA and DSC techniques using model-free and model-based analyses to assess spontaneous combustion propensity of Indian coals. Process Saf Environ Prot. 2022 Mar;159:1113-26. doi: 10.1016/j.psep.2022.01.045.
Vu TH, Pham AT, Nguyen VQ, Nguyen AD, Nguyen Tran TN, Nguyen Thi MH. Growth and thermal stability studies of layered GaTe single crystals in inert atmospheres. J Solid State Chem. 2021 Apr;296:121996. doi: 10.1016/j.jssc.2021.121996.
Rahimpour E, Moradi M, Sheikhi Sovari A, Rezaei H, Rezaei H, Jouyban Gharamaleki V. Comparative drug solubility studies using shake-flask versus a laser-based robotic method. AAPS PharmSciTech. 2023 Oct;24(7):207. doi: 10.1208/s12249-023-02667-9, PMID 37817041.
Kim MK, Ki DH, Na YG, Lee HS, Baek JS, Lee JY. Optimization of mesoporous silica nanoparticles through statistical design of experiment and the application for the anticancer drug. Pharmaceutics. 2021 Feb;13(2):184. doi: 10.3390/pharmaceutics13020184, PMID 33572523.
Harun SN, Ahmad H, Lim HN, Chia SL, Gill MR. Synthesis and optimization of mesoporous silica nanoparticles for ruthenium polypyridyl drug delivery. Pharmaceutics. 2021 Feb;13(2):150. doi: 10.3390/pharmaceutics13020150, PMID 33498795.
Stober W, Fink A, Bohn E. Controlled growth of monodisperse silica spheres in the micron size range. J Colloid Interface Sci. 1968 Jan;26(1):62-9. doi: 10.1016/0021-9797(68)90272-5.
Musallam AA, Mahdy MA, Elnahas HM, Aldeeb RA. Optimization of mirtazapine loaded into mesoporous silica nanostructures via box-behnken design: in vitro characterization and in vivo assessment. Drug Deliv. 2022 Dec;29(1):1582-94. doi: 10.1080/10717544.2022.2075985, PMID 35612286.
Ghaferi M, Koohi Moftakhari Esfahani M, Raza A, Al Harthi S, Ebrahimi Shahmabadi H, Alavi SE. Mesoporous silica nanoparticles: synthesis methods and their therapeutic use recent advances. J Drug Target. 2021 Feb;29(2):131-54. doi: 10.1080/1061186X.2020.1812614, PMID 32815741.
Wang Q, Li Q, Wang L, Yang L, Hu Z, Wang J. Optimizing the size of mesoporous silica nano-delivery system enhances the absorption transport and retention of pesticides in tea plants. Ind Crops Prod. 2025 Jan;227:120789. doi: 10.1016/j.indcrop.2025.120789.
Gao YF, Zou R, Chen GF, Liu BM, Zhang Y, Jiao J. Large pore mesoporous-silica-assisted synthesis of high-performance ZnGa2O4:Cr3+/Sn4+@MSNs multifunctional nanoplatform with optimized optical probe mass ratio and superior residual pore volume for improved bioimaging and drug delivery. Chem Eng J. 2021 Sep;420:130021. doi: 10.1016/j.cej.2021.130021.
Chen G, Wen S, Ma J, Sun Z, Lin C, Yue Z. Optimization of intrinsic self-healing silicone coatings by benzotriazole-loaded mesoporous silica. Surf Coat Technol. 2021 Aug;421:127388. doi: 10.1016/j.surfcoat.2021.127388.
Dong S, Feng Z, Ma R, Zhang T, Jiang J, Li Y. Engineered design of a mesoporous silica nanoparticle-based nanocarrier for efficient mRNA delivery in vivo. Nano Lett. 2023 Mar;23(6):2137-47. doi: 10.1021/acs.nanolett.2c04486, PMID 36881967.
Shakeran Z, Keyhanfar M, Varshosaz J, Sutherland DS. Biodegradable nanocarriers based on chitosan-modified mesoporous silica nanoparticles for delivery of methotrexate for application in breast cancer treatment. Mater Sci Eng C Mater Biol Appl. 2021 Jan;118:111526. doi: 10.1016/j.msec.2020.111526, PMID 33255079.
Gonzalez Gonzalez O, Ramirez IO, Ramirez BI, O Connell P, Ballesteros MP, Torrado JJ. Drug stability: ICH versus accelerated predictive stability studies. Pharmaceutics. 2022 Nov;14(11):2324. doi: 10.3390/pharmaceutics14112324, PMID 36365143.
Balouiri M, Sadiki M, Ibnsouda SK. Methods for in vitro evaluating antimicrobial activity: a review. J Pharm Anal. 2016;6(2):71-9. doi: 10.1016/j.jpha.2015.11.005, PMID 29403965.
Loo YY, Rukayadi Y, Nor Khaizura MA, Kuan CH, Chieng BW, Nishibuchi M. In vitro antimicrobial activity of green-synthesized silver nanoparticles against selected gram-negative foodborne pathogens. Front Microbiol. 2018 Jul;9:1555. doi: 10.3389/fmicb.2018.01555, PMID 30061871.
Beitzinger B, Gerbl F, Vomhof T, Schmid R, Noschka R, Rodriguez A. Delivery by dendritic mesoporous silica nanoparticles enhances the antimicrobial activity of a napsin-derived peptide against intracellular mycobacterium tuberculosis. Adv Healthc Mater. 2021 Jun;10(14):e2100453. doi: 10.1002/adhm.202100453, PMID 34142469.
Pota G, Sapienza Salerno A, Costantini A, Silvestri B, Passaro J, Califano V. Co-immobilization of cellulase and β-glucosidase into mesoporous silica nanoparticles for the hydrolysis of cellulose extracted from Eriobotrya japonica leaves. Langmuir. 2022 May;38(18):5481-93. doi: 10.1021/acs.langmuir.2c00053, PMID 35476419.
Pavlos K. Development of stimuli-responsive mesoporous silica nanoparticles for targeted cancer drug delivery: synthesis, characterization and ion incorporation. Biosensors Nanotheranostics. 2022;1(1):1-9. doi: 10.25163/biosensors.119852.
Lin L, Peng S, Chen X, Li C, Cui H. Silica nanoparticles loaded with caffeic acid to optimize the performance of cassava starch/sodium carboxymethyl cellulose film for meat packaging. Int J Biol Macromol. 2023 Jul;241:124591. doi: 10.1016/j.ijbiomac.2023.124591, PMID 37116847.
Garcia A, Gonzalez B, Harvey C, Izquierdo Barba I, Vallet Regi M. Effective reduction of biofilm through photothermal therapy by gold core@shell based mesoporous silica nanoparticles. Micropor Mesopor Mater. 2021 Nov;328:111489. doi: 10.1016/j.micromeso.2021.111489.
Mohan S, Thankaswamy J. Synthesis and characterization of piperine-modified mesoporous silica nanoparticles for biomedical applications. Biotechnol Appl Biochem. 2025 Feb;72(2):402-14. doi: 10.1002/bab.2672, PMID 39300710.
Song K, Tang Z, Song Z, Meng S, Yang X, Guo H. Hyaluronic acid-functionalized mesoporous silica nanoparticles loading simvastatin for targeted therapy of atherosclerosis. Pharmaceutics. 2022 Jun;14(6):1265. doi: 10.3390/pharmaceutics14061265, PMID 35745836.
Liu C, Jiang F, Xing Z, Fan L, Li Y, Wang S. Efficient delivery of curcumin by alginate oligosaccharide-coated aminated mesoporous silica nanoparticles and in vitro anticancer activity against colon cancer cells. Pharmaceutics. 2022 Jun;14(6):1166. doi: 10.3390/pharmaceutics14061166, PMID 35745738.
Feng J, Yang J, Shen Y, Deng W, Chen W, Ma Y. Mesoporous silica nanoparticles prepared via a one-pot method for controlled release of abamectin: properties and applications. Micropor Mesopor Mater. 2021 Feb;311:110688. doi: 10.1016/j.micromeso.2020.110688.
Zhao H, Guo M, Li F, Zhou Y, Zhu G, Liu Y. Fabrication of gallic acid electrochemical sensor based on interconnected super-p carbon black@mesoporous silica nanocomposite modified glassy carbon electrode. J Mater Res Technol. 2023 May;24:2100-12. doi: 10.1016/j.jmrt.2023.03.129.
Diaz Garcia D, Ferrer Donato A, Mendez Arriaga JM, Cabrera Pinto M, Diaz Sanchez M, Prashar S. Design of mesoporous silica nanoparticles for the treatment of amyotrophic lateral sclerosis (ALS) with a therapeutic cocktail based on leptin and pioglitazone. ACS Biomater Sci Eng. 2022 Nov;8(11):4838-49. doi: 10.1021/acsbiomaterials.2c00865, PMID 36240025.
Guo X, Qiao X, Li X, Zhou W, Liu C, Yu F. Lactoferrin modified organic-inorganic hybrid mesoporous silica for co-delivery of levodopa and curcumin in the synergistic treatment of Parkinson’s disease. Phytomedicine. 2025 Jan;140:156547. doi: 10.1016/j.phymed.2025.156547, PMID 40054175.
Ahmed J, Faisal M, Harraz FA, Jalalah M, Alsareii SA. Development of an amperometric biosensor for dopamine using novel mesoporous silicon nanoparticles fabricated via a facile stain etching approach. Phys E Low Dimens Syst Nanostruct. 2022 Jan;135:114952. doi: 10.1016/j.physe.2021.114952.
Du Q, Liu Q. ROS-responsive hollow mesoporous silica nanoparticles loaded with glabridin for anti-pigmentation properties. Micropor Mesopor Mater. 2021 Nov;327:111429. doi: 10.1016/j.micromeso.2021.111429.
Nasresfahani Z, Kassaee MZ. Bimetallic Ni/Cu mesoporous silica nanoparticles as an efficient and reusable catalyst for the sonogashira cross-coupling reactions. J Organomet Chem. 2021 May;937:121703. doi: 10.1016/j.jorganchem.2021.121703.
Aati S, Aneja S, Kassar M, Leung R, Nguyen A, Tran S. Silver-loaded mesoporous silica nanoparticles enhanced the mechanical and antimicrobial properties of 3D printed denture base resin. J Mech Behav Biomed Mater. 2022 Oct;134:105421. doi: 10.1016/j.jmbbm.2022.105421, PMID 36037709.
Rizzi F, Castaldo R, Latronico T, Lasala P, Gentile G, Lavorgna M. High surface area mesoporous silica nanoparticles with tunable size in the sub-micrometer regime: insights on the size and porosity control mechanisms. Molecules. 2021 Jul;26(14):4247. doi: 10.3390/molecules26144247, PMID 34299522.
Gisbert Garzaran M, Vallet Regi M. Redox-responsive mesoporous silica nanoparticles for cancer treatment: recent updates. Nanomaterials (Basel). 2021 Sep;11(9):2222. doi: 10.3390/nano11092222, PMID 34578538.