
Int J App Pharm, Vol 18, Issue 1, 2026, 215-229Original Article
ANALYTICAL ASSESSMENT OF CHEMICAL STABILITY AND SHELF-LIFE OF GOKSHURA CHURNA: A SCIENTIFIC APPROACH
NIHARIKA GADDAM1, RAVI GUNDAWAR1, KRISHNAMURTHY BHAT2, BASAVARAJ S. HADAPAD3, MUDDUKRISHNA BS1, MURALIDHAR BALLAL4, VASANTHARAJU SG1*
1Department of Pharmaceutical Quality Assurance, Manipal College of Pharmaceutical Sciences, Manipal Academy of Higher Education, Manipal-576104, (Karnataka) India. 2Department of Pharmaceutical Quality Assurance, School of Pharmaceutical Sciences, Manipal University, Jaipur-303007, (Rajasthan) India. 3Division of Ayurveda, Centre for Integrative Medicine and Research, Manipal Academy of Higher Education, Manipal-576104, (Karnataka) India. 4General Manager, SDM Ayurveda Pharmacy, Udupi-574118, (Karnataka) India
*Corresponding author: Vasantharaju SG; *Email: sg.vasanthraj@manipal.edu
Received: 09 Jun 2025, Revised and Accepted: 24 Nov 2025
ABSTRACT
Objective: Gokshura Churna is a versatile Ayurvedic remedy with a rich history of therapeutic use in promoting urinary, reproductive and physical health, it holds a significant place in traditional medicine. However, to ensure its long-term efficacy and safety, especially in modern applications, it is essential to support its use with scientific validation, particularly in terms of quality, stability and shelf-life.
Methods: The present study focuses on determining the shelf-life of Marketed Gokshura Churna formulation using reverse phase high performance liquid chromatography (RP-HPLC) method. Stability testing was conducted under both accelerated and long-term conditions, following international council for harmonisation of technical requirements for pharmaceuticals for human use (ICH) guidelines. Samples were analyzed at intervals of 0, 1, 3, 6, 9 and 12 mo. The chemical fingerprint of the formulation was established by using two analytical Markers Quercetin and Beta-sitosterol. In addition to chemical analysis, various quality control parameters were evaluated as per the Ayurvedic Pharmacopoeia of India (API), including organoleptic properties, Loss on drying, ash content, extractives values, pH and microbial load.
Results: Quercetin and Beta-sitosterol were eluted at 5.7 and 7.8 min. The overall results of the validation parameters of the Markers were within the limits. Stress studies confirmed the absence of co-eluting peaks and degradants under various stress conditions. All the Physicochemical parameters of the formulation were within the acceptable limits. Total microbial load analysis of the formulation showed that the bacterial count was within acceptable limits, while there is a marginal increase in the fungal count was observed. Based on the stability analysis of Quercetin and Beta-sitosterol marker content, the shelf life of Gokshura churna was estimated to be 29.80 and 26.20 mo.
Conclusion: This study provides a scientific foundation for future commercial stability testing and contributes to improved quality and safety of Gokshura churna.
Keywords: Stability study, Shelf-life, RP-HPLC, Marketed formulation, Gokshura churna, Quercetin and Beta-sitosterol
© 2026 The Authors. Published by Innovare Academic Sciences Pvt Ltd. This is an open access article under the CC BY license (https://creativecommons.org/licenses/by/4.0/)
DOI: https://dx.doi.org/10.22159/ijap.2026v18i1.55478 Journal homepage: https://innovareacademics.in/journals/index.php/ijap
INTRODUCTION
Gokshura, a term derived from Sanskrit where “Go” means cow and “Kshura” refers to hoof, alludes to the thorny fruit's resemblance to a cow’s hoofprint [1, 2]. Botanically known as Tribulus terrestris Linn., it belongs to the family Zygophyllaceae and is widely distributed across India and other tropical regions. In Ayurveda, Gokshura is traditionally administered in powdered form as Churna, which is documented in classical texts such as the Charaka Samhita, Sushruta Samhita and Bhavaprakasha Nighantu [3-5].
Phytochemical investigations of Gokshura Churna have identified key bioactive constituents such as Quercetin, Beta-sitosterol, Diosgenin, Kaempferol, Tribulosin and Tribuloside, which contribute to its wide range of therapeutic properties, including diuretic, anti-urolithic, anti-inflammatory, antioxidant and anti-diabetic effects [6]. Despite its long-standing clinical use, scientific data supporting the quality and stability of Gokshura Churna is limited.
Stability testing is essential to ensure the product’s safety, efficacy and shelf-life, as it evaluates the formulation’s behaviour under varying environmental conditions such as humidity, temperature and light exposure. This data is crucial for defining storage conditions, packaging requirements and expiry dates, ensuring both consumer safety and regulatory compliance [7].
Global health authorities such as the world health organization (WHO), european medicines agency (EMEA) and international council for harmonisation of technical requirements for pharmaceuticals for human use (ICH) emphasize the need for rigorous stability testing in Ayurvedic medicines. In alignment with these global standards, India has implemented its own regulatory measures for Ayurvedic and herbal products through the Ministry of AYUSH, under the Ministry of Health and Family Welfare, as per the Drugs and Cosmetics Rules 1945 [8, 9].
Reflecting this global emphasis, India formally introduced the concept of shelf-life for Ayurvedic products in 2005. A major regulatory advancement occurred with the release of the GSR 789 notification on August 12, 2016, which introduced Rule 161-B. This rule mandates clear labelling of expiry dates, prohibits the use of expired products, and requires scientifically validated shelf-life data. The shelf-life must be determined through real-time stability studies of formulations listed in the Ayurvedic Pharmacopoeia of India and supported by scientific evidence. Together, these national regulations align with international best practices, reinforcing product integrity, consumer safety and strengthen trust in traditional medicine systems [10, 11]. Despite regulatory progress, scientific evidence supporting the shelf-life of many Ayurvedic formulations listed in official gazette notification remains limited [12].
A major challenge lies in the inherent chemical complexity of these traditional medicines, which contain a wide range of phytochemicals such as flavonoids, alkaloids, phenolic compounds, tannins, sterols and terpenoids, each with distinct analytical properties. These compounds are often present in trace amounts, which poses challenges for accurate quantification. To address this, manufacturers/researchers utilize specific chemical constituents known as “Markers” to monitor product quality. These Markers are classified into Therapeutic Markers (with established medicinal activity), Chemical Markers (for botanical identification) and Analytical Markers (used in standardization and routine quality control). Reliable identification and measurement of these Markers are critical for evaluating the stability, efficacy and safety of Ayurvedic and herbal products [13, 14].
In this study, Quercetin and Beta-sitosterol were selected as analytical markers for fingerprinting and shelf-life evaluation of Gokshura Churna. Quercetin is known to enhance diuresis, reduce renal oxidative stress and inhibit urinary crystal deposition. It also exhibits anti-inflammatory, antimicrobial, and cardioprotective effects. Beta-sitosterol, while a milder diuretic, possesses antioxidant, hepatoprotective and antidiabetic properties. These markers were chosen due to their pharmacological relevance, reliable detectability, affordability, and availability making them suitable for routine quality evaluation [15-19].
The primary objective of this study was to assess the stability of a marketed Gokshura Churna formulation by quantifying Quercetin and Beta-sitosterol using a validated stability-indicating RP-HPLC method. Both accelerated (40±2 °C/75±5% RH) and long-term (30±2 °C/65±5% RH) stability studies were conducted in accordance with ICH Q1A(R2) guidelines. Samples were analyzed at predefined intervals for chemical marker content, loss on drying, ash values, extractive values, pH and microbial load. These findings provided the basis for determining the product’s shelf-life and affirmed its stability and quality under specified storage conditions.
MATERIALS AND METHODS
Chemicals and reagents
Gokshura churna was obtained from local Ayurvedic Manufacturer based in Udupi. Sigma-Aldrich (India) supplied the Markers Quercetin (>95% purity) and Beta-sitosterol (>95% purity) used in the study. HPLC grade solvents such as methanol and acetonitrile were acquired from Finar (India). Reagents such as sodium hydroxide and hydrochloric acid were procured from Loba Chemie (India), while hydrogen peroxide (H2O2) (30% v/v) was obtained from Himedia Laboratories (India). Milli-Q water used throughout the study was produced using a Merck Millipore Direct-Q® 3 system installed in the laboratory.
Instrumentation
A calibrated analytical balance (Model: AY220, Shimadzu, Japan) was used for accurately weighing standard markers, formulation and buffer salts. A calibrated digital pH meter (ELICO, India) was employed to assess the pH of the mobile phase. Filtration of the buffer solution was carried out using a vacuum filtration assembly (Merck Millipore) equipped with a 0.22 µm membrane filter, followed by degassing in an ultrasonic bath Sonicator (LABMAN, India). Sample preparations were performed with the aid of calibrated variable-volume micropipettes (Eppendorf and Super Fit XL), with volume capacities ranging from 10–100 µl and 100–1000 µl. High-Performance Liquid Chromatography (HPLC) analysis was performed on a Shimadzu system, consisting of an SCL-10A VP system controller, LC20-AD pump, SIL20-AC HT autosampler, CTO-10ASVP column oven, and SPD-M10A VP photodiode array (PDA) detector, operated with LabSolutions software. Thermal degradation studies and moisture content analysis (Loss on Drying) were performed using a hot air oven (Osworld, India), while ash content determination was carried out in a muffle furnace. Stability evaluations under both long-term and accelerated conditions were conducted using a Thermolab-manufactured stability chamber.
Preparation of quercetin and beta-sitosterol standard solutions
Primary stock solutions of Quercetin and Beta-sitosterol were individually prepared at a concentration of 1 mg/ml by dissolving 10 mg of each marker in 10 ml of methanol, assisted by bath sonication to ensure complete solubility. To obtain working standard solutions, 1 ml of each stock solution was diluted with methanol to a final volume of 10 ml, resulting in a concentration of 100 µg/ml. Subsequent dilutions were prepared as required from the working stock solutions to obtain desired concentrations for further analysis.
Selection of wavelength
The goal of the method development was to establish a reliable and efficient RP-HPLC method for the simultaneous detection and quantification of Beta-sitosterol and Quercetin. These two compounds exhibit distinct chemical characteristics and UV absorption properties, necessitating careful selection of chromatographic and detection conditions.
Working standard solutions of Quercetin and Beta-sitosterol were diluted with methanol to a final concentration of 10 µg/ml. These diluted solutions were scanned in the range of 400–200 nm using a double-beam UV-Visible spectrophotometer (UV-1800, Shimadzu) to determine their maximum absorbance wavelengths (λmax). The absorption maxima of both the Markers was found to be 215 nm. Therefore, this wavelength was selected as the detection wavelength for HPLC analysis [20].
HPLC method optimization
A reversed-phase Phenomenex C18 column (250 mm × 4.6 mm, 5 µm) was utilized to carry out the chromatographic separation. The mobile phase consisted of acetonitrile and 10 mmol potassium dihydrogen phosphate buffer (pH adjusted to 6.8) mixed in a 40:60 (v/v) ratio. Isocratic elution was employed with a constant flow rate of 1.0 ml/min. A sample volume of 20 µl was injected for each run, with the column temperature maintained at 25 °C. Detection was performed by utilising a photodiode array detector (PDA) at a wavelength of 215 nm. Each chromatographic run was completed within 12 min, enabling efficient separation and accurate quantification of the target analytes.
Method validation
Validation of the analytical method was performed as per the International Conference on Harmonisation of Technical Requirements for pharmaceuticals for human use (ICH) Q2(R1) guidelines, covering all essential performance parameters [21].
System suitability
Six replicate injections of a standard solution containing a mixture of Quercetin and Beta-sitosterol prepared at a concentration of 10 µg/ml, was analyzed using the developed HPLC method. Key chromatographic parameters, such as retention time, peak area, tailing factor, resolution and theoretical plate count, were recorded for each injection. The percent relative standard deviation (%RSD) for both retention time and peak area was calculated to evaluate the system’s consistency and reliability.
Specificity
A blank solution and a standard mixture containing Quercetin and Beta-sitosterol at a concentration of 10 µg/ml were injected into the HPLC system. The peak purity of each analyte was subsequently assessed to confirm the absence of co-eluting peaks/impurities.
Linearity
To estimate the range and linearity of the developed analytical method, a series of standard mixture were prepared, consisting of Quercetin at concentrations ranging from 0.05 to 2 µg/ml and Beta-sitosterol ranging from 5 to 30 µg/ml. We tested each concentration three times (n=3) using the optimized chromatographic conditions.
Limit of detection and limit of quantification
The limit of detection (LOD) and limit of quantification (LOQ) were calculated based on the standard deviation and slope derived from the calibration curve.
Accuracy
To determine the accuracy of the developed method, recovery studies were performed by spiking samples with well-known quantities of Quercetin and Beta-sitosterol at three concentration levels of 80%, 100%and 120% of the nominal concentration. For Quercetin, the tested concentrations were 0.32 µg/ml (80%), 0.40 µg/ml (100%) and 0.48 µg/ml (120%), while for Beta-sitosterol, the levels were 12 µg/ml (80%), 15 µg/ml (100%) and 18 µg/ml (120%). Each concentration level was injected in triplicate using the established chromatographic conditions. The percentage recovery was calculated for each concentration and the (% RSD) percentage relative standard deviation was used to assess the method's accuracy.
Precision
Six replicate injections of a standard mixture containing Quercetin and Beta-sitosterol at a concentration of 10 µg/ml were injected into the HPLC system. The markers' retention time and peak area were analyzed under optimal chromatographic conditions. The percentage relative standard deviation (%RSD) was determined using the mean peak area and the corresponding standard deviation.
Assay of gokshura churna
Accurately weigh 1 g of the Gokshura churna formulation and transfer it into a 10 ml volumetric flask. Make up the volume up to the calibrated mark with methanol. Subject the solution to sonication for 20 min to aid extraction, then allow it to stand undisturbed overnight to ensure complete extraction. An appropriate volume of the extract was transferred to centrifuge tube and centrifuged at 10,000 revolutions per minute for ten minutes. The clear supernatant solution was then pipetted out and subjected to analysis using the developed RP-HPLC method. The percentage recovery of the target markers was subsequently determined.
Stress degradation studies
The purpose of the stress studies was to assess the stability of the Markers Quercetin and Beta-sitosterol under various forced degradation conditions. The samples of Quercetin and Beta-sitosterol were subjected to different stress factors, including acid, alkali, thermal, oxidative and photolytic stress. All degradation experiments were conducted in triplicate using developed RP-HPLC method and the percentage degradation of the markers was calculated [22-25].
Acid hydrolysis
To investigate the effect of acid hydrolysis, an aliquot of 40 ml of 0.1M hydrochloric acid was added to 10 ml solution containing mixture of Quercetin and Beta-sitosterol at a concentration of 100 μg/ml. The acid and the marker mixture were thoroughly mixed; it was heated at 80 °C using reflux condensing method for 5 hrs and neutralized with 0.1M sodium hydroxide solution. Prior to HPLC analysis, the sample was further diluted.
Base hydrolysis
The alkali degradation behaviour of Quercetin and Beta-sitosterol was assessed by subjecting them to an alkaline medium containing 0.1M sodium hydroxide. The 10 ml of marker mixture, with a concentration of 100 μg/ml, was combined with 40 ml of alkali solution. The resulting mixture was then heated for a duration of 5 hrs through reflux condensation at a temperature of 80 °C. Subsequently, the solution was neutralized with 0.1 M hydrochloric acid, before performing the HPLC analysis the sample was additionally diluted.
Oxidative degradation
A solution containing 2 ml of Quercetin and Beta-sitosterol (100 μg/ml) was combined with 8 ml of a 30% v/v hydrogen peroxide solution to induce oxidative degradation. The mixture was stored at room temperature in a dark environment for a duration of 24 h. Afterwards, the samples were suitably diluted and analyzed using developed HPLC method.
Photolytic degradation
An experiment was carried out to examine the photolytic degradation of markers. Due to the unavailability of a dedicated photostability chamber at our facility, we adopted an alternative yet scientifically sound approach to evaluate the photostability of the Markers. The Markers containing 30 mg of Quercetin and Beta-sitosterol were subjected to direct sunlight for a period of 6-8 h. Later, the samples were diluted and analyzed using optimized HPLC method [26].
Thermal degradation
To determine the thermal degradation, 30 mg of each marker was weighed and transferred to petri plates. The plates were then placed in a hot air oven that was set to 80 °C for 6 h. The samples were diluted and the degradation of the Markers were analyzed using optimized HPLC method.
Stability studies
Gokshura churna samples were subjected to both long-term stability and accelerated studies in a stability chamber. The study was carried out according to the recommendations that were stated in the ICH Q1A(R2) guideline [27].
Storage conditions
Gokshura churna samples were subjected to accelerated stability testing by storing them at a temperature of 40±2 °C with a relative humidity of 75±5% for six months. For long-term stability evaluation, the samples were kept at 30±2 °C and 65±5% relative humidity for a duration of twelve months.
Frequency of withdrawal
The samples were withdrawn from the stability chamber and analyzed initially and at a gap of 1, 3 and 6 mo for accelerated condition and for long term condition at 3, 6, 9 and 12 mo.
Parameters to be evaluated
The physico-chemical parameters, such as organoleptic properties, loss on drying, ash content, extractive values and pH, were assessed at predetermined intervals. According to the procedure described in the Ayurvedic Pharmacopoeia of India, the test for microbial contamination was carried out at the specified time periods. The Marker content was also analyzed at regular intervals using RP-HPLC method [28-30].
Organoleptic properties
The appearance, colour and odour of the Gokshura churna was analysed. The colour of the Gokshura churna was examined by spreading a small quantity of the churna on to a watch glass over a neutral white backdrop. Its odour was evaluated by gently smelling the sample.
Loss on drying
A porcelain dish was thoroughly cleaned and pre-dried in a hot air oven at 105 °C for 30 min. Once cooled, exactly 3.0 gs of the churna formulation was placed into the dish. The sample was subjected to oven drying at 105 °C, until a stable weight was achieved, confirming that all moisture had been removed. Once drying was complete, the porcelain dish was cooled to ambient temperature inside a desiccator prior to measuring its final weight. The moisture content was calculated as the percentage loss in weight relative to the initial mass of the churna sample.
Estimation of total ash content
An accurately weighed 3-gram portion of the churna was transferred to a silica crucible that had been pre-ignited and tared before the procedure. The sample was then incinerated by slowly raising the temperature to 500–650 °C, until it turned white, implying the complete removal of carbonaceous matter. The crucible was then allowed to cool in a desiccator and the total ash content was determined based on the mass of the air-dried sample.
Determination of acid-insoluble ash value
The crucible containing the total ash was treated with 25 ml of dilute hydrochloric acid and heated gently by boiling for 5 min. Subsequently, about 5 ml of hot water was added, and the mixture was transferred to the crucible. The insoluble residue was collected by filtration through ashless filter paper. The residue on the filter paper was washed repeatedly with hot water until the filtrate was neutral. The filter paper along with the insoluble matter was then returned to the crucible, incinerated at a suitable temperature until a constant weight was achieved. The crucible, continuing the residue, was cooled in a desiccator to ambient temperature and weighed.
Determination of water-soluble ash value
The total ash obtained was boiled with 25 ml of water for 5 min. The insoluble residue was collected by filtration using ashless filter paper and rinsed thoroughly with hot water. The collected insoluble ash residue was placed into a pre-tared silica crucible and heated in a muffle furnace at 450 °C for 15 min. Water-soluble ash content was calculated by subtracting the mass of the insoluble ash from the total ash mass and expressing the result as a percentage of the air-dried sample.
Water-soluble extractive value
Accurately weighed 5 gs of churna was placed in a glass-stoppered conical flask and macerated with 100 ml of chloroform-water for 24 h. During the initial 6 h, the mixture was subjected to continuous stirring, after which it was allowed to stand undisturbed for the remaining 18 h. The solution was subsequently filtered and 25 ml of the clear filtrate was carefully transferred to a china dish for further processing. The filtrate was evaporated to dryness on a water bath and dried in an oven at 105 °C, cooled in a desiccator, then the residue was weighed. The percentage of water-soluble extractive was calculated by dividing the weight of the dried residue by the initial sample weight and multiplying by 100.
Alcohol soluble extractive value
For this procedure, methanol was employed as the extraction solvent instead of chloroform-water, with all other steps identical to those used in the determination of water-soluble extractives. After the extraction process and subsequent drying, the solid residue was weighed. The percentage of alcohol (methanol)-soluble extractives was computed using the mass of the residue in relation to the initial weight of the air-dried sample.
pH determination
A 5-gram sample of Gokshura churna was accurately weighed and transferred into a 100 ml beaker containing distilled water. The mixture was subjected to sonication for approximately 15 min to ensure complete dissolution. The pH of the prepared solution was then determined using a properly calibrated digital pH meter.
Assessment of microbial load
Microbial testing of Gokshura churna was carried out in compliance with the standards outlined in the Indian Ayurvedic Pharmacopoeia. The total viable bacterial count was determined using nutrient agar medium, while the total fungal count was assessed using Sabouraud dextrose agar medium.
Total bacterial plate count
For the bacterial plate count, sterile Petri dishes measuring 9 to 10 cm in diameter were used. To each dish, 1 ml of the pretreated sample was added and mixed with approximately 15 ml of sterile, liquefied casein soyabean digest agar that had been cooled to a temperature not exceeding 45 °C. Alternatively, the pretreated sample was spread evenly over the surface of solidified agar in similar Petri dishes using a sterile spreader. When necessary, the sample was diluted to ensure that the number of resulting colonies did not exceed 300 per plate, allowing for accurate evaluation. A minimum of two replicate plates was prepared for each dilution to ensure reliability. The plates were then incubated at a temperature between 30 °C and 35 °C for five days. If a consistent and reliable colony count was obtained in a shorter period, the results were recorded earlier. After incubation, the visible colonies were counted and results were calculated using the plate with the highest number of colonies that did not exceed 300.
Total fungal plate count
For the fungal plate count, the same procedure was followed, except sabouraud dextrose agar media was used instead of casein soyabean digest agar. Incubation was carried out at a temperature between 20 °C and 25 °C for five days, or less if sufficient colony development occurred earlier. Colony counts were recorded from plates containing not more than 100 colonies to ensure accuracy in the final estimation.
Shelf-life estimation
The stability samples were analysed using developed and validated RP-HPLC method and the determination was carried out in triplicates. The formulation shelf-life was calculated by utilizing the Systat Sigmaplot software (15.0) which was approved by the USFDA [31, 32].
Statistical analysis
All investigations were performed in triplicate (n = 3), and the results were expressed as mean±standard deviation (SD) and percent relative standard deviation (%RSD). Statistical analysis of Marker content of Quercetin and Beta-sitosterol at various time points under accelerated and long-term storage conditions was conducted using one-way ANOVA followed by Tukey’s post hoc test, performed with GraphPad Prism software, version 10 (GraphPad Software Inc., USA).
RESULTS AND DISCUSSION
According to the literature, analytical technique such as high-performance thin layer chromatography (HPTLC) has been reported for the quantification of phytoconstituents in Gokshura tablets. However, similar studies focusing on Gokshura churna are notably lacking. Most of the existing research has primarily concentrated on clinical evaluations and preliminary phytochemical investigations involving Gokshura extracts. To date, there are no published reports on the shelf-life estimation or stability studies by using HPLC specifically pertaining to Gokshura churna. Reverse-phase high-performance liquid chromatography (RP-HPLC) is one of the most widely used chromatographic techniques for the identification and quantification of marker compounds. Meher SK et al., has performed experimental studies on the Renal Protective effect of Gokshura plant extract and Varuna plant extract. Priyanka Rathore et al., Estimated Diosgenin in Gokshura Tablet and Mangeferin in Pushyanug Churna Formulation using high-performance thin layer chromatography method. Anil M. Sanshi et al. has studied the comparative effect of Gokshura Churna over Tilanalakshara Yoga in the management of urolithiasis. Ramteke Rajkala et al., has studied the Pharmacognostical study of powdered drug Gokshura and Punarnava and performed Physico-chemical analysis of Gokshura-Punarnava Basti. Malik Waseem Abbas et al. assessed the phytochemical constituents, in vitro antioxidant activity using DPPH, FRAP, and H2O2 assays, in vitro anticancer activity using MTT assay and in vitro and in vivo anti-inflammatory properties of Tribulus terrestris [33-37].
Selection of wavelength
Quercetin is a flavonoid containing a highly conjugated aromatic system, which contributes to its strong UV absorbance, with a maximum absorbance (λmax) typically observed around 369 nm. In contrast, Beta-sitosterol, a phytosterol structurally similar to cholesterol, lacks a chromophore exhibits UV absorbance in the low-wavelength region, particularly around 210-215 nm. During preliminary experiments, it was observed that Beta-sitosterol does not absorb at 369 nm and hence cannot be effectively detected at this wavelength. While Quercetin could be accurately monitored at its λmax, the absence of detectable Beta-sitosterol absorbance at this wavelength made it unsuitable for dual-analyte quantification. To address this, 215 nm was selected as the detection wavelength, allowing both compounds to be monitored simultaneously. Although this wavelength does not correspond to the absorbance maximum of Quercetin, it still provides sufficient sensitivity due to the broad UV absorption range of the Quercetin. Konsa K. et al. employed a detection wavelength of 202 nm for the quantification of Beta-sitosterol in supplements using RP-HPLC method. Similarly, Bhishnurkar P. et al. utilized 210 nm for the simultaneous estimation of Beta-sitosterol and Gallic acid in Nigella sativa seeds by RP-HPLC method [38, 39]. The selection of 215 nm wavelength ensures reliable detection of Beta-sitosterol, while maintaining acceptable sensitivity for Quercetin. The UV-Spectra of the Markers was illustrated in fig. 1.
Method development
Multiple experimental trials were performed to optimize key chromatographic parameters for the proposed RP-HPLC method, including flow rate, buffer selection, mobile phase pH, mobile phase composition and column oven temperature. A buffer solution of potassium dihydrogen phosphate (10 mmol, pH 6.8) was chosen for the mobile phase, based on the markers' pKa values and results from comparative trials with other buffer systems. The stationary phase was selected by evaluating both literature references and the physicochemical behaviour of the compounds; a Phenomenex C18 column was ultimately selected for its compatibility and performance in achieving effective separation. Following systematic evaluation, the optimal conditions were established as described in the method. Under these conditions, Quercetin and Beta-sitosterol were successfully detected, with retention times of approximately 5.7 and 7.8 min, respectively. Chromatograms of the blank and marker compounds Quercetin and Beta-sitosterol are shown in fig. 2 and 3.
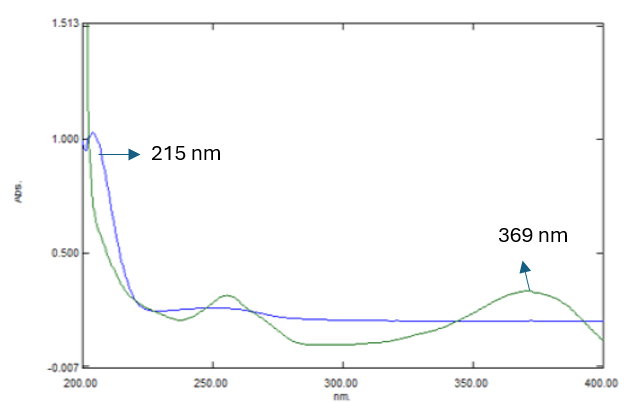
Fig. 1: UV-spectra of quercetin and beta-sitosterol
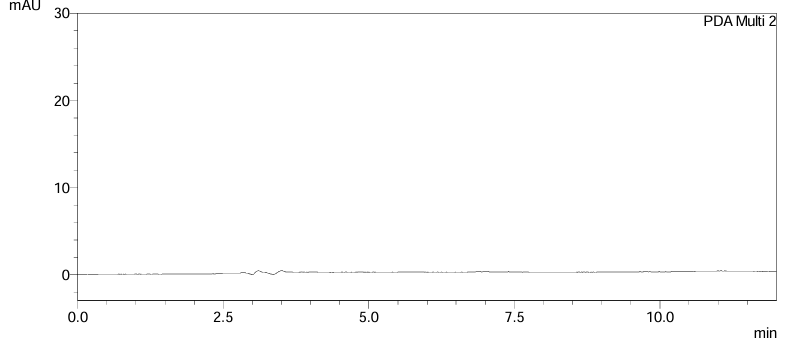
Fig. 2: Blank chromatogram
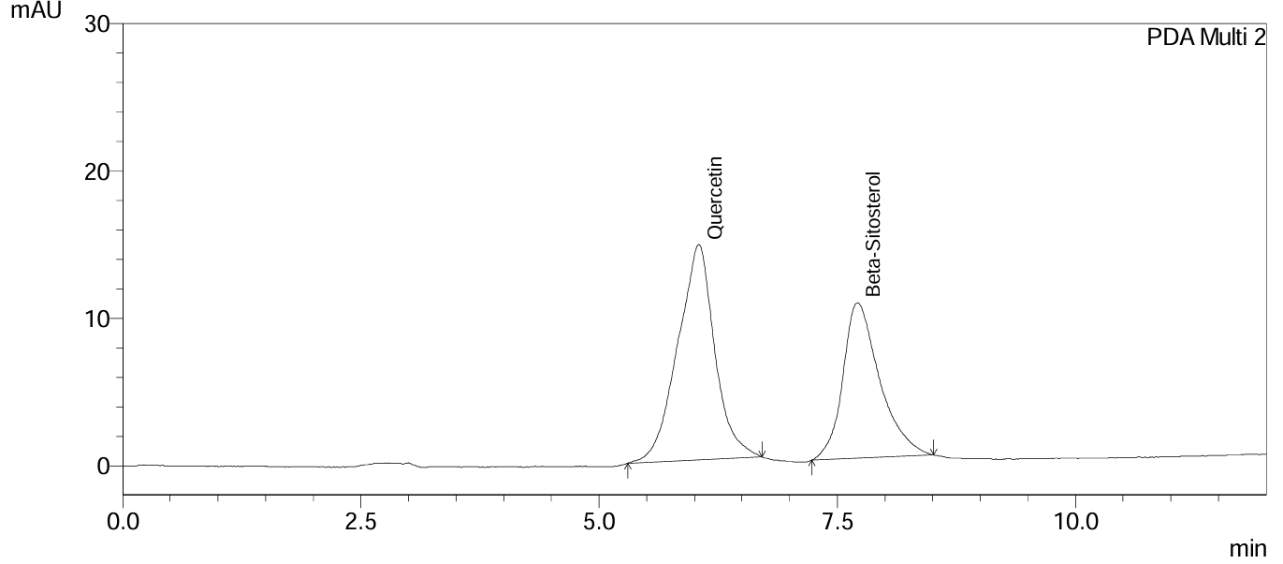
Fig. 3: Chromatogram of quercetin and beta-sitosterol
Method validation
System suitability
System suitability was evaluated by monitoring key chromatographic parameters for each injection, including retention time, peak area, theoretical plate count and tailing factor. The method met established acceptance criteria: the relative standard deviation (% RSD) for both peak area and retention time (Rt) was below 2%, the tailing factor did not exceed 2, and the theoretical plate count was greater than 2000. These findings confirm the reliability and suitability of the developed method for analysis. The system suitability data was summarized in table 1.
Table 1: Results of system suitability
| Parameter | Observation | Acceptance criteria | |
| Quercetin | Beta-sitosterol | ||
| %RSD of retention time of 6 injections | 0.159 | 0.218 | NMT 2% |
| %RSD of area of 6 injections | 0.734 | 1.172 | NMT 2% |
| Plate count | 3122 | 2492 | More than 2000 |
| Tailing factor | 1.196 | 1.245 | NMT 2.0 |
| Resolution | 4.872 | NLT 2 | |
Specificity
The Marker compounds were eluted at retention times of approximately 5.7 min and 7.8 min, corresponding to Quercetin and Beta-sitosterol, respectively, which were represented in fig. 3. The specificity assessment demonstrated absence of interfering peaks at these retention times, indicating that the method is free from interference by impurities or degradation products. This confirms the sensitivity and high selectivity of the developed RP-HPLC method. Peak purity of the Markers Quercetin and Beta-sitosterol were represented in fig. 4 and 5.
Linearity
The method demonstrated a linear response across the evaluated concentration ranges, with Quercetin showing linearity at 0.05-2.0 µg/ml and Beta-sitosterol across 5.0–30 µg/ml. The data confirming this linear correlation are summarized in tables 2 and 3 and illustrated in fig. 6 and 7.
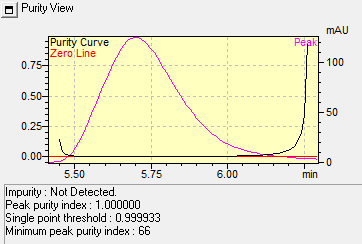
Fig. 4: Peak purity of quercetin
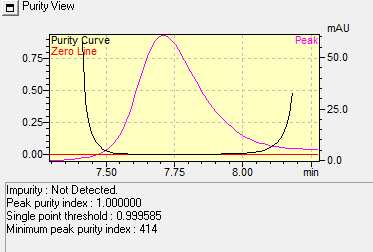
Fig. 5: Peak purity of beta-sitosterol
Table 2: Results of quercetin linearity
| S. No. | Concentration (µg/ml) | Area average |
| 1 | 0.05 | 4602 |
| 2 | 0.2 | 12010 |
| 3 | 0.4 | 21328 |
| 4 | 0.8 | 39958 |
| 5 | 1.2 | 59789 |
| 6 | 2 | 100039 |
| Regression equation | y = 49173x+1296.1 | |
| Correlation coefficient | R2=0.9995 | |
| Slope | 49173 | |
| y-Intercept | 1296 |
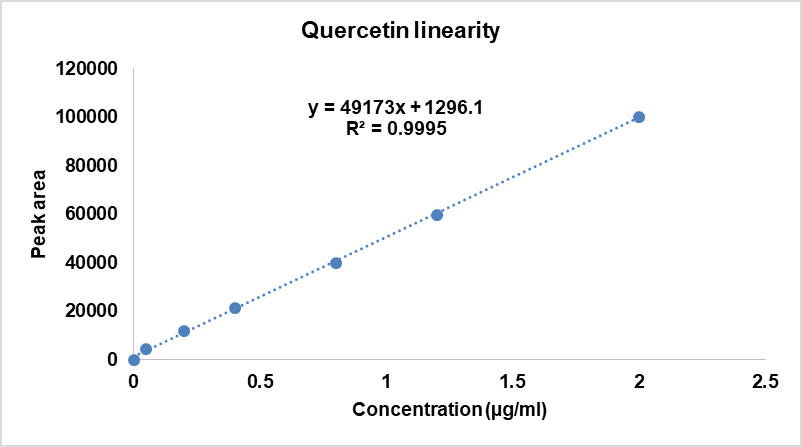
Fig. 6: Linearity plot of quercetin
Table 3: Linearity results of beta-sitosterol
| S. No. | Concentration (µg/ml) | Area average |
| 1 | 5 | 4962 |
| 2 | 10 | 9729 |
| 3 | 15 | 14593 |
| 4 | 20 | 20457 |
| 5 | 25 | 24721 |
| 6 | 30 | 29665 |
| Regression Equation | y = 994.58x-43.393 | |
| Correlation Coefficient | R2= 0.9993 | |
| Slope | 994.58 | |
| y-Intercept | 43.393 |
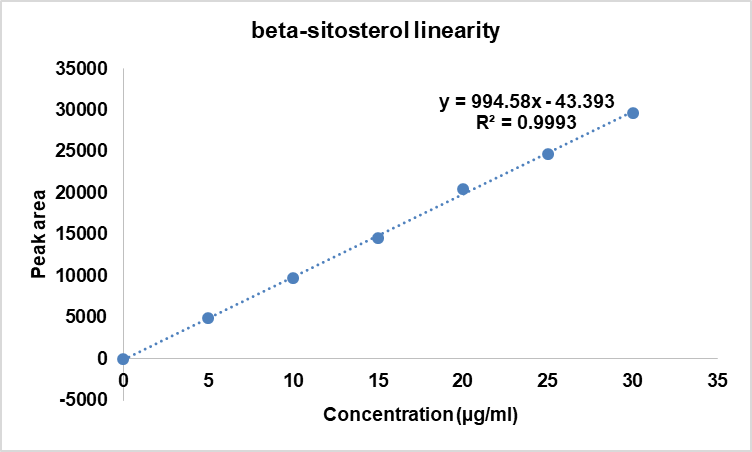
Fig. 7: Linearity plot of beta-sitosterol
Limit of detection (LOD) and limit of quantification (LOQ)
The LOD and LOQ were established based on the signal-to-noise ratio method, utilizing the standard deviation of the response and the slope derived from the calibration curve. For Quercetin, the LOD was calculated as 0.001383 µg/ml and the LOQ as 0.004191 µg/ml. In the case of Beta-sitosterol, the LOD and LOQ were determined to be 0.060389 µg/ml and 0.1829 µg/ml, respectively.
Accuracy
The accuracy of the method was assessed by conducting recovery studies at three concentration levels 80%, 100% and 120% of the target Marker concentration. The method exhibited excellent accuracy, with percentage recovery values ranged from 98.18% to 102.70%, these results indicate the suitability of the method for the precise and reliable quantification of the Marker compounds. Detailed accuracy and overall validation results are presented in table 4.
Table 4: Overall results of validation
| Parameter | Quercetin | Beta-sitosterol | Acceptance criteria | Inference |
| Specificity | Marker peak is well resolved | Peak purity >0.999 | Peak purity >0.999 | Passed |
| LOD | 0.001383µg/ml | 0.060389 µg/ml | - | - |
| LOQ | 0.004191µg/ml | 0.1829 µg/ml | - | - |
| Accuracy 80% | 98.18% | 98.58% | 95.0% to 105.0% | Passed |
| 100% | 99.102% | 99.22% | ||
| 120% | 102.70% | 100.41% | ||
| Intraday precision | %RSD of peak area: 0.881 | %RSD of peak area: 1.241 | %RSD<2 % | Passed |
| %RSD of retention time: 0.11858 | %RSD of retention time: 0.2068 | |||
| Interday precision | %RSD of peak area: 1.124 | %RSD of peak area: 1.017 | ||
| %RSD of retention time: 0.1803 | %RSD of retention time: 0.376 |
Precision
Precision was assessed by performing six replicate injections of Quercetin and Beta-sitosterol using the HPLC system. Both intra-day and inter-day variability were assessed by calculating the average, standard deviation (SD) and percentage relative standard deviation (%RSD) for peak area and retention time. The %RSD values obtained were within the predetermined acceptance criteria, demonstrating the method’s reproducibility and reliability.
Assay of the formulation
The recovery percentages for Quercetin and Beta-sitosterol were found to be 95.32% and 93.18%, respectively, demonstrating the suitability and reliability of the analytical procedure for their determination in Gokshura churna. The average recovery data for Gokshura churna is presented in table 5, while fig. 8 displays the corresponding chromatogram for Quercetin and Beta-sitosterol in the Gokshura churna formulation.
Table 5: Average recovery of markers from gokshura churna
| S. No. | % Recovery | |
| Quercetin | Beta-sitosterol | |
| 1 | 95.06% | 93.15% |
| 2 | 95.59% | 93.42% |
| 3 | 95.31% | 92.98% |
| Average | 95.32% | 93.18% |
| SD± | 0.0026 | 0.0022 |
All the values are presented as mean±SD, n=3
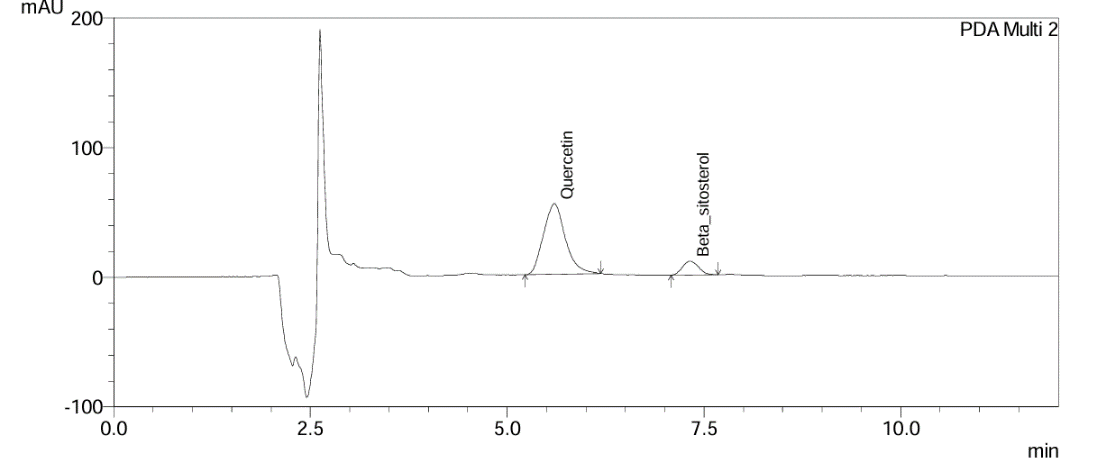
Fig. 8: Chromatogram of markers in gokshura churna
Stress degradation studies
Following the ICH guidelines, stress degradation studies were conducted to identify potential degradation products under various stress conditions. During the analyses, there is a possibility that degradant peaks may sometimes co-elute with the marker compounds at the identical retention times. To ensure accurate identification, a photodiode array detector was employed to verify the peak purity at the marker-specific wavelengths. The results demonstrated that Quercetin exhibited stability against alkaline hydrolysis, heat (thermal) and light-induced (photolytic) degradation. Conversely, Beta-sitosterol showed notable degradation under alkaline hydrolysis and oxidative stress conditions. Importantly, the analysis confirmed the lack of interference from impurities or degradants across all tested circumstances. This validates the specificity of the developed method for quantifying Markers even in the existence of potential degradants. The percentage degradation found under each condition is summarized in table 6.
Table 6: Results of stress studies
| S. No. | Type of degradation | Stress conditions | % Degradation observed | Peak purity | |
| Quercetin | Beta-sitosterol | ||||
| 1. | Acid hydrolysis | 0.1M Hydrochloric acid at 80 °C for 5 h. | 24.71%±0.15 | 22.39%±0.54 | Pass |
| 2. | Alkali hydrolysis | 0.1M Sodium Hydroxide at 80 °C for 5 h. | 20.75%±0.31 | 31.48%±0.62 | Pass |
| 3. | Oxidative degradation | 30% v/v Hydrogen Peroxide at room temperature for 24 h | 28.55%±0.19 | 26.23%±0.88 | Pass |
| 4. | Thermal degradation | Inside hot air oven at 80 °C for 6 h | 20.03%±0.47 | 18.61%±0.24 | Pass |
| 5. | Photolytic degradation | Exposed to direct sunlight for 6 h | 13.87%±0.91 | 15.58%±0.32 | Pass |
All the values are presented as mean±SD, n=3
Estimation of shelf-life
A stability assessment was carried out in accordance with the guidelines prescribed by the Ministry of AYUSH to evaluate the shelf-life of the traditional marketed formulation Gokshura churna by quantifying the levels of Quercetin and Beta-sitosterol, under both accelerated and long-term storage conditions using high-performance liquid chromatography (HPLC). The degradation kinetics of the Markers Quercetin and Beta-sitosterol in Gokshura churna were evaluated using Systat Sigma Plot version 15 (approved by USFDA), by applying a zero-order degradation model. This model was selected based on the linear relationship observed between percent label claim and time and the absence of any logarithmic transformation, indicating a constant rate of degradation over time. The regression analysis supported this model, showing a good linear fit across the data points. Based on this analysis, the estimated shelf-lives were 29.80 mo for Quercetin and 26.20 mo for Beta-sitosterol.
The reason for the shorter shelf-lives of the Markers was due to the instability of the Markers in acid, alkali and oxidative stress conditions. Quercetin showed 24% and 28% of degradation under acidic and oxidative conditions, respectively, while Beta-sitosterol showed 25% and 30% degradation under alkaline and oxidative conditions. These findings demonstrate that both Markers are chemically labile, particularly in oxidative environments, which could significantly affect the long-term stability of the formulation if adequate protective measures are not taken. To maintain product quality throughout the period of 24months, it is crucial to implement proper storage conditions. The formulation should be stored in airtight, light-resistant containers, at temperatures below 25 °C, in a cool, dry environment and protected from direct sunlight and humidity. These conditions help to minimize oxidative and hydrolytic degradation, preserving the stability of the phytoconstituents.
According to regulatory principles and ICH guidelines, the shorter shelf-life among the markers Quercetin and Beta-sitosterol should be used to establish the expiry date of the formulation. Based on this criterion, Beta-sitosterol, with a shelf-life of 26.20 mo, serves as the limiting factor and therefore determines the shelf-life of Gokshura churna. Additionally, the Ayurvedic Pharmacopoeia of India prescribes a standard shelf-life of two years (24 mo) for Churna formulations, which aligns closely with the experimental findings and provides an appropriate safety margin. Chromatographic profiles obtained during the study are illustrated in fig. 9 to 16, while fig. 17 and 18 present the shelf-life predictions. Summary data on the average marker content and physicochemical characteristics values over the storage period are compiled in tables 7 and 8.
Table 7: Marker content and stability data of Gokshura churna at accelerated condition
| Parameter | Time points | |||||
| Initial | 1M | 3M | 6M | Limit | Inference | |
| Description | Pale yellow to green coloured powder having aromatic smell | |||||
| LOD (%) | 5.51±0.14 | 5.84±0.19 | 6.07±0.21 | 6.35±0.13 | NMT 10 | Pass |
| Total ash (%) | 7.28±0.038 | 7.21±0.073 | 7.33±0.012 | 7.25±0.088 | NMT 13 | Pass |
| Acid insoluble ash (%) | 0.53±0.075 | 0.69±0.092 | 0.47±0.069 | 0.31±0.052 | NMT 3 | Pass |
| Water soluble ash (%) | 0.58±0.017 | 0.46±0.079 | 0.61±0.026 | 0.54±0.039 | NMT 2 | Pass |
| Alcohol soluble extractive (%) | 26.75±0.23 | 27.13±0.15 | 26.89±0.18 | 26.07±0.24 | NLT 5 | Pass |
| Water soluble extractive (%) | 22.81± 0.12 | 22.47±0.23 | 23.56±0.25 | 24.12±0.21 | NLT 15 | Pass |
| pH (10%) aqueous solution | 5.1±0.095 | 5.2±0.077 | 5.3±0.025 | 5.4±0.035 | 5 to 6 | Pass |
| Total bacterial count (CFU/g) | 9×10³ | 12×103 | 41×103 | 82×104 | 105CFU/g | Pass |
| Total fungal count (CFU/g) | 5×101 | 8×10² | 12×103 | 22×103 | 103CFU/g | Pass |
| Assay (%) | Quercetin 95.69±0.17 | 95.21±0.19 | 94.78±0.15 | 94.22±0.21 | % Change from Initial NMT 5% | Pass |
| Beta-sitosterol 93.91±0.21 | 93.33±0.18 | 92.78±0.27 | 92.24±0.32 | |||
All the values are presented as mean±SD, n=3
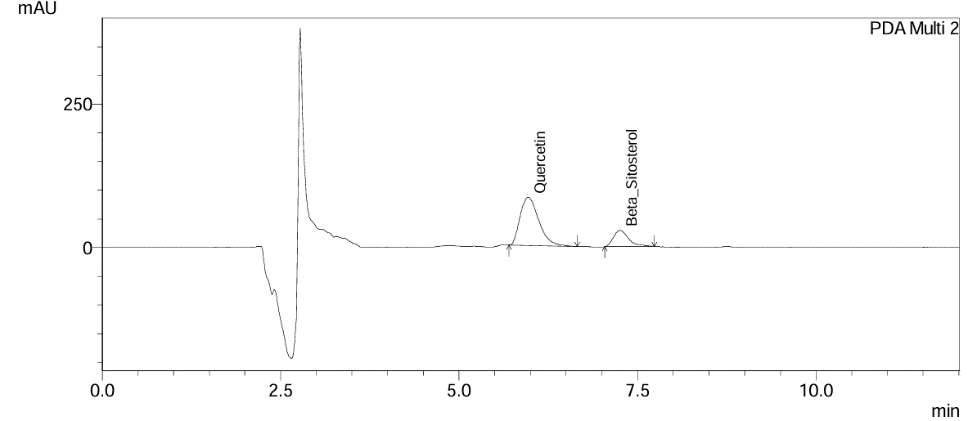
Fig. 9: Initial time point chromatogram of gokshura churna
Table 8: Marker content and stability data of Gokshura churna at long term condition
| Parameter | Time points | ||||||
| Initial | 3M | 6M | 9M | 12M | Limit | Inference | |
| Description | Pale yellow to green coloured powder having aromatic smell | ||||||
| LOD (%) | 5.51±0.14 | 5.82±0.15 | 6.26±0.11 | 6.63±0.17 | 6.95±0.12 | NMT 10 | Pass |
| Total ash (%) | 7.28±0.038 | 7.21±0.015 | 7.36±0.081 | 7.13±0.097 | 7.29±0.094 | NMT 13 | Pass |
| Acid insoluble ash (%) | 0.53±0.075 | 0.72±0.043 | 0.54±0.095 | 0.39±0.058 | 0.48±0.052 | NMT 3 | Pass |
| Water soluble ash (%) | 0.58±0.017 | 0.57±0.041 | 0.65±0.043 | 0.53±0.023 | 0.45±0.078 | NMT 2 | Pass |
| Alcohol soluble extractive (%) | 26.75±0.23 | 27.25±0.21 | 26.68±0.14 | 26.12±0.17 | 25.81±0.24 | NLT 5 | Pass |
| Water-soluble extractive (%) | 22.81± 0.12 | 22.59±0.13 | 23.24±0.16 | 22.98±0.19 | 23.75±0.24 | NLT 15 | Pass |
| pH (10%) aqueous solution | 5.1±0.095 | 5.1±0.015 | 5.3±0.044 | 5.4±0.012 | 5.5±0.041 | 5 to 6 | Pass |
| Total bacterial count (CFU/g) | 9×10³ | 9×10³ | 14×104 | 18×104 | 58×104 | 105CFU/g | Pass |
| Total fungal count (CFU/g) | 5×101 | 13×102 | 20×103 | 32×103 | 45×103 | 103CFU/g | Pass |
| Assay (%) | Quercetin 95.69±0.17 |
95.57±0.29 | 95.08±0.23 | 94.43±0.31 | 93.97±0.21 | % Change from Initial NMT 5% | Pass |
Beta-sitosterol 93.91±0.21 |
93.85±0.23 | 93.47±0.19 | 92.93±0.18 | 92.36±0.25 | |||
All the values are presented as mean±SD, n=3
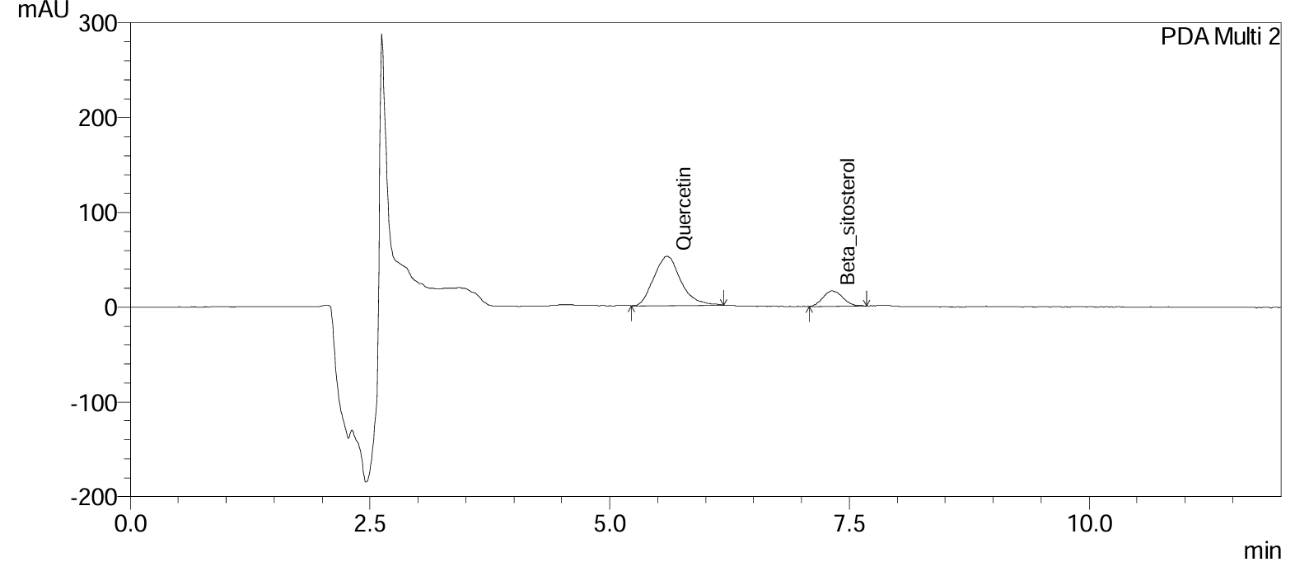
Fig. 10: Chromatogram of Gokshura churna at the 1st mo accelerated stability time point
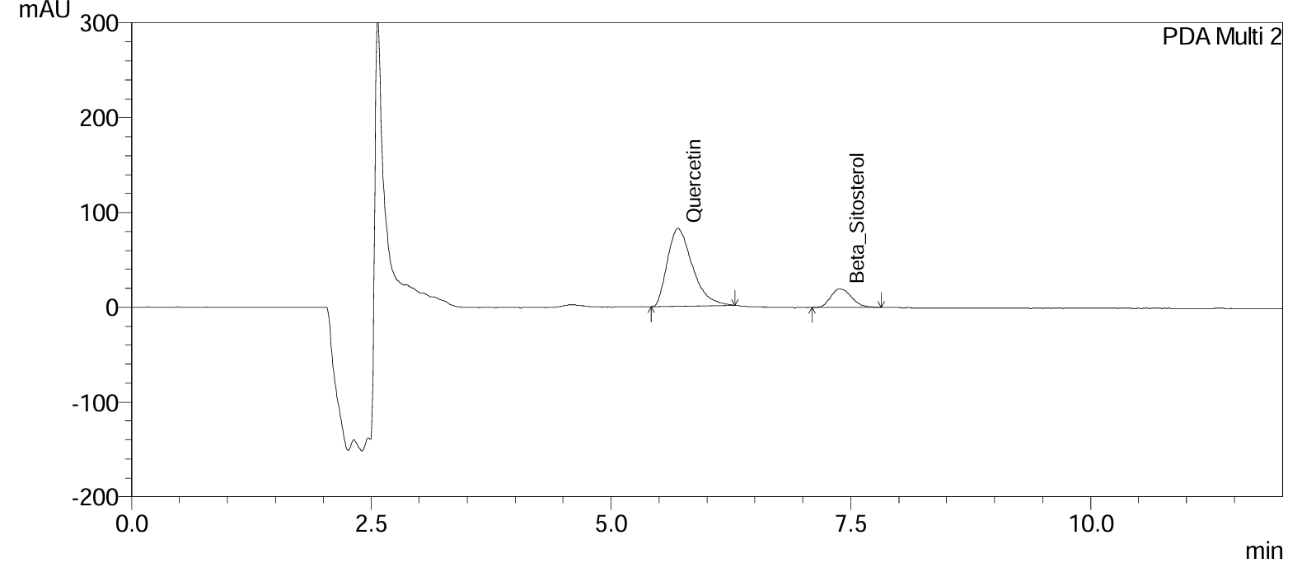
Fig. 11: Chromatogram of Gokshura churna at the 3rd mo accelerated stability time point
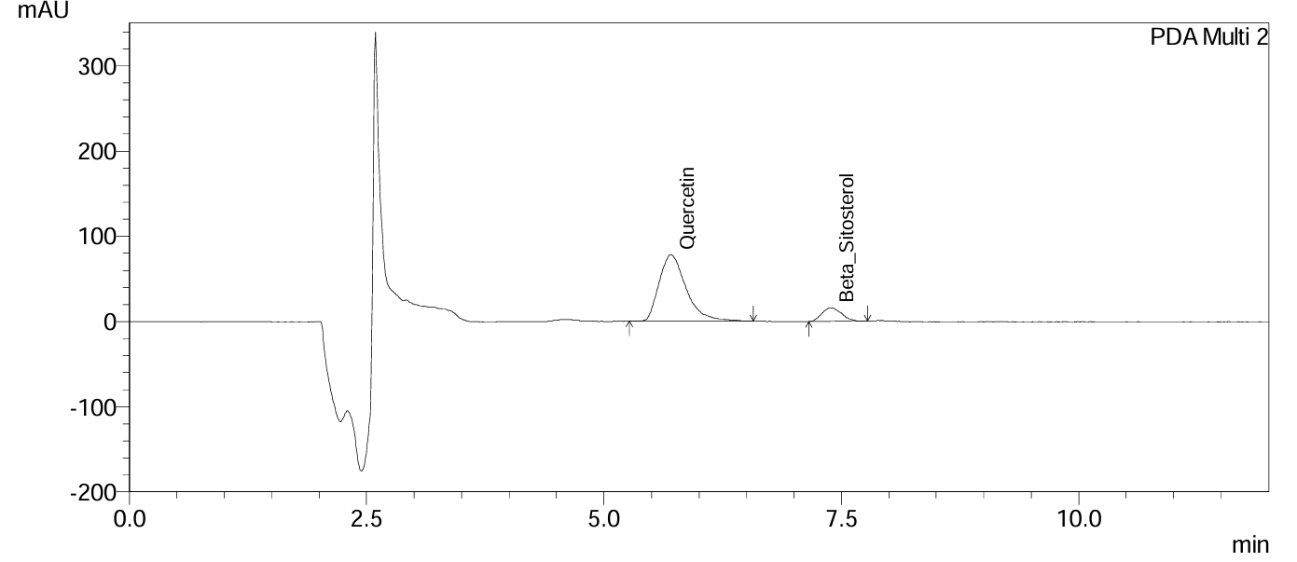
Fig. 12: Chromatogram of Gokshura churna at the 6th mo accelerated stability time point
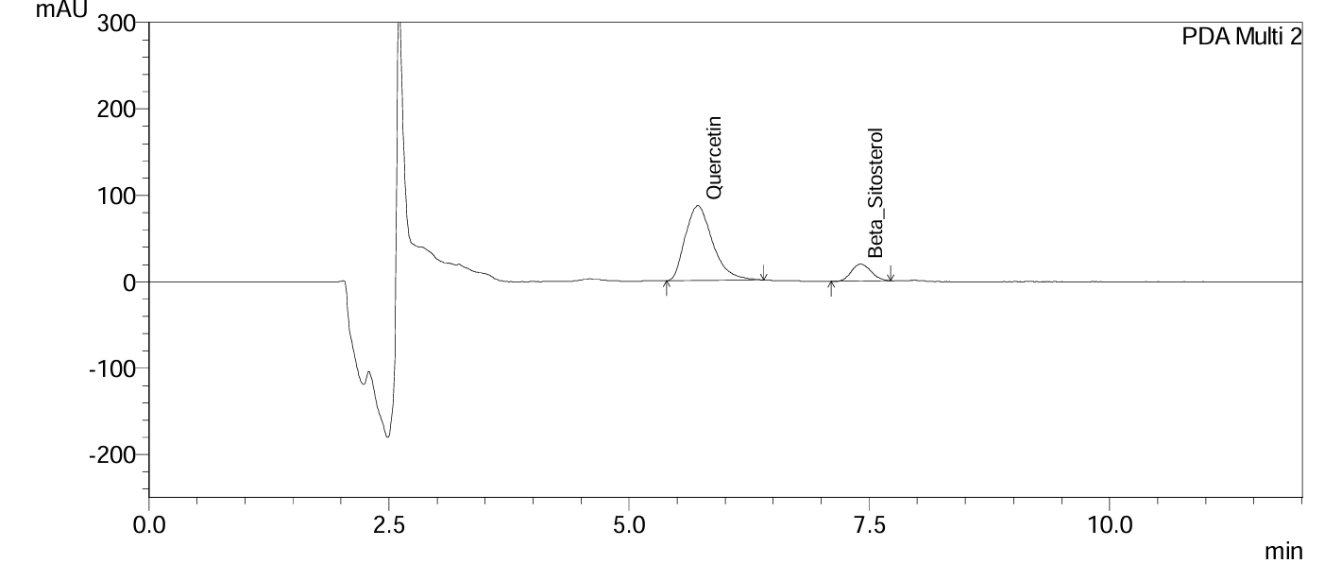
Fig. 13: Chromatogram of Gokshura churna at the 3rd mo long-term stability time point
Fig. 14: Chromatogram of Gokshura churna at the 6th mo long-term stability time point
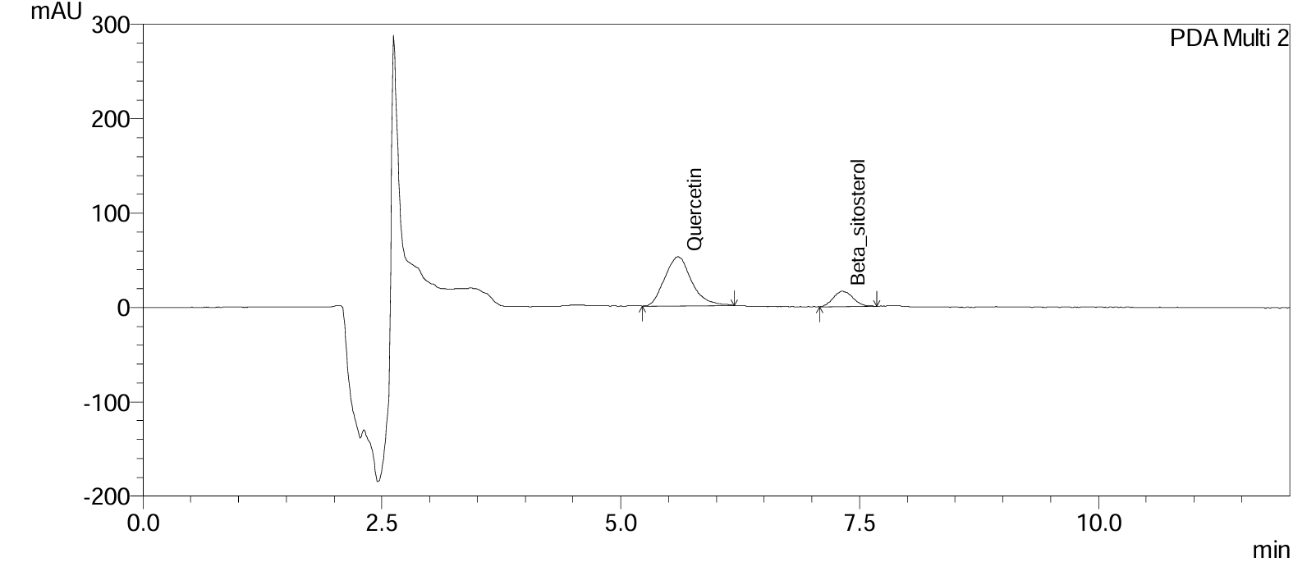
Fig. 15: Chromatogram of gokshura churna at the 9th mo long-term stability time point
Fig. 16: Chromatogram of gokshura churna at the 12th mo long-term stability time point
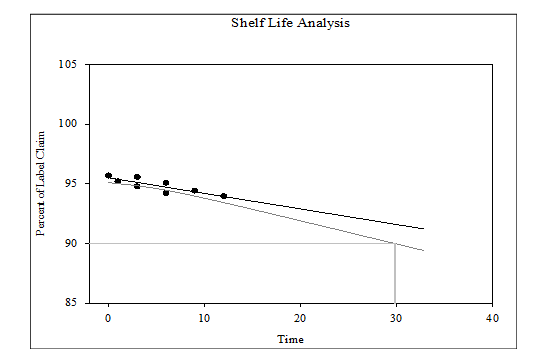
Fig. 17: Shelf-life of gokshura churna (t90 = 29.80months) considering the marker content analysis of quercetin
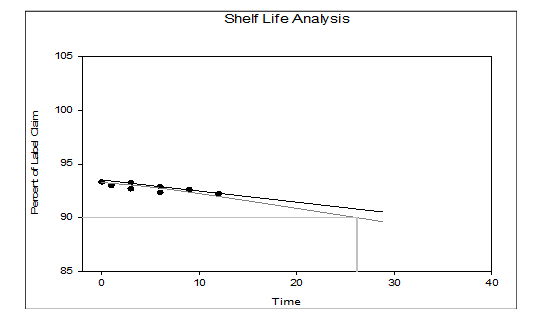
Fig. 18: Shelf-life of Gokshura churna (t90 = 26.20 mo) considering the marker content analysis of Beta-sitosterol
Table 9: One-way ANOVA summary data of quercetin
| Source of variation | SS | DF | MS | F (DFn, DFd) | p-value | Significance |
| Between groups | 8.269 | 7 | 1.181 | F (7,16) =23.12 | P<0.0001 | **** (Yes) |
| Within groups | 0.8176 | 16 | 0.05110 | |||
| Total | 9.086 | 23 |
Note: Data passed normality test (Gaussian distribution assumed). R² = 0.9100. SS-Sum of Squares, DF-degrees of freedom, MS-mean square.
Statistical analysis
The results of the one-way ANOVA, followed by Tukey’s HSD post hoc analysis, demonstrated a statistically significant decrease in Marker content of Quercetin across the evaluated time points under both accelerated and long-term storage conditions. The ANOVA yielded a highly significant F-value (F = 23.12, p<0.0001), indicating that storage duration had a noticeable effect on the stability of the marker compound Quercetin. Tukey’s multiple comparison test was performed to identify specific group differences in Quercetin across different time points. The analysis revealed that several time-dependent changes in Quercetin were statistically significant (p<0.05). Notably, the content at the initial time point T0 was significantly higher than at T2 (+0.91), T3 (+1.47), T6 (+1.26), and T7 (+1.72), with the greatest difference observed between T0 and T7 (p<0.05). Similarly, T1 showed significantly higher values than T3 (+0.99), T6 (+0.78), and T7 (+1.24), indicating a consistent decline in Quercetin content following the early storage period. Furthermore, T2 was significantly higher than T4 (–0.79) and T7 (+0.81), while T3 was significantly lower than both T4 (–1.35) and T5 (–0.86), reinforcing the pattern of decline. T4, although not significantly different from T0 or T1, showed significantly higher values than T6 (+1.14) and T7 (+1.60), suggesting that Quercetin content begins to degrade more rapidly after T4. T5 also showed a significant drop compared to T7 (+1.11). In contrast, no significant differences were observed between closely spaced time points such as T0 vs T1 (+0.48), T0 vs T4 (+0.12), T0 vs T5 (+0.61), T1 vs T4 (–0.36), T1 vs T5 (+0.13), T2 vs T3 (+0.56), and T5 vs T6 (+0.65), suggesting relative stability in early and mid-stages of storage. These findings reinforce the overall trend of decreasing Quercetin content with increased storage duration. The results support the conclusion that the degradation of the Quercetin is both time-dependent and statistically significant. Table 9 displays the results of the one-way ANOVA of Quercetin.
Table 10: One-way ANOVA summary data of beta-sitosterol
| Source of variation | SS | DF | MS | F (DFn, DFd) | p-value | Significance |
| Between groups | 8.479 | 7 | 1.211 | F (7,16) = 22.24 | p<0.0001 | **** (Yes) |
| Within groups | 0.8714 | 16 | 0.05446 | |||
| Total | 9.350 | 23 |
Note: Data passed normality test (Gaussian distribution assumed). R² = 0.9068. SS-Sum of Squares, DF-degrees of freedom, MS-mean square.
The results of the one-way ANOVA, followed by Tukey’s HSD post hoc analysis, demonstrated a statistically significant decrease in Marker content of Beta-sitosterol across the evaluated time points under both accelerated and long-term storage conditions. The analysis revealed a statistically significant difference among the means (F (7,16) = 22.24, p<0.0001), with an R² value of 0.9068, indicating that approximately 90.7% of the variability in the data was explained by the time factor. To identify specific group differences, a post hoc Tukey’s HSD test was performed. The critical difference was calculated as 0.546 at α = 0.05. The results showed significant differences between several time points. For instance, T0 differed significantly from T1 (0.58), T2 (1.13), T3 (1.67), T6 (0.98), and T7 (1.55), but not from T4 (0.06) or T5 (0.44). T1 significantly differed from T2 (0.55), T3 (1.09), and T7 (0.97), while its comparisons with T4, T5, and T6 did not yield significant differences. T2 showed significant differences with T4 (−1.07) and T5 (−0.69), but not with T3, T6, or T7. T3 differed significantly from T4 (−1.61), T5 (−1.23), and T6 (−0.69), though not from T7. Furthermore, T4 showed significant differences from T6 (0.92) and T7 (1.49), while its difference with T5 (0.38) was not significant. T5 differed significantly from T7 (1.11), though not from T6 (0.54). Lastly, T6 and T7 also significantly differed (0.57). These findings confirm a statistically significant time-dependent variation in the Beta-sitosterol marker content. Table 10 represents the One-way ANOVA data of the Marker Beta-sitosterol.
Physicochemical properties
The organoleptic assessment offers a quick and effective method for confirming the identity and assessing the quality of Ayurvedic formulations, particularly in Churna (powdered) form. In the present analysis, sensory characteristics such as appearance, color and odour were examined. The results indicated that the formulation's organoleptic features conformed to the established standards, affirming the product’s quality and uniformity.
Moisture is intrinsically present in unprocessed herbal materials that should be minimized to preserve quality and shelf-life of herbal formulations. The initial processing of crude drugs from harvested plant material typically involves cleaning and grinding to eliminate soil and other extraneous matter, followed by drying, a critical step that directly influences the purity and stability of the final product. Inadequate drying can lead to microbial contamination or enzymatic breakdown of bioactive constituents. Therefore, both the extent and rate of moisture removal, as well as the drying conditions, are crucial in ensuring product integrity. Proper drying not only ensures the final product’s stability but also depends on how efficiently the moisture is removed. If the drying process is too slow, deterioration can occur before drying is complete. In this study, the measured moisture content confirmed that the formulation was thoroughly dried under appropriate conditions, indicating optimal drying practices were followed [40].
When Churna is subjected to controlled incineration, it produces an ash residue that represents the inorganic constituents, including metal salts and silicon dioxide. This parameter is vital for assessing the overall quality and purity of herbal formulations. The total ash value may vary significantly and serves as an indicator of the presence of impurities, substitution or adulterated products. Elevated ash content may result from improper processing or contamination. During high-temperature incineration, certain volatile substances like alkali metal chlorides may be lost. The total ash primarily consists of carbonates, phosphates, silicates and silica and includes both plant-derived (physiological) and external (non-physiological) mineral content. The acid-insoluble portion of the ash is particularly useful for detecting contamination by earthy materials such as sand or soil. Comparing this with total ash helps differentiate between natural plant minerals and external contaminants. Water-soluble ash refers to the portion of the ash that dissolves in water, providing a measure of inorganic substances excluding water-insoluble components like silica [41]. In the present evaluation, the ash values of Gokshura churna were found to be within acceptable Pharmacopoeia limits, indicating a good level of purity and appropriate processing.
The determination of alcohol and water-soluble extractive values plays a crucial role in assessing the presence and availability of active phytoconstituents in the formulation. In the present study, both alcohol (methanol) and water-soluble extractives were found to be within the established limits, suggesting that the formulation contains a satisfactory amount of soluble active compounds. These results indicate good formulation quality, proper selection and processing of raw materials, as extractive values are often influenced by the nature of the plant material and the method of preparation.
The pH value is a key indicator of the acidic or alkaline nature of a formulation and any variation over time may reflect changes in chemical stability. In this study, a slight increase in the pH of the Gokshura churna was observed during the storage period, which remained within acceptable limits and did not indicate any adverse chemical transformation. The Markers Beta-sitosterol and Quercetin, in Gokshura churna formulation, undergoes some amount of oxidative degradation under accelerated storage conditions. Thus, when products exposed to high-humidity and oxygen-permissive conditions, the risk of exceeding microbial limits increases significantly. To mitigate this, Process improvements, including optimized drying and strict hygiene practices during manufacturing, are essential to reduce microbial load. Enhanced packaging using moisture and oxygen-barrier materials, along with silica gel desiccants, should be used to limit environmental exposure. Incorporation of AYUSH-approved preservatives can further inhibit fungal growth. Additionally, storage conditions should be labelled as maintain temperature below 25 °C and relative humidity under 60%. These measures collectively support microbial stability and regulatory compliance. Throughout the storage duration, a slight reduction in the marker compound concentration was noted. Despite this decline, the marker content consistently remained within acceptable range defined by API (Ayurvedic Pharmacopoeia of India), indicating that the formulation maintains its chemical integrity and therapeutic potential over time. This shows that the formulation retains its phytochemical stability and complies with the required quality standards for shelf-life and efficacy.
Limitations and future prospectives
The present study focused on the stability-indicating method development and validation of an RP-HPLC method for the simultaneous analysis of Quercetin and Beta-sitosterol in a marketed Gokshura churna formulation, as well as its stability under accelerated and long-term storage conditions. The developed method successfully resolved the marker compounds, with no evidence of co-eluting peaks or impurities. However, structural identification of degradation products was not undertaken in this study. As the current scope was limited to quantitative analysis, future studies will incorporate LC-MS techniques to enable characterization of degradation products and provide deeper insight into degradation mechanisms.
In addition, Beta-sitosterol exhibits poor UV absorbance due to the lack of strong chromophores, detection at 215 nm was selected based on its UV absorbance spectrum. This wavelength aligns with previously reported methods, where detection has been performed in the 202–215 nm range. The selected wavelength was found to be adequate for achieving acceptable sensitivity, accuracy and reproducibility within the validated method. Nonetheless, for future applications requiring enhanced sensitivity, especially in complex herbal matrices or for trace-level quantification, advanced detection techniques such as evaporative light scattering detector (ELSD) or charged aerosol detector (CAD) may be explored to further improve detection capabilities and broaden the method's applicability.
CONCLUSION
The present study evaluated the quality and stability of Marketed formulation Gokshura Churna using physicochemical parameters and marker-based analysis, in accordance with the standards outlined in the Ayurvedic Pharmacopoeia of India. A key aspect of the study was the stability assessment of the formulation using Quercetin and Beta-sitosterol as analytical markers under both long-term and accelerated storage conditions. The estimated shelf-life, based on the stability study of these markers, was 29.80 mo for Quercetin and 26.20 mo for Beta-sitosterol, both exceeding the currently labelled shelf-life of 24 mo for Churna formulations. These findings support the Ministry of AYUSH’s mandate for evidence-based shelf-life declarations and highlight the importance of scientific validation over traditional or assumed expiry periods.
In conclusion, the study demonstrates that marker-based stability testing is a robust and scientifically valid approach for determining the shelf-life of Ayurvedic formulations. By integrating traditional Ayurvedic principles with modern analytical techniques, it enhances regulatory compliance, ensures product standardization and promotes the global acceptance of Ayurvedic medicines. Furthermore, it provides a practical framework for evaluating the stability of other classical formulations, encouraging wider adoption in both industrial and academic contexts.
ACKNOWLEDGEMENT
The authors express their gratitude to Manipal Academy of Higher Education for providing Dr TMA Pai fellowship and contingency support to Ms. Gaddam Niharika. The authors would like to Acknowledge Department of Pharmaceutical Quality Assurance and Manipal College of Pharmaceutical Sciences for providing necessary facilities for research.
FUNDING
The authors express their gratitude to Manipal Academy of Higher Education for providing Dr TMA Pai fellowship and contingency support to Ms. Gaddam Niharika.
AUTHORS CONTRIBUTIONS
Conceptualization: Niharika Gaddam and S. G. Vasantharaju, Methodology: Niharika Gaddam Software: Niharika Gaddam, S. G. Vasantharaju, Krishnamurthy Bhat. Formal analysis: Niharika Gaddam, S. G. Vasantharaju and Basavaraj S Hadapad. Investigation: Niharika Gaddam, B. S. Muddukrishna and Gundawar Ravi, Resources: Niharika Gaddam, S. G. Vasantharaju, Muralidhar Ballal. Data curation: Niharika Gaddam, Gundawar Ravi and Basavaraj S Hadapad. Writing original draft, preparation: Niharika Gaddam, B. S. Muddukrishna and Krishnamurthy Bhat. Writing, review and editing: Niharika Gaddam, S. G. Vasantharaju. All authors have read and agreed to the published version of the manuscript.
CONFLICT OF INTERESTS
All authors declare that they do not have any conflicts of interest.
REFERENCES
Manhas E, Singh AK, Kumar S. A systematic medico-historical review of gokshura (Tribulus terrestris L.): a traditional Indian medicine. J Pharm Res Int. 2022;34(31A):10-23. doi: 10.9734/jpri/2022/v34i13A35570.
Chhatre S, Nesari T, Somani G, Kanchan D, Sathaye S. Phytopharmacological overview of Tribulus terrestris. Pharmacogn Rev. 2014;8(15):45-51. doi: 10.4103/0973-7847.125530, PMID 24600195.
Saeed M, Munawar M, Bi JB, Ahmed S, Ahmad MZ, Kamboh AA. Promising phytopharmacology, nutritional potential health benefits and traditional usage of Tribulus terrestris L. herb. Heliyon. 2024;10(4):e25549. doi: 10.1016/j.heliyon.2024.e25549, PMID 38375303.
Arun N, Kadibagil Vinay R, Ganti Basavaraj Y. Various dosage forms of Ayurveda. Unique J Ayurvedic Herb Med. 2014;2(4):20-3.
Premlata RB, Jasani P. A historical review of Gokshura (Tribulus terristris Linn). World J Pharm Med Res. 2025;11(2):107-15.
Choudhary S, Kaurav H, Chaudhary G. Gokhru (Tribulus terrestris and Pedalium Murex): medicinal importance of chotagokhru and badagokhru in Ayurveda and modern science. Asian J Pharm Clin Res. 2021;14(6):6-13. doi: 10.22159/ajpcr.2021.v14i6.41366.
Bajaj S, Singla D, Sakhuja N. Stability testing of pharmaceutical products. J Appl Pharm Sci. 2012;2(3):129-38. doi: 10.7324/JAPS.2012.2322.
Bansal G, Suthar N, Kaur J, Jain A. Stability testing of herbal drugs: challenges regulatory compliance and perspectives. Phytother Res. 2016;30(7):1046-58. doi: 10.1002/ptr.5618, PMID 27073177.
Singh S, Shukla VK. Current regulations for herbal medicines in India. Int J Drug Reg Affairs. 2021;9(2):30-4. doi: 10.22270/ijdra.v9i2.466.
Government of India, Ministry of Ayurveda, Yoga and Naturopathy, Unani, Siddha and Homeopathy (AYUSH). The Gazette of India: AYUSH Notification. 2016 Aug 12. Available from: https://main.in/genericcontent/gazette-notification-gsr-no-789e-dated-12th-august2016-revising-shelf-life-asu-drugs. [Last accessed on 28 Apr 2025].
Alam, Anzarand Mehta P, Tiwari, Himanshu. Stability testing and shelf-life determination of Ayurveda, siddha and unani medicine. International Ayurvedic. Med J. 2019;7(1):79-86.
Kaur I, Suthar N, Kaur J, Bansal Y, Bansal G. Accelerated stability studies on dried extracts of Centella asiatica through chemical HPLC, HPTLC, and biological activity analyses. J Evid Based Complementary Altern Med. 2016;21(4):NP127-37. doi: 10.1177/2156587216661468, PMID 27486096.
Sachan AK, Kumar A. Stability testing of herbal products. J Chem Pharm Res. 2015;7(12):511-4.
Kushwaha SK, Kushwaha N, Maurya N, Rai AK. Role of markers in the standardization of herbal drugs: a review. Arch Appl Sci Res. 2010;2(1):225-9.
Chaiyarit S, Phuangkham S, Thongboonkerd V. Quercetin inhibits calcium oxalate crystallization and growth but promotes crystal aggregation and invasion. Curr Res Food Sci. 2024;8:100650. doi: 10.1016/j.crfs.2023.100650, PMID 38145155.
Sharma I, Khan W, Ahmad S. In vitro and ex vivo approach for anti-urolithiatic potential of bioactive fractions of gokhru with simultaneous HPLC analysis of six major metabolites and their exploration in rat plasma. Pharm Biol. 2017;55(1):701-11. doi: 10.1080/13880209.2016.1266671, PMID 27982733.
Chinnappan S, Wei Ing L, Min T, Yung Shan L, Ker Ni C, Jia Xuan S. Molecular mechanism of phytochemicals for the treatment of urolithiasis. Curr Trends Biotechnol Pharm. 2023;17(4A):141-50. doi: 10.5530/ctbp.2023.4s.102.
Yang D, Wang T, Long M, Li P. Quercetin: its main pharmacological activity and potential application in clinical medicine. Oxid Med Cell Longev. 2020;2020(1):8825387. doi: 10.1155/2020/8825387, PMID 33488935.
Khan Z, Nath N, Rauf A, Emran TB, Mitra S, Islam F. Multifunctional roles and pharmacological potential of β-sitosterol: emerging evidence toward clinical applications. Chem Biol Interact. 2022;365:110117. doi: 10.1016/j.cbi.2022.110117, PMID 35995256.
Ruangsuriya J, Charumanee S, Jiranusornkul S, Sirisa Ard P, Sirithunyalug B, Sirithunyalug J. Depletion of β-sitosterol and enrichment of quercetin and rutin in Cissus quadrangularis Linn fraction enhanced osteogenic but reduced osteoclastogenic marker expression. BMC Complement Med Ther. 2020;20(1):105. doi: 10.1186/s12906-020-02892-w, PMID 32245457.
Guideline ICH. Validation of analytical procedures Q2. Vol. R1. Geneva, Switzerland: ICH; 2022.
Md Isha Ali SA, Gaddam N, Bhat K, Muddukrishna BS, Ballal M, Vasantharaju SG. Determination of shelf life of an ayurvedic formulation, Kaishora Guggulu, using RP-HPLC analysis of chemical markers. Rasayan J Chem. 2023;16(3):1509-15. doi: 10.31788/RJC.2023.1638336.
Damle MC, Dilip Meshram P. Development and validation of stability-indicating high-performance thin-layer chromatographic method for budesonide. Asian J Pharm Clin Res. 2023;16(12):77-82. doi: 10.22159/ajpcr.2023.v16i12.48393.
Rajesh R. Stability indicating RP-HPLC method development and validation for the analysis of doxepin hydrochloride in bulk and pharmaceutical dosage form. Int J Pharm Pharm Sci. 2024;16(4):27-35. doi: 10.22159/ijpps.2024v16i4.50126.
Saha M, Gupta A, Shetty S, Mutalik S, Nandakumar K, Raghu Chandrashekar H. DoE-aided optimization of RP-HPLC method for simultaneous estimation of amoxicillin and tinidazole loaded mucoadhesive GRDDS formulation for the treatment of H. pylori. Chromatographia. 2024;87(9):533-48. doi: 10.1007/s10337-024-04346-8.
Gupta A, Kossambe RV, Moorkoth S. Box-behnken design assisted eco-friendly RP-HPLC-PDA method for the quantification of paclitaxel: application to evaluate the solubility of paclitaxel-cyclodextrin complex. Int J App Pharm. 2024;16(6):305-15. doi: 10.22159/ijap.2024v16i6.51690.
ICH. Stability testing of new drug substances and products (Q1A(R2)). Geneva: International Council for Harmonisation; 2003 Feb. p. 1-24.
The Ayurvedic Pharmacopoeia of India. Part I. Vol. VI. New Delhi: Government of India, Ministry of Health and Family Welfare, Department of AYUSH; 2008.
Joshi KB, Nariya MB, Patgiri BJ. Pharmaceutical standardization of Astercantha longifolia kshara. Int J Pharm Pharm Sci. 2022;14(11):60-4. doi: 10.22159/ijpps.2022v14i11.46148.
Ratnah ST, Salasa AM. Quality standardization of longan seed extract (Euphoria longan stend). Int J Curr Pharm Sci. 2022;14(2):31-5. doi: 10.22159/ijcpr.2022v14i2.1948.
Ali SAMI, Gaddam N, Muddukrishna BS, Bhat K, Datarkar S, Ballal M, Vasantharaju SG. Shelf life determination of Khushmanda Rasayana towards scientific evidence for the chemical stability. J Appl Pharm Sci. 2024;14(3):136–44. doi: 10.7324/JAPS.2024.161815.
Niharika G, MD Isha Ali SA, Bhat K, Hadapad BS, Muddukrishna BS, Ravi G. Scientific evidence for stability evaluation and shelf-life estimation of Vacha churna by using RP-HPLC. Int J App Pharm. 2024;16(4):154-62. doi: 10.22159/ijap.2024v16i4.51117.
Meher SK, Mukherjee PK, Chaudhury SK, Marjit B, Shaw BP. Experimental studies on the renal protective effect of Gokshura (Tribulus terrestris Linn) and Varuna (Crataeva nurvala Buch-Ham). Res J Pharmacol Pharmacodyn. 2016;8(2):75-82. doi: 10.5958/2321-5836.2016.00014.8.
Rathore P, Daniel K, Daniel V, Singh C, Yashwant GAK, Gupta AK. Estimation of active components in gokshura tablet and Pushyanug churna formulation using high-performance thin layer chromatography method. Int J Drug Deliv Technol. 2022;12(4):1507-12. doi: 10.25258/ijddt.12.4.04.
Sanshi DA, Hegde DP. The effect of Gokshura Churna over Tilanalakshara Yoga in the management of Mutrashmari a randomized comparative clinical study. JAIMS. 2018;3(5):1-7. doi: 10.21760/jaims.v3i5.13811.
Ramteke Rajkala RR, Thakar AB, Shukla VJ, Harisha CR. A preliminary physico-chemical assay of Gokshura-Punarnava Basti-a pilot study. Int J Res Ayurveda Pharm. 2011;2(2):343-9.
Abbas MW, Hussain M, Akhtar S, Ismail T, Qamar M, Shafiq Z. Bioactive compounds antioxidant, anti-inflammatory anti-cancer and toxicity assessment of Tribulus terrestris-in vitro and in vivo studies. Antioxidants (Basel). 2022;11(6):1160. doi: 10.3390/antiox11061160, PMID 35740057.
Khonsa K, Setyaningrum DL, Saputro AH, Amelia T, Ibrahim S, Damayanti S. Analysis of β-sitosterol in supplement using high-performance liquid chromatography: development and validation. Rasayan J Chem. 2022;15(3):1997-2003. doi: 10.31788/RJC.2022.1536752.
Bhishnurkar P, Deo SS, Inam FS, Mahmood SH, Taher D, Lambat TL. Simultaneous determination of β-sitosterol and gallic acid in Nigella sativa seeds using reverse-phase high-performance liquid chromatography. SN Appl Sci. 2020;2(11):1873. doi: 10.1007/s42452-020-03709-8.
Irudaya CD, Venkatesan U, Srinivasan R, Moorthy S, Subramaniyan S. Stability and shelf-life studies in Ayurvedic medicine: Triphala. J Pharmacogn Phytochem. 2024;13(1):306-13. doi: 10.22271/phyto.2024.v13.i1d.14844.
Kavitha C, Nalini CN, Radha R, Prabhu TP, Bharathi RV. Comparative standardization study of ayurvedic formulations of Gokshuradi churna. J Pharm Negat Results. 2022;13(8):2026-31. doi: 10.47750/pnr.2022.13.S08.248.