
Int J App Pharm, Vol 17, Issue 6, 2025, 406-416Original Article
A VALIDATED ANALYTICAL METHOD FOR RANITIDINE HCL THROUGH LC-MS/MS, HPLC AND QUALITY BY DESIGN APPROACH.
DEBANGANA PAL1, BABU B.1*, SM HABIBUR RAHMAN2, KALIRAJAN R.3, CHANDAN C.4
1Department of Pharmaceutical Analysis, JSS College of Pharmacy, JSS Academy of Higher Education and Research, Ooty, Nilgiris, Tamil Nadu, India. 2PSG College of Pharmacy, Coimbatore, Tamil Nadu, India. 3Department of Pharmaceutical Chemistry, JSS College of Pharmacy, JSS Academy of Higher Education and Research, Ooty, Nilgiris, Tamil Nadu, India. 4Department of Biochemistry, The Oxford College of Science, Bangalore, Karnataka, India
*Corresponding author: Babu B.; *Email: babu@jssuni.edu.in
Received: 19 Jun 2025, Revised and Accepted: 25 Aug 2025
ABSTRACT
Objective: The current study aimed to develop and validate simple, precise, and highly sensitive LC-MS/MS and HPLC methodologies for the quantitative estimation of Ranitidine HCl in pharmaceutical formulations. The goal was to develop a speedy and dependable technique for routine quality control and regulatory analysis.
Methods: Chromatographic separation was achieved using an Atlantis C18 column (150×4.6 mm, 5µm) under isocratic elution mode. The mobile phase consisted of 10 mmol ammonium acetate (solvent A) and acetonitrile (solvent B) in a 10:90 v/v ratio, delivered at a flow rate of 0.7 ml/min. An injection volume of 10µl* was employed, and the run time was 4 min. Ranitidine HCl was eluted at 1.993 min. The method was validated in accordance with ICH Q2 (R1) guidelines for parameters including linearity, sensitivity, accuracy, precision, and robustness.
Results: The LC-MS/MS method showed excellent linearity across a concentration range of 5-250 ng/ml with a correlation coefficient (R2) of 0.9998. The limit of detection (LOD) and limit of quantification (LOQ) were determined to be 1.0 ng/ml and 3.0 ng/ml, respectively. Recovery ranged from 95.33% to 97.93% and relative standard deviation (RSD) was 0.69%, confirming the method’s accuracy and precision.
Conclusion: The validated LC-MS/MS and HPLC methods are simple and sensitive for the quantification of ranitidine HCl. Both techniques demonstrated robust performance with high accuracy and precision. Their successful application to a commercial formulation confirms their suitability for pharmaceutical quality control and supports regulatory compliance in the routine analysis of ranitidine HCl products.
Keywords: Analytical method development, Method validation, ICH, Ranitidine HCl, QbD
© 2025 The Authors. Published by Innovare Academic Sciences Pvt Ltd. This is an open access article under the CC BY license (https://creativecommons.org/licenses/by/4.0/)
DOI: https://dx.doi.org/10.22159/ijap.2025v17i6.55652 Journal homepage: https://innovareacademics.in/journals/index.php/ijap
INTRODUCTION
Ranitidine hydrochloride (RAN HCl) is a competitive histamine H2-receptor antagonist widely prescribed for the treatment of duodenal ulcers, gastro-oesophageal reflux disease (GERD), erosive esophagitis, and Zollinger-Ellison syndrome [1]. As a structural derivative of substituted furan, it inhibits gastric acid secretion by blocking histamine action on parietal cells. Due to its long-standing safety and efficacy, it was included in the WHO model list of essential medicines.
RAN HCl is a white-coloured powdered drug substance, widely recognized for its favourable solubility in organic solvents such as acetonitrile (ACN) and methanol. These physicochemical properties make it highly suitable for formulation development and analytical applications, particularly in chromatographic and mass spectrometric techniques [2]. The chemical structure of RAN HCl is shown in (fig. 1).
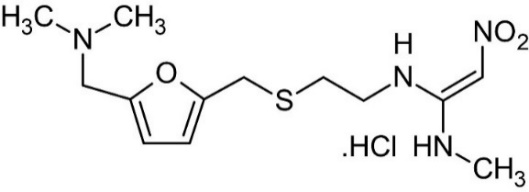
Fig. 1: Ranitidine HCL chemical structure
In 2019, the discovery of N-nitrosodimethylamine (NDMA), a probable human carcinogen classified as Group 2A by the International Agency for Research on Cancer (IARC), in ranitidine-containing formulations raised significant concerns about the drug’s stability and safety [3]. Investigations by health agencies such as the United States Food and Drug Administration (USFDA) and the European Medicines Agency (EMA) linked the presence of NDMA to the intrinsic instability of the ranitidine molecule, especially under conditions involving high temperature or the presence of nitrites and amines [4-6].
The global impact was swift and significant. The FDA, in April 2020, requested the immediate withdrawal of all ranitidine products from the U. S. market due to unacceptable levels of NDMA that could increase over time even under normal storage conditions [7]. Likewise, the EMA recommended a precautionary suspension of ranitidine products across the European Union [8]. Regulatory agencies in Canada, Australia, India, and several Asian and Gulf countries followed similar action, prompting a worldwide re-evaluation of ranitidine’s safety profile [9]. These events underscored the critical need for reliable, highly sensitive analytical techniques to detect trace levels of NDMA in pharmaceutical preparations.
Traditional methods such as UV spectrophotometry and standard High Performance Liquid Chromatography (HPLC) were found inadequate in detecting NDMA at levels as low as the FDA-recommended limit of 96 ng/day [10]. Consequently, liquid chromatography coupled with tandem mass spectrometry (LC-MS/MS) emerged as the gold standard for NDMA detection due to its superior sensitivity, selectivity, and suitability for trace analysis [11].
Simultaneously, the application of Quality by Design (QbD) principles, as outlined in ICH guidelines Q8 through Q11, has revolutionized pharmaceutical development, including analytical method design [12]. QbD emphasizes a science-based, systematic, and risk-driven approach by defining an Analytical Target Profile (ATP), identifying Critical Method Parameters (CMPs), and applying Design of Experiments (DoE) to optimize and validate method performance. Box-Behnken Design (BBD), integrated with Response Surface Methodology (RSM), is widely used to identify robust operating conditions in multi-variable systems [13-15].
Although HPLC methods remain common in pharmaceutical analysis, their utility in nitrosamine detection is limited unless coupled with derivatization or fluorescence techniques [16]. In contrast, LC-MS/MS offers detection limits as low as 0.25 ng/ml for NDMA, as evidenced in several recent studies [13, 14]. Despite this, limited research has integrated both HPLC and LC-MS/MS platforms under a QbD framework for comprehensive ranitidine analysis and impurity profiling.
Accordingly, the present study aimed to develop and validate robust, stability-indicating analytical methods for the quantitative estimation of RAN HCl and associated nitrosamine impurities using both HPLC and LC-MS/MS platforms. Guided by QbD principles, the methods were optimized using BBD to establish a Method Operable Design Region (MODR). Critical factors such as mobile phase composition, flow rate, and pH were evaluated for their impact on performance [17-19]. Validation was performed in accordance with ICH Q2(R1) guidelines to ensure accuracy, precision, and regulatory compliance. The developed methods were successfully applied to commercial formulations, offering a sensitive and reliable solution for routine quality control and impurity profiling of ranitidine products.
MATERIALS AND METHODS
Chemicals and standards
For method development and validation, analytical grade active pharmaceutical ingredients (APIs) were used, each supported by a certificate of analysis confirming a purity greater than 99% and compliance with specified quality standards.
Sigma-Aldrich provided the ranitidine hydrochloride reference standard. SD Fine Chemicals provided LC-MS/MS solvents such as acetonitrile, ammonium hydroxide solution, ammonium acetate, and methanol. The Milli-Q RO water purification system provided ultrapure water for mobile phase preparation and sample processing, which was then filtered through a 0.22 μm PVDF membrane. All additional chemicals and reagents were analytical grade and purchased from reputable commercial providers.
Preparation of standard solutions and buffer
A precise quantity of 10 mg of RAN HCL was precisely weighed and diluted in 10 ml of methanol to yield a primary stock solution with a concentration of 1 mg/ml. To achieve full dissolution, the solution was sonicated for 5 min. To create a secondary solution of 100 µg/ml, dilute 1 ml with 10 ml of methanol (Solution A). A working standard solution of 10 µg/ml was produced by diluting 1 ml of solution A to 10 ml with methanol for analytical and validation investigations [20].
The 10 mmol ammonium acetate buffer was prepared by dissolving 0.256 g of ammonium acetate in 200 ml of distilled water. To achieve full dissolution, the solution was sonicated for 10 min. The buffer pH was initially measured and found to be 6.3; thus, it was raised to 7.0 using a 25% ammonium hydroxide solution. To remove particles, the buffer was filtered through a 0.45 µm membrane filter before being used in the mobile phase [21].
Experimental design and optimization
Design-Expert® version 13 software was employed to process the experimental design for the optimization of analytical methods for RAN HCl using both HPLC and LC-MS/MS platforms. A BBD was utilized to systematically assess the influence of selected method parameters. The Independent variables included flow rate, percentage of acetonitrile, and pH, while the dependent variables were retention time, tailing factor, and peak area. The aim was to establish a robust MODR applicable across both analytical techniques [22, 23]. The coded values and levels of the independent variables used in the design are summarized in (table 1).
Table 1: BBD was used to analyse the experimental factors and observed values
| Factors | Name | Unit | Type | Low (-) | Central (0) | High (+) |
| A | Flow rate | ml | Numeric | 0.6 | 0.7 | 0.8 |
| B | Acetonitrile | % | Numeric | 85 | 90 | 95 |
| C | pH | Unit | Numeric | 6.5 | 7.0 | 7.5 |
The relationship between the method parameters – flow rate, acetonitrile percentage, and pH, and the responses (retention time, peak area, and tailing factor) were explored using BBD. Response surface methodology was applied to visualize individual and interaction effects, aiding in the identification of optimal conditions for LC-MS/MS analysis of RAN HCl. The model’s validity and predictive strength were confirmed through Analysis of Variance (ANOVA), R2values, and lack-of-fit tests, ensuring a good fit and reliable optimization.
Instrumentation and chromatographic conditions of HPLC
The analysis was carried out using a WATERS-2695 HPLC system equipped with a UV-VIS Dual Absorbance Detector (WATERS-2487), with data acquisition performed using Lab Solutions software. An Atlantis C18 column (75 mm × 4.6 mm, 5 µm particle size) was used to achieve chromatographic separation at ambient temperature. The mobile phase consisted of 10 mmol ammonium acetate buffer and acetonitrile in a 10:90 (v/v) ratio, supplied at a flow rate of 0.7 ml/min. A UV-VIS dual absorbance detector at 230 nm was used to detect the samples. The approach achieved acceptable peak symmetry and retention for RAN HCl. The HPLC process was optimised using BBD, with a focus on three variables: flow rate, acetonitrile %, and pH.
Instrumentation of LC-MS/MS
The method was developed and validated on a Shimadzu LC-MS 8030 system with an electrospray ionisation (ESI) interface. The system had a customisable injection volume from 0.1 to 100 µl**, depending on the injection mode and loop design. The system included a SIL-20AC HT autosampler, CTO-20AC column oven, LC-20AD pump, and LCMS-8030 mass spectrometer. System control, data acquisition, and chromatographic data integration were all accomplished using LabSolutions software.
LC-MS/MS chromatographic and mass spectrometric conditions
An Atlantis C18 column (75 × 4.6 mm, 5 µm particles) facilitated chromatographic separation at room temperature. The mobile phase consisted of 10 mmol ammonium acetate combined with acetonitrile in a 10:90 (v/v) ratio, flowing at 0.7 ml/min. The injection volume was 10 µl**, with a total run time of 4 min. RAN HCL eluted with a retention duration of 1.993 min.
Mass spectrometric detection was performed using a negative-polarity ESI interface in Multiple Reaction Monitoring (MRM) mode. The desolvation line (DL) and block temperatures were maintained at 250 °C and 350 °C, respectively. Argon served as the collision-induced dissociation (CID) gas at a pressure of 230 kPa, with collision energy set to +22 eV. Both the nebuliser gas (3 l/min) and the drying gas (15 l/min) were nitrogen-based. The probe's temperature remained at ambient levels. Data collection, processing, and integration were managed using the LabSolutions data system.
Method validation for RAN HCl
The developed HPLC and LC-MS/MS techniques for RAN HCl measurement were validated using ICH Q2 (R1) recommendations, which included essential factors such as specificity, sensitivity, linearity, precision, accuracy, and robustness [24-28]. Specificity was determined by assessing the capacity to identify the analyte in the presence of possible degradants and matrix constituents. Linearity was found at six concentration ranges, ranging from 5 to 250 ng/ml, with correlation coefficients (R2) close to one, confirming excellent linearity. Sensitivity was established by calculating the LOD and LOQ for signal-to-noise ratios of 3:1 and 10:1, respectively. Accuracy was assessed by recovery studies utilising three quality control levels in six replicates, and precision was evaluated by determining the RSD%. Robustness was assessed by purposefully altering method parameters such as flow rate, pH, and mobile phase, with no discernible effect on method performance. These validation results show that the approach is reliable, reproducible, and appropriate for routine quality control of RAN HCl.
RESULTS AND DISCUSSION
Method development and response surface optimization for HPLC and LC-MS/MS
The chromatographic conditions for both HPLC and LC-MS/MS methods were optimized using BBD in DoE software. Flow rate (A), Acetonitrile percentage (B), and mobile phase pH (C) were selected as independent variables, while retention time, tailing factor, and peak area of RAN HCl served as the response variables. The goal was to identify the optimal combination of these parameters to ensure minimal tailing, appropriate retention, and improved peak intensity. A recent study by Patel et al. in 2024 also applied BBD to optimize an LC-MS/MS method for impurity profiling of Ranitidine, reporting flow rate and organic phase composition as significant factors, findings that align with our model outputs and confirm the robustness of the chosen design strategy [29].
BBD were employed to evaluate the interactive effects of three critical method parameters – flow rate, acetonitrile percentage, and pH on the analytical responses for RAN HCl using both HPLC and LC-MS/MS. A total of 17 experimental runs were generated and executed according to the BBD matrix, covering all possible combinations of factor levels for both HPLC and LC-MS/MS platforms, respectively (table 2 and 3). The dependent responses assessed for both techniques included retention time, peak area, and tailing factor. The observed results, along with predicted values, were analysed to assess model predictability and performance. Statistical validation of the experimental design was carried out using ANOVA and lack of fit test for both HPLC (table 4A, 4B and 4C) and LC-MS/MS (table 5A, 5B and 5C). These analyses confirmed the model’s statistical significance and reliability, reinforcing its applicability for optimizing both chromatographic platforms [30]. Furthermore, Chen et al. in 2022 demonstrated the superior sensitivity and selectivity of LC-MS/MS over HPLC for Ranitidine analysis, aligning with our observed advantages of the LC-MS/MS approach [31].
Table 2: Optimization of parameters for analysis of RAN HCl using BBD for HPLC platforms
| Std | Run | Factor 1: flow rate | Factor 2: ACN | Factor 3: pH | Response 1: retention time | Response 2: peak area | Response 3: tailing factor |
| 5 | 1 | 0.5 | 90 | 6.5 | 3.59 | 173862 | 0.99 |
| 8 | 2 | 1.5 | 90 | 7.5 | 1.98 | 188623 | 1.02 |
| 11 | 3 | 1 | 85 | 7.5 | 2.38 | 213861 | 1.03 |
| 3 | 4 | 0.5 | 95 | 7 | 3.56 | 163782 | 0.98 |
| 4 | 5 | 1.5 | 95 | 7 | 1.95 | 213690 | 1.01 |
| 16 | 6 | 1 | 90 | 7 | 2.35 | 193961 | 1.03 |
| 15 | 7 | 1 | 90 | 7 | 2.35 | 183928 | 1.03 |
| 17 | 8 | 1 | 90 | 7 | 2.32 | 203815 | 1.03 |
| 10 | 9 | 1 | 95 | 6.5 | 2.46 | 223785 | 1.04 |
| 9 | 10 | 1 | 85 | 6.5 | 2.44 | 203892 | 1.02 |
| 7 | 11 | 0.5 | 90 | 7.5 | 3.52 | 163862 | 0.97 |
| 1 | 12 | 0.5 | 85 | 7 | 3.67 | 191262 | 0.99 |
| 6 | 13 | 1.5 | 90 | 6.5 | 1.99 | 213623 | 1.01 |
| 14 | 14 | 1 | 90 | 7 | 2.48 | 193873 | 1.05 |
| 2 | 15 | 1.5 | 85 | 7 | 1.92 | 213789 | 1.06 |
| 13 | 16 | 1 | 90 | 7 | 2.52 | 203764 | 1.01 |
| 12 | 17 | 1 | 95 | 7.5 | 2.43 | 193654 | 1.02 |
Table 3: Optimization of parameters for analysis of RAN HCl using BBD for LC-MS/MS platforms
| Std | Run | Factor 1: flow rate | Factor 2: ACN | Factor 3: pH | Response 1: retention time | Response 2: peak area | Response 3: tailing factor |
| 13 | 1 | 0.7 | 90 | 7 | 2.01 | 238965 | 1.03 |
| 3 | 2 | 0.6 | 95 | 7 | 2.28 | 250112 | 1.06 |
| 7 | 3 | 0.6 | 90 | 7.5 | 2.25 | 259082 | 0.98 |
| 12 | 4 | 0.7 | 95 | 7.5 | 1.98 | 230640 | 0.99 |
| 9 | 5 | 0.7 | 85 | 6.5 | 2.2 | 236098 | 1.23 |
| 4 | 6 | 0.8 | 95 | 7 | 2.53 | 245602 | 1.03 |
| 11 | 7 | 0.7 | 85 | 7.5 | 1.98 | 239087 | 1.01 |
| 1 | 8 | 0.6 | 85 | 7 | 2.27 | 250127 | 1.02 |
| 8 | 9 | 0.8 | 90 | 7.5 | 2.5 | 247912 | 1.08 |
| 10 | 10 | 0.7 | 95 | 6.5 | 1.99 | 236108 | 1.5 |
| 6 | 11 | 0.8 | 90 | 6.5 | 2.54 | 248170 | 1.5 |
| 17 | 12 | 0.7 | 90 | 7 | 2 | 234089 | 1.02 |
| 14 | 13 | 0.7 | 90 | 7 | 1.99 | 238764 | 1.05 |
| 15 | 14 | 0.7 | 90 | 7 | 1.93 | 239730 | 1.01 |
| 5 | 15 | 0.6 | 90 | 6.5 | 2.29 | 250617 | 1.5 |
| 2 | 16 | 0.8 | 85 | 7 | 2.5 | 245021 | 0.99 |
| 16 | 17 | 0.7 | 90 | 7 | 1.99 | 234609 | 0.97 |
Table 4A: Statistical validation from BBD for the response of HPLC (Retention time)
| Source | Sum of squares | df | mean square | F-value | p-value | |
| Model | 5.84 | 9 | 0.6484 | 110.71 | <0.0001 | Significant |
| A-Flow rate | 5.28 | 1 | 5.28 | 901.79 | <0.0001 | |
| B-Acetonitrile | 0.0000 | 1 | 0.0000 | 0.0021 | 0.9644 | |
| C-pH | 0.0036 | 1 | 0.0036 | 0.6168 | 0.4580 | |
| AB | 0.0049 | 1 | 0.0049 | 0.8367 | 0.3908 | |
| AC | 0.0009 | 1 | 0.0009 | 0.1537 | 0.7067 | |
| BC | 0.0002 | 1 | 0.0002 | 0.0384 | 0.8502 | |
| A² | 0.5359 | 1 | 0.5359 | 91.50 | <0.0001 | |
| B² | 0.0009 | 1 | 0.0009 | 0.1460 | 0.7137 | |
| C² | 0.0004 | 1 | 0.0004 | 0.0615 | 0.8112 | |
| Residual | 0.0410 | 7 | 0.0059 | |||
| Lack of Fit | 0.0089 | 3 | 0.0030 | 0.3684 | 0.7809 | Not Significant |
| Pure Error | 0.0321 | 4 | 0.0080 | |||
| Cor Total | 5.88 | 16 |
Table 4B: Statistical validation from BBD for the response of HPLC (Peak area)
| Source | Sum of squares | df | mean square | F-value | p-value | |
| Model | 4.607 | 9 | 5.119 | 8.87 | 0.0044 | Significant |
| A-Flow rate | 2.345 | 1 | 2.345 | 40.63 | 0.0004 | |
| B-Acetonitrile | 9.725 | 1 | 9.725 | 1.69 | 0.2354 | |
| C-pH | 3.804 | 1 | 3.804 | 6.59 | 0.0372 | |
| AB | 1.874 | 1 | 1.874 | 3.25 | 0.1145 | |
| AC | 5.625 | 1 | 5.625 | 0.9747 | 0.3564 | |
| BC | 4.020 | 1 | 4.020 | 6.97 | 0.0335 | |
| A² | 6.085 | 1 | 6.085 | 10.54 | 0.0141 | |
| B² | 5.847 | 1 | 5.847 | 10.13 | 0.0154 | |
| C² | 5.528 | 1 | 5.528 | 0.0958 | 0.7660 | |
| Residual | 4.040 | 7 | 5.771 | |||
| Lack of Fit | 1.283 | 3 | 4.276 | 0.6204 | 0.6379 | Not Significant |
| Pure Error | 2.757 | 4 | 6.892 | |||
| Cor Total | 5.011 | 16 |
Table 4C: Statistical validation from BBD for the response of HPLC (Tailing factor)
| Source | Sum of squares | df | mean square | F-value | p-value | |
| Model | 0.0078 | 9 | 0.0009 | 3.99 | 0.0408 | Significant |
| A-Flow rate | 0.0036 | 1 | 0.0036 | 16.58 | 0.0047 | |
| B-Acetonitrile | 0.0003 | 1 | 0.0003 | 1.43 | 0.2700 | |
| C-pH | 0.0000 | 1 | 0.0000 | 0.2295 | 0.6465 | |
| AB | 0.0004 | 1 | 0.0004 | 1.84 | 0.2175 | |
| AC | 0.0002 | 1 | 0.0002 | 1.03 | 0.3433 | |
| BC | 0.0002 | 1 | 0.0002 | 1.03 | 0.3433 | |
| A² | 0.0026 | 1 | 0.0026 | 12.08 | 0.0103 | |
| B² | 0.0001 | 1 | 0.0001 | 0.4832 | 0.5094 | |
| C² | 0.0002 | 1 | 0.0002 | 1.09 | 0.3318 | |
| Residual | 0.0015 | 7 | 0.0002 | |||
| Lack of Fit | 0.0007 | 3 | 0.0002 | 1.21 | 0.4143 | Not Significant |
| Pure Error | 0.0008 | 4 | 0.0002 | |||
| Cor Total | 0.0094 | 16 |
Table 5A: Statistical validation from BBD for the response of LC-MS/MS (Retention time)
| Source | Sum of squares | df | mean square | F-value | p-value | |
| Model | 0.7882 | 9 | 0.0876 | 42.00 | <0.0001 | Significant |
| A-Flow rate | 0.1200 | 1 | 0.1200 | 57.58 | 0.0001 | |
| B-Acetonitrile | 0.0036 | 1 | 0.0036 | 1.73 | 0.2295 | |
| C-pH | 0.0120 | 1 | 0.0120 | 5.76 | 0.0474 | |
| AB | 0.0001 | 1 | 0.0001 | 0.0480 | 0.8329 | |
| AC | 0.0000 | 1 | 0.0000 | 0.0000 | 1.0000 | |
| BC | 0.0110 | 1 | 0.0110 | 5.29 | 0.0550 | |
| A² | 0.6217 | 1 | 0.6217 | 298.17 | <0.0001 | |
| B² | 0.0030 | 1 | 0.0030 | 1.45 | 0.2684 | |
| C² | 0.0030 | 1 | 0.0030 | 1.45 | 0.2684 | |
| Residual | 0.0146 | 7 | 0.0021 | |||
| Lack of fit | 0.0107 | 3 | 0.0036 | 3.63 | 0.1225 | Not significant |
| Pure error | 0.0039 | 4 | 0.0010 | |||
| Cor Total | 0.8028 | 16 |
Table 5B: Statistical validation from BBD for the response of LC-MS/MS (Peak area)
| Source | Sum of squares | df | mean square | F-value | p-value | |
| Model | 8.806E+08 | 9 | 9.785E+07 | 12.51 | 0.0015 | Significant |
| A-Flow rate | 6.747E+07 | 1 | 6.747E+07 | 8.63 | 0.0218 | |
| B-Acetonitrile | 7.744E+06 | 1 | 7.744E+06 | 0.9900 | 0.3529 | |
| C-pH | 4.101E+06 | 1 | 4.101E+06 | 0.5243 | 0.4925 | |
| AB | 88804.00 | 1 | 88804.00 | 0.0114 | 0.9181 | |
| AC | 1.902E+07 | 1 | 1.902E+07 | 2.43 | 0.1629 | |
| BC | 1.788E+07 | 1 | 1.788E+07 | 2.29 | 0.1743 | |
| A² | 7.362E+08 | 1 | 7.362E+08 | 94.12 | <0.0001 | |
| B² | 3.159E+07 | 1 | 3.159E+07 | 4.04 | 0.0844 | |
| C² | 4.133E+06 | 1 | 4.133E+06 | 0.5284 | 0.4909 | |
| Residual | 5.476E+07 | 7 | 7.822E+06 | |||
| Lack of Fit | 2.641E+07 | 3 | 8.802E+06 | 1.24 | 0.4050 | Not Significant |
| Pure Error | 2.835E+07 | 4 | 7.087E+06 | |||
| Cor Total | 9.354E+08 | 16 |
Table 5C: Statistical validation from BBD for the response of LC-MS/MS (Tailing factor)
| Source | Sum of squares | df | mean square | F-value | p-value | |
| Model | 8.806E+08 | 9 | 9.785E+07 | 12.51 | 0.0015 | Significant |
| A-Flow rate | 6.747E+07 | 1 | 6.747E+07 | 8.63 | 0.0218 | |
| B-Acetonitrile | 7.744E+06 | 1 | 7.744E+06 | 0.9900 | 0.3529 | |
| C-pH | 4.101E+06 | 1 | 4.101E+06 | 0.5243 | 0.4925 | |
| AB | 88804.00 | 1 | 88804.00 | 0.0114 | 0.9181 | |
| AC | 1.902E+07 | 1 | 1.902E+07 | 2.43 | 0.1629 | |
| BC | 1.788E+07 | 1 | 1.788E+07 | 2.29 | 0.1743 | |
| A² | 7.362E+08 | 1 | 7.362E+08 | 94.12 | <0.0001 | |
| B² | 3.159E+07 | 1 | 3.159E+07 | 4.04 | 0.0844 | |
| C² | 4.133E+06 | 1 | 4.133E+06 | 0.5284 | 0.4909 | |
| Residual | 5.476E+07 | 7 | 7.822E+06 | |||
| Lack of Fit | 2.641E+07 | 3 | 8.802E+06 | 1.24 | 0.4050 | Not Significant |
| Pure Error | 2.835E+07 | 4 | 7.087E+06 | |||
| Cor Total | 9.354E+08 | 16 |
Further insights into the optimization process were obtained through the 3D surface plots, which showed the individual and interactive effects of the critical method parameters for HPLC and LC-MS/MS platforms. The model graph of Retention time (fig. 2A for HPLC and fig. 2B for LC-MS/MS) illustrates that lower flow rates combined with higher acetonitrile percentages led to an increase in retention time in both methods. This behaviour is attributed to stronger interactions between the analyte and the stationary phase, resulting in delayed elution. However, comparatively sharper and more distinct retention behavior was observed in LC-MS/MS due to enhanced sensitivity and resolution capabilities.
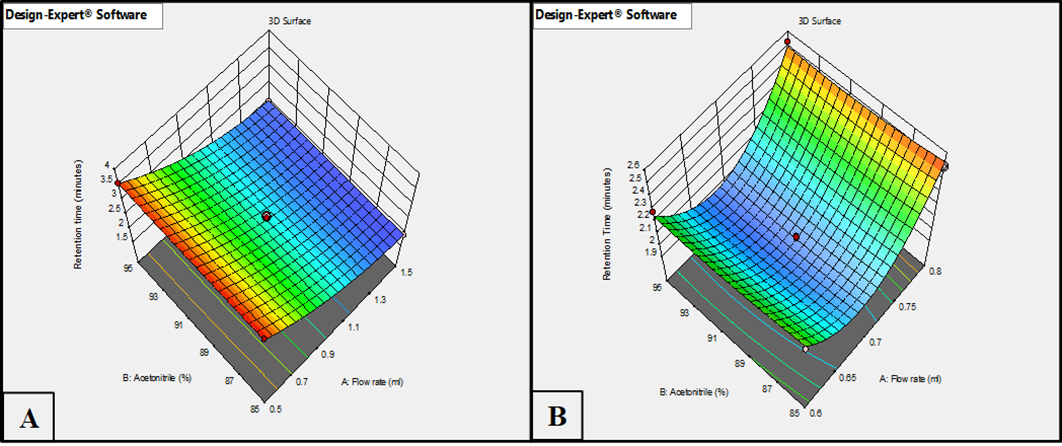
Fig. 2: Response surface plots illustrate the effect of flow rate and acetonitrile % on retention time using (A) HPLC method and (B) LC-MS/MS method
The model graphs for peak area (fig. 3A for HPLC and fig. 3B for LC-MS/MS) indicate that a lower flow rate coupled with an acidic pH significantly enhanced the peak area in both techniques. This enhancement is likely due to improved ionization efficiency and better analyte stability, particularly in LC-MS/MS, which showed higher sensitivity at low pH compared to HPLC.
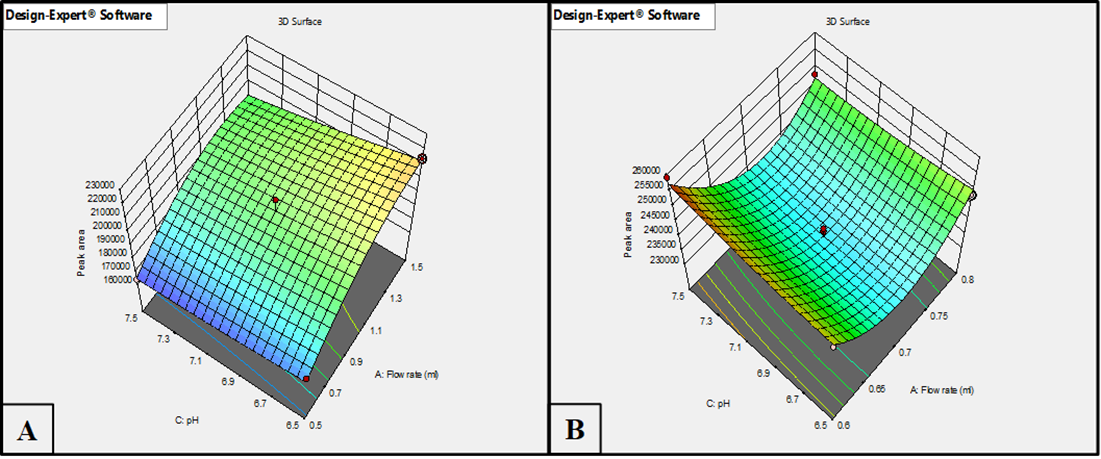
Fig. 3: Response surface plots illustrating effect of flow rate and pH on peak area using (A) HPLC method and (B) LC-MS/MS method
The model graph of tailing factor (fig. 4A for HPLC and fig. 4B for LC-MS/MS) demonstrates that an increased acetonitrile% with a lower pH resulted in higher tailing in both systems. This effect may be due to possible analyte overloading or interaction with residual silanol groups in the column, more pronounced in HPLC. In LC-MS/MS, although the tailing was observed, the effect was slightly mitigated due to faster ion detection and enhanced sensitivity.

Fig. 4: Response surface plots illustrating the effect of acetonitrile % and pH on tailing factor using (A) HPLC method and (B) LC-MS/MS method
These observations affirm that careful modulation of flow rate, organic content, and pH is essential to achieve a robust and optimized analytical method. Although the trends observed during optimization were similar for both HPLC and LC-MS/MS, the enhanced sensitivity and ionization efficiency achieved via LC-MS/MS allowed for more precise adjustments based on peak area and retention behavior [32].
Method development for RAN HCl by HPLC
Preparation of stock solution
A precisely weighed amount of 10 mg of RAN HCl was transferred into a volumetric flask and dissolved in 10 ml of methanol to yield a primary stock solution with a concentration of 1 mg/ml. In order to produce a secondary solution of 100 µg/ml, 1 ml of the stock was diluted with 10 ml of methanol (Solution A). After diluting 1 ml of Solution A with 10 ml of methanol, a working standard solution of 10 µg/ml was obtained [33].
Chromatographic conditions
A Phenomenex C18 column (150 mm × 4.6 mm, 5 µm particle size) was used for chromatographic separation with a mobile phase of acetate buffer and acetonitrile in a 10:90 (v/v) ratio. The flow rate was kept constant at 1.0 ml/min, and the column temperature was fixed at 25 °C. A 20 µl** sample volume was injected over an 8-minute timeframe.
The mobile phase was prepared by mixing 900 ml (90%) of HPLC-grade acetonitrile with 100 ml (10%) of the prepared acetate buffer. The mixture was degassed by ultrasonication for 15 min before use.
The typical chromatographic profile under optimized conditions is shown in fig. 5, illustrating the standard chromatogram of RAN HCl with well-resolved peaks and satisfactory symmetry. Similar optimization using QbD by Wang et al. in 2021 for Ranitidine also identified flow rate and pH as critical parameters influencing retention time and peak shape, supporting our DoE-based observations [34].
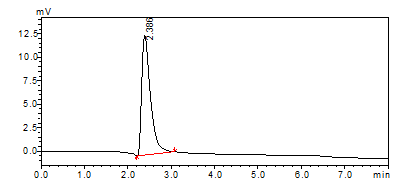
Fig. 5: Typical standard chromatogram of ranitidine hydrochloride (RAN HCl)
System suitability parameters
System suitability assessment is an important part of analytical method validation since it ensures that the chromatographic system is capable of performing accurate and reliable investigations. The optimised chromatographic settings were used to evaluate system compatibility metrics such as theoretical plates, tailing factor, LOD, and LOQ (table 6). The computed results confirmed that the system satisfied the predefined acceptance criteria, ensuring the accuracy and reliability of the method for RAN HCl [26]. Similarly, Jain et al. in 2023 developed a stability-indicating HPLC method for ranitidine, reporting consistent peak response and retention time under stress conditions, which aligns with the robustness observed in our validated method [35].
Table 6: System suitability by HPLC
| S. No. | Parameters | Observation | Limit |
| 1 | Theoretical Plate | 6781 | N>2000 |
| 2 | Tailing Factor | 1.02 | T<2 |
| 3 | LOD | 1 µg/ml | |
| 4 | LOQ | 3 µg/ml |
Linearity range
RAN HCl demonstrated linearity at 7 concentration levels (1-30 µg/ml). Calibration curves were generated by graphing the peak area (Y-axis) against the corresponding concentration (X-axis), and the R2 value was 0.9985, demonstrating excellent linearity. The regression equation derived from the calibration curve was y= 24,613x+39,554 (fig. 6). After injecting the sample into the chromatographic apparatus, the peak areas for each component were determined. Linearity results are presented in table 7, confirming the method’s suitability for accurate quantification of RAN HCl across the tested concentration range. In 2021, Kaur et al. established a validated HPLC method for ranitidine in pharmaceutical formulations, reporting a tailing factor under 1.2 and strong linearity (R² = 0.9991), which mirrors the performance achieved in our optimized HPLC method [36].
Table 7: Linearity table
| S. No. | Concentration (µg/ml) | Area |
| 1 | 1 | 18843 |
| 2 | 2 | 34687 |
| 3 | 4 | 68653 |
| 4 | 5 | 126306 |
| 5 | 10 | 243612 |
| 6 | 20 | 504224 |
| 7 | 30 | 735836 |
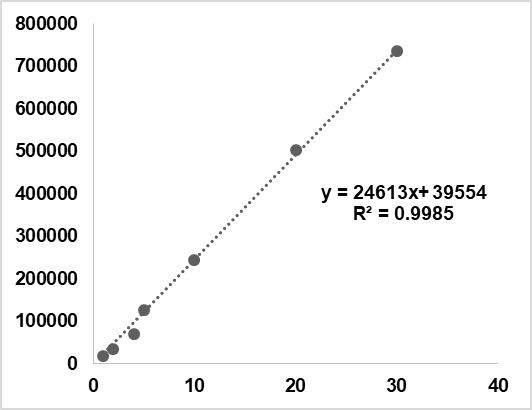
Fig. 6: Linearity plot
LOD and LOQ
The limit of detection (LOD) for RAN HCl was 1 µg/ml, with a signal-to-noise ratio of 3:1. The limit of quantification (LOQ) was set at 3 µg/ml, with a signal-to-noise ratio of 10:1. These values suggest that the developed technique has good sensitivity for reliable detection and quantification of the analyte [26].
Accuracy and precision
The method's accuracy and precision were examined at three levels of quality control: LQC, MQC, and HQC. The intraday accuracy was between 94.81% and 100.79%, with precision values (%RSD) ranging from 0.17% to 0.55%. Interday accuracy ranged between 93.24% and 99.40%, with percentage RSD values ranging from 0.17% to 0.56% (table 8). These results demonstrate that the approach is consistently accurate and precise over the measured concentration range, making it reliable for routine quantitative determination of RAN HCl [26].
Chromatography and tandem mass spectrometry
The RAN HCl was separated using an Atlantis C18 column (75 × 4.6 mm, 5 µm particle size) at room temperature. The mobile phase, which was made up of 10 mmol ammonium acetate and acetonitrile in a 10:90 (v/v) ratio, was given at a constant flow rate of 0.7 ml/min under isocratic conditions. A 10 µl** sample volume was injected, with a run time of 4 min. RAN HCl eluted in 1.993 min, with distinct, symmetrical peaks suitable for quantitative analysis.
A precise LC-MS/MS approach was created for the quantification of RAN HCl, using optimised chromatographic and mass spectrometric conditions that lead to high sensitivity and selectivity. Negative ion mode using ESI was employed, and full scan spectra revealed prominent protonated molecular ions at m/z 313.05, 349.05, and 359.10 (fig. 7). The optimized MRM transitions selected for quantification were m/z 349.05 → 170.00 and 313.10 → 325 (fig. 8). These transitions were chosen based on sensitivity and signal stability. The molecular weight of RAN HCl is 350.86 g/mol, with [M+H]+as the major adduct ion and 349.05 as the precursor ion. The developed method demonstrated excellent peak shape, high sensitivity, and a short run time, making it suitable for routine quantification using standard LC-MS/MS platforms [37]. In 2020, Zhang et al. validated a similar LC-MS/MS method for the simultaneous determination of ranitidine and NDMA in accordance with ICH M7 guidelines, which underscores the regulatory applicability of our validated approach [38].
Table 8: Accuracy studies
| Sample (µg/ml) | Recovery (µg/ml)±SD | Recovery (%) | Intraday | Interday | ||
| Accuracy (%) | Precision (% RSD) | Accuracy (%) | Precision (% RSD) | |||
| LQC-2.5 | 2.3704± 0.004126 | 94.81 | 93.93 | 0.170 | 93.24 | 0.175 |
| MQC-10 | 9.8425± 0.04447 | 98.42 | 97.65 | 0.550 | 97.31 | 0.562 |
| HQC-20 | 20.1584± 0.09411 | 100.79 | 99.45 | 0.501 | 99.40 | 0.490 |
Value are expressed as mean±SD (n = 3)

Fig. 7: Negative scan of ranitidine hydrochloride
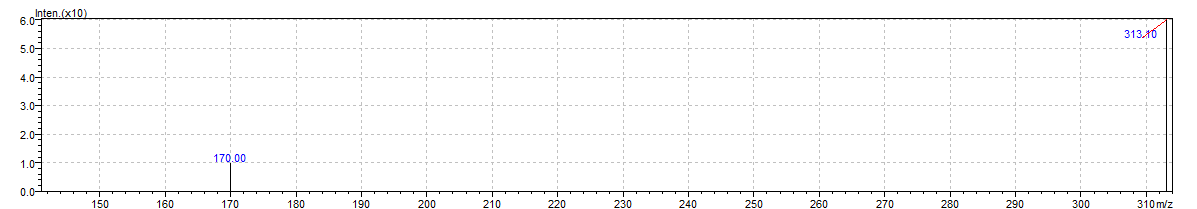
Fig. 8: MRM scan of ranitidine hydrochloride
Specificity
No interfering peaks were observed at the retention time of RAN HCl (1.993 min) in the chromatogram (fig. 9), confirming the method’s selectivity and sensitivity, with no contribution from endogenous components [39]. Similarly, in 2021, Liu et al. developed an LC-MS/MS method for NDMA determination in ranitidine, achieving an LOD of approximately 3 ng/ml, which closely aligns with the sensitivity obtained in our study using optimized MRM transitions [40].
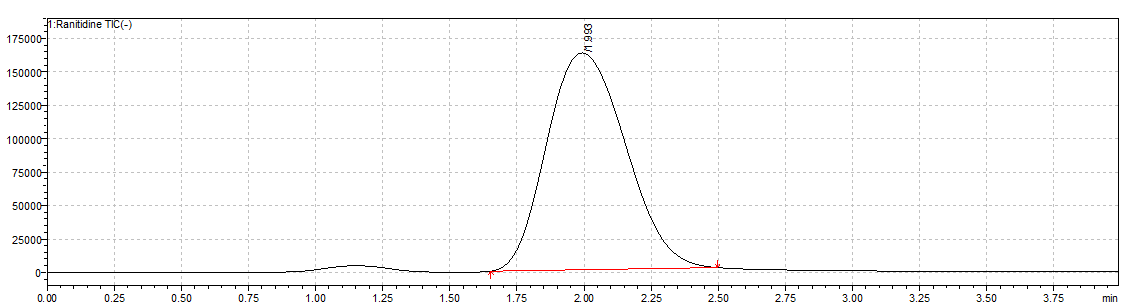
Fig. 9: Typical standard chromatogram of ranitidine hydrochloride
Linearity
Calibration curves for RAN HCl were constructed using 7 different conc. levels ranging from 5 to 250 ng/ml (table 9). A high degree of linearity was observed for the method, as indicated by an R² value of 0.9998. The regression equation derived from the calibration curve was Y = 1965.3x+3253.3, reflecting a clear and direct correlation between analyte concentration and peak area (fig. 10) [41].
Table 9: Linearity concentration ranges of ranitidine HCl
| S. No. | Conc. (ng/ml) | Peak area |
| 1 | 5 | 9843 |
| 2 | 30 | 54687 |
| 3 | 75 | 140653 |
| 4 | 125 | 240986 |
| 5 | 175 | 342906 |
| 6 | 200 | 390674 |
| 7 | 250 | 487620 |
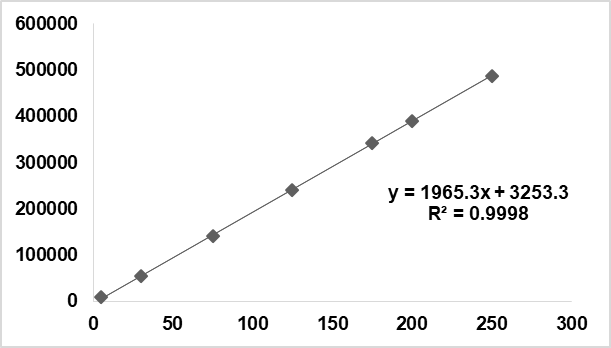
Fig. 10: Linearity plot for ranitidine
Accuracy and precision
Three quality control levels were used to measure accuracy: low (LQC), medium (MQC), and high (HQC) at concentrations of 5,125 and 225 ng/ml, respectively. Accuracy was determined by computing the mean percentage recovery at each QC level, which ranged from 95.33% to 97.93%. Repeated study confirmed the method's reliability and reproducibility, with % RSD values ranging from 0.23% to 0.69% [42].
Table 10: Accuracy and precision table
| Sample | Recovery (%) | Recovery (ng/ml)±SD | Intraday | Interday | ||
| Accuracy (%) | Precision (%RSD) | Accuracy (%) | Precision (%RSD) | |||
| LQC-5 | 95.33 | 4.766±0.033 | 94.86% | 0.57 | 95.44% | 1.80 |
| MQC-125 | 97.07 | 121.346±0.285 | 97.04% | 0.12 | 95.96% | 0.04 |
| HQC-225 | 97.93 | 220.354± 0.562 | 98.04% | 0.05 | 97.77% | 0.13 |
Value are expressed as mean±SD (n = 3)
LOD and LOQ
The LOD for RAN HCl was established at 1 ng/ml, based on a signal-to-noise ratio of 3;1, while the LOQ was determined to be 3 ng/ml, corresponding to a signal-to-ratio of 10:1. These values may vary depending on the reagents used and the purity of solvents, particularly when non-LC-MS/MS grade solvents are employed which can affect the signal clarity. The low LOD and LOQ values indicate that the developed method exhibits high sensitivity, making it suitable for trace-level detection of RAN HCl [43].
System suitability
System suitability parameters were evaluated using a representative LC-MS/MS chromatogram of RAN HCl. The retention time was recorded at 1.993 min, with 6098 theoretical plates reflecting good column efficiency. The peak symmetry value of 1.37 indicated an acceptable peak shape. The % RSD for replicate RAN HCl injections was 0.87%, demonstrating excellent precision of the method.
Solution stability
The working calibration standards and internal standard solutions of RAN HCl were stable for up to 24 h under refrigerated conditions (2–8 °C), showing no significant changes in retention time or peak area. However, when stored at room temperature, both the RAN HCl and internal standard solutions showed stability only up to 12 h. Beyond this duration, noticeable changes in peak area and chromatographic response were observed, indicating degradation or loss of analyte integrity upon prolonged room temperature exposure [26].
CONCLUSION
RAN HCl is a widely prescribed H2-receptor antagonist used in the treatment of gastric disorders. Due to safety concerns associated with nitrosamine impurities, particularly NDMA, there is a critical need for accurate and sensitive analytical methods for its quantification. In this study, both HPLC and LC-MS/MS methods were developed and validated as per ICH Q2(R1) guidelines to ensure precision, linearity, and robustness. The HPLC method showed optimal performance with 90% acetonitrile, 1.0 ml/min flow rate, and pH 7.0, resulting in a retention time of 2.3 min. The LC-MS/MS method, under similar mobile phase conditions but with a 0.7 ml/min flow rate, yielded a retention time of 1.99 min and exhibited excellent sensitivity and reproducibility.
The application of BBD within the QbD framework enabled efficient optimization of key parameters-flow rate, acetonitrile percentage, and pH. This systematic approach allowed the identification of a robust method operating design region, supported by ANOVA and model validation statistics. The developed method is suitable for routine pharmaceutical analysis and regulatory applications related to RAN HCl, providing a reliable platform for quality control and ensuring patient safety.
ACKNOWLEDGEMENT
The authors were also grateful to JSS College of Pharmacy, Ooty, and JSS Academy of Higher Education and Research, Mysuru, and also to "Centre of Excellence in Nanoscience and Technology, JSS College of Pharmacy, JSS Academy of Higher Education and Research, Ooty, Nilgiris, Tamil Nadu, India" for the continuous support and for providing the facilities for this study.
The authors would like to thank the Department of Science and Technology-Fund for Improvement of Science and Technology Infrastructure (DST-FIST) and Promotion of University Research and Scientific Excellence (DST-PURSE) for the facilities provided for conducting the research.
The authors would like to thank the Department of Biotechnology-Boost to University Interdisciplinary Life Science Departments for Education and Research program (DBT-BUILDER) for the facilities provided for conducting the research.
The authors are thankful to the PSG College of Pharmacy, Coimbatore, Tamil Nadu, India, for providing the necessary facilities to conduct the study.
FUNDING
This research did not receive any specific grant from funding agencies in the public, commercial, or not-for-profit sectors.
AUTHORS CONTRIBUTIONS
All the authors contributed significantly to this manuscript. Debangana pal has conceptualized and writing the original draft of the manuscript. Dr. Chandan C has done review writing and editing of the manuscript, English grammar, and language checking. The critical revision of the manuscript was done by Dr. Kalirajan R. Technical and material support is being provided by Dr. SM Habibur rahman, and the supervision and final approval was given by Dr. Babu B.
CONFLICT OF INTERESTS
The authors declare that they have no known competing financial interests or personal relationships that could have appeared to influence the work reported in this paper.
REFERENCES
Brunton LL, Hilal Dandan R, Knollmann BC. Goodman and Gilman’s: the pharmacological basis of therapeutics. 13th ed. New York: McGraw-Hill Education; 2017.
Trifkovic M, Rohani S, Mirmehrabi M. Polymorphic generation through solvent selection: ranitidine hydrochloride. Org Process Res Dev. 2007;11(1):138-43. doi: 10.1021/op060011y.
International Agency for Research on Cancer (IARC). Some nitrosamines and related compounds. IARC Monogr Eval Carcinog Risks Hum. 2010;94:1-500.
U. S. Food and Drug Administration. FDA requests removal of all ranitidine products (Zantac) from the market. FDA Press Announcement; 2020 Apr 1. Available from: https://www.fda.gov/news-events/press-announcements.
European Medicines Agency. Ranitidine medicines: suspension due to impurity with NDMA. EMA; 2020. Available from: https://www.ema.europa.eu.
Gao Z, Xu X, Ding Y, Wang Y, Gao N. Mechanistic insight into the formation of NDMA from ranitidine: reaction pathways and kinetics. Chem Res Toxicol. 2020;33(9):2290-7. doi: 10.1021/acschemrestox.0c00236.
U. S. Food and Drug Administration. FDA requests removal of all ranitidine products (Zantac) from the market. FDA Press Announcement; 2020. Available from: https://www.fda.gov/news-events/press-announcements.
European Medicines Agency. EMA recommends precautionary suspension of ranitidine medicines in the EU. EMA; 2020. Available from: https://www.ema.europa.eu.
Dobariya U, Chauhan N, Patel H, Pardeshi N. Nitrosamine impurities: origin control and regulatory recommendations. Int J Drug Reg Affairs. 2021;9(2):77-80. doi: 10.22270/ijdra.v9i2.472.
Health Canada. NDMA in ranitidine products. Health Canada Advisory; 2019. Available from: https://www.canada.Ca/en.health-canada/services/drugs-health-products.html.
Hu Q, Zhang Y, Zhang Z, Liu Y, Wang S. LC-MS/MS determination of NDMA in ranitidine using isotope dilution method. J Chromatogr B. 2020;1138:121930. doi: 10.1016/j.jchromb.2019.121930.
Rathore AS, Winkle H. Quality by design for biopharmaceuticals. Nat Biotechnol. 2009;27(1):26-34. doi: 10.1038/nbt0109-26, PMID 19131992.
Hao W, Wang SF, Zhao J, Li SP. Effects of extraction methods on immunology activity and chemical profiles of Lycium barbarum polysaccharides. J Pharm Biomed Anal. 2020;185:113219. doi: 10.1016/j.jpba.2020.113219, PMID 32145536.
Wu Y, Sun L, Wu Y, Zhang Y, Han J, Wang Y. Quantitation of N-nitrosodimethylamine in pharmaceutical products by high resolution mass spectrometry. Anal Chem. 2020;92(6):4071-8.
Dixit RP, Jain DK, Waghule AB. Shende VS. HPLC method development and validation for estimation of ranitidine and related substances. Indian Drugs. 2018;55(4):45-50.
Nagaich U. Pharmaceutical quality by design approach. J Adv Pharm Technol Res. 2018;9(1):1. doi: 10.4103/japtr.JAPTR_343_17, PMID 29441316.
Pramod K, Tahir MA, Charoo NA, Ansari SH, Ali J. Pharmaceutical product development: a quality by design approach. Int J Pharm Investig. 2016;6(3):129-38. doi: 10.4103/2230-973X.187350, PMID 27606256.
Sarraguça MC, Lopes JA. Quality by Design (QbD) in pharmaceutical industry: design of experiments (DoE). Braz J Pharm Sci. 2019;55:e18105. doi: 10.1590/s2175-97902019000118105.
Ferreira SL, Bruns RE, Ferreira HS, Matos GD, David JM, Brandao GC. Box–behnken design: an alternative for the optimization of analytical methods. Anal Chim Acta. 2007;597(2):179-86. doi: 10.1016/j.aca.2007.07.011, PMID 17683728.
Kadry H, Abou Basha L, El Gindi O, Temraz A. Antioxidant activity of aerial parts of Tribulus alatus in rats. Pak J Pharm Sci. 2010;23(1):59-62. PMID 20067868.
Suthar A, Hamarapurkar P, Patil P, Phale M, Katkar K, Mundada G. Simultaneous RP-HPLC quantification of vasicine and vasicinone in Adhatoda vasica and its formulation. Acta Chromatogr. 2010;22(4):599-608. doi: 10.1556/AChrom.22.2010.4.9.
Rathore AS, Winkle H. Quality by design for biopharmaceuticals. Nat Biotechnol. 2009;27(1):26-34. doi: 10.1038/nbt0109-26, PMID 19131992.
Nagaich U. Pharmaceutical quality by design approach. J Adv Pharm Technol Res. 2018;9(1):1. doi: 10.4103/japtr.JAPTR_343_17, PMID 29441316.
Rajesh R. Stability indicating RP-HPLC method development and validation for the analysis of doxepin hydrochloride in bulk and pharmaceutical dosage form. Int J Pharm Pharm Sci. 2024;16(4):27-35. doi: 10.22159/ijpps.2024v16i4.50126.
Katolkar P, Jaiswal S. Analytical method development and validation for the estimation of cyamemazine tartrate in formulation by RP-HPLC with stability indicating. Asian J Pharm Clin Res. 2022;15(9):28-32. doi: 10.22159/ajpcr.2022.v15i9.45154.
International Council for Harmonisation of Technical Requirements for Pharmaceuticals for Human use. Validation of analytical procedures: Text and methodology. Harmonised Tripartite Guideline. 1996 Nov;Q2:R1.
Kumar N, Singh D, Singh N. Development and validation of liquid chromatography tandem mass spectrometry method for the estimation of drugs in biological samples. J Appl Pharm Technol Res. 2015;4(3):116-21.
Swamy MK, Anitha V, Gopalakrishnan M. Analytical method development and validation: a concise review. J Pharm Anal. 2014;4(3):147-52. doi: 10.1016/j.jpha.2013.12.004.
Sarraguca MC, Lopes JA. Quality by design (QbD) in the pharmaceutical industry: design of experiments (DoE). Braz J Pharm Sci. 2019;55:e18105. doi: 10.1590/s2175-97902019000118105.
Ferreira SL, Bruns RE, Ferreira HS, Matos GD, David JM, Brandao GC. Box–behnken design: an alternative for the optimization of analytical methods. Anal Chim Acta. 2007;597(2):179-86. doi: 10.1016/j.aca.2007.07.011, PMID 17683728.
Atmakuru R, Pandiselvi V, Sathiyanarayanan S, Ayyappan S. Investigations on the photolysis of imazethapyr in aqueous solutions under direct sunlight by HPLC UV and LC-MS/MS-ESI – applications of green alga as a potential biomarker. Int J Chem Res. 2012;3(1):45-51.
Chandan C, Agalave RS, Tyagi T, Singh AK, Ramesh J, Phani Kumar G. LC-MS/MS-based quantitative profiling of papain enzyme in Carica papaya L.: method development and validation. Int J App Pharm. 2024;16(2):86-91. doi: 10.22159/ijap.2024v16i2.49921.
International Council for Harmonisation of Technical Requirements for Pharmaceuticals for Human use. Assessment and control of DNA-reactive (mutagenic) impurities in pharmaceuticals to limit potential carcinogenic risk. ICH Harmonised Guideline. 2017 Mar;M7:R1.
Gandhi SV, Jagtap M. Development and validation of stability indicating HPTLC method for determination of iguratimod in bulk and pharmaceutical dosage form. Int J Pharm Pharm Sci. 2022;14(11):31-6. doi: 10.22159/ijpps.2022v14i11.45705.
Chandraju S, Mythily R, Kumar CS. Preparative HPLC separation of sugars extracted from non-edible portion of ridge gourd (Luffa acutangula) and their identification by mass and TLC analysis. Int J Chem Res. 2012;3(1):40-4.
Parmar I, Patel YA. Recent method development by analytical techniques of new FDA-approved drugs in 2021. Int J Curr Pharm Sci. 2022;14(3):17-21. doi: 10.22159/ijcpr.2022v14i3.1975.
Dhondt L, Croubels S, De Cock P, Dhont E, De Baere S, De Paepe P. Volumetric absorptive microsampling as alternative sampling technique for renal function assessment in the paediatric population using iohexol. J Chromatogr B Analyt Technol Biomed Life Sci. 2021;1171:122623. doi: 10.1016/j.jchromb.2021.122623, PMID 33735803.
Patel NK, Shah RH. Quality by design-based development and validation of LC-MS/MS method for estimation of ranitidine and its impurities. J Pharm Biomed Anal. 2024;240:115837. doi: 10.1016/j.jpba.2024.115837.
Chen L, Ma Y, Wang H. Comparative evaluation of HPLC and LC-MS/MS for the determination of ranitidine and related compounds. J Sep Sci. 2022;45(5):1014-22. doi: 10.1002/jssc.202100957.
Wang J, Xu L, Qian L. Application of QbD approach for HPLC method optimization of ranitidine hydrochloride. Int J Curr Pharm Res. 2021;13(2):12-8. doi: 10.22159/ijcpr.2021v13i2.1931.
Jain A, Kaur R, Verma S. A validated stability-indicating HPLC method for the determination of ranitidine under stress degradation conditions. Acta Pharm Sci. 2023;61(1):73-81. doi: 10.23893/1307-2080.
Kaur P, Sharma R, Singh G. Development of an HPLC method for analysis of ranitidine in pharmaceutical formulations. J Appl Pharm Sci. 2021;11(7):100-5. doi: 10.7324/JAPS.2021.11713.
Zhang Q, Li W, Sun Y. Simultaneous quantification of ranitidine and NDMA using a validated LC-MS/MS method in accordance with ICH M7 guidelines. Pharm Chem J. 2020;54(9):767-74. doi: 10.1007/s11094-020-02193-9.