
Int J App Pharm, Vol 17, Issue 6, 2025, 162-173Original Article
DEVELOPMENT AND OPTIMIZATION OF MESOPOROUS SILICA NANOPARTICLE LOADED HYDROGEL OF ALLICIN FOR WOUND HEALING
GAURAVI SUNILRAO KHERDE*, RAHUL DNYANESHWAR KHAIRE, VIKAS DAMU KUNDE
Department of Pharmaceutics, PRES’s College of Pharmacy (For Women), Chincholi, Sinnar, Nashik-422102, India
*Corresponding author: Gauravi Sunilrao Kherde; *Email: gauravi.26001@gmail.com
Received: 20 Jun 2025, Revised and Accepted: 07 Oct 2025
ABSTRACT
Objective: The objective of this study was to develop and optimize a mesoporous silica nanoparticle (MSN)-loaded hydrogel formulation of allicin to enhance its stability, sustained release, and skin permeation for effective wound healing.
Methods: Allicin was characterized through organoleptic, UV, solubility, FTIR, and DSC studies. MCM-41 MSNs were selected as carriers due to superior encapsulation efficiency and solubility enhancement. MSN-loaded hydrogels were formulated using a factorial design and evaluated for physicochemical properties, in vitro release, ex vivo permeation using Franz diffusion cells, and statistical optimization via ANOVA. Drug release kinetics were modeled using Zero-order, First-order, Higuchi, and Korsmeyer–Peppas equations. Accelerated stability studies were performed under ICH conditions for six months.
Results: Hydrogel formulations were stable, skin-compatible, and demonstrated uniform drug content (97.68–98.92%). In vitro release showed biphasic profiles with optimized formulations GF7 (94.26±4.18%) and GF5 (93.85±4.06%) achieving maximum release at 12 h. Ex vivo permeation confirmed superior performance of GF7 (95.42±3.65%) and GF5 (94.74±3.45%) with high flux (34.56 and 33.96 µg/cm²/h) and permeability coefficients (1.73×10⁻³ and 1.70×10⁻³ cm/h). ANOVA demonstrated significant influence of Carbopol and propylene glycol, and validation of optimized batch GF5 confirmed high model reliability (desirability 0.980). Release followed first-order kinetics (R² = 0.9789) with anomalous diffusion. Stability studies showed minimal changes in pH, viscosity, spreadability, drug content, and permeation over six months.
Conclusion: The MSN-based hydrogel system successfully enhanced allicin’s solubility, stability, sustained release, and skin permeation, offering a promising strategy for topical delivery of unstable phytoconstituents.
Keywords: Allicin, Mesoporous silica nanoparticles, MCM-41, Hydrogel, Wound healing, Factorial design, Ex-vivo permeation, Drug delivery optimization
© 2025 The Authors. Published by Innovare Academic Sciences Pvt Ltd. This is an open access article under the CC BY license (https://creativecommons.org/licenses/by/4.0/)
DOI: https://dx.doi.org/10.22159/ijap.2025v17i6.55675 Journal homepage: https://innovareacademics.in/journals/index.php/ijap
INTRODUCTION
Worldwide healthcare faces a substantial challenge from chronic wounds since they affect 40 million patients globally at an annual developed nation case incidence ranging from 4 to 5 million patients [1]. Healthcare costs for chronic wounds in the United States reach above $25 billion every year and similar expense percentages exist across Europe and Asia. The standard techniques for wound management demonstrate limited effectiveness in managing complex chronic wounds that appear in diabetic patients because their healing rates stay under 50% during the first six months of conventional treatment [2]. The increase of diabetes, obesity and vascular diseases has resulted in a 12% growth of chronic wounds throughout the past decade. Anti-microbial resistance creates difficulties in treating chronic wounds by inducing bacteria that tolerate multiple antibiotics in 60% of these cases [3]. Present strategies in wound management require improvement because they fail to penetrate tissues well and lead to rapid degradation of active compounds and incomplete sustained release systems and insufficient bioavailability. New advanced therapeutic strategies must be developed because they need to overcome these multiple challenges [4].
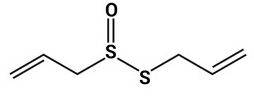
Fig. 1: Structure of allicin
The primary bioactive compound in garlic (Allium sativum) known as allicin functions as a potential healing solution in wound care because of its extensive pharmacological features [5]. Allicin possesses a unique thiosulfinate functional group that gives it chemical properties as an organosulfur compound when written as C₆H₁₀OS₂ [6]. The bioactive compound allicin shows strong antimicrobial action against numerous microbial infections, including both methicillin-resistant Staphylococcus aureus and Pseudomonas aeruginosa, which frequently infect wounds. Alllicin performs antibacterial actions mainly through S-thiolation-based inhibition of thiol-containing enzymes [7]. The compound allicin shows important anti-inflammatory effects because it blocks inflammatory cytokines from activation and controls NF-κB signaling pathways. The promotion of fibroblast migration along with angiogenesis represents essential healing processes that allicin facilitates in wound repair [8]. Multiple preclinical studies have shown that the compound accelerates wound healing, with a healing time cut in half up to 40 percent. The therapeutic potential of allicin is limited by its natural chemical instability, that leads to rapid degradation under biological conditions and low absorption rates at target wound locations [9].
MSN-loaded hydrogels work as innovative delivery systems to overcome current challenges in standard wound dressing formats. The combination of uniform pores between 2 to 50 nm and large surface areas of more than 700 m²/g makes MSNs a suitable delivery platform for allicin through their adaptable surface chemistry properties [10]. Nanoparticle technology controls allicin release rates and shields this substance from breakdown without altering its fundamental activity. The hydrogel-MSN hybrid system obtained its benefits from both materials by providing the moist microenvironment and oxygen permeability and tissue conformity from the hydrogel and sustained allicin delivery and targeted release from the MSNs [11]. The combined system achieves deeper tissue penetration than typical formulations because research has proven its ability to deliver three times more bioactive compounds to advanced tissues layers. Modern developments in MSN synthesis techniques increase material biocompatibility and biodegradability, which resolves issues linked to silica buildup. The hydrogel component enables adjustable viscoelastic properties that enhance optimization for different wound types and locations, thus enabling application across multiple healing situations [12].
Several nano-delivery systems have been investigated on allicin stabilization, of which are liposomes and solid lipid nanoparticle (SLNs); however, they have a few limitations in terms of storage stability and burst release patterns. Other MSN-hydrogel wound combinations have more generally placed emphasis on antimicrobials, such as silver nanoparticles or even growth factors, but must do so without the chemical particularities that apply to the use of allicin. This current MCM-41/Carbopol/propylene glycol system offers unique solutions because the pore size of MCM-41 offers better allicin accommodation, the pH-responsive swelling ability of Carbopol offers controlled release, and the permeation-enhancing and co-solvent capacity of propylene glycol allows it to overcome the issues with allicin in that its labile thiosulfinate is not supported in conventional formulations.
MATERIALS AND METHODS
Materials
Allicin was procured from Sciquaint Innovations (OPC) Pvt. Ltd. (Pune, India). Mesoporous silica templates MCM-41, SBA-15, and KIT-6 (analytical grade) were purchased from Sigma Advanced Scientific Equipment Pvt. Ltd. (Mumbai, India). Carbopol 940 (analytical grade, viscosity 40,000–60,000 cP), propylene glycol (USP grade, ≥99.5%), methylparaben (analytical grade, ≥99%), triethanolamine (analytical grade, ≥99%), and potassium bromide (FTIR grade, 99%) were obtained from Merck Life Science Pvt. Ltd. (Mumbai, India). Ethanol (HPLC grade, ≥99.9%) was sourced from Rankem (Mumbai, India), and phosphate buffer salts (analytical grade) from HiMedia Laboratories Pvt. Ltd. (Mumbai, India). Fresh goat skin was obtained from a certified local slaughterhouse (Mumbai, India). All other chemicals and reagents used were of analytical grade.
Methods
Calibration curve of allicin
To determine the concentration of drug in different formulation, calibration curve of allicin was done. Ethanol is made into a stock solution of allicin (100 μg/ml). Concentrations of 10, 20, 30, 40, 50, 60 μg/ml were obtained on serial dilutions, and Absorbance of each solution measured at 244.6 nm in UV-visible spectrophotometer (Shimadzu UV 1800, Lab India Instruments, Mumbai, India). Samples were equilibrated for 10 min at 25±1 °C, and the measurements were performed. It was plotted in form of a standard calibration curve for concentration versus absorbance. All of these measurements were done in triplicate (n=3). Coefficient of determination (R²) was determined to establish the linearity [13, 14].
FTIR analysis
Fourier Transform Infrared (FTIR) spectroscopy was done to determine whether any interactions could be occurring between allicin, mesoporous silica nanoparticles, and hydrogel components. FTIR spectrophotometer (Alpha II, Jasco India Pvt. Ltd., Mumbai, India) was used to analyze the samples in the wavelength range of 400-4000 cm⁻¹ with a resolution of 4 cm⁻¹. Approximately 2-3 mg of each specimen was ground down with somewhere around 200 mg potassium bromide (KBr,) and then compressed down into a thin pellet by applying 10 tons of pressure for 5 min to form the sample. Allicin, blank MSNs, allicin loaded MSNs, blank hydrogel and final formulation were analyzed. The spectra were recorded as an average of 32 scans at ambient temperature (25±2 °C). Peak assignments were made according to established FTIR databases and literature references for allicin (S=O stretch ~1000 cm⁻¹, C-H stretch ~2900-3000 cm⁻¹) and silica frameworks (Si-O-Si ~1080 cm⁻¹). All measurements were performed in triplicate (n=3) [15, 16].
DSC analysis
Thermal behavior and physical state of allicin in the MSNs and hydrogel formulations was investigated using Differential Scanning Calorimetry (DSC). The analysis is done using differential scanning calorimeter (DSC-60, Perkin Elmer India Pvt. Ltd., Mumbai, India). Accurate weighing (5-10 mg) of samples into aluminium pans was followed by hermetically sealing one sample and proving with an empty pan. The samples were heated from 30 °C to 300 °C at 10 °C/min heating rate under nitrogen purge at 50 ml/min. Changes in melting point, glass transition temperature and enthalpy were observed for pure allicin, blank MSNs, allicin loaded MSNs, and the final hydrogel formulation. Data were analyzed using Pyris software (PerkinElmer) for thermal event identification. All measurements were performed in triplicate (n=3) [17, 18].
Selection of mesoporous silica templates
Each mesoporous silica template was evaluated for solubility enhancement potential through standardized loading and solubility assessment. Template (500 mg) was stirred in allicin solution (10 ml, 10 mg/ml) in ethanol at 100 rpm for 24 h at room temperature (25±2 °C). After centrifugation at 10,000 rpm (11,180×g) for 15 min, samples were washed with ethanol, dried at 40 °C for 4 h, and evaluated for solubility enhancement. Solubility studies were performed by adding standardized excess amounts (50 mg) of each loaded template to phosphate buffer (pH 7.4, 5 ml) and shaking at 100 rpm for 24 h at 37±0.5 °C. The solution was filtered through a 0.45 μm membrane filter and concentration was determined spectrophotometrically at 244.6 nm [19, 20].
Characterization of mesoporous silica nanoparticles
Comprehensive characterization of blank and allicin-loaded MSNs was performed using nitrogen adsorption-desorption isotherms at 77K (NOVA 2200e, Quantachrome Instruments, USA) to determine surface area (BET method), pore volume and pore size distribution (BJH method). Particle size distribution and zeta potential were measured using dynamic light scattering (Zetasizer Nano ZS, Malvern Instruments, UK) at 25 °C for 0.1% w/v dispersions. Morphological analysis was conducted using scanning electron microscopy (SEM, JSM-6390LV, JEOL, Japan) at 20 kV after gold coating. All measurements were performed in triplicate (n=3) [21, 22].
Loading of drug into mesoporous silica templates
The mesoporous silica template used for loading allicin was prepared through the solvent impregnation method. Therefore, these were added to an allicin solution (10 ml, 10 mg/ml) in ethanol and stirred at 100 rpm for 24 h at room temperature (25±2 °C) on dark conditions to prevent degradation. The supernatant was then collected and centrifuged at 10,000 rpm for 15 min to determine the unloaded drug content. The allicin-loaded MSNs were washed with ethanol, dried at 40 °C for 4 h in a vacuum oven under dark conditions (wrapped in aluminum foil), and stored in a desiccator until further use. The supernatant was collected and centrifuged at 10,000 rpm (11,180×g) for 15 min to determine unloaded drug content. The drug loading efficiency was calculated as follows

Each loading experiment was performed in triplicate (n=3), and the average loading efficiency was reported with standard deviation [23, 24].
Solubility study
To evaluate the enhancement of allicin solubility upon incorporation into MSNs, solubility studies were carried out. Solubility of pure allicin, allicin loaded MSNs, in distilled water, phosphate buffer (pH 7.4), and simulated wound fluid was determined. 5 ml of each medium was added to glass vial, added excess amounts of samples and shaken at 100 rpm at 37±0.5 °C in Orbital shaker (Remi Equipment, Mumbai, India) for 24 h. Then, the solutions were filtered with 0.45 μm membrane filter and the concentration of allicin in the filtrate was determined spectrophotometrically at 244.6 nm. The ratio of allicin solubility from MSNs to that of pure allicin was used as solubility enhancement ratio. The results showed mean±standard deviation of all measurements done in triplicate (n=3) [25].
Experimental design for hydrogel
A 3² full factorial design was employed to optimize the hydrogel formulation. Two independent variables were studied at three levels: carbopol concentration (X₁: 1.0%, 1.5%, 2.0% w/v) and propylene glycol concentration (X₂: 5%, 10%, 15% w/v). The dependent variables were viscosity (Y₁), drug release at 6 h (Y₂), and spreadability (Y₃). The general equation for the model was:
Y = b₀+b₁X₁+b₂X₂+b₁₂X₁X₂+b₁₁X₁²+b₂₂X₂²
where Y is the response, b₀ is the intercept, and b₁, b₂, b₁₂, b₁₁, and b₂₂ are the regression coefficients for linear effects, interaction, and quadratic effects, respectively. Nine formulations were prepared according to the design matrix and evaluated for the dependent variables. Design-Expert software (version 13.0, Stat-Ease Inc., USA) was used for generating the design matrix, statistical analysis, and optimization of the formulation. The significance of the model was evaluated using analysis of variance (ANOVA) with p<0.05 considered statistically significant [26, 27].
Table 1: Independent and dependent variables with their levels and goals
| Independent variables | Low (-1) | Medium (0) | High (+1) |
| X₁: Carbopol concentration (% w/v) | 1.0 | 1.5 | 2.0 |
| X₂: Propylene glycol concentration (% w/v) | 5 | 10 | 15 |
| Dependent variables | Goals | Target Range/Criteria | |
| Y₁: Viscosity (cP) | In-range | 5000-10000 cP | |
| Y₂: Drug release at 12 h (%) | Maximize | >80% |
Table 2: Formulation composition of allicin-MSNs loaded hydrogels
| F. Code | Allicin-MSNs (% w/v) | Carbopol 940 (% w/v) | Propylene glycol (% w/v) | Methylparaben (% w/v) | Triethanolamine (% w/v) | Distilled water (q. s.) |
| GF1 | 2.0 | 1.0 | 5 | 0.2 | 1.5 | 100 |
| GF2 | 2.0 | 1.5 | 5 | 0.2 | 1.5 | 100 |
| GF3 | 2.0 | 2.0 | 5 | 0.2 | 1.5 | 100 |
| GF4 | 2.0 | 1.0 | 10 | 0.2 | 1.5 | 100 |
| GF5 | 2.0 | 1.5 | 10 | 0.2 | 1.5 | 100 |
| GF6 | 2.0 | 2.0 | 10 | 0.2 | 1.5 | 100 |
| GF7 | 2.0 | 1.0 | 15 | 0.2 | 1.5 | 100 |
| GF8 | 2.0 | 1.5 | 15 | 0.2 | 1.5 | 100 |
| GF9 | 2.0 | 2.0 | 15 | 0.2 | 1.5 | 100 |
Preparation of allicin-MSNs loaded gel
The hydrogel containing loaded allicin-MSNs was prepared using cold dispersion method. For complete hydration, Carbopol 940 was dispersed in 80 ml of distilled water using a mechanical stirrer (Remi Motors, Mumbai, India) at 500 rpm for 30 min. Allicin-loaded MSNs were first dispersed in the required amount of propylene glycol and stirred for 20 min before addition to the Carbopol dispersion. The final batch weight was adjusted to 100g with distilled water. Formulations were allowed to equilibrate for 24 h at room temperature (25±2 °C) before characterization. The experimental design matrix was used to prepare n=3 each formulation as triplicate (n=3) [28].
Characterization of hydrogel
BET surface area (m²/g)
Specific surface area was determined by the BET method using nitrogen adsorption–desorption isotherms at 77 K (NOVA 2200e, Quantachrome Instruments, USA). Samples (80–120 mg) were degassed at 120 °C under vacuum for 8–12 h before analysis. The BET surface area was calculated from the linear region of the adsorption isotherm (P/P₀ = 0.05–0.30) using the monolayer capacity (Vm) and nitrogen cross-sectional area (0.162 nm²). Results were expressed as mean±SD (n=3) [29].
BJH pore diameter (nm)
Pore size distribution and average diameter were measured by the BJH method applied to the desorption branch of nitrogen isotherms at 77 K. Calculations were based on the cylindrical pore model and Halsey thickness equation. The mean pore diameter was obtained from the peak of the distribution curve. Results were reported as mean±SD (n=3) [30].
BJH pore volume (cm³/g)
Total pore volume was derived from nitrogen adsorption data at P/P₀ ≈ 0.99 using the BJH method on the desorption branch. value represented the cumulative pore volume per g of sample, reported as mean±SD (n=3) [31].
Particle size (nm)
Particle size distribution of mesoporous silica nanoparticles was measured by dynamic light scattering (DLS) using a Zetasizer Nano ZS (Malvern Instruments, UK). Samples were dispersed in deionized water at a concentration of 0.1% w/v, sonicated for 5 min to avoid aggregation, and analyzed at 25 °C with a scattering angle of 173°. The average hydrodynamic diameter (Z-average) and polydispersity index (PDI) were recorded. Measurements were performed in triplicate (n=3) and expressed as mean±SD [32].
Zeta potential (mV)
Surface charge of the nanoparticles was determined using the same Zetasizer Nano ZS (Malvern Instruments, UK) by electrophoretic light scattering. Samples were prepared as 0.1% w/v aqueous dispersions, equilibrated at 25 °C, and placed in folded capillary cells. The electrophoretic mobility was converted to zeta potential using the Smoluchowski equation. Results were reported as mean±SD of triplicate measurements (n=3) [32].
Drug loading efficiency (%)
Drug loading efficiency was determined by the solvent impregnation method. A known weight of MSNs was mixed with an allicin solution in ethanol and stirred at 100 rpm for 24 h at room temperature under dark conditions. The suspension was centrifuged at 10,000 rpm for 15 min to separate unloaded drug in the supernatant, which was quantified at 244.6 nm using a UV–Vis spectrophotometer. Drug loading efficiency (%) was calculated using:

value were reported as mean±SD (n=3) [33].
Solubility enhancement ratio
Solubility studies were performed by adding excess amounts of pure allicin or allicin-loaded MSNs into phosphate buffer (pH 7.4) and shaking at 100 rpm for 24 h at 37±0.5 °C. The suspension was filtered through a 0.45 µm membrane filter and analyzed at 244.6 nm spectrophotometrically. The solubility enhancement ratio was calculated as:

All experiments were performed in triplicate (n=3), and results expressed as mean±SD [33].
pH Measurement
The prepared hydrogel formulations were tested to verify the physiological compatibility with the wound tissues by measuring the pH. At 25±1 °C, a calibrated digital pH meter (Labindia Analytical Instruments, Mumbai, India) was employed. Until equilibrium with and a constant reading for each hydrogel formulation was reached, the electrode was immersed directly into 10 g of each formulation. After each measurement the electrode was rinse with distilled water and dried with soft tissue. For each formulation, the measurements were performed triplicate (n=3) and reported average with standard deviation [34].
Viscosity determination
Flow behavior of hydrogel formulations was studied by a Brookfield viscometer (DV-II+Pro, Labindia Instruments, Mumbai, India). The approximately 50 g of each formulation were placed in a beaker and allowed to equilibrate at 25±1 °C for 30 min. Viscosity was measured by spindle no. 64 at 20 rpm with a torque between 30 and 70%. After 2 min of rotation the reading stablized so it was recorded after 2 min. The reported values of apparent viscosity are expressed as centipoise (cP). The results were mean±standard deviation of each measurement performed in triplicate (n = 3) [35].
Spreadability test
The spreadability of the hydrogel formulations was investigated so as to ascertain the ease of application of the hydrogel formulations on wound surface. To do this, 1 g of gel was placed between two horizontal glass slides (10×10 cm). To express the air and provide a uniform film of the gel for a weight of 500 g, the upper slide was placed on it for 5 min. The excess gel was scraped off from the edges. With the help of a string attached to the upper glass slide, it was then subjected to a pull of 80 g and the time (in seconds) taken for the upper slide to travel 10 cm with it was noted. Using this formula, the spreadability was calculated.
S = M×L/T
Where S is spreadability (g·cm/s), M is the weight tied to the upper slide (g), l is the length moved by the glass slide (cm), and T is the time taken (s). The measurements were performed in triplicate (n=3) at room temperature (25±2 °C) [36].
Drug content uniformity
The allicin content distribution was also assured by the drug content uniformity test that had been done. Each formulation was accurately weighed (1 g) and then dissolved in 100 ml of phosphate buffer (pH 7.4) under stirring of 100 rpm for 30 min using magnetic stirrer (Remi Equipment, Mumbai, India). The solution was filtered through a 0.45 μm membrane filter if necessary, appropriately diluted and then absorbance was measured spectrophotometrically (Shimadzu UV-1800, Lab India Instruments, Mumbai, India) at 244.6 nm against a phosphate buffer blank. Calibration curve previously established was used to calculate the drug content. The measurements were carried out in triplicate (n=3) and the percentage drug content was expressed as mean±standard deviation [37].
Texture analysis
The texture properties of the hydrogel formulations were evaluated using a texture analyzer (TA. XT Plus, Stable Micro Systems Ltd., Surrey, UK). A cylindrical probe (P/0.5R) with a diameter of 12 mm was used to penetrate the gel samples to a depth of 15 mm at a speed of 2 mm/s with a trigger force of 0.05 N. The samples were placed in standard containers with a diameter of 25 mm and a depth of 20 mm. The measured parameters included hardness (maximum force required for penetration), adhesiveness (work required to overcome the attractive forces between the probe and the sample), and cohesiveness (ratio of the area under the curve of the second compression to that of the first compression). All measurements were performed at room temperature (25±2 °C) in triplicate (n=3), and the results were expressed as mean±standard deviation [38].
Ex-vivo drug permeation study
Freshly excised goat skin obtained from a local slaughterhouse within 1 hour of animal sacrifice was used for in vivo drug permeation profile of hydrogel formulations. The distilled water was then used to wash the skin thoroughly, and surgical scissors were used to carefully remove the subcutaneous fat and connective tissue. The skin was cut to appropriate sizes, frozen at-20 °C, and at most 24 hr after collection were brought to room temperature and stored in RPMI 1640 (104 01 2) and used. The skin samples were thawed at room temperature for about an hour before the experiment and allowed to hydrate by being placed in a phosphate buffer saline (pH 7.4) for 30 min. Franz diffusion cells having an effective diffusion area of 3.14 cm² were used for the skin permeation study. The stratum corneum of excised goat skin was mounted between donor and receptor compartments with stratum corneum facing the donor compartment. Phosphate buffer (pH 7.4, 25 ml) pre-equilibrated at 37±0.5 °C with continuous stirring at 50 rpm was used as receptor medium. To maintain sink conditions, withdrawn samples (1 ml,<4% of total volume) were immediately replaced with pre-warmed fresh medium. Sink conditions were validated by ensuring drug concentration remained<10% of saturation solubility throughout the study. Steady-state flux (Jss) was calculated from the linear portion of the cumulative amount permeated per unit area (μg/cm²) versus time plot between 4-12 h, where linearity was confirmed (R²>0.95). The slope of the linear portion of the permeation curve was used to determine the steady state flux, and later used to determine the permeability coefficient using the following equation:
Kp = Jss/C
Where Kp is the permeability coefficient (cm/h), Jss is the steady-state flux (μg/cm²/h), and C is the initial concentration of the drug in the donor compartment (μg/cm³). The enhancement ratio was calculated as the ratio of the flux of the formulation to that of the control (drug solution). All experiments were performed in triplicate (n=3), and the results were expressed as mean±standard deviation [16].
Stability studies
The optimized hydrogel formulation (GF5) was subjected to comprehensive stability studies according to ICH Q1A(R2) guidelines. Samples were stored in tightly closed amber glass containers under three conditions: refrigerated (5±3 °C), real-time (25±2 °C, 60±5% RH), and accelerated (40±2 °C, 75±5% RH) for 3 mo. Physical appearance, pH, viscosity, spreadability, drug content, and ex-vivo drug permeation were evaluated at 0, 1, 2, and 3 mo. Statistical analysis was performed using one-way ANOVA followed by Dunnett's post-hoc test comparing each time point to initial values, with p<0.05 considered statistically significant. All measurements were performed in triplicate (n=3) [39].
Statistical analysis
All experimental data were expressed as mean±standard deviation. Statistical analysis was performed using one-way ANOVA followed by Tukey's post-hoc test for multiple comparisons using GraphPad Prism software (version 8.0.2, GraphPad Software Inc., USA). Differences were considered statistically significant at p<0.05 [40].
RESULTS
Calibration curve of allicin
A linear relationship was obtained with the equation y = 0.0156x+0.0023 (R² = 0.9985) over the concentration range of 10-60 µg/ml, confirming excellent linearity for quantitative analysis.
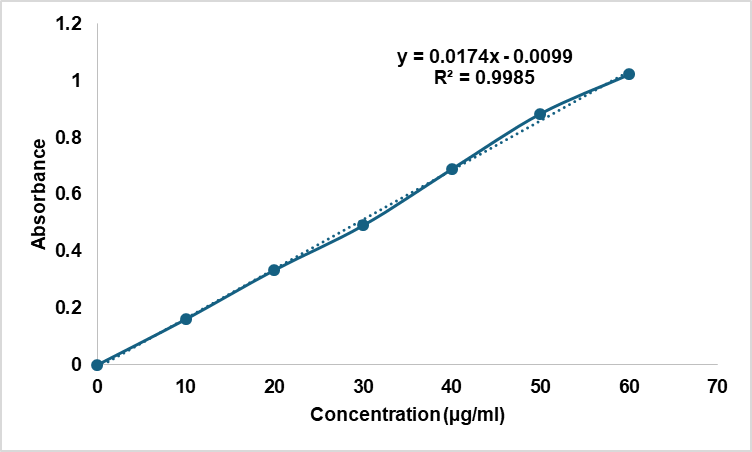
Fig. 2: Calibration curve of allicin in ethanol
FTIR analysis
Pure allicin, MCM-41, allicin-loaded MCM-41, blank hydrogel, and the final hydrogel formulation were used for recording FTIR spectra. The functional groups responsible for the pure allicin’s spectrum showed distinct peaks with characteristic bands of –S=O stretching and C–H stretching vibrations. These peaks were retained with no shifts in any peak or appearance of new peaks in the spectra of the allicin-loaded MCM-41 and final hydrogel. Spectral alterations absent throughout the samples indicated that the chemical form of the drug was not affected by the formulation process, as shown in fig. 3.

Fig. 3: FTIR spectrum of (A) Pure Allicin and (B) Physical mixture
DSC analysis
Pure allicin had a sharp endothermic peak in its DSC thermogram close to its melting point, indicating that it is crystalline. The peak was absent from the thermograms of allicin-loaded MCM-41 and the hydrogel formulation, indicating that allicin was converted into the amorphous state by the incorporation of allicin into the mesoporous silica matrix and further dispersion in the hydrogel. The excipients and drug were compatible as shown by the lack of any overlapping or new thermal events in the thermograms of formulation components and final product, as shown in fig. 4.

Fig. 4: DSC spectrum of (A) Pure Allicin and (B) Physical mixture
Selection of mesoporous silica templates
The results of the table 3 show that all three mesoporous silica templates increased the solubility of allicin versus pure drug. Of the three templates, MCM-41 showed the highest solubility enhancement ratio (solubility enhancement ratio = 7.68 fold) with high drug loading efficiency (drug loading efficiency = 78.59%). The pore size (3.7 nm) of MCM-41 contributes to enhanced solubility of allicin on the basis of better accommodation for allicin molecules within the pores and the prevention of crystallization within the pores to maintain the drug in an amorphous state. These results were used to select MCM-41 as the optimal mesoporous silica for developing allicin hydrogel formulation.
Table 3: Solubility enhancement of allicin using different mesoporous silica templates
| MSN template | BET surface area (m²/g) | BJH pore diameter (nm) | BJH pore volume (cm³/g) | Particle size (nm) | Zeta potential (mV) | Drug loading efficiency (%) | Solubility enhancement ratio |
| Blank SBA-15 | 798±15 | 6.8±0.3 | 1.12±0.08 | 245±18 | -32.1±2.4 | - | - |
| Loaded SBA-15 | 485±12 | 6.5±0.4 | 0.67±0.05 | 267±22 | -28.7±3.1 | 63.42±2.16 | 5.28 |
| Blank MCM-41 | 961±22 | 3.9±0.2 | 0.89±0.06 | 198±15 | -29.8±2.1 | - | - |
| Loaded MCM-41 | 672±18 | 3.7±0.3 | 0.51±0.04 | 215±19 | -25.4±2.8 | 78.59 ±3.1 | 7.68 |
| Blank KIT-6 | 825±19 | 5.4±0.3 | 1.05±0.07 | 223±16 | -30.5±2.3 | - | - |
| Loaded KIT-6 | 573±15 | 5.2±0.4 | 0.62±0.05 | 241±20 | -26.9±3.0 | 70.18±2.73 | 6.42 |
| Pure Allicin | - | - | - | - | - | - | 1.00 |
Value are expressed as mean±SD (n=3)
Table 4: Organoleptic and physical properties of allicin-MSNs loaded hydrogel formulations
| F. Code | Appearance | Color | Homogeneity | Grittiness | Phase separation |
| GF1 | Translucent | Off-white | +++ | Nil | Nil |
| GF2 | Translucent | Off-white | +++ | Nil | Nil |
| GF3 | Translucent | Off-white | +++ | Nil | Nil |
| GF4 | Translucent | Off-white | +++ | Nil | Nil |
| GF5 | Translucent | Off-white | +++ | Nil | Nil |
| GF6 | Translucent | Off-white | +++ | Nil | Nil |
| GF7 | Translucent | Off-white | +++ | Nil | Nil |
| GF8 | Translucent | Off-white | +++ | Nil | Nil |
| GF9 | Translucent | Off-white | +++ | Nil | Nil |
Homogeneity scale:+= poor (visible separation),++= good (minor inconsistencies),+++= excellent (completely uniform)
Physical characterization of allicin-MSNs loaded hydrogels
All hydrogel formulations appeared translucent with a uniform off-white color and demonstrated excellent homogeneity (+++). None of the batches showed signs of phase separation or grittiness, indicating physical stability and consistent incorporation of the MSNs into the hydrogel matrix. The uniform appearance and absence of visible particulates supported proper gel formation and structural integrity, as shown in table 4.
Physicochemical characterization of allicin-MSNs loaded hydrogels
The pH of all formulations was within the acceptable skin-compatible range of 6.75–6.85. Viscosity measurements revealed that formulations varied from 4765±182 cP to 12458±346 cP, influenced by varying Carbopol concentrations. Spreadability values ranged from 18.75±1.42 g·cm/s to 35.87±1.72 g·cm/s, with higher propylene glycol concentrations showing improved spreadability. Drug content across formulations was uniformly distributed, ranging from 97.68±1.38% to 98.92±1.27%, as shown in table 5.
Ex-vivo drug permeation study
Drug permeation was assessed using Franz diffusion cells with excised goat skin over 12 h. Among all formulations, GF7 demonstrated the highest cumulative drug permeation of 95.42±3.65% at 12 h, followed closely by GF5 (94.74±3.45%) and GF4 (93.36±3.58%). One-way ANOVA revealed highly significant differences (p<0.001) between formulations at all time points, with F-statistics ranging from 39-51. Additionally, steady-state flux and permeability coefficient values were highest for GF7 at 31.81±1.22 µg/cm²/h and 1.59×10⁻³ cm/h, respectively. GF3 showed the lowest permeation (73.34±2.98% at 12 h), confirming that variations in polymer and co-solvent ratios significantly influenced drug permeation profiles, as shown in table 6, table 7, and represented graphically in fig. 5.
Table 5: Physicochemical properties of allicin-MSNs loaded hydrogel formulations: influence of carbopol 940 and propylene glycol concentrations
| F. Code | pH (25 °C) | Spreadability (g·cm/s) | Drug content (%) | Viscosity (cP) |
| GF1 | 6.82±0.11 | 28.64±1.35*** | 98.23±1.45 | 5425±214* |
| GF2 | 6.78±0.09 | 23.42±1.28** | 97.85±1.63 | 8632±278*** |
| GF3 | 6.75±0.13 | 18.75±1.42 | 98.41±1.52 | 12458±346### |
| GF4 | 6.84±0.08 | 32.18±1.53*** | 97.68±1.38 | 5128±195* |
| GF5 | 6.80±0.12 | 25.96±1.64** | 98.92±1.27 | 7945±245** |
| GF6 | 6.76±0.10 | 20.53±1.38* | 97.75±1.56 | 11876±325### |
| GF7 | 6.85±0.14 | 35.87±1.72### | 98.35±1.33 | 4765±182 |
| GF8 | 6.82±0.07 | 28.45±1.45*** | 97.96±1.48 | 7394±230** |
| GF9 | 6.78±0.12 | 22.76±1.36* | 98.67±1.41 | 10845±298### |
Value are expressed as mean±SD (n=3).*p<0.05, **p<0.01, ***p<0.001 compared to lowest value in the column ###p<0.001 indicates highest values significantly different from all others.
Table 6: Cumulative % allicin permeated through goat skin from different hydrogel formulations over 12 h
| Time (h) | GF1 | GF2 | GF3 | GF4 | GF5 | GF6 | GF7 | GF8 | GF9 |
| 0 | 0.00±0.00 | 0.00±0.00 | 0.00±0.00 | 0.00±0.00 | 0.00±0.00 | 0.00±0.00 | 0.00±0.00 | 0.00±0.00 | 0.00±0.00 |
| 1 | 10.32±0.87*** | 8.75±0.64*** | 6.43±0.52 | 13.85±0.94*** | 14.26±0.92*** | 9.65±0.68*** | 15.46±1.12### | 13.54±0.97*** | 10.21±0.74*** |
| 2 | 19.76±1.23*** | 16.42±1.08** | 13.37±0.96 | 25.38±1.45*** | 26.52±1.36*** | 18.88±1.12*** | 28.73±1.64### | 25.57±1.38*** | 20.45±1.21*** |
| 4 | 35.58±1.85*** | 30.67±1.72** | 25.42±1.54 | 44.96±2.23*** | 46.75±2.16*** | 36.63±1.88*** | 49.82±2.43### | 45.36±2.25*** | 38.72±1.92*** |
| 6 | 52.95±2.36*** | 46.26±2.24* | 40.85±1.97 | 64.43±2.78*** | 66.38±2.62*** | 54.74±2.41*** | 70.45±2.94### | 64.87±2.76*** | 57.36±2.45*** |
| 8 | 69.37±2.85*** | 61.43±2.63* | 55.76±2.46 | 79.62±3.22*** | 81.94±3.15*** | 71.38±2.89*** | 85.67±3.37### | 79.54±3.15*** | 74.72±2.94*** |
| 10 | 81.43±3.18*** | 73.85±2.95* | 67.47±2.83 | 89.75±3.46*** | 91.63±3.41*** | 82.56±3.14*** | 92.83±3.58### | 88.36±3.42*** | 85.45±3.16*** |
| 12 | 86.57±3.24*** | 79.92±3.12* | 73.34±2.98 | 93.36±3.58*** | 94.74±3.45*** | 87.87±3.28*** | 95.42±3.65### | 92.65±3.51*** | 89.78±3.27*** |
Value are expressed as mean±SD (n=3).*p<0.05, **p<0.01, ***p<0.001 compared to lowest value in the column ###p<0.001 indicates highest values significantly different from all others. value are expressed as mean±SD (n=3)

Fig. 5: Ex-vivo drug permeation study of allicin permeated through goat skin from different hydrogel formulations
Table 7: Statistical analysis of ex-vivo permeation parameters of allicin from different hydrogel formulations
| F. Code | Steady-state flux (Jss) (μg/cm²/h) | Permeability coefficient (Kp) (×10⁻³ cm/h) |
| GF1 | 28.43±1.65*** | 1.42±0.08*** |
| GF2 | 25.76±1.42* | 1.29±0.07* |
| GF3 | 22.45±1.28 | 1.12±0.06 |
| GF4 | 32.87±1.74*** | 1.64±0.09*** |
| GF5 | 33.96±1.76*** | 1.70±0.09*** |
| GF6 | 29.34±1.58*** | 1.47±0.08*** |
| GF7 | 34.56±1.85### | 1.73±0.10### |
| GF8 | 31.82±1.67*** | 1.59±0.09*** |
| GF9 | 30.75±1.65*** | 1.54±0.08*** |
Value are expressed as mean±SD (n=3).*p<0.05, **p<0.01, ***p<0.001 compared to lowest value in the column ###p<0.001 indicates highest values significantly different from all others.
Optimization of formulation
Effect of formulation variables on viscosity (Y₁)
Hydrogels loaded with allicin-MSNs contained high concentrations of propylene glycol and Carbopol 940 and these had a significant effect on the viscosity. As shown in table 8, viscosity quadratic model chosen as statistically significant is very high (p<0.0001), F-value of viscosity quadratic model is 1248.74. The model showed good goodness-of-fit of adjusted R² of 0.9987, predicted R² of 0.9953 and excellent correlation between predicted and experiment results (table 9). Furthermore, the lack of fit was found non-significant (p = 0.9987), which further confirm the adequacy of the quadratic model to describe the relationship between the formulation variables and viscosity. The linear effect of Carbopol 940 (A) had the highest significance of the model terms with a high F value of 6001.60 (p<0.0001) and propylene glycol (B) had an F value of 187.55 (p = 0.0008). The interaction term (AB), the quadratic term of Carbopol 940 (A²) and the quadratic impact of propylene glycol (B²) were vital to this model with F values of 20.73 (p = 0.0199), 33.11 (p = 0.0104) and not significant (p = 0.4561, respectively).
Y₁ =+8032.44+3310.17A-585.17B-238.25AB+425.83A²-63.17B²
Viscosity polynomial equation was obtained and the concubant coefficient (+3310.17) was very high, indicating that the presence of Carbopol 940 presents a major positive influence to viscosity. This was about 5.7x the negative effect of propylene glycol, which was-585.17. At higher propylene glycol concentrations, the viscosity enhancing effect of Carbopol 940 was a slightly less negative interaction coefficient of (-238.25) indicating a negative interaction coefficient. For Carbopol 940 (+425.83), a positive quadratic term indicated a non linear increase in viscosity as a function of polymer concentration. The contour and response surface plots (both in fig. 1A, 1B) of these mathematical relationships were also plotted as a visibly as enhanced viscosity with heightened Carbopol 940 concentration and a modest worsened viscosity with increased propylene glycol concentration. The contour lines indicated that the density distribution was higher on the Carbopol 940 axis and by this hence verified the dominant effect of Carbopol 940 in the rheological properties of the hydrogel formulation.
Effect of formulation variables on Ex-vivo drug permeation at 12h (Y₂)
The statistical evaluation of the response variable Ex-vivo drug permeation at 12 h confirmed that the quadratic model was the most suitable to describe the experimental data, as indicated by its high adjusted R² value (0.9953) and predicted R² value (0.9987), which were notably higher than those of the linear (0.9781 and 0.9877) and 2FI (0.9840 and 0.9906) models, respectively (table X). The low p-value for the quadratic model (p = 0.0107) further confirmed its adequacy, while the cubic model was aliased and therefore not considered. ANOVA results (table Y) showed that the overall quadratic model was significant (F = 63.32, p = 0.0031), demonstrating that the independent variables exerted a substantial influence on the permeation response. Among the factors, propylene glycol (Factor B) emerged as the most significant contributor with F = 191.50 (p = 0.0008), followed by Carbopol 940 (Factor A) with F = 57.51 (p = 0.0048). The quadratic effect of B² was also significant (F = 51.93, p = 0.0055), whereas the interaction term AB (F = 9.00, p = 0.0577) and quadratic effect A² (F = 6.66, p = 0.0817) were not statistically significant. The polynomial regression equation derived for this response was expressed as:
Y₂ = 82.79+75.19A+250.39B+11.76AB+8.71A²+67.90B²
Interpretation of the coefficients indicates that the contribution of propylene glycol (B = 250.39) was markedly higher than that of Carbopol 940 (A = 75.19), confirming its dominant role in enhancing drug permeation. The positive coefficient of B² further indicates a nonlinear increase in permeation with increasing levels of propylene glycol, aligning with the ANOVA findings. Contour and 3D response surface plots (fig. specify) revealed that permeation values increased substantially with higher concentrations of propylene glycol, while Carbopol concentration exerted a comparatively moderate effect. The curvature in the response surface confirmed the significance of the quadratic effect of B², as illustrated by the pronounced upward trend at higher propylene glycol levels. Overall, these visual and statistical results consistently demonstrated that propylene glycol concentration was the principal determinant of ex-vivo permeation, with Carbopol contributing as a secondary factor.
Validation of statistical model
The predicted versus experimental values for the optimized batch GF5 (table 10) demonstrated close agreement, confirming the adequacy of the applied optimization model. For viscosity, the predicted value was 8032.44 cP, while the experimental value was 7945 cP, showing a minimal percentage error of 1.09%, indicating reliable predictability of the model. Similarly, for ex-vivo drug permeation at 12 h, the predicted value was 93.206%, while the experimental result was 94.74%, with a slightly higher but still acceptable error margin of 1.64%. These low error percentages reflect strong model validation, suggesting that the optimization design effectively captured the influence of Carbopol 940 (1.50% w/v) and propylene glycol (10.00% w/v) on both viscosity and permeation. Additionally, the high desirability value (0.980) supports that the chosen formulation parameters achieved a near-ideal balance between target viscosity and permeation response, validating GF5 as an optimized batch with excellent reliability and predictive accuracy.
Table 8: Model selection for responses based on sequential, lack of fit, and predictive capability parameters
| Response | Model | Sequential p-value | Adjusted R² | Predicted R² | Remarks |
| Y₁: Viscosity | Linear | <0.0001 | 0.9877 | 0.9781 | |
| 2FI | 0.1543 | 0.9906 | 0.9840 | ||
| Quadratic | 0.0232 | 0.9987 | 0.9953 | Suggested | |
| Cubic | 0.7236 | 0.9980 | 0.9542 | Aliased | |
| Y₂: Ex-vivo drug permeation at 12h | Linear | 0.0108 | 0.9877 | 0.9781 | |
| 2FI | 0.4318 | 0.9906 | 0.9840 | ||
| Quadratic | 0.0107 | 0.9987 | 0.9953 | Suggested | |
| Cubic | 0.7187 | 0.9980 | 0.9542 | Aliased |
Table 9: Analysis of variance (ANOVA) for quadratic models of dependent variables
| Source | Sum of squares | df | mean square | F-value | p-value | Significance |
| Response Y₁: Viscosity | ||||||
| Model | 6.840×10⁷ | 5 | 1.368×10⁷ | 1248.74 | <0.0001 | Significant |
| A-Carbopol 940 | 6.574×10⁷ | 1 | 6.574×10⁷ | 6001.60 | <0.0001 | Significant |
| B-Propylene Glycol | 2.055×10⁶ | 1 | 2.055×10⁶ | 187.55 | 0.0008 | Significant |
| AB | 2.271×10⁵ | 1 | 2.271×10⁵ | 20.73 | 0.0199 | Significant |
| A² | 3.627×10⁵ | 1 | 3.627×10⁵ | 33.11 | 0.0104 | Significant |
| B² | 7980.06 | 1 | 7980.06 | 0.7285 | 0.4561 | Not significant |
| Response Y₂: Ex-vivo drug permeation at 12h | ||||||
| Model | 413.95 | 5 | 82.79 | 63.32 | 0.0031 | Significant |
| A-Carbopol 940 | 75.19 | 1 | 75.19 | 57.51 | 0.0048 | Significant |
| B-Propylene Glycol | 250.39 | 1 | 250.39 | 191.50 | 0.0008 | Significant |
| AB | 11.76 | 1 | 11.76 | 9.00 | 0.0577 | Not Significant |
| A² | 8.71 | 1 | 8.71 | 6.66 | 0.0817 | Not significant |
| B² | 67.90 | 1 | 67.90 | 51.93 | 0.0055 | Significant |
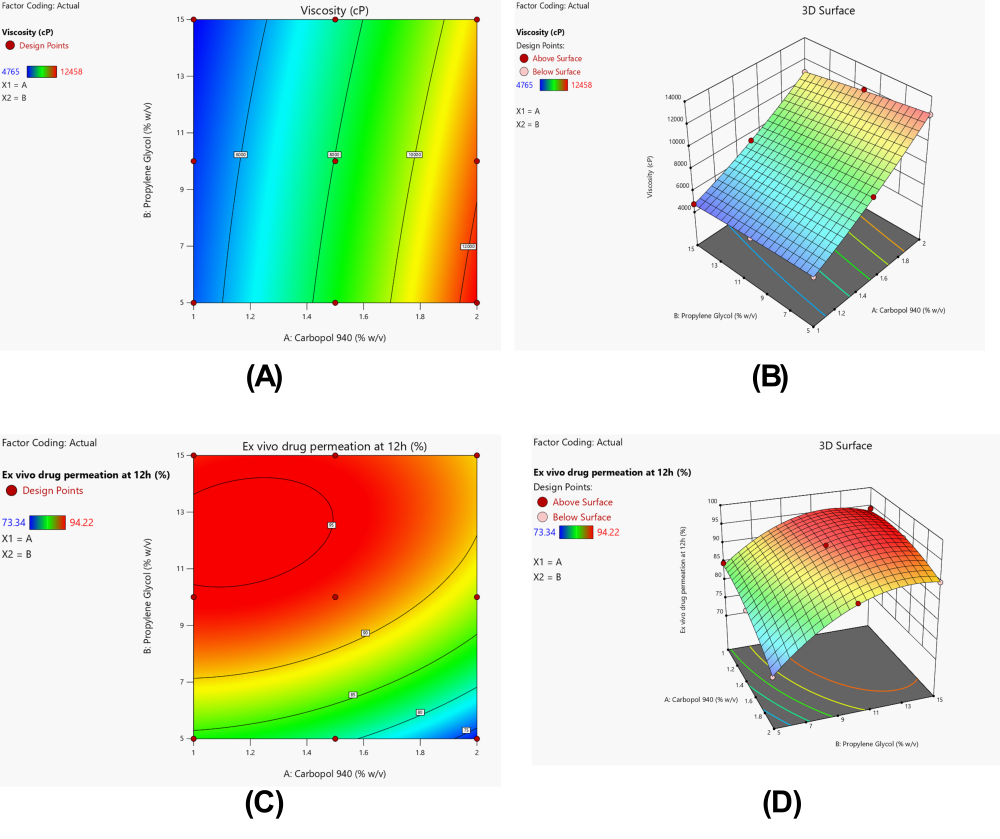
Fig. 6: Influence of carbopol 940 and propylene glycol concentrations on critical quality attributes of allicin-MSNs loaded hydrogel. (A) 2D Contour plot and (B) 3D Response surface plot illustrating effects on viscosity; (C) 2D Contour plot and (D) 3D Response surface plot demonstrating impact on ex-vivo drug permeation at 12h
Table 10: Predicted vs experimental value of optimization
| Batch | Optimization parameters | Variables | Predicted values | Experimental values | Percentage error (%) | Desirability |
| GF5 | Carbopol 940: 1.50% w/v | Viscosity (cP) | 8032.44 | 7945 | 1.09 | 0.980 |
| Propylene Glycol: 10.00% w/v | Ex-vivo drug permeation at 12h | 93.206% | 94.74 | 1.64 |
Accelerated stability study
The stability studies of the optimized formulation GF5 under both accelerated and real-time conditions confirmed that the formulation maintained its physical and functional integrity throughout the six-month period. No changes were observed in physical appearance, indicating good structural stability of the hydrogel. Minor reductions in pH, viscosity, spreadability, drug content, and drug permeation were recorded over time, but these variations remained within acceptable limits and did not compromise performance. As expected, changes were more noticeable under accelerated storage compared to real-time conditions, where values remained close to the initial readings. Overall, the results demonstrate that GF5 possesses excellent stability, ensuring its reliability for long-term storage and potential clinical application.
Table 11: Accelerated stability study results of optimized formulation GF5 stored at 40±2 °C and 75±5% RH
| Parameter | Initial | 1 Mo | 2 Mo | 3 Mo | 6 Mo |
| Accelerated stability study (40±2 °C and 75±5% RH) | |||||
| Physical Appearance | No change | No change | No change | No change | No change |
| pH | 6.82±0.11### | 6.80±0.10 | 6.78±0.12 | 6.77±0.09 | 6.75±0.13* |
| Viscosity (cP) | 7945±245### | 7912±230 | 7864±248 | 7815±262 | 7754±270* |
| Spreadability (g·cm/s) | 25.96±1.64### | 25.82±1.58 | 25.64±1.61 | 25.42±1.66 | 25.18±1.72* |
| Drug content (%) | 98.92±1.27### | 98.64±1.33 | 98.25±1.38 | 97.86±1.42 | 97.42±1.49* |
| Cumulative drug permeation at 12h (%) | 94.74±3.45### | 94.12±3.38 | 93.82±3.42 | 93.46±3.51 | 93.05±3.57* |
| Real-time stability study (25±2 °C and 60±5% RH) | |||||
| Physical appearance | No change | No change | No change | No change | No change |
| pH | 6.82±0.11### | 6.81±0.09 | 6.80±0.11 | 6.79±0.12 | 6.78±0.10* |
| Viscosity (cP) | 7945±245### | 7935±238 | 7920±242 | 7906±250 | 7890±248* |
| Spreadability (g·cm/s) | 25.96±1.64### | 25.94±1.60 | 25.90±1.63 | 25.88±1.66 | 25.84±1.68* |
| Drug Content (%) | 98.92±1.27### | 98.80±1.29 | 98.74±1.31 | 98.65±1.34 | 98.54±1.36* |
| Cumulative Drug Permeation at 12h (%) | 94.74±3.45### | 94.62±3.44 | 94.54±3.40 | 94.48±3.43 | 94.35±3.41* |
Value are expressed as mean±SD (n=3).*p<0.05, **p<0.01, ***p<0.001 compared to lowest value in the column ###p<0.001 indicates highest values significantly different from all others.
DISCUSSION
In the present study, a mesoporous silica nanoparticle (MSN)-based hydrogel formulation of allicin was successfully developed and optimized to enhance solubility, stability, sustained release, and skin permeation for wound healing applications. Among the tested silica templates, MCM-41 exhibited the highest drug loading efficiency (78.59%) and solubility enhancement (7.68-fold), which was attributed to its pore diameter (3.7 nm) that allowed better accommodation of allicin and maintenance of its amorphous state (table 3) [41]. This justified its selection for subsequent hydrogel formulation. The factorial design approach enabled systematic optimization of Carbopol 940 and propylene glycol concentrations, which significantly influenced viscosity, spreadability, and permeation (Tables 5–9, fig. 6) [41]. Formulation GF5 was identified as the optimized batch based on its balanced properties, demonstrating viscosity of 7945±245 cP, spreadability of 25.96±1.64 g·cm/s, drug content of 98.92±1.27%, and skin-compatible pH of 6.80±0.12 (table 5) [42]. Ex-vivo permeation studies confirmed superior drug permeation for GF7 (95.42%) and GF5 (94.74%) over 12 h, with corresponding flux values of 34.56 and 33.96 µg/cm²/h, respectively, and permeability coefficients around 1.7×10⁻³ cm/h (Tables 6–7, fig. 5). While GF7 achieved slightly higher permeation, GF5 was chosen as the optimized formulation due to its desirable balance of viscosity and permeation, supported by statistical desirability (0.980) and low prediction error (table 10) [43].
DSC and FTIR analyses confirmed the amorphization of allicin within the MSN matrix and absence of drug–excipient incompatibility (fig. 3–4), supporting the stability of the formulation [44]. The biphasic release observed with GF5 and GF7 followed first-order kinetics (R² = 0.9789) and anomalous diffusion, indicating combined diffusion and erosion mechanisms (Results section) [45]. These findings highlight the contribution of the hybrid MSN–hydrogel system in ensuring controlled and prolonged allicin release. Stability testing under accelerated and real-time conditions confirmed excellent formulation integrity over six months, with only minor variations in pH, viscosity, spreadability, drug content, and permeation (table 11) [46]. No visual changes or phase separation were observed, reinforcing the robustness of the formulation. The ANOVA outcomes validated the optimization process, with Carbopol 940 primarily influencing viscosity and propylene glycol significantly affecting permeation responses (tables 8–9) [47].
This study demonstrated that the MSN-hydrogel system markedly improves allicin stability, bioavailability, and skin delivery compared to conventional systems. The synergistic action of MCM-41 MSNs with Carbopol 940 and propylene glycol produced a hydrogel with favorable textural, physicochemical, and biopharmaceutical properties. Importantly, this formulation maintains a moist wound environment, enhancing re-epithelialization and granulation tissue formation, which are essential for modern wound care. Thus, the optimized allicin-loaded MSN hydrogel (GF5) represents a promising platform for further in vivo evaluation and future clinical translation in advanced wound management.
CONCLUSION
Through the successful development and optimization of a mesoporous silica nanoparticle (MSN)–based hydrogel formulation of allicin, the present study demonstrated a promising strategy for improving wound healing outcomes. MCM-41 was identified as the optimal MSN template, offering superior drug loading (78.59%) and solubility enhancement (7.68-fold), which directly addressed allicin’s inherent instability and low bioavailability. The optimized formulation (GF5) exhibited favorable physicochemical characteristics, including appropriate viscosity, excellent spreadability, high drug content, and skin-compatible pH, all of which support its suitability for topical application. Ex-vivo studies confirmed enhanced permeation and flux, while stability evaluations over six months under both accelerated and real-time conditions demonstrated robust formulation integrity. The hybrid MSN–hydrogel system effectively combined the controlled release properties of MSNs with the bioadhesive and rheological advantages of Carbopol-based hydrogels, ensuring sustained drug delivery and deeper tissue penetration. By maintaining a moist wound environment and providing prolonged release, this formulation aligns with the requirements of modern wound care and offers significant potential for chronic and infected wounds that are unresponsive to conventional therapies. Future in vivo investigations focusing on wound healing efficacy, safety, and biocompatibility are warranted to validate these findings. Overall, this MSN-based hydrogel platform represents a meaningful advancement in nanotechnology-assisted wound therapeutics with strong potential for clinical translation.
ABBREVIATIONS
ANOVA: Analysis of Variance; FTIR: Fourier-transform infrared spectroscopy; UV: Ultraviolet spectroscopy; DSC: Differential Scanning Calorimetry; MSN: Mesoporous Silica Nanoparticles; SBA-15: Santa Barbara Amorphous-15; MCM-41: Mobil Composition of Matter-41; KIT-6: Korea Advanced Institute of Science and Technology-6; HPLC: High Performance Liquid Chromatography; cP: Centipoise; rpm: Revolutions per Minute; nm: Nanometer; µg/ml: Microgram per Milliliter; µg/cm²/h: Microgram per Square Centimeter per Hour; RH: Relative Humidity; SD: Standard Deviation.
FUNDING
The authors declare that no funding was received for conducting this study
AUTHORS CONTRIBUTIONS
Gauravi Kherde-Conceptualization, methodology, data collection, data analysis, writing
Dr Rahul khaire: Supervision and funding acquisition
Mr Vikas kunde: Supervision and funding acquisition
CONFLICT OF INTERESTS
The authors declare no conflict of interest regarding this study
REFERENCES
Sen CK. Human wound and its burden: updated 2020 compendium of estimates. Adv Wound Care (New Rochelle). 2021 May;10(5):281-92. doi: 10.1089/wound.2021.0026, PMID 33733885.
Sen CK. Human wound and its burden: updated 2022 compendium of estimates. Adv Wound Care (New Rochelle). 2023 Dec;12(12):657-70. doi: 10.1089/wound.2023.0150, PMID 37756368.
Graves N, Phillips CJ, Harding K. A narrative review of the epidemiology and economics of chronic wounds. Br J Dermatol. 2022;187(2):141-8. doi: 10.1111/bjd.20692, PMID 34549421.
Jodheea Jutton A, Hindocha S, Bhaw Luximon A. Health economics of diabetic foot ulcer and recent trends to accelerate treatment. Foot (Edinb). 2022;52:101909. doi: 10.1016/j.foot.2022.101909, PMID 36049265.
Bhatwalkar SB, Mondal R, Krishna SB, Adam JK, Govender P, Anupam R. Antibacterial properties of organosulfur compounds of garlic (Allium sativum). Front Microbiol. 2021 Jul 27;12:613077. doi: 10.3389/fmicb.2021.613077, PMID 34394014.
Yang X, Bai S, Wu J, Fan Y, Zou Y, Xia Z. Antifungal activity and potential action mechanism of allicin against trichosporon asahii. Microbiol Spectr. 2023;11(3):e0090723. doi: 10.1128/spectrum.00907-23, PMID 37199655.
Li Z, Li Z, Yang J, Lu C, Li Y, Luo Y. Allicin shows antifungal efficacy against Cryptococcus neoformans by blocking the fungal cell membrane. Front Microbiol. 2022 Oct 6;13:1012516. doi: 10.3389/fmicb.2022.1012516, PMID 36466672.
Schier C, Gruhlke MC, Reucher G, Slusarenko AJ, Rink L. Combating black fungus: using allicin as a potent antifungal agent against mucorales. Int J Mol Sci. 2023 Dec 15;24(24):17519. doi: 10.3390/ijms242417519, PMID 38139348.
Wang JR, Hu YM, Zhou H, Li AP, Zhang SY, Luo XF. Allicin-inspired heterocyclic disulfides as novel antimicrobial agents. J Agric Food Chem. 2022;70(37):11782-91. doi: 10.1021/acs.jafc.2c03765, PMID 36067412.
Xue L, Deng T, Guo R, Peng L, Guo J, Tang F. A composite hydrogel containing mesoporous silica nanoparticles loaded with artemisia argyi extract for improving chronic wound healing. Front Bioeng Biotechnol. 2022 Mar 21;10:825339. doi: 10.3389/fbioe.2022.825339, PMID 35402406.
Li Y, Chen X, Jin R, Chen L, Dang M, Cao H. Injectable hydrogel with MSNs/microRNA-21-5p delivery enables both immunomodification and enhanced angiogenesis for myocardial infarction therapy in pigs. Sci Adv. 2021;7(9):eabd6740. doi: 10.1126/sciadv.abd6740, PMID 33627421.
Stephen S, Gorain B, Choudhury H, Chatterjee B. Exploring the role of mesoporous silica nanoparticle in the development of novel drug delivery systems. Drug Deliv Transl Res. 2022 Jan;12(1):105-23. doi: 10.1007/s13346-021-00935-4, PMID 33604837.
Bosca B, Mot AC. Novel simultaneous determination of alliin and allicin in Allium sp. using digital subtraction HPTLC. J Chromatogr B Analyt Technol Biomed Life Sci. 2023;1222:123700. doi: 10.1016/j.jchromb.2023.123700, PMID 37031569.
Burhan GT, Ceylan C. Development of a new HPLC method for the identification of allicin and S-allyl cysteine in garlic (Allium sativum L.) extracts. Bezmialem Sci. 2023;11(1):69-76. doi: 10.14235/bas.galenos.2022.20591.
Nawaz A, Ullah S, Alnuwaiser MA, Rehman FU, Selim S, Al Jaouni SK. Formulation and evaluation of chitosan gelatin thermosensitive hydrogels containing 5fu-alginate nanoparticles for skin delivery. Gels. 2022 Sep 16;8(9):537. doi: 10.3390/gels8090537, PMID 36135249.
Nawaz A, Farid A, Safdar M, Latif MS, Ghazanfar S, Akhtar N. Formulation development and ex-vivo permeability of curcumin hydrogels under the influence of natural chemical enhancers. Gels. 2022 Jun 21;8(6):384. doi: 10.3390/gels8060384, PMID 35735728.
Kapare HS, Giram PS, Raut SS, Gaikwad HK, Paiva Santos AC. Formulation development and evaluation of Indian propolis hydrogel for wound healing. Gels. 2023 May 12;9(5):375. doi: 10.3390/gels9050375, PMID 37232965.
Chelu M, Popa M, Ozon EA, Pandele Cusu J, Anastasescu M, Surdu VA. High-content aloe vera-based hydrogels: physicochemical and pharmaceutical properties. Polymers (Basel). 2023 Mar 3;15(5):1312. doi: 10.3390/polym15051312, PMID 36904552.
Steinbach JC, Fait F, Mayer HA, Kandelbauer A. Sol-gel-controlled size and morphology of mesoporous silica microspheres using hard templates. ACS Omega. 2023 Aug 22;8(33):30273-84. doi: 10.1021/acsomega.3c03098, PMID 37636943.
Gao J, Ma S, Wang B, Ma Z, Guo Y, Cheng F. Template-free facile preparation of mesoporous silica from fly ash for shaped composite phase change materials. J Clean Prod. 2023 Feb 20;384:135583. doi: 10.1016/j.jclepro.2022.135583.
Budiman A, Aulifa DL. Encapsulation of drug into mesoporous silica by solvent evaporation: a comparative study of drug characterization in mesoporous silica with various molecular weights. Heliyon. 2021;7(12):e08627. doi: 10.1016/j.heliyon.2021.e08627, PMID 35005278.
Pouroutzidou GK, Liverani L, Theocharidou A, Tsamesidis I, Lazaridou M, Christodoulou E. Synthesis and characterization of mesoporous Mg- and Sr-doped nanoparticles for moxifloxacin drug delivery in promising tissue engineering applications. Int J Mol Sci. 2021 Jan 8;22(2):577. doi: 10.3390/ijms22020577, PMID 33430065.
Galabova BB. Mesoporous silica nanoparticles: synthesis, functionalization drug loading and release a review. Trop J Pharm Res. 2022;20(5):1091-100. doi: 10.4314/tjpr.v20i5.30.
Trzeciak K, Chotera Ouda A, Bak Sypien II, Potrzebowski MJ. Mesoporous silica particles as drug delivery systems the state of the art in loading methods and the recent progress in analytical techniques for monitoring these processes. Pharmaceutics. 2021 Jul 5;13(7):950. doi: 10.3390/pharmaceutics13070950, PMID 34202794.
Sivolapov P, Myronyuk O, Baklan D. Synthesis of Stober silica nanoparticles in solvent environments with different Hansen solubility parameters. Inorg Chem Commun. 2022 Sep;143:109769. doi: 10.1016/j.inoche.2022.109769.
Rapalli VK, Banerjee S, Khan S, Jha PN, Gupta G, Dua K. QbD-driven formulation development and evaluation of topical hydrogel containing ketoconazole-loaded cubosomes. Mater Sci Eng C Mater Biol Appl. 2021;119:111548. doi: 10.1016/j.msec.2020.111548, PMID 33321612.
Solanki D, Vinchhi P, Patel MM. Design considerations formulation approaches and strategic advances of hydrogel dressings for chronic wound management. ACS Omega. 2023 Mar 7;8(9):8172-89. doi: 10.1021/acsomega.2c06806, PMID 36910992.
De La Torre C, Coll C, Ultimo A, Sancenon F, Martinez Manez R, Ruiz Hernandez E. In situ-forming gels loaded with stimuli-responsive gated mesoporous silica nanoparticles for local sustained drug delivery. Pharmaceutics. 2023 Apr 5;15(4):1071. doi: 10.3390/pharmaceutics15041071, PMID 37111556.
Usgodaarachchi L, Thambiliyagodage C, Wijesekera R, Bakker MG. Synthesis of mesoporous silica nanoparticles derived from rice husk and surface-controlled amine functionalization for efficient adsorption of methylene blue from aqueous solution. Current Research in Green and Sustainable Chemistry. 2021;4:100116. doi: 10.1016/j.crgsc.2021.100116.
Rizzi F, Castaldo R, Latronico T, Lasala P, Gentile G, Lavorgna M. High surface area mesoporous silica nanoparticles with tunable size in the sub-micrometer regime: insights on the size and porosity control mechanisms. Molecules. 2021 Jul 13;26(14):4247. doi: 10.3390/molecules26144247, PMID 34299522.
Lyu X, Wu X, Liu Y, Huang W, Lee B, Li T. Synthesis and characterization of mesoporous silica nanoparticles loaded with Pt catalysts. Catalysts. 2022 Jan 31;12(2):183. doi: 10.3390/catal12020183, PMID 35626443.
Guo M, Han J, Ran Q, Zhao M, Liu Y, Zhu G. Multifunctional integrated electrochemical sensing platform based on mesoporous silica nanoparticles decorated single-wall carbon nanotubes network for sensitive determination of gallic acid. Ceram Int. 2023 Dec 1;49(23):37549-60. doi: 10.1016/j.ceramint.2023.09.081.
Guo L, Ping J, Qin J, Yang M, Wu X, You M. A comprehensive study of drug loading in hollow mesoporous silica nanoparticles: impacting factors and loading efficiency. Nanomaterials (Basel). 2021 May 14;11(5):1293. doi: 10.3390/nano11051293, PMID 34069019.
Haidari H, Kopecki Z, Sutton AT, Garg S, Cowin AJ, Vasilev K. pH-responsive “smart” hydrogel for controlled delivery of silver nanoparticles to infected wounds. Antibiotics (Basel). 2021 Jan 11;10(1):49. doi: 10.3390/antibiotics10010049, PMID 33466534.
Herrada Manchon H, Fernandez MA, Aguilar E. Essential guide to hydrogel rheology in extrusion 3D printing: how to measure it and why it matters? Gels. 2023 Jul 7;9(7):517. doi: 10.3390/gels9070517, PMID 37504396.
Alexander I, Krasnyuk II. Dermatologic gels spreadability measuring methods comparative study. Int J Appl Pharm. 2022;14(1):164-8. doi: 10.22159/ijap.2022v14i1.43133.
Alsareii SA, Ahmad J, Umar A, Ahmad MZ, Shaikh IA. Enhanced in vivo wound healing efficacy of a novel piperine-containing bioactive hydrogel in excision wound rat model. Molecules. 2023 Jan 16;28(2):545. doi: 10.3390/molecules28020545, PMID 36677613.
Kurniati M, Nuraini I, Winarti C. Investigation of swelling ratio and textures analysis of acrylamide nanocellulose corncobs hydrogel. J Phys.: Conf Ser. 2021;1805(1):012036. doi: 10.1088/1742-6596/1805/1/012036.
Zhang K, Feng Q, Fang Z, Gu L, Bian L. Structurally dynamic hydrogels for biomedical applications: pursuing a fine balance between macroscopic stability and microscopic dynamics. Chem Rev. 2021;121(18):11149-93. doi: 10.1021/acs.chemrev.1c00071, PMID 34189903.
Ahmad F, Mushtaq B, Ahmad S, Rasheed A, Nawab Y. A novel composite of hemp fiber and alginate hydrogel for wound dressings. J Polym Environ. 2023 Jun;31(6):2294-305. doi: 10.1007/s10924-023-02756-7.
Abadi B, Goshtasbi N, Bolourian S, Tahsili J, Adeli Sardou M, Forootanfar H. Electrospun hybrid nanofibers: fabrication, characterization and biomedical applications. Front Bioeng Biotechnol. 2022 Oct 11;10:986975. doi: 10.3389/fbioe.2022.986975, PMID 36561047.
Pargaonkar SS, Ghorpade VS, Mali KK, Dias RJ, Havaldar VD, Kadam VJ. Hydrogel films of citric acid cross-linked hydroxypropyl methylcellulose/methylcellulose for hydrophilic drug delivery. Ind J Pharm Edu Res. 2023;57(3):718-27. doi: 10.5530/ijper.57.3.87.
Dai JM, Zhang XQ, Zhang JJ, Yang WJ, Yang XM, Bian H. Blockade of mIL-6R alleviated lipopolysaccharide-induced systemic inflammatory response syndrome by suppressing NF-κB-mediated CCl2 expression and inflammasome activation. Med. 2022;3(2):e132. doi: 10.1002/mco2.132, PMID 35548710.
Xue Y, Yang F, Wu L, Xia D, Liu Y. CeO2 nanoparticles to promote wound healing: a systematic review. Adv Healthc Mater. 2024;13(6):e2302858. doi: 10.1002/adhm.202302858, PMID 37947125.
Pinheiro RG, Pinheiro M, Neves AR. Nanotechnology innovations to enhance the therapeutic efficacy of quercetin. Nanomaterials (Basel). 2021 Oct 12;11(10):2658. doi: 10.3390/nano11102658, PMID 34685098.
Alfei S, Schito GC, Schito AM, Zuccari G. Reactive oxygen species (ROS)-mediated antibacterial oxidative therapies: available methods to generate ROS and a novel option proposal. Int J Mol Sci. 2024 Jul 2;25(13):7182. doi: 10.3390/ijms25137182, PMID 39000290.
Yang S, Song Y, Dong H, Hu Y, Jiang J, Chang S. Stimuli-actuated turn on theranostic nanoplatforms for imaging-guided antibacterial treatment. Small. 2023 Dec;19(52):e2304127. doi: 10.1002/smll.202304127, PMID 37649207.