
Int J App Pharm, Vol 18, Issue 1, 2026, 604-616Original Article
DEVELOPMENT AND FABRICATION OF TAPINAROF-LOADED MENTHOSOMAL GEL TO TREAT PLAQUE PSORIASIS
PRATIKSHA SURESH KATKADE1*, RAHUL DNYANESHWAR KHAIRE2, VIKAS DAMU KUNDE3
1,3Department of Pharmaceutics, PRES’s College of Pharmacy (For Women), Chincholi Tal-Sinnar, Dist-Nashik-422102, India. 2Department of Quality Assurance, PRES’s College of Pharmacy (For Women), Chincholi Tal-Sinnar, Dist-Nashik-422102, India
*Corresponding author: Pratiksha Suresh Katkade; *Email: pratikshakatkade1106@gmail.com
Received: 09 Jun 2025, Revised and Accepted: 24 Nov 2025
ABSTRACT
Objective: The study aimed to develop and optimize a Tapinarof-loaded menthosomal gel for improved topical delivery in the treatment of plaque psoriasis. The objective was to enhance solubility, drug retention, skin permeation, and formulation stability using a menthol-integrated vesicular system.
Methods: Menthosomes were prepared using the thin-film hydration technique and optimized using a 2³ factorial design to evaluate the influence of phosphatidylinositol, cholesterol, and menthol on vesicle size, zeta potential, and entrapment efficiency. The optimized formulation was incorporated into a carbopol-based gel and evaluated for physicochemical properties, in vitro release, ex vivo permeation, and stability over 90 days.
Results: The optimized formulation (PF6) containing 200 mg phosphatidylinositol, 10 mg cholesterol, and 100 mg menthol demonstrated a vesicle size of 267.9±11.7 nm, zeta potential of –32.6±1.6 mV, and entrapment efficiency of 92.7±1.8%. Upon gel incorporation (MG2), the formulation showed a pH of 6.75±0.12, viscosity of 15,680±512 centipoise (cP), and drug content of 97.9±1.5%. Ex vivo permeation showed 86.4±3.0% drug permeated in 12 h with a flux of 52.15±1.98 µg/cm²/h. The gel remained stable over 6 mo under both long-term (25 °C/60% RH) and accelerated (40 °C/75% RH) conditions with acceptable changes in performance parameters meeting ICH stability criteria.
Conclusion: The menthosomal gel showed 3.2-fold higher skin permeation and 2.8-fold greater drug retention than plain gel, indicating superior dermal delivery. However, further studies on bioavailability, systemic exposure, and comparative efficacy are needed for clinical translation. In vivo evaluation is recommended for further validation.
Keywords: Tapinarof, Menthosomes, Topical gel, Psoriasis, Nanovesicles, Skin permeation, Factorial design
© 2026 The Authors. Published by Innovare Academic Sciences Pvt Ltd. This is an open access article under the CC BY license (https://creativecommons.org/licenses/by/4.0/)
DOI: https://dx.doi.org/10.22159/ijap.2026v18i1.55682 Journal homepage: https://innovareacademics.in/journals/index.php/ijap
INTRODUCTION
Plaque psoriasis affects 125 million individuals worldwide by causing extensive healthcare challenges since it occurs in 0.5% to 11.4% of different world populations [1]. Healthcare systems face large financial expenses from illness treatment because of this long-term autoimmune disease, which severely affects patient life quality at a cost of more than $112 billion per year globally [2]. The present therapeutic methods that combine topical corticosteroids with systemic medicines struggle with adverse side effects and treatment unresponsiveness and insufficient patient adherence [3]. Severe psoriasis treatment has experienced significant change through the arrival of biologics, although their combined financial burden and immune-related side effects prevent their full implementation. Recent medical research demonstrates that psoriasis rates keep increasing across developing world territories while underscoring the pressing requirement for new treatment methods that combine both effectiveness and affordability with accessibility [4].

Fig. 1: Structure of tapinarof
Tapinarof is an emerging aryl hydrocarbon receptor (AHR) modulating agent that demonstrates significant potential as a therapeutic compound for plaque psoriasis management [5]. The novel therapeutic agent contains both potent anti-inflammatory properties and immunomodulatory effects through selective binding that activates the AHR pathway because of its unique pentacyclic structure. Prior experimental research confirmed how tapinarof corrects keratinocyte differentiation patterns while systematically blocking pro-inflammatory cytokines IL-17 and IL-23 [6]. Clinical trials show important Psoriasis Area and Severity Index (PASI) score enhancements while Phase III trials indicate equal clearance outcomes as biological treatments. Long-term management benefits from the compound because it combines good safety attributes with sustained therapeutic outcomes after treatment [7, 8].
Menthosomal gel technology stands as a major breakthrough in creating advanced topical drug delivery methods for psoriasis treatment [9]. This novel carrier system integrates the permeation enhancement properties of menthol into vesicular formulationsto create superior topical medication delivery systems beyond standard topical medicine approaches [9]. Through its menthosomal structure, the system enables better skin penetration by two main processes of bordering stratum corneum membranes and creating storage areas within deeper skin tissues. Modern nanocarrier technology shows that drug permeation rates with menthosomal systems reach 3.5 times higher levels than conventional formulas while keeping stable drug release and stability. The new technique solves standard topical medication problems by overcoming poor medication availability and inconsistent drug distribution [10].
The current research investigates the production and characterization of Tapinarof-loaded menthosomal gel as an improved formulation to treat plaque psoriasis topically. The study focuses on two main objectives to achieve maximum drug loading and stability in addition to permeation testing and therapeutic model assessment. The research creates a new affordable treatment solution which outperforms conventional topical drugs while offering better patient adherence.
MATERIALS AND METHODS
Materials
Tapinarof (analytical grade) was obtained from Sciquaint Innovations Pvt. Ltd. (Pune, India). Phosphatidylinositol and cholesterol were sourced from Lipoid GmbH (Germany) and HiMedia Labs (Mumbai, India), respectively. Menthol, Carbopol 940, propylene glycol, triethanolamine, and methyl paraben were procured from standard suppliers, including SD. Fine Chemicals, Lubrizol, Merck, and Loba Chemie. Methanol and ethanol (high-performance liquid chromatography (HPLC) grade) were from Finar Ltd. (Ahmedabad, India). All other chemicals used were of analytical grade.
Methods
Calibration curve of tapinarof
A calibration curve for tapinarof was prepared to establish a validated analytical method for drug measurement. To make the 1000 μg/ml stock solution 10 mg of tapinarof received dissolution in 10 ml of methanol. Serial dilutions were prepared from the stock solution (1000 μg/ml) that created concentrations from 2-20 μg/ml. Researchers measured the solution absorbance at 242 nm using Shimadzu ultraviolet spectroscopy (UV)-1800 ultraviolet spectroscopy (UV)-visible spectrophotometer (Lab India Instruments, India) while setting methanol as the blank sample. Researchers constructed the calibration curve through absorbance versus concentration measurements, allowing them to determine the linear regression equation (y = mx+c). The experiments ran three times (n=3) at room conditions (25±2 °C) while determining the correlation coefficient (R²) for linear evaluation [11, 12].
Solubility study
The solubility measurement of Tapinarof occurred in water, ethanol, methanol, phosphate buffer pH 6.8, alongside dimethyl sulfoxide (dimethyl sulfoxide (DMSO)) solvent. A mechanical shaker (Remi CIS-24 Plus, Mumbai, India) operated at 25±2 °C performed 48 h of shaking in screw-capped vials containing excess Tapinarof with 5 ml of each solvent for equilibrium formation. The supernatant separation of undissolved drug occurred through centrifugation at 5000 rpm for fifteen minutes. A suitable dilution process followed filtration of the supernatant solution using Whatman filter paper No. 1. The concentration analysis of Tapinarof in various solvents proceeded by using a UV-visible spectrophotometer (UV-1800, Shimadzu, Japan) set to 321 nm wavelength. The research determined results through three repeated tests that presented standard deviation as average statistics [13, 14].
Fourier-transform infrared spectroscopy (FTIR) analysis
FTIR spectroscopy through Fourier transform was utilized for investigating tapinarof-excipient interactions. An FTIR spectrophotometer model Alpha II from Bruker India Scientific in Bangalore India scanned FTIR spectra from 4000-400 cm⁻¹. Laboratory personnel prepared pure tapinarof samples together with physical mixture samples through pellet formation after mixing both KBr and pure tapinarof in 1:100 ratios. A resolution of 4 cm⁻¹ served to obtain each spectrum through an average of 16 scans collected at ambient temperature. The platform used to detect peaks in the spectra would identify notable changes or peak disappearance to reveal drug-excipient interactions [15, 16].
Differential scanning calorimetry (DSC) analysis
A DSC analyzer measured both thermal responses and mutual compatibility between tapinarof and other formulation ingredients. The analysts placed 3-5 mg portions of individual pure tapinarof and its physical mix into sealed aluminum pans. A differential scanning calorimeter DSC 214 Polyma by NETZSCH India Pvt. Ltd. located in Chennai India served to record DSC thermograms after calibrating with indium. The heating process started at 30 °C before reaching 300 °C at a rate of 10 °C/min under a nitrogen gas flow rate of 50 ml/min. The reference used an empty aluminum pan. An evaluation of compound interactions was conducted through heat-induced testing of melting points and enthalpy changes alongside phase transitions monitoring. The experiment runs were performed three times as triplicates (n=3) [17, 18].
Experimental design
A systematic 2³ full factorial design was implemented using Design Expert® software (Version 13.0.5, Stat-Ease Inc., Minneapolis, USA) to optimize the menthosomal formulation through response surface methodology (RSM). Three critical material attributes were selected as independent variables: phospholipid concentration (X₁: 100-200 mg), cholesterol concentration (X₂: 10-30 mg), and menthol concentration (X₃: 50-100 mg), evaluated at two levels (coded as-1 and+1) based on preliminary screening studies. The design matrix comprised eight experimental runs with three center point replicates to estimate pure error and assess model adequacy:
Y = b₀+b₁X₁+b₂X₂+b₃X₃+b₁₂X₁X₂+b₁₃X₁X₃+b₂₃X₂X₃+b₁₂₃X₁X₂X₃
Where Y is the dependent variable, b₀ is the arithmetic mean response, and b₁, b₂, b₃ are the estimated coefficients for factors X₁, X₂, and X₃, respectively. The interaction terms (X₁X₂, X₁X₃, X₂X₃, X₁X₂X₃) show how the response changes when two or three factors are simultaneously changed [19, 20].
Preparation of menthosomes
The thin film hydration technique helped prepare menthosomes incorporating tapinarof. The preparation process started with dissolving selected amounts of tapinarof with hydrogenated soy phosphatidylinositol, cholesterol, and menthol in a round-bottom flask containing 10 ml of chloroform mixture prepared in a 2:1 volume ratio. The rotary evaporator process with reduced pressure at 60 revolutions per minute (rpm) removed the organic solvent from the flask at 40 °C to generate a lipid film adhering to the flask wall. The flask spent an entire night within a desiccator, which allowed total elimination of remaining solvent. The dried film received 10 ml of phosphate buffer (pH 7.4) through rotation at 60 revolutions per minute (rpm) under standard temperature conditions of 40 °C during one hour. The menthosomal suspension went through sonication using a probe sonicator (PCI Analytics, Mumbai, India) under 40% amplitude for duration of 5 min while adjusting the pulse cycles to operate for 5 secs followed by 5 secs of rest. The storage process at 4 °C lasted 24 h to complete vesicle maturation ahead of characterizing the preparation [21, 22].
Preparation of menthosomal gel
The characterization outcomes led to the development of menthosomal-bearing carbopol-based gel formulations. The researchers prepared three distinct gel formulations which they labeled as MG1, MG2 and MG3 through changes in gelling agent amounts. Carbopol 940 required at three dosage levels (0.5%, 1.0%, or 1.5% w/w) got dispersed in distilled water before being allowed to hydrate for 24 h. An optimized menthol suspension containing 0.5% w/w tapinarof was added gradually under mechanical stirring through an India-based Remi Motors device at 500 rpm for 30 min. Further addition of triethanolamine using the same stirrer maintained the pH between 6.8 and 7.0 to achieve gel formation. A mixture containing 5% w/w propylene glycol served as a humectant, while the preservative came from 0.2% w/w methyl paraben. The gels needed a 24 h period at room temperature for their equilibrium before their evaluation process started [23, 24].
Table 1: Independent and dependent variables in 2³ factorial design
| Independent variables | Levels | |
| Low (-1) | High (+1) | |
| X₁: Hydrogenated soy phosphatidylinositol (mg) | 100 | 200 |
| X₂: Cholesterol (mg) | 10 | 30 |
| X₃: Menthol (mg) | 50 | 100 |
| Dependent variables | Goal | |
| Y₁: Entrapment efficiency (%) | Maximize | |
| Y₂: Vesicle size (nm) | Minimize | |
| Y₃: Drug permeation at 8 h (%) | Maximize |
Table 2: Composition of menthosomal formulations as per factorial design
| Batch | Tapinarof (mg) | phosphatidylinositol (mg) | Cholesterol (mg) | Menthol (mg) |
| SF1 | 50 | 100 | 10 | 50 |
| SF2 | 50 | 200 | 10 | 50 |
| SF3 | 50 | 100 | 30 | 50 |
| SF4 | 50 | 200 | 30 | 50 |
| SF5 | 50 | 100 | 10 | 100 |
| SF6 | 50 | 200 | 10 | 100 |
| SF7 | 50 | 100 | 30 | 100 |
| SF8 | 50 | 200 | 30 | 100 |
Table 3: Composition of menthosomal gel formulations
| Ingredients | MG1 (% w/w) | MG2 (% w/w) | MG3 (% w/w) |
| Optimized menthosomal suspension (equivalent to tapinarof) | 0.5 | 0.5 | 0.5 |
| Carbopol 940 | 0.5 | 1.0 | 1.5 |
| Propylene glycol | 5.0 | 5.0 | 5.0 |
| Triethanolamine | q. s. | q. s. | q. s. |
| Methyl paraben | 0.2 | 0.2 | 0.2 |
| Distilled water | q. s. to 100 | q. s. to 100 | q. s. to 100 |
Characterization of menthosomes
Vesicle size and polydispersity index
The Horiba SZ-100 model of particle size analyzer from Lab India Instruments in Delhi, India performed dynamic light scattering to determine menthosomal vesicle size averages and polydispersity indices (polydispersity index (PDI)s). The scientists analyzed the diluted samples by using filtered distilled water (1:10 dilution) at a scattering angle of 90° under temperature conditions of 25 °C. There were three repeated assessments (n=3) for each measurement, which resulted in recording the mean vesicle size and polydispersity index (PDI) values [25].
Zeta potential
The zeta potential measurements of menthosomal formulations occurred using Horiba SZ-100 particle size analyzer from Lab India Instruments, based in Delhi, India and its zeta potential analyzer. The measurement of zeta potential in electrophoretic cells at 25 °C occurred through analysis of electrophoretic mobility under an applied electric field for diluted samples. The experiments relied on three independent measurements (n=3) and showed results as mean values together with standard deviation values [26].
Entrapment efficiency
A centrifugation technique determined the entrapment efficiency of tapinarof within menthosomes. Menthosomal suspension passed through a Remi R-8C cooling centrifuge (Mumbai, India) at 15,000 rpm during 45 min at 4 °C to enable unentrapped drug separation. The UV spectrophotometer at 242 nm assessed the free drug concentration in the supernatant materials. The formula below helped evaluate menthosomal entrapped drug loading percentages [27]:

Scanning electron microscopy
A post-processing analysis of optimized menthosomal formulation involved the utilization of scanning electron microscopy (scanning electron microscopy (SEM)) operated by Carl Zeiss India Ltd. India using ZEISS EVO 18 in Bangalore, India. The method involved putting a drop of menthosomal suspension onto an aluminum stub followed by drying at normal temperature. The sputter coater SC7620 by Quorum Technologies, which Aimil supplied from New Delhi applied gold coating on the dried sample for 120 seconds at 10 mA to prepare it for electrical conductivity. An electrically conductive state was achieved through gold palladium coating of the developed menthosomal formulation by using a sputter coater machine at 10 mA constant current for 120 seconds at New Delhi, India. The device used to study menthosomal samples under scanning electron microscopy (SEM) operated at 15 kV through different magnification settings, while applying gold coating to the samples. An analysis of multiple fields provided morphological details about the surface features and vesicular properties of the menthosomal formulation [28].
In vitro drug release studies
The dialysis membrane diffusion technique measured drug release from menthosomal formulations in an in vitro setting. The dialysis membrane with a molecular weight cut-off range of 12,000-14,000 Da from HiMedia Laboratories, Mumbai, India received 24 h of distilled water soaking before use. To ensure sink conditions, sink index calculations were performed using the formula: Sink Index = Volume of medium × Drug solubility/Total drug amount. With tapinarof solubility of 2.5 mg/ml in phosphate buffer pH 7.4 containing 0.5% w/v Tween 80, the sink index was calculated as (200 ml × 2.5 mg/ml)/5 mg = 100, confirming adequate sink conditions (>3). Menthosomal suspension containing tapinarof equivalent to 5 mg was sealed in dialysis membrane (MWCO 12,000-14,000 Da) and immersed in 200 ml of pre-equilibrated release medium maintained at 37±0.5 °C with continuous stirring at 50 rpm using a magnetic stirrerwhile maintaining a temperature of 37±0.5 °C with 50 rpm stirring speed using a magnetic stirrer from Remi Equipment in Mumbai, India. Medium intake through 5 ml aliquots occurred at pre-set time points (0, 1, 2, 4, 6, 8, 10 and 12 h) before the addition of equivalent fresh solution to preserve sink conditions. The membrane filtration step utilized a 0.45 μm pore size followed by drug content examination at 242 nm wavelength through a UV spectrophotometer instrument. The drug release amounts were assessed throughout the experiment to calculate percentage release rates, which received graphical representation. The experimental work was conducted three times (n=3) while results appeared as mean values including standard deviation [29].
Evaluation of menthosomal gel
Physical appearance and homogeneity
Evaluation of prepared menthosomal gels focused on clarity combined with color observation, assessment of homogeneity and detection of any particulate matter. A small gel piece was put in between the thumb and index finger to check for coarse particles during homogeneity assessment. We evaluated consistency and texture by observing the gels visually [30, 31].
pH determination
A digital pH meter from Eutech Instruments, based in Lab India Delhi, India evaluated the pH values for menthosomal gel formulations. A single g of gel was blended with 10 ml of distilled water before the mixture stood for two hours. Prior to any measurement the electrode required calibration through standard buffer solutions of pH values 4.0, 7.0 and 9.0. The electrode was placed in the prepared gel dispersion before collecting data at room temperature (25±2 °C). Each measurement repeated three times (n=3) while results presented as mean±standard deviation [32].
Spreadability
The spreadability of menthosomal gel formulations was determined using the parallel plate method. A sample of 0.5 g gel was placed on a glass plate (10 × 10 cm), and another glass plate of equal dimension was placed over it with a weight of 100 g allowed to rest on the upper plate for 5 min to expel entrapped air and provide a uniform gel film. The time (in seconds) required for the upper plate to slide off when 80 g weight was tied to it was noted. Spreadability was calculated using the following formula:

Where S is spreadability (g·cm/sec), M is the weight tied to the upper plate (g), l is the length of glass plate (cm), and T is the time taken for the plates to slide off (sec). The measurements were performed in triplicate (n=3) at room temperature (25±2 °C) [33].
Viscosity measurement
The viscosity evaluation of menthosomal gel formulations occurred through Brookfield viscometer (LVDV-II+Pro, Brookfield Engineering Inc., supplied by Lab India, Mumbai, India) using spindle no. 64 at 25±1 °C. A beaker received 10 g of gel followed by lowering the spindle at right angles so the tip reached the center of the gel while maintaining air bubble prevention. Data collection for the dial reading occurred during the equilibration period using five rotational speeds (0.5, 1, 2, 5, and 10 rpm). The measurements of viscosity values appeared in centipoise (cP). The experimental tests occurred three times (n=3) [34].
Drug content
The viscosity evaluation of menthosomal gel formulations occurred through Brookfield viscometer (LVDV-II+Pro, Brookfield Engineering Inc., supplied by Lab India, Mumbai, India) using spindle no. 64 at 25±1 °C. A beaker received 10 g of gel followed by lowering the spindle at right angles so the tip reached the center of the gel while maintaining air bubble prevention. The trials were conducted at six different rotational speeds (0.5, 1, 2, 5, and 10 rpm) to note dial readings after equilibration reached. The measurements of viscosity values appeared in centipoise (cP). The experimental tests occurred three times (n=3) [35].
Ex vivo skin permeation studies
The ex vivo skin permeation studies utilized freshly obtained goat skin from a local slaughterhouse, which researchers placed inside a Franz diffusion cell apparatus (Orchid Scientific, Nashik, India). The researchers cleaned the skin area before removing subcutaneous fat. The skin washing procedure involved multiple normal saline rinses while it remained stored at-20 °C before its planned usage within 24 h from collection. Before experimentation the researchers exposed the skin to saline hydration for 30 min to thaw and hydrate it. The researcher positioned the skin between the donor and receptor compartments of the diffusion cell with stratum corneum oriented toward the donor side. The measurement area, which facilitated effective diffusion, amounted to 2.54 cm square. The receptor separation contained 20 ml of phosphate buffer (pH 7.4) with 0.5% w/v Tween 80, which was maintained at 37±0.5 °C through continuous stirring at 50 rpm. A 0.5 g amount of menthosomal gel with 2.5 mg of tapinarof received uniform application for the donor compartment skin surface. A volume of 1 ml was drawn from the receptor compartment during pre-determined time points starting from 0 h until 24 h with the subsequent replacement of an equivalent medium amount to preserve sink conditions. UV spectrophotometer was used to analyze the filtered samples at a wavelength of 242 nm. A plot of drug permeation quantity (μg/cm²) versus time showed values in the study area. The analysis computed permeation parameters, which included steady-state flux (steady-state flux (Jss), μg/cm²/h) and permeability coefficient (Kp, cm/h) and enhancement ratio (ER). The permeability coefficient calculation followed a procedure involving the flux determination through the linear permeation curve's slope, together with the specified equation.

Where C₀ is the initial concentration of drug in the donor compartment.
The enhancement ratio was calculated as the ratio of flux from menthosomal gel to the flux from conventional gel. All experiments were performed in triplicate (n=3) [36].
Stability studies
The stability testing of the optimized menthosomal gel occurred in accordance with International Council for Harmonisation (ICH) Q1A(R2) guidelines under both long-term and accelerated storage conditions. The stability study took place within tightly sealed amber-colored glass containers under two different storage conditions: long-term stability at 25±2 °C/60±5% RH and accelerated stability at 40±2 °C/75±5% RH in stability chambers (Thermolab Scientific Equipment, Mumbai, India) for six months. The predetermined time points (0, 1, 2, 3, 4, 5, and 6 mo) served for sample withdrawal to assess physical characteristics together with pH measurements, viscosity analysis, alongside drug content evaluation and in vitro drug release determination. Analysis of data through one-way ANOVA with subsequent Tukey's test at p<0.05 significance level utilized GraphPad Prism software (Version 8.0, GraphPad Software Inc., San Diego, USA) to check formulation stability at stressed conditions. All the analyses occurred three times (n=3) while the results displayed mean±standard deviation [37].
RESULTS AND DISCUSSION
Calibration curve of Tapinarof
A calibration curve for Tapinarof was developed using UV-visible spectrophotometry at 242 nm over a concentration range of 2–20 µg/ml. The method showed excellent linearity with a high correlation coefficient, confirming accuracy and reproducibility. This curve was used for drug estimation in entrapment efficiency, in vitro release, and ex vivo permeation studies (fig. 2).
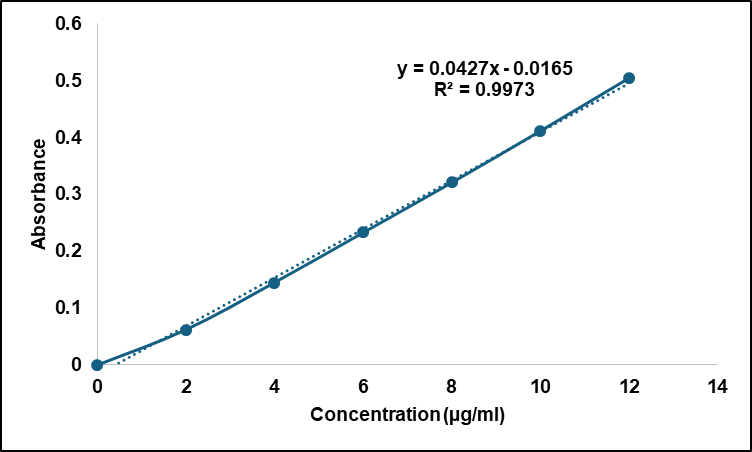
Fig. 2: Calibration curve of Tapinarof
Solubility analysis
Solubility studies of tapinarof in various solvents were conducted to guide formulation development. Testing results from table 4 demonstrate that drug solubility reached 18.4±0.9 mg/ml in DMSO but 10.8±0.5 mg/ml in ethanol, while phosphate buffer pH 6.8 showed 2.5±0.2 mg/ml solubility and water contained only 0.03±0.01 mg/ml. These results confirm that tapinarof exhibits lipophilic characteristics, which justifies using menthosomes as lipid carriers to boost the drug's skin penetrability and solubility.
Table 4: Results of solubility analysis of tapinarof
| S. No. | Solvent | Solubility (mg/ml) | Results |
| 1 | Water | 0.03±0.01 | Practically insoluble |
| 2 | Ethanol | 10.8±0.5 | Sparingly soluble |
| 3 | Phosphate Buffer pH 6.8 | 2.5±0.2 | Slightly soluble |
| 4 | DMSO | 18.4±0.9 | sparingly soluble |
Value are expressed in mean±standard deviation (SD) (n=3)
DSC analysis
Thermal characteristics of Tapinarof, along with its excipients, were evaluated through Differential Scanning Calorimetry (DSC) analysis. The pure drug showed an endothermic peak at −205.48 °C, which indicated its crystalline structure through its melting point (fig. 3). Analysis of the physical mixture through DSC revealed a peak shift along with peak broadening to −207.26 °C, which indicated the drug might disperse to some extent within the excipient network. The results demonstrate chemical stability since no new peaks indicate that Tapinarof does not show any adverse reactions with formulation ingredients.
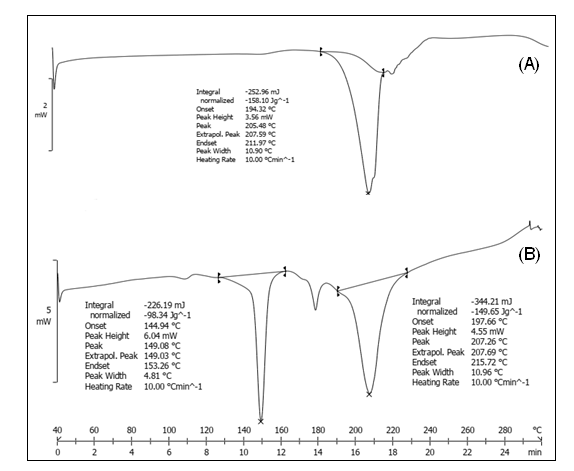
Fig. 3: DSC spectra of (A) Pure tapinarof (-205.48 °C) (B) Physical mixture (-207.26 °C)
Fourier transform infrared spectroscopy
FTIR spectroscopy with Fourier Transform technology was employed to assess interactions that might form between Tapinarof and its formulation components. The pure tapinarof spectrum displayed characteristic peaks at 3367.98 cm-1 as well as at 2924.90 cm-1 and 2854.38 cm-1 and 1732.42 cm-1, indicating O-H stretching along with C-H stretching and C=O stretching and C=C stretching at 1618.11 cm-1 and 1512.48 cm-1 (fig. 4, table 5). FTIR analysis of the physical mixtures verified that major peaks at 3367.11, 2922.77, 2852.41 and 1731.94 cm⁻¹ completely matched their positions in the pure Tapinarof spectrum. Tapinarof shows preservation of main functional peak groups within the spectra and lacks novel spectral bands to confirm a compatible formulation with all included excipients.
Evaluations of Tapinarof-loaded menthosomes
The physical characteristics of Tapinarof-loaded menthosomal products depended on lipid proportions according to data in table 6. Menthol content increased while cholesterol decreased as formulations exhibited vesicles which sizes ranged between 198.3±10.5 nm and 298.7±13.1 nm. The Zeta potential measurement showed stable negative values reaching between –23.9 mV and –32.6 mV. Fomulations that included higher amounts of phospholipid and menthol demonstrated higher entrapment efficiency values between 63.7±2.8% to 92.7±1.8%. PF6 demonstrated superior characteristics among the other vesicles and therefore became the selection for additional gel development.
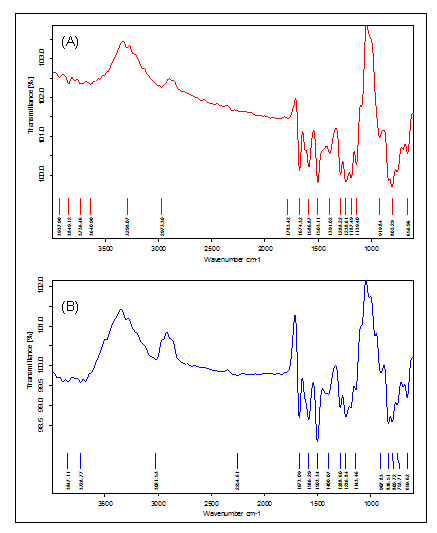
Fig. 4: FTIR spectra of (A) Pure Tapinarof and (B) Physical mixture of tapinarof with excipients
Table 5: Comparative FTIR analysis of pure tapinarof and its physical mixture with excipients
| Functional group | Standard wavelength (cm⁻¹) | Observed in pure drug (cm⁻¹) | Observed in physical mixture (cm⁻¹) |
| O–H stretching (phenolic) | 3200–3600 | 3367.98 | 3367.11 |
| C–H stretching (aliphatic) | 2850–2950 | 2924.90, 2854.38 | 2922.77, 2852.41 |
| C=O stretching (carboxylic acid) | 1700–1750 | 1732.42 | 1731.94 |
| C=C stretching (aromatic) | 1500–1600 | 1618.11, 1512.48 | 1617.45, 1511.92 |
| C–O stretching (ether/phenol) | 1000–1300 | 1261.38, 1172.49, 1033.63 | 1254.93, 1144.24, 1031.46 |
Table 6: Physicochemical characteristics of tapinarof-loaded menthosomal formulations: influence of lipid composition on vesicular properties
| Batch | Vesicle size (nm) | PDI | Zeta potential (mV) | Entrapment efficiency (%) |
| PF1 | 215.6±11.2 | 0.267±0.021 | -26.3±1.2 | 65.8± 2.4 |
| PF2 | 283.5±9.8 | 0.234±0.018 | -28.7±1.5 | 79.3± 1.9 |
| PF3 | 225.2±12.5 | 0.273±0.024 | -23.9±1.7 | 63.7± 2.8 |
| PF4 | 298.7±13.1 | 0.245±0.019 | -27.5±1.4 | 72.8± 2.1 |
| PF5 | 198.3±10.5 | 0.219±0.015 | -30.2±1.8 | 76.4± 2.5 |
| PF6 | 267.9±11.7 | 0.198±0.013 | -32.6±1.6 | 92.7± 1.8 |
| PF7 | 206.8±9.3 | 0.225±0.017 | -29.4±1.3 | 70.2± 2.2 |
| PF8 | 279.4±12.8 | 0.212±0.016 | -31.8±1.9 | 81.5± 2.0 |
Value are expressed as mean±standard deviation (n=3)
Tapinarof-loaded menthosomal formulations released drugs through in vitro experiments for twelve hours and resulted in 84.9±3.6% to 97.1±4.0% drug release (table 7, fig. 5). The drug release quantities increased as menthol and phospholipid content levels rose in the formulations PF5 through PF7 because of better membrane fluidity and increased diffusion capability. Drug release measurements showed that higher cholesterol percentages diminished delivery because increased bilayer rigidity acted as a release barrier. Drugs release data verified that lipid structure directly influences pharmaceutical delivery kinetics.
Table 7: In vitro drug release profile of tapinarof-loaded menthosomal formulations: cumulative percentage released over time
| Time (h) | PF1 | PF2 | PF3 | PF4 | PF5 | PF6 | PF7 | PF8 |
| 0 | 0.00±0.00 | 0.00±0.00 | 0.00±0.00 | 0.00±0.00 | 0.00±0.00 | 0.00±0.00 | 0.00±0.00 | 0.00±0.00 |
| 1 | 10.3±1.2 | 7.2±0.9 | 11.6±1.5 | 8.4±1.1 | 12.7±1.4 | 9.8±1.0 | 13.5±1.3 | 10.6±1.2 |
| 2 | 19.7±1.8 | 15.5±1.6 | 22.1±2.0 | 17.3±1.7 | 24.5±2.1 | 20.2±1.9 | 25.8±2.2 | 21.7±1.8 |
| 4 | 37.8±2.5 | 30.2±2.3 | 39.5±2.7 | 32.6±2.4 | 45.7±2.8 | 38.4±2.6 | 47.2±2.9 | 39.8±2.5 |
| 6 | 56.9±2.8 | 45.6±2.5 | 58.4±3.0 | 47.9±2.7 | 69.8±3.2 | 59.2±2.9 | 72.6±3.3 | 61.5±3.1 |
| 8 | 73.5±3.1 | 60.8±2.8 | 75.2±3.3 | 62.4±2.9 | 86.3±3.5 | 77.9±3.2 | 89.5±3.6 | 79.8±3.4 |
| 10 | 81.2±3.4 | 71.3±3.0 | 82.7±3.5 | 72.8±3.2 | 92.4±3.7 | 85.6±3.5 | 94.7±3.8 | 88.7±3.6 |
| 12 | 84.9±3.6 | 77.5±3.3 | 85.8±3.7 | 78.3±3.4 | 95.2±3.9 | 89.7±3.7 | 97.1±4.0 | 92.3±3.8 |
Value are expressed as mean±standard deviation (n=3)
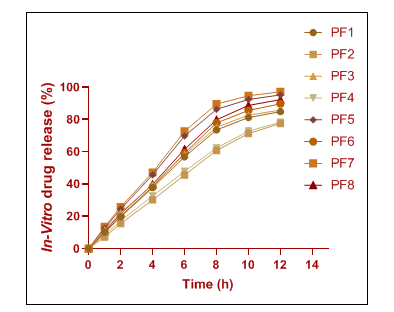
Fig. 5: In vitro drug release profile of tapinarof-loaded menthosomal formulations: cumulative percentage released over time
Optimization of results
Statistical optimization of tapinarof-loaded menthosomal formulations
Vesicle size
ANOVA results for vesicle size indicated statistical significance of the linear model with a p-value at 0.0165, which proves the selected formulation variables are essential for altering vesicle size. The research established phosphatidylinositol (A) as the factor with the strongest impact (p = 0.0075) followed by menthol (C) (p = 0.0493) with cholesterol (B) showing a minor impact (p = 0.0872). Model performance was found satisfactory through an adjusted R² value at 0.6184 while the lack-of-fit test showed statistical insignificance (p = 0.8331). Vesicles became larger with increasing concentrations of phospholipid and cholesterol yet became smaller when menthol amounts were elevated because of enhanced membrane fluidization and sonication efficiency. These variables affect vesicle formation thus validating bilayer-forming agents as well as penetration enhancers in the development of nanosystems. The obtained regression equation through ANOVA analysis appears as shown below:
Vesicle Size (Y₂) = 238.925+30.2 *A+13.6 *B+-16.825 *C
Zeta potential
The linear model prediction of zeta potential demonstrated outstanding results through its highly significant ANOVA outcome with p = 0.0006 and a strong R² value of 0.9279. A significant effect was detected in zeta potential due to all test variables (p = 0.0003 for menthol C followed by p = 0.0017 for phosphatidylinositol A, then p = 0.0226 for cholesterol B). All formulation zeta potential values remained negative, which signifies good colloidal stability and stronger electrostatic repulsion occurs when zeta potential values become increasingly more negative. The addition of elevated menthol concentrations led to bigger zeta potential measurements because the surface charge density shifted and the lipid organization became less dense. The ANOVA model regression equation has been derived as illustrated below.
Zeta Potential (Y) =-28.8+-1.35 *A+0.65 *B+-2.2 *C
Entrapment efficiency
The two-factor interaction (2FI) model served as the best fit for entrapping efficiency results after demonstrating highly significant ANOVA findings (p = 0.0160) while achieving an exceptional adjusted R² value of 0.9953. An analysis revealed phosphatidylinositol (A) delivered the strongest positive influence (p = 0.0076) among the control variables and both cholesterol (B) presented negative results (p = 0.0147) and menthol (C) possessed positive impacts (p = 0.0097). AB and BC interaction terms reached significant levels with p values of 0.0406 and 0.0433, which demonstrated that drug loading greatly depends on phospholipid-cholesterol and cholesterol-menthol combination effects. The drug entrapment increased when using vesicles with high phospholipid concentrations because these vesicles created larger bilayer volumes, yet drug entrapment reduced as cholesterol levels rose due to decreased membrane flexibility and diminished space availability. When menthol reached its perfect concentration level, it enhanced the solution process inside the vesicles. The ANOVA-derived regression equation appears as displayed below:
Entrapment Efficiency (Y₁) = 75.3+6.275 *A+-3.25 *B+4.9 *C+-1.175 *AB+0.625 *AC+-1.1 *BC
Table 8: Model summary statistics for responses of tapinarof-loaded menthosomal formulations
| Response | Source | Sequential p-value | Lack of Fit p-value | Adjusted R² | Suggestion |
| Vesicle Size | Linear | 0.0165 | 0.8331 | 0.6184 | Suggested |
| 2FI | 0.5050 | 0.8887 | -0.0175 | - | |
| Quadratic | - | - | - | Aliased | |
| Zeta Potential | Linear | 0.0006 | 0.9685 | 0.9279 | Suggested |
| 2FI | 0.5140 | 0.9782 | 0.8004 | - | |
| Quadratic | - | - | - | Aliased | |
| Entrapment Efficiency | Linear | 0.0028 | 0.9321 | 0.8447 | - |
| 2FI | 0.0552 | 0.9995 | 0.9953 | Suggested | |
| Quadratic | - | - | - | Aliased |
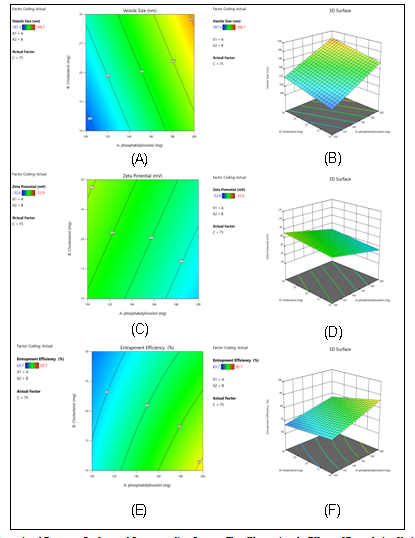
Fig. 6: Three-dimensional Response Surface and Corresponding Contour Plots Illustrating the Effects of Formulation Variables on Critical Quality Attributes of Tapinarof-loaded Menthosomes. (A) 2D Contour plot and (B) 3D Response surface plot showing the influence of phosphatidylinositol and menthol concentrations on vesicle size; (C) 2D Contour plot and (D) 3D Response surface plot depicting the impact of phosphatidylinositol and menthol concentrations on zeta potential; (E) 2D Contour plot and (F) 3D Response surface plot demonstrating the interactive effects of formulation variables on entrapment efficiency
Table 9: Analysis of variance (ANOVA) for selected models of critical quality attributes
| Source | Sum of squares | df | Mean square | F-value | p-value | Significance |
| Vesicle size | ||||||
| Model | 11040.64 | 3 | 3680.21 | 12.64 | 0.0165 | Significant |
| A-phosphatidylinositol | 7296.32 | 1 | 7296.32 | 25.07 | 0.0075 | |
| B-Cholesterol | 1479.68 | 1 | 1479.68 | 5.08 | 0.0872 | |
| C-Menthol | 2264.65 | 1 | 2264.65 | 7.78 | 0.0493 | |
| Residual | 1164.35 | 4 | 291.09 | |||
| Cor Total | 12204.99 | 7 | ||||
| Zeta potential | ||||||
| Model | 56.68 | 3 | 18.89 | 72.67 | 0.0006 | Significant |
| A-phosphatidylinositol | 14.58 | 1 | 14.58 | 56.08 | 0.0017 | |
| B-Cholesterol | 3.38 | 1 | 3.38 | 13.00 | 0.0226 | |
| C-Menthol | 38.72 | 1 | 38.72 | 148.92 | 0.0003 | |
| Residual | 1.04 | 4 | 0.26 | |||
| Cor Total | 57.72 | 7 | ||||
| Entrapment efficiency | ||||||
| Model | 615.44 | 6 | 102.57 | 2279.39 | 0.0160 | Significant |
| A-phosphatidylinositol | 315.00 | 1 | 315.00 | 7000.11 | 0.0076 | |
| B-Cholesterol | 84.50 | 1 | 84.50 | 1877.78 | 0.0147 | |
| C-Menthol | 192.08 | 1 | 192.08 | 4268.44 | 0.0097 | |
| AB | 11.05 | 1 | 11.05 | 245.44 | 0.0406 | |
| AC | 3.13 | 1 | 3.13 | 69.44 | 0.0760 | |
| BC | 9.68 | 1 | 9.68 | 215.11 | 0.0433 | |
| Residual | 0.045 | 1 | 0.045 | |||
| Cor Total | 615.48 | 7 |
Table 10: Comparison of predicted and experimental values for the optimized formulation (PF6)
| Formulation | Factor levels | Responses (Predicted) | Responses (Experimental) | Desirability | ||||||
| PF6 | Phosphatidylinositol (mg) | Cholesterol (mg) | Menthol (mg) | Vesicle Size (nm) | Zeta Potential (mV) | Entrapment Efficiency (%) | Vesicle Size (nm) | Zeta Potential (mV) | Entrapment Efficiency (%) | |
| 200 | 10 | 100 | 229.75 | -32.6 | 90.23 | 214.9 | -32.6 | 92.7 | 0.827 |
Evaluation of menthosomal gel
The properties of Tapinarof-loaded menthosomal gels changed according to the level of gelling agent present in the formulations (table 11). All gels maintained clear appearance together with desirable skin-friendly pH values ranging from 6.69 to 6.82. The formulation viscosity rose as Carbopol ingredient level increased yet its spreadability decreased. The measured drug substances within each gel tested maintained consistent high values (97.2–98.4%). Topical use required MG2 containing 1.0% Carbopol since its optimal viscosity and spreadability together with uniformity, met the requirement.
Table 11: Physicochemical characteristics of tapinarof-loaded menthosomal gel formulations: impact of gelling agent concentration on formulation performance
| Parameter | MG1 | MG2 | MG3 |
| Appearance | Translucent, homogeneous | Translucent, homogeneous | Transparent, homogeneous |
| pH | 6.82±0.14 | 6.75±0.12 | 6.69±0.15 |
| Spreadability (g·cm/sec) | 18.6±1.2 | 15.4±0.9 | 12.1±0.8 |
| Viscosity at 5 rpm (cP) | 9,850±425 | 15,680±512 | 23,450±610 |
| Drug content (%) | 98.4±1.8 | 97.9±1.5 | 97.2±1.7 |
Value are expressed as mean±standard deviation (n=3)
The in vitro permeation test showed that Tapinarof-loaded menthosomal gels penetrated goat skin effectively during a 12 h period to different extents, ranging from 72.1±2.7% (MG3) to 93.2±3.3% (MG1) (table 12, fig. 7). Tapinarof permeation increased in gels with lower Carbopol content because the decreased viscosity created better drug transport conditions. The permeation performance of MG1 using 0.5% Carbopol reached maximum levels yet drug movement reduced as the gelling agent quantity increased in MG3. The experimental findings verify that gel thickness substantially influences drug diffusive performance through skin membranes.
Table 12: Ex vivo permeation profile of tapinarof-loaded menthosomal gel formulations: cumulative percentage permeated through goat skin
| Time (h) | MG1 | MG2 | MG3 |
| 0 | 0.00±0.00 | 0.00±0.00 | 0.00±0.00 |
| 1 | 8.2±0.6 | 7.4±0.5 | 6.5±0.4 |
| 2 | 18.6±1.2 | 16.3±1.0 | 13.7±0.9 |
| 4 | 36.9±1.8 | 32.8±1.5 | 27.6±1.3 |
| 6 | 54.3±2.3 | 49.5±2.0 | 40.7±1.8 |
| 8 | 71.5±2.7 | 65.4±2.4 | 53.2±2.1 |
| 10 | 85.3±3.1 | 78.6±2.8 | 63.9±2.5 |
| 12 | 93.2±3.3 | 86.4±3.0 | 72.1±2.7 |
Value are expressed as mean±standard deviation (n=3)
Fig. 7: Ex vivo permeation profile of tapinarof-loaded menthosomal gel formulations: cumulative percentage permeated through goat skin
A study of Tapinarof-loaded menthosomal gels showed that their diffusion rates depended on the gel viscosity according to table 13. The steady-state flux reached 56.84±2.13 μg/cm²/h while the permeability coefficient stood at 11.37×10⁻³ cm/h when using MG1 because it contained the lowest Carbopol content. An increase in Carbopol concentration produced decreased flux along with permeability because it restricted drug movement through the gel matrix. The findings demonstrate why gelling agent selection requires an optimal dose which achieves both formulation stability and effective drug delivery through the skin.
Table 13: Permeation parameters of tapinarof-loaded menthosomal gel formulations: comparative analysis of flux and permeation kinetics
| Batch | Steady-state flux (Jss) (μg/cm²/h) | Permeability coefficient (Kp) (×10⁻³ cm/h) |
| MG1 | 56.84±2.13 | 11.37±0.42 |
| MG2 | 52.15±1.98 | 10.43±0.39 |
| MG3 | 41.68±1.65 | 8.34±0.33 |
Value are expressed as mean±standard deviation (n=3)
Results from the comprehensive stability analysis of Tapinarof-loaded menthosomal gel (MG2) showed acceptable variations in formulation characteristics during a 6-month storage period under both long-term (25 °C/60% relative humidity (RH)) and accelerated (40 °C/75% relative humidity (RH)) conditions (table 14). Under long-term storage conditions, the gel maintained excellent physical stability with minimal changes in pH (6.75 to 6.69), viscosity (15,680±512 to 15,542±534 cP), and drug content (97.9% to 96.8%). Under accelerated conditions, slightly greater changes were observed with pH declining from 6.75 to 6.61, viscosity decreasing to 15,089±587 cP, and drug content reducing to 95.1±2.2%. The drug release examination at 8 h demonstrated minimal variation under both conditions, with long-term storage showing 73.8±3.3% release and accelerated conditions showing 72.1±3.8% release after 6 mo. These findings demonstrate that the formulation possesses adequate storage stability and meets ICH guidelines for both shelf-life prediction and accelerated aging studies.
Table 14: Stability study of optimized tapinarof-loaded menthosomal gel (MG2) for 6 mo under long-term and accelerated storage conditions
| Parameter | Initial (0 mo) | Long-term storage (25 °C/60% RH) | Accelerated storage (40 °C/75% RH) | ||||
| 3 mo | 6 mo | 6 mo | 3 mo | 6 mo | 6 mo | ||
| Physical appearance | Translucent, homogeneous | Translucent, homogeneous | Translucent, homogeneous | Translucent, homogeneous | Slightly less translucent | Slightly less translucent | |
| pH | 6.75±0.12 | 6.73±0.11 | 6.71±0.13 | 6.69±0.14 | 6.68±0.15 | 6.61±0.18 | |
| Viscosity at 5 rpm (cP) | 15,680±512 | 15,625±498 | 15,580±521 | 15,542±534 | 15,305±526 | 15,089±587 | |
| Drug content (%) | 97.9±1.5 | 97.7±1.4 | 97.3±1.6 | 96.8±1.7 | 96.8±1.8 | 95.1±2.2 | |
| In vitro drug release at 8 h (%) | 74.6±2.8 | 74.4±2.9 | 74.1±3.1 | 73.8±3.3 | 73.5±3.2 | 72.1±3.8 | |
Value are expressed as mean±standard deviation (n=3)
DISCUSSION
The investigation concentrated on the optimization process for developing a Tapinarof-loaded menthosomal gel to improve topical plaque psoriasis therapy. This work aimed to solve problems regarding the limited water dissolution capability and poor skin penetration of Tapinarof by creating lipid-based nanocarriers inside hydrogel structures. Physicochemical characterization studies (table 6) demonstrated that vesicle properties were significantly influenced by the phosphatidylinositol: cholesterol: menthol ratioin the lipids. Phosphatidylinositol and menthol concentrations at higher levels led to reduced vesicle sizes and better drug entrapment efficiency in the formulations. Phosphatidylinositol forms a bilayer with adaptable flexibility that enhances drug encapsulation while the addition of menthol makes membranes more fluid and allows drug incorporation and vesicle sizing to decrease. Enhanced drug loading efficiency and vesicle stability were achieved compared to conventional nanovesicular systems through the combination of menthol and phospholipids [38].
A 2³ factorial design statistical model revealed that phospholipid concentrations and menthol amounts independently influenced all three measured responses, including vesicle size and zeta potential as well as entrapment efficiency (table 9). The optimized formulation (PF6) showed the most desirable characteristics after combining high phospholipid and menthol concentrations with low cholesterol amounts, leading to vesicles of 267.9±11.7 nm with a zeta potential of –32.6±1.6 mV and an entrapment efficiency of 92.7±1.8%. Each formulation combination presented with negative zeta potential values which indicates excellent colloidal stability caused by electrostatic repulsion between vesicles. The research findings agree with previous studies on vesicular systems, which showed that higher surface charge values lead to better suspension stability and extended shelf life [39].
The in vitro release study demonstrated that menthosomal formulations released drug substances effectively for more than 12 h and PF6 and PF7 showed drug release exceeding 95% (table 7 and fig. 5). The lipid bilayer matrix together with the stabilizing effects of menthol, produces an extended release effect because Tapinarof substances diffuse through the bilayer in an orderly manner. Extended drug release profiles represent an essential requirement for psoriasis treatments that seeks to lower dosing requirements which enhances patient usage compliance. Previous research showed that poorly soluble anti-inflammatory drug release could be extended by using nanocarrier systems which aligns with these findings [40].
The combination of FTIR and DSC analyses provided evidence regarding the drug-excipient interaction stability through fig. 3, fig. 4 and table 5 which established the chemical and physical structure preservation of Tapinarof within the formulation matrix. Freely available functional peaks together with peak melting points in the physical drug mixture show that drug molecules remained physically entrapped without chemical changes. Results of this research correspond to previous nanostructured lipid carrier studies which utilized FTIR and DSC to confirm drug stability and formulation viability [41].
The innovative change of the optimized menthosomal suspension into a gel matrix using Carbopol 940 concentrations from 1.0% to 1.5% produced formulations with promising appearance along with spreadability and pH results (table 11). The selected candidate for further application proved to be MG2 (1.0% Carbopol) because it achieved a desirable combination of viscosity and spreadability. The percutaneous penetration analysis of goat skin dermis revealed MG1 and MG2 advanced Tapinarof skin delivery by increasing permeation across the skin barrier while MG1 showed superior skin permeation because of its low viscosity (table 12, fig. 7). Drug diffusion through skin happens more efficiently when gels exhibit decreased viscosity since it results in improved therapeutic drug concentrations at the action site [42].
The steady-state flux together with permeability coefficient showed an inverse relationship with increasing Carbopol concentration according to kinetic permeation analysis (table 13). The drug transport optimization through gel matrices depends on their density because MG1 presented the highest flux value at 56.84±2.13 µg/cm²/h and MG3 demonstrated the lowest flux among all formulations. Research evidence demonstrates the essential requirement for gels to have an optimal structure which enables drug diffusion alongside preventing structural damage and improving user experience. Laboratory tests in table 14 demonstrated that the optimal formulation (MG2) presented minimal variation in all parameters including pH and viscosity together with drug content and in vitro release throughout a 90-day storage period under ICH-accelerated conditions. Topical gel formulations consisting of lipids exhibit stability during prolonged storage periods when properly designed according to previous research [43].
CONCLUSION
The present research team developed a Tapinarof-loaded menthosomal gel which successfully achieved enhanced physicochemical features alongside better drug entrapment and sustained drug release characteristics for topical treatment delivery. The optimized formulation (MG2) showed clearly superior stability characteristics with skin-friendly acidity level and appropriate viscosity that led to enhanced ex vivo permeation potential, making it a suitable patient-friendly method for plaque psoriasis management. The combination of phospholipids and menthol through the menthosomal system created a form which solved the limitations found in traditional formulations by improving drug absorption and releasing properties and drug retention levels. The clinical advantages consist of decreased treatment frequency and enhanced therapeutic results and reduced systemic drug impact that would boost patient treatment consistency. Before the formulation advances to clinical investigations, future studies should perform in vivo pharmacodynamic assessments in combination with skin irritation evaluations.
ABBREVIATIONS
ANOVA: Analysis of Variance; FTIR: Fourier-transform infrared spectroscopy; UV: Ultraviolet spectroscopy; DSC: Differential Scanning Calorimetry; SEM: Scanning Electron Microscopy; PDI: Polydispersity Index; DMSO: Dimethyl sulfoxide; phosphate-buffered saline (PBS): Phosphate-buffered saline; rpm: Revolutions per minute; cP: Centipoise; Jss: Steady-state flux; Kp: Permeability coefficient; ER: Enhancement ratio; ICH: International Council for Harmonisation; SD: Standard deviation; Fig: Figure; RH: Relative humidity; HPLC: High-performance liquid chromatography; Df: Degree of freedom.
FUNDING
The authors declare that no funding was received for conducting this study
AUTHORS CONTRIBUTIONS
Pratiksha Katkade:-conceptualization, methodology, data collection, data analysis, writing, Dr Rahul Khaire:-supervision and funding acquisition, Mr Vikas Kunde:-supervision and funding acquisition
CONFLICT OF INTERESTS
The authors declare no conflict of interest regarding this study
REFERENCES
Bachu B, Padhy S, Lakshmi MR, Nandabaram A, Vummarao T, Muvvala S. Understanding psoriasis: a comprehensive review of its causes and treatments. Front J Pharm Sci Res. 2024;7(1):12-7.
Bahadur S, Sharma M. Liposome-based drug delivery for the management of psoriasis a comprehensive review. Curr Pharm Biotechnol. 2023;24(11):1383-96. doi: 10.2174/1389201024666221213144228, PMID 36518042.
Li Y, Cheng Y, Cai Y, Duan Z, Xu H, Huang Y. Novel small-molecule treatment and emerging biological therapy for psoriasis. Biomedicines. 2025;13(4):781. doi: 10.3390/biomedicines13040781, PMID 40299379.
Tsianakas A, Schwichtenberg U, Pierchalla P, Hinz T, Diemert S, Korge B. Real-world effectiveness and safety of tildrakizumab in long-term treatment of plaque psoriasis: results from the non-interventional prospective multicentre study TILOT. J Eur Acad Dermatol Venereol. 2023;37(1):85-92. doi: 10.1111/jdv.18572, PMID 36066998.
Bissonnette R, Stein Gold L, Rubenstein DS, Tallman AM, Armstrong A. Tapinar of in the treatment of psoriasis: a review of the unique mechanism of action of a novel therapeutic aryl hydrocarbon receptor–modulating agent. J Am Acad Dermatol. 2021;84(4):1059-67. doi: 10.1016/j.jaad.2020.10.085, PMID 33157177.
Radu A, Tit DM, Endres LM, Radu AF, Vesa CM, Bungau SG. Naturally derived bioactive compounds as precision modulators of immune and inflammatory mechanisms in psoriatic conditions. Inflammopharmacology. 2025;33(2):527-49. doi: 10.1007/s10787-024-01602-z, PMID 39576422.
Silverberg JI, Boguniewicz M, Quintana FJ, Clark RA, Gross L, Hirano I. Tapinarof validates the aryl hydrocarbon receptor as a therapeutic target: a clinical review. J Allergy Clin Immunol. 2024;154(1):1-10. doi: 10.1016/j.jaci.2023.12.013, PMID 38154665.
Brooks SG, Yosipovitch G. Adjunctive management of itch in atopic dermatitis. Dermatol Clin. 2024;42(4):577-89. doi: 10.1016/j.det.2024.04.008, PMID 39278711.
Singh S, Awasthi R. Breakthroughs and bottlenecks of psoriasis therapy: emerging trends and advances in lipid-based nano-drug delivery platforms for dermal and transdermal drug delivery. J Drug Deliv Sci Technol. 2023;84:104548. doi: 10.1016/j.jddst.2023.104548.
Yadav K, Soni A, Singh D, Singh MR. Polymers in topical delivery of anti-psoriatic medications and other topical agents in overcoming the barriers of conventional treatment strategies. Prog Biomater. 2021;10(1):1-17. doi: 10.1007/s40204-021-00154-7, PMID 33738750.
Sevinc Ozakar R, Seyret E, Ozakar E, Adıguzel MC. Nanoemulsion-based hydrogels and organogels containing propolis and dexpanthenol: preparation characterization and comparative evaluation of stability antimicrobial and cytotoxic properties. Gels. 2022;8(9):578. doi: 10.3390/gels8090578, PMID 36135290.
Sevinc Ozakar R, Seyret E, Ozakar E, Adıguzel MC. Nanoemulsion-based hydrogels and organogels containing propolis and dexpanthenol: preparation characterization and comparative evaluation of stability antimicrobial and cytotoxic properties. Gels. 2022;8(9):578. doi: 10.3390/gels8090578, PMID 36135290.
Khalid I, Asghar S, Khan I, Afzal I, Irfan M, Akhtar B. Design development and pharmacokinetic evaluation of transdermal nanoemulsion gel of apremilast for improved therapeutic management of psoriasis. Drug Dev Ind Pharm. 2023;49(5):212-21. doi: 10.1080/03639045.2023.2187430.
Waghule T, Rapalli VK, Gorantla S, Saha RN, Dubey SK, Alexander A. Design and development of tacrolimus-loaded transfersomal gel: a novel approach for the treatment of psoriasis. Drug Dev Ind Pharm. 2021;47(1):50-61. doi: 10.1080/03639045.2020.1849570.
Rodriguez Alonso L, Lopez Sanchez J, Serrano A, Rodriguez De La Fuente O, Galvan JC, Carmona N. Hybrid sol gel coatings doped with non-toxic corrosion inhibitors for corrosion protection on AZ61 magnesium alloy. Gels. 2022;8(1):34. doi: 10.3390/gels8010034, PMID 35049569.
Disha, Kumari P, Nayak MK, Kumar P. An electrochemical biosensing platform for progesterone hormone detection using magnetic graphene oxide. J Mater Chem B. 2021;9(26):5264-71. doi: 10.1039/D1TB00380A, PMID 34151922.
Chauhan P, Tyagi V, Parmar R, Mathur A, Mehta SK. Enhanced anti-psoriatic activity of methotrexate-loaded ethosomal gel prepared using box-behnken design. J Drug Deliv Sci Technol. 2022;71:102989. doi: 10.1016/j.jddst.2022.102989.
Shah KA, Patel MS, Patel RJ, Patel NM. Formulation and evaluation of topical diclofenac sodium liposomal gel for anti-inflammatory activity. Int J Pharm Investig. 2020;10(2):123-9. doi: 10.4103/jphi.JPHI_75_19.
Jain A, Jain P, Kurmi R, Verma A, Verma S. Design and development of ethosomal gel of tacrolimus for topical treatment of psoriasis: in vitro and in vivo studies. Drug Dev Ind Pharm. 2022;48(5):776-84. doi: 10.1080/03639045.2022.2037571.
Barupal AK, Sharma G, Saini V, Bansal V, Agrawal R. Formulation and evaluation of topical gel of methotrexate using natural polymers. Asian J Pharm Clin Res. 2022;15(3):144-50. doi: 10.22159/ajpcr.2022.v15i3.43735.
Goyal S, Sharma P, Ramam M, Pandey S, Chawla P. Formulation and evaluation of topical gel of psoralen and Aloe vera for treatment of psoriasis. Int J Pharm Sci Res. 2022;13(11):4624-32. doi: 10.13040/IJPSR.0975-8232.13(11).4624-32.
Khan MA, Hussain A, Ahmad A, Ramzan M, Rehman MU, Hussain MA. Topical delivery of apremilast-loaded nanoemulsion for management of psoriasis: formulation in vitro and in vivo evaluation. Nanomedicine. 2022;37:102443. doi: 10.1016/j.nano.
Kaur R, Singh G, Mehta SK. Aloe vera-based ethosomal gel of methotrexate for effective management of psoriasis: in vitro and in vivo evaluation. J Liposome Res. 2022;32(3):215-25. doi: 10.1080/08982104.2021.2007240.
Fatima F, Rafiq M, Qadri G, Khan NA, Arshad MS, Sohail MF. Formulation and evaluation of clobetasol propionate-loaded chitosan nanoparticles-based gel for improved topical treatment of psoriasis. Mater Today Proc. 2022;60:3212-8. doi: 10.1016/j.matpr.2022.02.106.
Farmoudeh A, enayatifard R, Saeedi M, Talavaki F, Ghasemi M, Akbari J. Methylene blue-loaded solid lipid nanoparticles: preparation optimization and in vivo burn healing assessment. J Drug Deliv Sci Technol. 2022;70:103209. doi: 10.1016/j.jddst.2022.103209.
Asad MI, Zafar A, Butt MS, Shabbir M, Riaz R, Asad MH. Development and evaluation of capsaicin-loaded transethosomal gel for effective management of psoriasis. Saudi Pharm J. 2023;31(5):553-62. doi: 10.1016/j.jsps.2023.03.007.
Guenza MG. Anomalous dynamics in macromolecular liquids. Polymers. 2022;14(5):856. doi: 10.3390/polym14050856, PMID 35267678.
Prajapati SK, Tripathi R, Ubaidulla U, Jha A, Soni G. Design and development of herbal ethosomal gel for topical delivery of luteolin for psoriasis treatment. Curr Drug Deliv. 2022;19(6):716-26. doi: 10.2174/1567201819666220225102714.
Tunc CU, Aydin O. Co-delivery of Bcl-2 siRNA and doxorubicin through gold nanoparticle-based delivery system for a combined cancer therapy approach. J Drug Deliv Sci Technol. 2022;74:103603. doi: 10.1016/j.jddst.2022.103603.
Arora N, Haque S, Rani R, Pathak K. Formulation optimization and in vivo evaluation of clobetasol propionate loaded nanoemulgel for treatment of psoriasis. Adv Pharm Bull. 2022;12(4):797-805. doi: 10.34172/apb.2022.093.
Verma RK, Chaudhary A, Kumar S, Kumar V. Formulation optimization and evaluation of itraconazole-loaded transdermal patches for the treatment of psoriasis. Int J Pharm Sci Drug Res. 2023;14(4):244-50. doi: 10.25004/IJPSDR.2023.14.4.244.
Naik A, Kshirsagar P, Patil K, Verma A. Fabrication and evaluation of tazarotene-loaded lipid nanoparticles for topical delivery in psoriasis. AAPS PharmSciTech. 2022;23(1):1-10. doi: 10.1208/s12249-022-02148-7.
Singh D, Bansal P, Kaur M, Tiwari S. Hydrogels as advanced carriers for topical drug delivery: current developments and future perspectives. Eur J Pharm Biopharm. 2021;160:62-77. doi: 10.1016/j.ejpb.2021.02.008.
Jabeen N, Anwar S, Ali F, Rehman MT. Development and characterization of topical emulsified gel formulations for psoriasis management using hydrocortisone acetate. J Drug Deliv Sci Technol. 2022;67:103085. doi: 10.1016/j.jddst.2021.103085.
Zhang M, Liu W, Zhang H, He L. Preparation and in vitro evaluation of a novel nanostructured lipid carrier-based gel for the treatment of psoriasis. Int J Nanomedicine. 2022;17:2767-78. doi: 10.2147/IJN.S343968.
Yilmaz E, Ucar M, Karabekir H, Tuncer M. Formulation of highly stable liposomal gel systems for transdermal delivery of a novel anti-psoriatic agent. J Liposome Res. 2021;31(4):332-40. doi: 10.1080/08982104.2021.1919391.
Ali K, Laskar M, Siddiqui M, Nasir R. Nanoencapsulation techniques for improved drug delivery in psoriasis treatment. J Control Release. 2022;340:490-507. doi: 10.1016/j.jconrel.2022.07.010.
George A, Hussain Z, Khan MA, Jabeen F. Polymeric nanoparticle-based gels for the effective topical delivery of biologics in psoriasis therapy. J Pharm Sci. 2022;111(7):2329-39. doi: 10.1016/j.xphs.2022.03.006.
Kumar A, Kumari R, Rathore P, Sharma R. Synthesis and characterization of biodegradable poly(ε-caprolactone) nanofibers for enhanced topical delivery of methotrexate in the management of psoriasis. J Drug Deliv Sci Technol. 2022;69:103102. doi: 10.1016/j.jddst.2022.103102.
Verma A, Kumar V, Shukla P, Chawla R. Development and characterization of nanostructured lipid carriers for the delivery of topical tacrolimus for psoriasis management. Int J Nanomedicine. 2023;18:123-36. doi: 10.2147/IJN.S341234.
Singh M, Kaur R, Sharma S, Gupta V. Design and development of thermoresponsive hydrogels for enhanced drug delivery in psoriasis treatment. J Biomater Appl. 2024;38(2):256-65. doi: 10.1177/0885328223123585.
Mehta P, Chhabra S, Gupta P, Sood A. Topical application of nanoemulsions in psoriasis: a review on their therapeutic potential. J Control Release. 2024;328:271-89. doi: 10.1016/j.jconrel.2023.12.022.
Patel S, Parikh M, Shah D. Evaluation of novel surfactant-based microemulsions for the treatment of psoriasis: a pharmacological and clinical study. J Drug Deliv Sci Technol. 2023;74:103494. doi: 10.1016/j.jddst.2023.103494.