
Int J App Pharm, Vol 18, Issue 1, 2026, 292-305Original Article
QUALITY BY DESIGN AND CHARACTERIZATION OF EDARAVONE SLN TO IMPROVE BRAIN DELIVERY BY NASAL ROUTE FOR THE TREATMENT OF ALZHEIMER’S DISEASE
CH. BHAVANI1,2, P. BALAJI1*
1School of Pharmaceutical Sciences, Vels Institute of Science, Technology and Advanced Studies (VISTAS). Pallavaram, Chennai-600117, Tamilnadu, India. 2Department of Pharmaceutics, CMR College of Pharmacy, Medchal, Hyderabad, Telangana-501401, India.
*Corresponding author: P. Balaji; *Email: bthiru656@gmail.com
Received: 21 Jun 2025, Revised and Accepted: 07 Nov 2025
ABSTRACT
Objective: The present study aims at formulation development of solid lipid nanoparticles of Edaravone (EDN), for nasal administration to improve the permeation through blood blood-brain barrier for therapeutically effect on Alzheimer’s disease.
Methods: Solid lipid nanoparticles (SLN) are formulated by using the lipid core of Glyceryl monostearate and Tween80 as surfactant through emulsification, solvent evaporation technique and optimized by using 32 central composite design (CCD) secondary overlay plots. Selection of the optimized formulation based on the dependable factors like entrapment efficiency (EE), particle size, polydispersity index (PDI), zeta potential and drug release studies. The selected optimized formulation was subjected to test the behavioral changes in Wister rats.
Results: The final optimized formulation was observed as particle size of<200 nm. Entrapment efficiency of 87%, zeta potential of-21.23mEV and drug release of 84%. In vivo studies with the SLN encapsulated EDN showed better memory retention when comparing with the pure drug formulation. Y-Maze test behavioral score with control group 24.5±3.39% was considerably lower with the ENP-treated group (53.5±4.41% for high dose).
Conclusion: EDN encapsulated SLN delivered through the nasal route of administration has the better therapeutical applications in nano formulation strategies.
Keywords: Solid lipid nanoparticles, Central composite design, Alzheimer’s disease, Design of experiments, Entrapment efficiency, Edaravone
© 2026 The Authors. Published by Innovare Academic Sciences Pvt Ltd. This is an open access article under the CC BY license (https://creativecommons.org/licenses/by/4.0/)
DOI: https://dx.doi.org/10.22159/ijap.2026v18i1.55684 Journal homepage: https://innovareacademics.in/journals/index.php/ijap
INTRODUCTION
Nanocarriers are drug delivery systems that range in size from 10 to 1000 nanometers. They are made from various materials, including polymers (such as nanospheres, nanogels, and dendrimers), lipids (like lipid bodies), and inorganic materials (such as silver and gold nanoparticles). Lipid-based carriers are particularly effective in delivering drugs through the internal layers of organs. These nanocarriers are ideal for targeting specific sites in the body while minimizing side effects. Lipid-based nanoparticles are further classified into Solid SLN and NLC (Nanostructured lipid carriers) [2, 3]. Both the nano formulations are prepared by the lipid layers, based on the size, shape, lamellarity and morphology characteristics, the difference in the drug delivery kinetics was observed. Nano-structured carrier systems are advantageous when used particularly to treat cancerous and neurological disorders, due to their target specificity and site-specific action at the cellular level. To improve the bioavailability and stability of the drug, it should be encapsulated in the nanocarrier systems [4].
Nose-to-brain drug delivery systems are gaining significant attention to deliver the drug directly to the brain targeting site through the nasal cavity. Bypassing the blood-brain barrier (BBB) is possible through the trigeminal and olfactory pathways [5]. Drugs with shorter bioavailability, like sumatriptan for migraine treatment, improved their bioavailability by 15% when it is given by the nasal route. Drugs travel by olfactory epithelium and trigeminal epithelium routes to reach their nerve endings to deliver the drug directly to the brain system [6]. The BBB is made with tight junctions to restrict the entry of outer particles and separate the brain from other body parts. Molecules with a<150Da (Daltons) weight and high lipid solubility have access to cross the barrier to show their effect against central nervous system(CNS) disorders [7]. In the brain, ions are exchanged by transcellular pathways due to the nonexistence of capillaries and fenestrations. CNS disorders are ringing alarms in day-to-day life by increasing their death rate by 36.7% from 1991 to 2015 [8, 9]. SLNs have a great mechanism of transporting the drug particles to reach the target site and show the desired therapeutic action. Surfactant addition improves the adhesion property and permeability of the drug particles through the tight lipoidal junctions for controlled release action [10]. Surfactants with amphiphilic nature are used to reduce the interfacial tensions and are used in very low concentration (0.5 – 5%). Surfactants are divided into three types based on the charge present on the surface: anionic, cationic, and Non-ionic. Non-ionic surfactants are preferred due to their safety profiles, which promote the stereochemical stabilization of nanoparticles. Charged surfactants are used for electrochemical stabilization of the nanoparticles. Cationic surfactants (stearyl amine) are mainly used in topical preparations due to their affinity towards the anionic nature of skin. Non-ionic surfactants, such as Tweens, Spans, Sorbitol esters, poloxamers, esters of stearic acid, lauric, oleic, and palmitic acids, are frequently used. Phosphatidylcholines serve as co-surfactants to alter the particle size characteristics of nanoparticles. Lecithin derived from soy is more saturated than egg lecithin and is used as an absorption enhancer.
SLN is named due to the addition of solid lipid content as the main ingredient. Solid lipids are mainly considered as mono, di, and tri glycerides, like Compritol, Dynasan, and Softisan (triglycerides with fatty acid mixture). Fatty acids like stearic acids and cetyl alcohols promote the lipid layer to accommodate a greater number of drug particles. Medium chain triglycerides are labrafil (glycerides associated with PEG-Poly Ethylene Glycols), labrafac (derived from caprylic acid). Drug release mechanism from the SLN particles is very important phenomenon to achieve the desired bioavailability of the drug components, Brust release of the drug particles is observed to release the particles. Parameters like lipid and drug ratio, surfactant concentration, and process-related parameters like temperature. The controlled drug release mechanism was affected by the release studies of the drug delivery systems. The burst release mechanism is affected by the solubility of the drug particles in excipients.
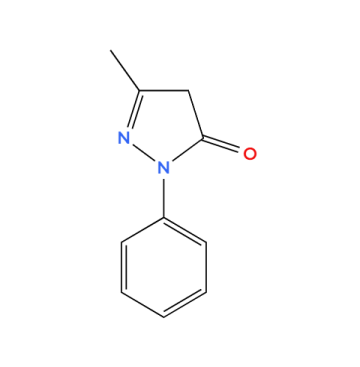
Fig. 1: Chemical structure of EDN
EDN (3-methyl-1-phenyl-2-pyrazolin-5-one) is a poorly water-soluble drug with lower bioavailability. The first-pass effect of the drug limits its bioavailability by oral administration. The neuroprotective mechanism of the drug is a free radical scavenger to eliminate hydroxyl radicals, which is the most useful mechanism to protect the motor nerve damage situation [11]. Patient compliance for the administration of EDN is very poor due to frequent injections, and it requires a healthcare professional to meet the drug's therapeutic needs [12]. The present study describes the need for EDN nasal delivery of solid lipid nanoparticles suspension to modify the drug release characteristics by meeting patient compliance in the treatment of neurological disorders. Nano-sized particle delivery to the target brain is crosses the BBB barrier with its smaller particle size (<200 nm), and it can easily be taken up from the nasal mucosa to travel through the olfactory nerve ending to connect with the brain. Several regulating agencies are suggesting optimizing the formulation strategies with the quality by design (QbD) approach to understand the risk assessment of process and product parameters.
MATERIALS AND METHODS
Materials
EDN, Tween 80, Chloroform, sodium hydroxide, and di-potassium hydroxide are purchased from SD Fine Chemicals, Hyderabad, India. Soya-lecithin purchased from Yucca Enterprises, Mumbai. Glyceryl monostearate was obtained from Coloron Asia, Mumbai, India. All the other chemicals and solvents were of analytical grade compounds, and they are used without any purification.
Emulsification and subsequent solvent evaporation
The solvent emulsification and evaporation method was utilized to formulate the SLN colloidal particles. SLN is prepared by means of taking 5 to 30% (w/v) of lipid phase and 2-3% (w/v) of emulsifying agent. GMS was taken in a quantity of 100 mg and added with drug EDN (4 mg) in the organic phase (2.5 ml) of chloroform. Organic phase was added dropwise into the aqueous phase of 6 mg containing Tween80 as a hydrophilic surfactant. The above-mentioned mixture was homogenized at 12400 rpm for 3 minute get a coarse O/W emulsion [13]. This coarse emulsion was subjected to ultrasonication for 10 min. using a probe sonicator at 45% amplitude. During sonication, solvent emulsification, and evaporation, SLNs were precipitated and settled down [14]. All the formulations were made in triplicate for further characterization process. While optimizing the dependent variables, other independent variables are set as constant. The prepared SLNs were stored at a 4 °C refrigerator temperature [15].
CCD
Optimization of formulation was done by the secondary order level of study conducted by the central composite study design with two factors and five levels of study performed by the design expert V13 software trial version of 13.0.5. Two selected independent variables were studied at five different levels, like -1.414,-1,0,+1,+1.414, where 1.414 is indicated as the value of Alpha, which is the distance between the center point and the star point. A total of 13 experimental runs were performed to accelerate formulation studies, which include four factorial points, four axial points, and five replicated center points used to assess the data with statistical significance. The optimized formulation was selected based on a complete statistically significant analysis by verifying the p-value, Analysis of Variance (ANOVA) studies, fitness of the model among the linear, two-factor interaction, and quadratic analyses due to the correlation coefficient r2, adjusted r2, and predicted r2 as quality indicators. Larger f-value and p-value less than 0.05 are considered to be statistically significant formulation [16]. 3D (3-dimensional) response surface plots explain the interaction between solid lipid and surfactant and tween 80 molecules. One more criterion to select the optimized formulation was the desirability function by the predetermined constraints, like particle size is minimum, EE Maximum, Drug release Maximum, and Zeta potential within the range of study. Final optimized formulation used for the evaluation, stability studies, and in vivo animal model studies to determine the therapeutic effect of the drug [17].
DoE is used to optimize the formulation with statistical inference. Response surface methodology is a statistical analysis of the variables and their effects on the responses. ANOVA tool is used to analyze the effect of the design, and it is represented with a p<0.05 probability value and a confidence interval 95% [18].
Y = β0±∑ Xi β1 ±∑ Xi2 β2± ∑ Xi Xj β3
The above equation reveals the response fit characteristics and the effect of various independent variables on dependent variables. β0is the mean value of all the constants of the model, β1 is the coefficient of linear relationship of variables, β2is the coefficient of quadratic relationship of variables, β3 is the coefficient of variable interactions. Positive and Negative sign indicates the accelerating and decelerating of the factor effect on response. R2values and the adjustable Radj2 difference indicate the variability between the model, and this value should be closer to 1. RSM model is a secondary order design which includes CCD and BBD (Box-Behnken design). CCD and BBD are two important methods to apply their principles in optimizing nanoformualtions. CCD includes the two-level fragmentation effect of factor and the addition of axial points with the central point to study the response [19]. BBD is a three-level second-order design of experiments, with the number of experiments calculated by
N = k (k-1)+Central point. (Here, k is the number of factors)
The desirability function was set by using design of experiments (DoE) to optimize the formulation with required factors, and the effect of factors on responses was studied numerically and graphically. Statistical inference was drawn by calculating the probability (p). Significant fit models are having p value<0.01 or p<0.05, and a confidence interval 99% or 95%. The mean square deviation is calculated in the ANOVA table to finalize the fit model. All the values should be expressed in mean±SD (Standard Deviation)
Characterization of SLNs
Physicochemical characterization
Morphology of the SLN particles was examined using a transmission electron microscope (TEM) (by taking the freshly prepared nanoparticles in a copper grid box, and it was air dried at room temperature. Negative staining with 1% uranyl acetate to improve the contrast and observe under TEM. The particle size and size distribution were analyzed by using Zetasizer at 25 °C.
Compatibility studies
Fourier transform infrared spectroscopy (FTIR): The FTIR spectra of pure EDN, Excipients, and optimized formulations were recorded in the region of 4000-400 cm-1 (FTIR Spectrophotometer, Jasco-Japan). The transparent pellets of these samples were prepared by the pressed pellet technique (potassium bromide), and the recorded spectra were interpreted for the possible chemical interactions.
Differential scanning calorimetry (DSC): The temperature difference may be due to the change in their melting point, % weight change, vaporization temperature, and enthalpy. The interaction of the pure drug with the excipients might cause a shift in the thermogel due to the change in the physicochemical properties. Thermal analysis of the optimized formulation, the Blank formulation, and the optimized formulation was performed by a Differential Scanning Calorimeter DSC2A-02306. The samples (5 mg) were enclosed in an aluminium pan and heated at a rate of 33-265 °C for Blank SLN, gradually increased to 33-300 °C for EDN, and Optimized formulation in atmospheric nitrogen (50 ml/min flow rate) at a stable increment rate of 10 °C/min.
PDI
PDI value calculation is carried out by the SPAN index. % cumulative frequency of particle Vs means size of particles plotted to find the diameter at 90%, 50% and 10% undersized particles [20].
SPAN Index =
d90-diameter of a 90% undersized particle.
d10-diameter of a10% undersized particle.
d50-diameter of a50% undersized particle.
Encapsulation efficiency
Drug entrapment efficiency was calculated based on the mechanism of how much drug substance is entrapped in the nanostructures is determined by the various analyzing techniques like UV-Visible spectrophotometer and HPLC. An ultra-ultracentrifuge with cold temperature is used to separate the unentrapped drug from the nanoparticles. A gel chromatographic column with Sephadex G-50 was used to separate the free drug, and it was simultaneously analyzed by HPLC (High-performance liquid chromatography).
% EE (Entrapment Efficiency) = 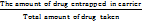 *100
*100
After several equilibrations with the suitable solvent, the final amount of free drug was calculated for the EE estimation.
Zeta potential
Surface charge of the nanoparticles was measured by using the Zetasizer at 25 °C.
In vitro drug release studies
The in vitro drug release from the SLN formulation was performed using Franz diffusion cells with an effective diffusion area of 3.14 cm². A dialysis membrane with a molecular weight cut-off of 12–14 kDa was mounted between the donor and receptor compartments. The receptor phase consisted of phosphate-buffered saline (PBS) (pH 7.4) maintained at 37 °C with continuous stirring. Sink conditions were validated by ensuring the drug concentration in the receptor medium remained below 10% of its saturation solubility. Aliquots of 1 ml were withdrawn at predetermined intervals with immediate replacement of fresh medium to maintain volume.
Statistical treatment
All the data points are collected as mean±SD values. The test group and standard group were compared with a t-test and ANOVA at the level of p<0.05 to estimate the statistical significance.
Calibration curve
A calibration curve was plotted for the drug sample at various concentration levels with a suitable solvent based on the solubility of the drug. The prepared concentrations were analyzed for the drug sample by using a UV-Visible spectrophotometer. A graph was plotted by taking concentration on the Y-axis and absorbance on the X-axis. The correlation coefficient R was determined based on the linearity of the curve.
Nanoparticles are quantified based on various characteristics like particle size, PDI, EE, and Drug loading capacity. How the drug is solubilized by the lipid matrix is an important consideration for formulating nanoparticles with good quality. Drug loading is the primary parameter to estimate the drug amount present with respect to the lipid weight [21].
In vivo studies
Methodology
Acute toxicity testing of EDN nano-sized particles in wistar rats
The toxicity investigation was performed on healthy albino Wistar rats weighing 150–200 g. (Animal ethical committee approval obtained from CMR College of Pharmacy, Hyderabad, with the approval no. CPCSEA/1657/IAEC/CMRCP/COL-24/143). After procurement, animals are acclimatized for at least 3–7 d. Typical environmental conditions include: Temperature: 22 ± 2 °C; Relative Humidity: 50–60%; Light/Dark Cycle: 12 h/12 h; Housing: Polypropylene cages with sterilized paddy husk bedding; Diet: Standard pellet diet and water ad libitum to minimize stress before experimentation. They were given a typical pellet feed and given ten days to get used to the conditions in the lab. Two groups of five rats each were randomly selected from a total of ten animals. The second group was given a daily oral dose of EDN solid lipid nanoparticle at a dose of 2g/kg body weight, while the control group was given regular saline water. The first two hours following medication delivery were characterized by normal behaviors and toxicity indicators. After 24 h, the existence and absence of tremors and convulsions were finally observed and documented [22].
Five groups of five rats each were randomly assigned to one of the following five groups: Scopolamine (2 mg/kg), Scopolamine (2 mg/kg)+DP (Donepezil) (5 mg/kg, p. o. (per oral)), Scopolamine (2 mg/kg)+ENP(2 mg/kg, IN), and Scopolamine (2 mg/kg)+ENP (4 mg/kg, IN) [23-25]. From the first to the fourteenth day of the trial, the rats received intranasal ENP. From day 8 to day 14, 30 min after the various treatments, scopolamine was given intraperitoneally to all groups except the control group. After that, behavioral tests were carried out, such as the Y-maze and the Morris water maze. In the end, the animals were sacrificed.
Table 1: Details of animal study to depict the day-to-day activity of in vivo behavioural studies
| S. No. | Day | Event |
| 1 | 0-5 | Daily administration of various doses of drugs for 15 d |
| 2 | 5-7 | Training trials |
| 3 | 8 | Scopolamine is given in the Peritoneal route. |
| 4 | 11-14 | Behavioral studies |
| 5 | 15 | Sacrifice of an animal. |
Y-maze test
Rats with minor alterations were used to test short-term memory via spontaneous alternation behavior. In brief, each animal was positioned at one end of the wooden "Y" maze and allowed to explore for eight minutes. A visual record was made of the number of arm series entries, including potential returns into the same arm. Rats on overlapping triplet sets were utilized to test the alternation by entering each arm one after the other. An hour before the test, the rats received their respective medications. Between studies, the arms were thoroughly cleansed to eradicate any remaining odors. It was determined how many arm entries there were overall during the testing time. Furthermore, the proportion of alternation was calculated using the following formula:

Morris water maze test
The Morris water maze test, with minor changes, was used to assess memory and spatial learning [26, 27]. The experimental setup included a cylindrical water tank filled with water up to 15 cm deep and made opaque by adding titanium oxide at 28 °C. The platform was positioned inside the tank, with the top 3 cm below the water's surface in the maze's target quadrant. Following that, the pool was divided into four quadrants that were evenly spaced. Before training, the animals were not permitted to swim in the pool. For every training exercise, the amount of time it took to reach the hidden platform was noted. Four trial sessions spanning six days (days 9–14) following scopolamine injections were used to measure the time it took to reach the platform. Averaging the total amount of time spent in each of the four trials each day allowed for the calculation of latencies. It was also noticed that rats were frequently unable to discover the platform. Furthermore, on days 11 and 14, the platform was removed from the water tank (30 min after the previous trial), and the rat was given 60 seconds to locate it as part of a spatial memory probing test. It was calculated how much time was spent in the specified quadrant.
RESULTS AND DISCUSSION
Calibration curve
A standard calibration curve was plotted between EDN concentration in (µg/ml) and the absorbance in PBS of pH 7.4 solution. R2 regression coefficient value observed as 0.9994.
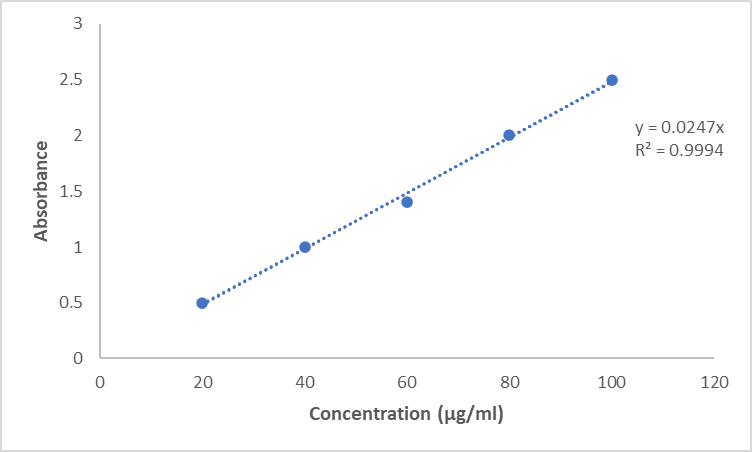
Fig. 2: Calibration curve of EDN
Drug and excipient compatibility studies
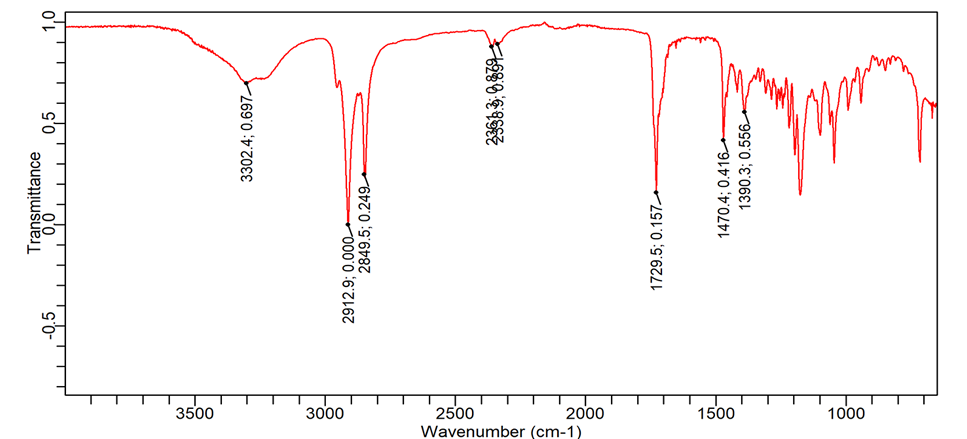
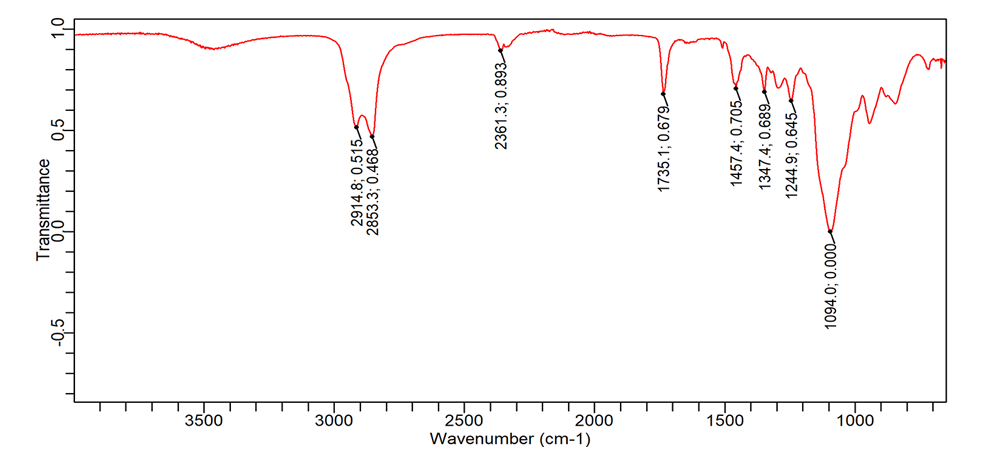
FTIR studies
FTIR studies were conducted as per the specifications mentioned in the methods column. Significant peaks of EDN observed at wavelength 1094 cm-1, 1457 cm-1, 2361 cm-1, 2914 cm-1 present in formulation. All the peaks present in the drug are represented in the formulation of SLN.
DSC studies
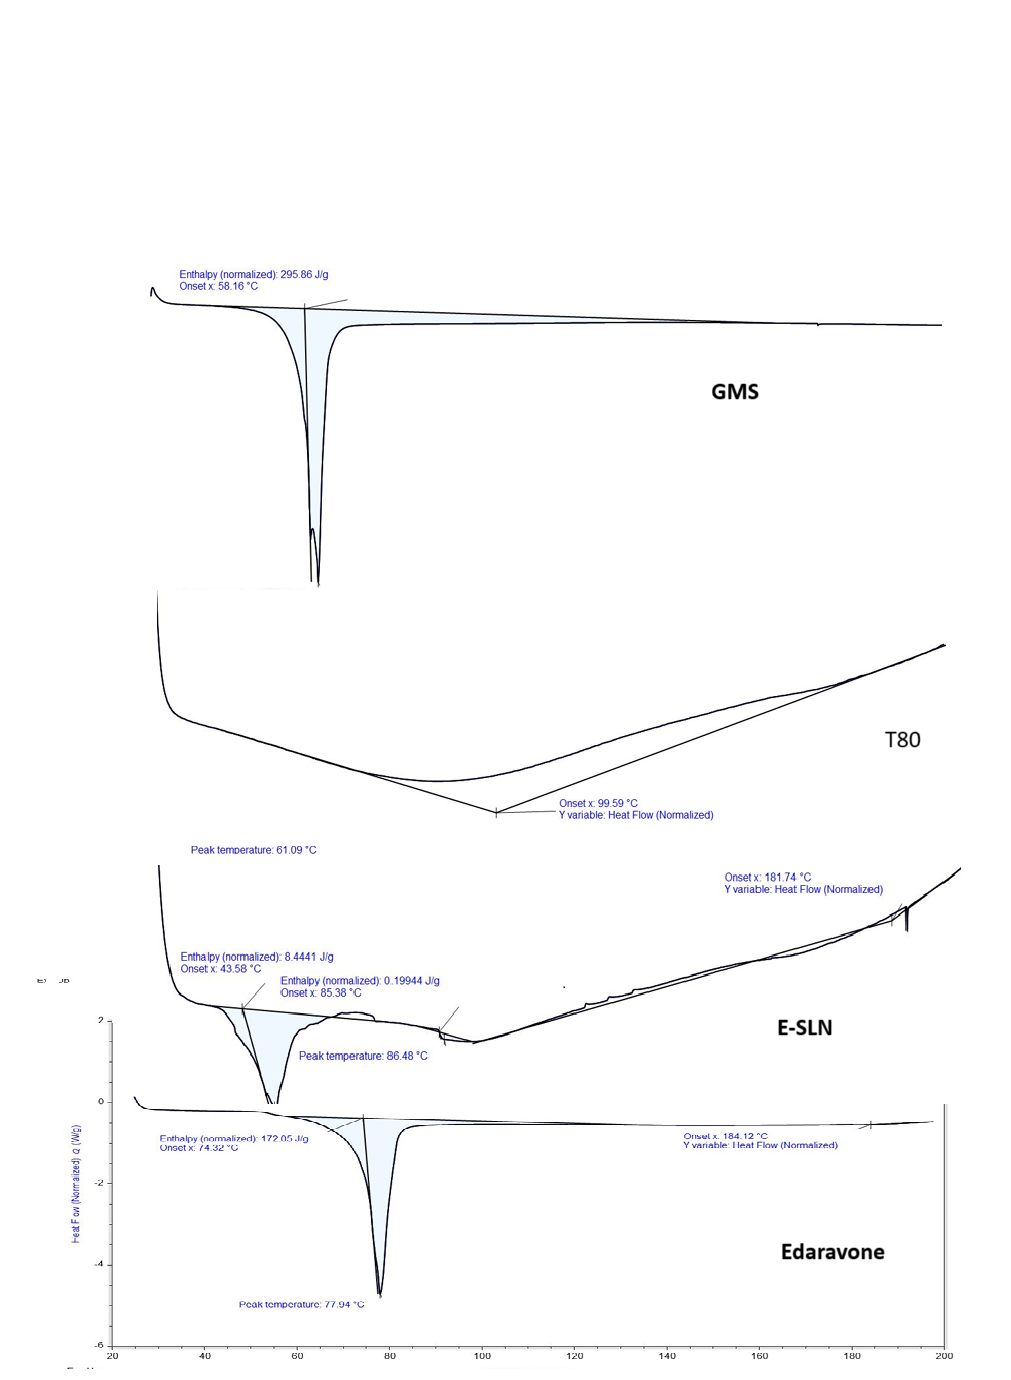
DSC is considered a thermal analysis process, used to find the purity, polymeric forms, and melting point of the sample in Drug discovery studies. Thermo gs are plotted between temperature and heat flow parameters. Tm is the temperature at which the maximum heat capacity of the sample is T onset is the temperature at which the transition takes place, T end set is the temperature at which the transition ends at a particular heat flow. As the temperature increases, with gradual input, make changes in the sample, and it will be represented by the thermal peak plot with the absorbing or releasing energy levels (endothermic or exothermic). The area under the peak plot is calculated as the enthalpy of the transition [28]. SLN formulation with lipids and drug shifted its thermal peak to maintain the correlation of the Drug and lipid forms.
TEM analysis
The QbD approach to optimize the SLN formulation maintains the high-quality standards as per the USFDA (United States of America-Food and Drug Administration) guidelines in formulation development. Statistical intervention in formulation development is a strategic pathway to get a universally acceptable conclusion. In this study, QbD-based DOE software version 10.0.0.3 (State-ease Inc., USA) is used to finalize the solid lipid and emulsifier concentration to get the desirable results. Responses include particle size (Y1), PDI (Y2), EE (Y3), zeta potential (Y4), and Drug release (Y5) are studied for the improvement of drug delivery to the brain through the nasal route of administration. Optimization of lipid composition is very much essential to modify the drug penetration into the nasal epidermal layers to cross the BBB layer [29]. Various techniques for making SLN formulation are screened, and finally, two methods are selected, with one method confirmed based on the particle size and entrapment efficiency. Solvent emulsification and evaporation are the final confirmed methods to develop the SLN formulation. Here, surfactant plays a key role in structural modification of the prepared particle, based on the HLB (Hydrophilic Lipophilic Balance) scale, of surfactant phase transition takes place to improve the entrapment efficiency. A higher HLB value may reduce the Entrapment efficiency of the nanoparticles. So, by keeping the fundamentals in mind, the selection of excipients was done to modify the primary descriptors of the formulation prospects. Lipid-based excipients are used to improve the solubility of the drug to easily penetrate into the epidermal layers of the nose region. Organic solvents cause toxic effects on the formulation preparation when it is used for therapeutic purposes. To avoid such types of adverse effects, the solvent is completely evaporated by the Rota flask evaporator and the sonication method. By the study of standard literature survey process variables like temperature, sonication time, stirring time/homogenization time were selected, and it was confirmed by some trial versions of the study. Each experimental part was conducted in triplicate to get the desired effects on responses. Each and every response study for statistical interventions of the effect of independent variables with linear/quadratic equations, 3D contour plots, and ANOVA. Probability values less than 0.0500 were considered statistically significant.
In nose-to-brain delivery of SLN particles, particle size should play a key role in therapeutic effect by crossing the BBB. Less than 200 nm particles cross the olfactory channels to enter the brain's systemic circulation. Critical quality attributes of the present study include particle size and monodispersity of the particles. For improved absorption of the SLN particles, minimum particle size, less PDI, High entrapment efficiency, and lower zeta potential values are considered as the Critical Quality Attributes (CQA) of the present study. Robustness of the formulation study includes establishing a functional relationship between CQA and Critical Measurement Attributes (CMA) [30].
Solvent evaporation and high-pressure homogenization methods are compared with the CQA parameters to finalize the method of SLN preparation. The data mentioned in Table2indicate that lower particle size and higher entrapment efficiency results are observed with the solvent evaporation technique. Particle size and PDI values are expressed in mean±SD (n=3), with p<0.05 indicating statistically significant. Hence, further investigations are carried out with the solvent evaporation techniques as per the literature [31].
A
B
C
Fig. 3: FTIR peaks of the drug (A) and excipients (B) along with the (C) SLN formulation
Temperature
Fig. 4: DSC Thermograms of the drug, excipients, and SLN formulation. (X-axis represents Temperature, Y-axis represents Heat flow)
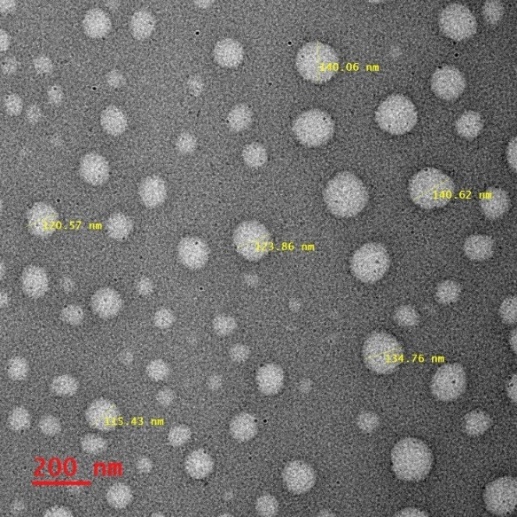
Fig. 5: TEM image of ENP formulation, # nm= nanometres
Table 2: Comparative studies of the formulation techniques based on particle size, PDI, and EE
| S. No. | Formulation | Method | Particle size (nm) | PDI | Entrapment efficiency |
| 1 | SLN-E | Solvent Evaporation | 321±11.6 | 0.311±0.11 | 51±4.2 |
| 2 | SLN-H | Homogenization | 275±7.5 | 0.289±0.10 | 69±2.6 |
#All the values represented in mean±SD (where n=3)
Various process parameters like temperature, stirring speed, and sonication time are finalized by the melting point of lipids, i. e., 58-60 °C. Stirring speed of 12400 RPM as per the literature, and the sonication time was decided by the measurement of particle size and PDI as 5 min. The present study was carried out with the finalized process parameters to calculate the CQA with the solvent evaporation technique. Design expert software with the build information of response surface randomized CCD with 13 runs in no blocks was performed to maintain the quality of formulation development.
Table 3: Response surface design with coded and actual values of the independent variables
| S. No. | Formulation code | Coded values | Actual values | ||
| Lipid | Surfactant | Lipid | Surfactant | ||
| 1 | ENP1 | 0 | 0 | 100 | 6 |
| 2 | ENP2 | 0 | 0 | 100 | 6 |
| 3 | ENP3 | +1.414 | 0 | 170.711 | 6 |
| 4 | ENP4 | -1.414 | 0 | 29.2893 | 6 |
| 5 | ENP5 | 0 | 0 | 100 | 6 |
| 6 | ENP6 | 0 | -1.414 | 100 | 3.17157 |
| 7 | ENP7 | -1 | -1 | 50 | 4 |
| 8 | ENP8 | 0 | +1.414 | 100 | 8.82843 |
| 9 | ENP9 | 0 | 0 | 100 | 6 |
| 10 | ENP10 | -1 | +1 | 50 | 8 |
| 11 | ENP11 | +1 | -1 | 150 | 4 |
| 12 | ENP12 | +1 | +1 | 150 | 8 |
| 13 | ENP13 | 0 | 0 | 100 | 6 |
#ENP-Edaravone Nanoparticles; +α =+1.414 and-α =-1.414
Table 4: Response surface quadratic model for responses of (a) Particle size (b) PDI (c) Entrapment Efficiency (d) Zeta potential (e) Drug release
(a) Response (Y1) – Particle Size, ANOVA for response surface Quadratic model, Partial sum of squares-type III
| Source | Sum of squares | Df | Mean square | F-value | p-value | |
| Model | 30895.34 | 5 | 6179.07 | 8.29 | 0.0075 | Significant |
| A-Glyceryl Monostearate | 2017.21 | 1 | 2017.21 | 2.7 | 0.144 | |
| B-Tween 80 | 851.25 | 1 | 851.25 | 1.14 | 0.3208 | |
| AB | 1090.65 | 1 | 1090.65 | 1.46 | 0.2658 | |
| A² | 23735.49 | 1 | 23735.49 | 31.83 | 0.0008 | |
| B² | 1295.75 | 1 | 1295.75 | 1.74 | 0.229 | |
| Residual | 5220.49 | 7 | 745.78 | |||
| Lack of Fit | 4300.16 | 3 | 1433.39 | 6.23 | 0.0547 | not significant |
| Pure Error | 920.33 | 4 | 230.08 | |||
| Cor total | 36115.83 | 12 |
#df = degree of freedom, f-value = f statistics, p-value = Probability value.
(b) Response (Y2) – PDI, ANOVA for response surface quadratic model, Partial sum of squares-type III
| Source | Sum of squares | Df | Mean square | F-value | p-value | |
| Model | 0.0052 | 5 | 0.001 | 9.43 | 0.0051 | Significant |
| A-Glyceryl Monostearate | 0 | 1 | 0 | 0.2586 | 0.6267 | |
| B-Tween 80 | 0.0002 | 1 | 0.0002 | 1.9 | 0.2105 | |
| AB | 0.0003 | 1 | 0.0003 | 2.93 | 0.1304 | |
| A² | 0.0042 | 1 | 0.0042 | 37.74 | 0.0005 | |
| B² | 0.0002 | 1 | 0.0002 | 1.59 | 0.2476 | |
| Residual | 0.0008 | 7 | 0.0001 | |||
| Lack of Fit | 0.0005 | 3 | 0.0002 | 2 | 0.2558 | not significant |
| Pure Error | 0.0003 | 4 | 0.0001 | |||
| Cor total | 0.006 | 12 |
#df = degree of freedom, f-value = f statistics, p-value = Probability value.
(c) Response (Y3) – EE, ANOVA for response surface Quadratic model, Partial sum of squares-type III
| Source | Sum of squares | Df | Mean square | F-value | p-value | |
| Model | 938.97 | 5 | 187.79 | 12.99 | 0.002 | Significant |
| A-Glyceryl Monostearate | 0.2996 | 1 | 0.2996 | 0.0207 | 0.8896 | |
| B-Tween 80 | 60.99 | 1 | 60.99 | 4.22 | 0.0791 | |
| AB | 65.85 | 1 | 65.85 | 4.55 | 0.0703 | |
| A² | 727.11 | 1 | 727.11 | 50.28 | 0.0002 | |
| B² | 31.45 | 1 | 31.45 | 2.18 | 0.1838 | |
| Residual | 101.22 | 7 | 14.46 | |||
| Lack of Fit | 55.88 | 3 | 18.63 | 1.64 | 0.3142 | not significant |
| Pure Error | 45.34 | 4 | 11.34 | |||
| Cor total | 1040.2 | 12 |
#df = degree of freedom, f-value = f statistics, p-value = Probability value.
(d) Response (Y4) – Zeta potential, ANOVA for response surface Quadratic model, Partial sum of squares-type III
| Source | Sum of squares | Df | Mean square | F-value | p-value | |
| Model | 1065.53 | 5 | 213.11 | 44.3 | <0.0001 | Significant |
| A-Glyceryl Monostearate | 2.02 | 1 | 2.02 | 0.4197 | 0.5377 | |
| B-Tween 80 | 53.72 | 1 | 53.72 | 11.17 | 0.0124 | |
| AB | 89.87 | 1 | 89.87 | 18.68 | 0.0035 | |
| A² | 865.49 | 1 | 865.49 | 179.91 | <0.0001 | |
| B² | 12.09 | 1 | 12.09 | 2.51 | 0.1569 | |
| Residual | 33.67 | 7 | 4.81 | |||
| Lack of Fit | 15.24 | 3 | 5.08 | 1.1 | 0.4455 | not significant |
| Pure Error | 18.43 | 4 | 4.61 | |||
| Cor total | 1099.2 | 12 |
#df = degree of freedom, f-value = f statistics, p-value = Probability value.
(e) Response (Y5) – Drug release (%), ANOVA for response surface Quadratic model, Partial sum of squares-type III
| Source | Sum of squares | df | Mean square | F-value | p-value | |
| Model | 1270.75 | 5 | 254.15 | 11.99 | 0.0025 | Significant |
| A-Glyceryl Monostearate | 0.0006 | 1 | 0.0006 | 0 | 0.9958 | |
| B-Tween 80 | 77.5 | 1 | 77.5 | 3.66 | 0.0974 | |
| AB | 90.25 | 1 | 90.25 | 4.26 | 0.0779 | |
| A² | 1046.04 | 1 | 1046.04 | 49.37 | 0.0002 | |
| B² | 10.65 | 1 | 10.65 | 0.5028 | 0.5012 | |
| Residual | 148.33 | 7 | 21.19 | |||
| Lack of Fit | 83.13 | 3 | 27.71 | 1.7 | 0.3038 | not significant |
| Pure Error | 65.2 | 4 | 16.3 | |||
| Cor total | 1419.08 | 12 |
#df = degree of freedom, f-value = f statistics, p-value = Probability value.
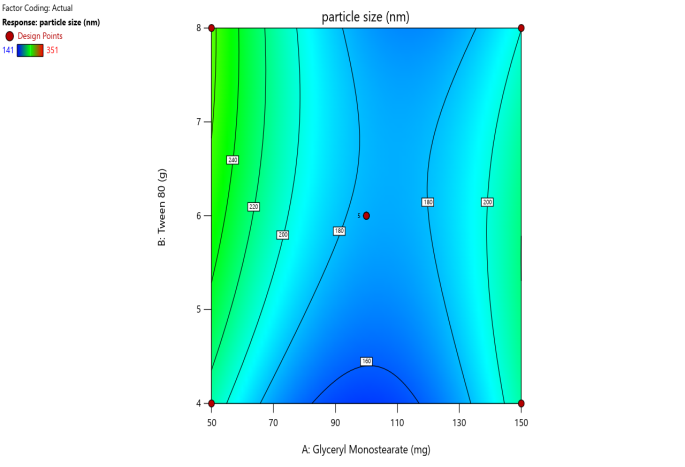
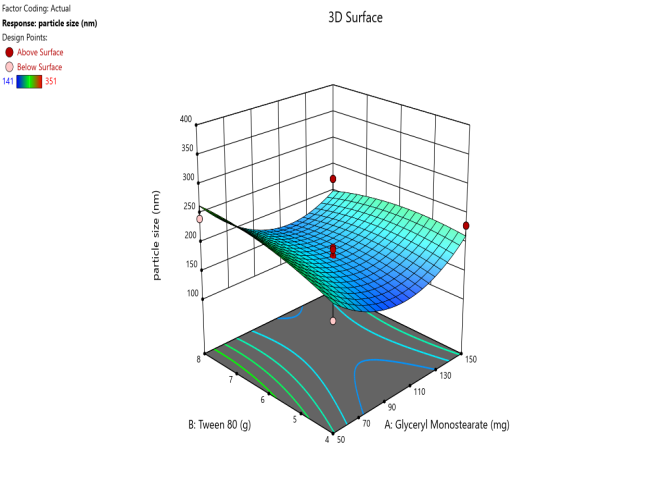
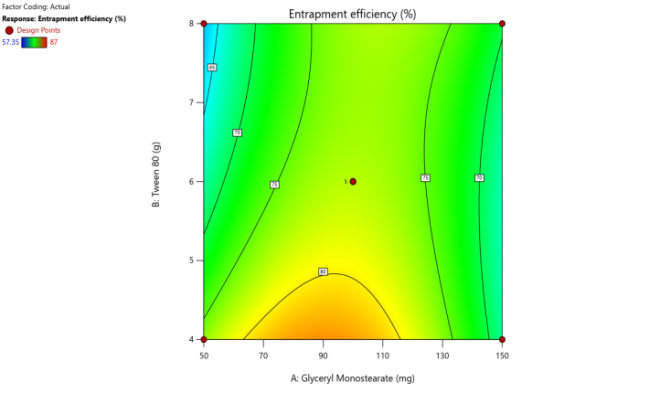
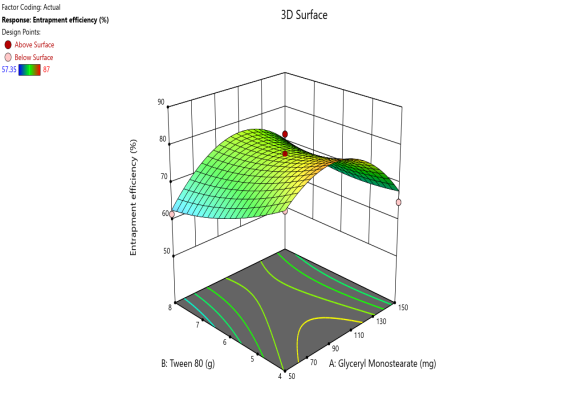
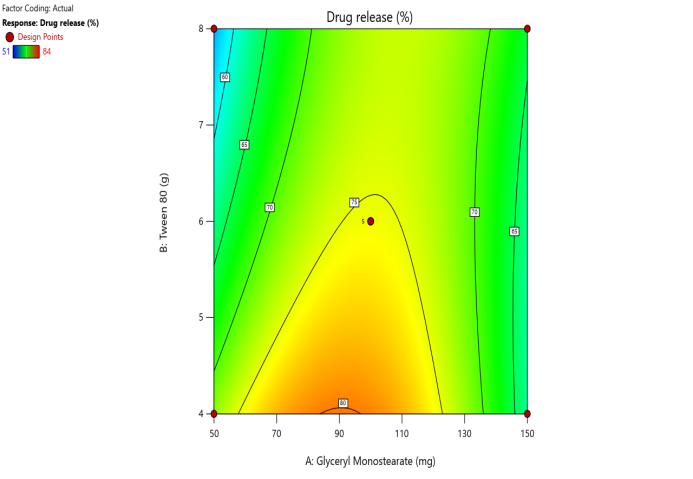
The contour plots and 3D surface plots for particle size, PDI, EE, zeta potential, and Drug release were shown in fig. 2. The particle size of the SLN formulation was reduced with the increase in lipid and surfactant concentration [31, 32]. Surfactant concentration appreciation reduces the surface tension and stabilizes the newly formed lipid layer formulation to minimize the particle size [33].
(a) (b)
(c) (d)
(e) (f)
(g) (h)
(i) (j)
(k)
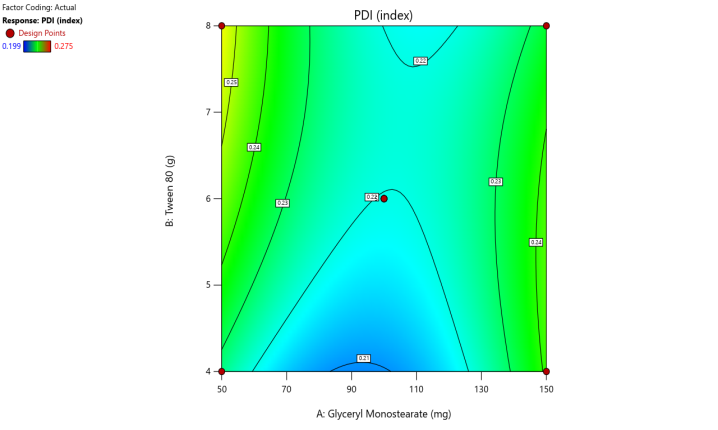
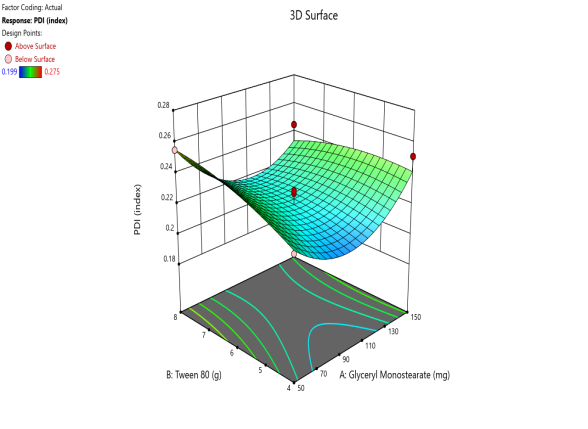
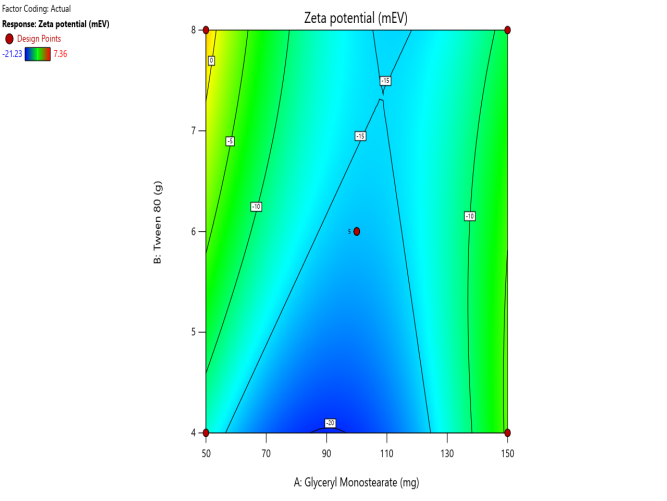
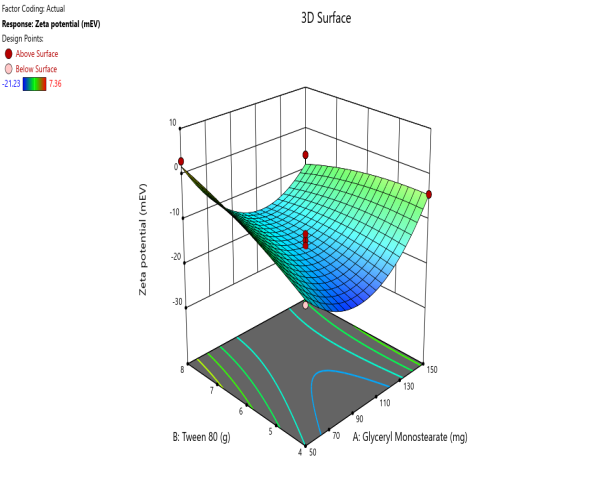
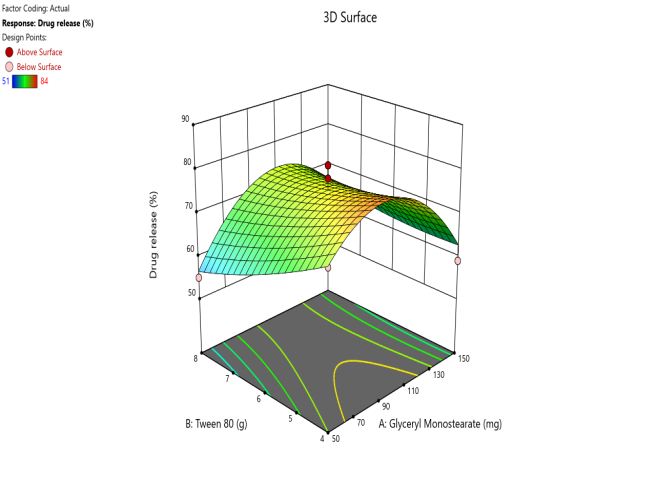
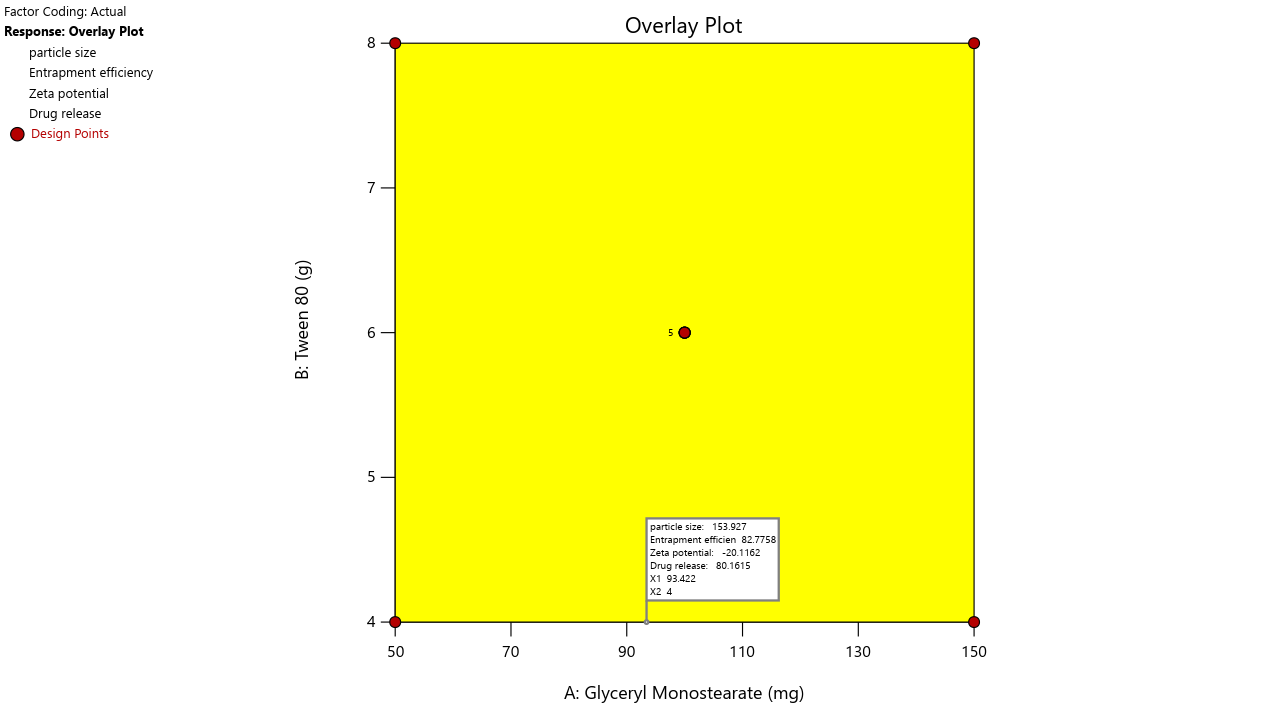
Fig. 5. Contour plots and 3D surface plots and Overlay plots of the design variables (a) Contour plot of Y1 (particle size) (b) 3D surface plot of Y1 (c) Contour plot of Y2 (PDI) (d) 3D surface plot of Y2 (e) Contour plot of Y3(entrapment efficiency) (f) 3D surface plot of Y3 (g) Contour plot of Y4 (Zeta potential) (h) 3D surface plot of Y4 (i) Contour plot of Y5 (drug release) (j) 3D surface plot of Y5 (k) overlay plot of optimization technique
Response surface method of SLN provides a way to identify the optimized formulation with the desirable constraints. All the formulations were studied for the particle size, PDI, EE, Zeta potential, and Drug release.
Table 5: ENP-CCD formulation runs with factors and their response values.
| ENP-CCD Response surface method of design of experiment | |||||||
| Run | A: GMS | B: Tween 80 | Particle size | PDI | Entrapment efficiency | Zeta potential | Drug release |
| Mg | Mg | Nm | index | % | mEV | % | |
| 1 | 100 | 6 | 175±0.11 | 0.217±0.01 | 77.84±2.4 | -15.76±0.01 | 74±1.1 |
| 2 | 100 | 6 | 153±0.3 | 0.207±0.02 | 83±3.1 | -18.46±0.02 | 81±2.5 |
| 3 | 170.7107 | 6 | 241.24±0.9 | 0.253±0.1 | 61±2.3 | 4.32±0.1 | 56±3.1 |
| 4 | 29.28932 | 6 | 351±0.3 | 0.275±0.06 | 57.35±3.1 | 7.36±0.2 | 51±2.0 |
| 5 | 100 | 6 | 188±0.4 | 0.229±0.1 | 75±2.0 | -17.36±0.5 | 78±1.9 |
| 6 | 100 | 3.171573 | 141±0.2 | 0.199±0.2 | 87±2.5 | -21.23±0.5 | 84±3.2 |
| 7 | 50 | 4 | 182.98±0.1 | 0.225±0.3 | 76.34±1.6 | -13.87±0.1 | 72±2.6 |
| 8 | 100 | 8.828427 | 163±0.5 | 0.211±0.1 | 80.75±1.9 | -16.98±0.1 | 77±2.1 |
| 9 | 100 | 6 | 191.81±0.5 | 0.227±0.002 | 74.57±2.4 | 13.09±0.11 | 71±1.5 |
| 10 | 50 | 8 | 241.71±0.7 | 0.255±0.007 | 61.6±2.9 | 2.97±0.12 | 55±1.2 |
| 11 | 150 | 4 | 230.1±0.8 | 0.251±0.004 | 64.87±3.2 | -4.25±0.08 | 59±2.1 |
| 12 | 150 | 8 | 222.78±0.3 | 0.245±0.4 | 66.36±2.02 | -6.37±0.09 | 61±1.14 |
| 13 | 100 | 6 | 177±0.4 | 0.219±0.5 | 77.12±1.23 | 14.54±0.03 | 73±1.18 |
#mEV-milli electron volts; Nm-nano meter; GMS – Glyceryl monostearate, #All the values are represented as mean±SD (where n=3).
Table 5: Dependent and Independent variables and their coded values in CCD
| Independent variables | Symbol | Levels | ||||
| -α | -1 | 0 | +1 | +α | ||
| GMS | A | 29.28 | 50 | 100 | 150 | 170.71 |
| Tween80 | B | 3.17 | 4 | 6 | 8 | 8.82 |
| Dependent variables | Units | Constraints | ||||
| Particle Size | Nm | Minimum | ||||
| PDI | Index | Minimum | ||||
| EE | % | Maximum | ||||
| Zeta potential | mEV | Within the range | ||||
| Drug release | % | Maximum | ||||
Particle size falls between 141-241.74 nm range as per the present study, the polynomial equation reveals that the surfactant has a significant positive effect when compared with the GMS. Tween80 concentration increase may be indicated by a decrease in particle size, clearly by the positive sign. PDI values also reveal no effect of GMS at low levels. Surfactant has a positive, low-level effect with an increase in concentration. The coefficient of determination (R2) and adjusted (R2) values are calculated as 0.855 and 0.795, respectively 7% noise was identified in the model. The value of CV (coefficient of variation) is an estimation of SD and mean values, also indicating the (4.89) precision and reliability of the model. A lower CV value suggests less dispersion around the mean, indicating greater accuracy and reliability in the data or model estimates [34].
ANOVA F-value indicated as p-value less than 0.05, which is significant. The lack of fit F-value is 6.23, and p>0.05, which is not substantial. Hence, the polynomial equation is fitted to the model for particle size (refer table no.4). PDI statistical ANOVA values are represented in table 3(b) to depict the model f-value and p-value (9.43 and 0.005), and the lack of fit f-value is 2 and p-value is 0.2558 (p>0.05), which is not significant [35]. When an ANOVA F-value yields a p-value less than 0.05, it indicates a statistically significant difference among group means, suggesting the model is significant. Conversely, a lack of fit F-value with p>0.05 is considered not substantial, meaning there is no evidence that the model fails to adequately fit the data. Therefore, in this situation, the polynomial equation is considered suitable for modelling particle size, as the overall model is significant, and the lack of fit is not [36].
A polynomial equation for responses like particle size is
Particle size =189.5171 – 3.99981 A+62.61379 B-0.16513 AB+0.023365 A2-3.41197 B2
Polynomial equation for the PDI is
PDI = 0.206889 – 0.00146 A+0.026636 B-0.00009 AB+9.79E-06A2-0.00126 B2
Three-dimensional response surface plots are drawn between GMS, Tween 80, and Particle size, representing the interaction of the GMS and Tween 80 as particle size decreases with the increase in GMS, and a less significant effect of Tween 80 is registered. The above indication was confirmed by the contour plots alignment (fig. 5 represents the variables 3D and contour plots) [37, 38].
Entrapment efficiency is the major constraint to show the possible drug loading effect in the SLN formulation to show the therapeutic effect. F-value of the model is 12.99 and p-value is 0.002, which is significant. As the surfactant shows a higher effect than GMS as per the polynomial equation value. Surfactant hurts EE that is as the surfactant concentration increases, EE reduces in nature. 3D and Contour plots specify the nature of ingredients' effect on formulation constraints. In a regression equation, a positive coefficient for a factor indicates that the response variable increases as the factor increases, whereas a negative coefficient suggests that the response decreases with an increase in that factor [38].
Polynomial equation for the Entrapment efficiency
EE = 88.76422+0.57057 A-11.8172 B+0.040575 AB-0.00409 A2-0.531594 B2
The polynomial equation for the Zeta potential is
Zeta potential =-18.3-0.617 A+9.9907 B-0.0474 AB+0.004462 A2– 0.3295B2
For the zeta potential response, there is a significant positive effect of surfactant, i. e., increasing surfactant concentration leads to higher potential charge generation, and GMS has a low level of negative effect.
Drug release studies are showing the f-value of 11.99 with p<0.005 is significant. Lack of fit has 1.7 f-value and p>0.005 shows not significant. Polynomial equation depicts the negative effect of surfactant when comparing with the GMS. DR increased with the less amount of surfactant concentration. 3D and Contour plots reveal the suggested decision to conclude the remarks.
Polynomial Equation for the Drug release is
Drug release = 75.30704+0.6961 A-10.01 B+0.0475 AB – 0.0049 A2-0.3093 B2.
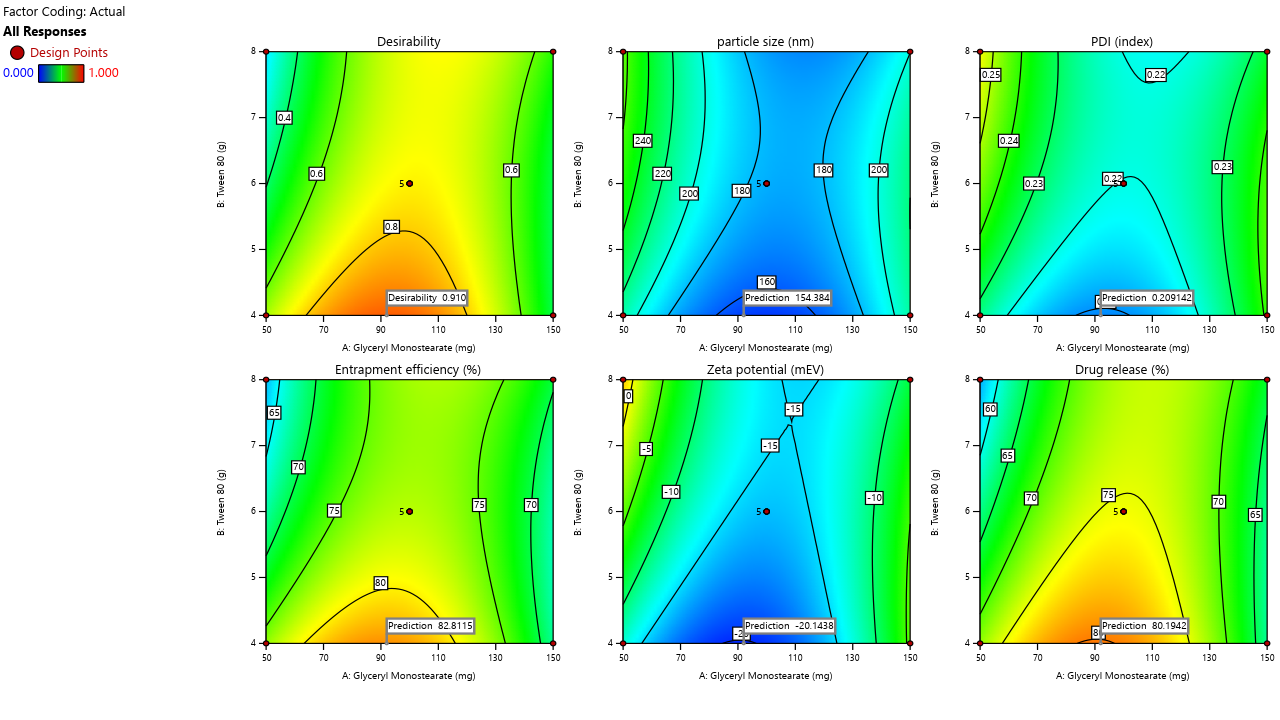
Fig. 6: All responses with desirable plot values
Table 7: Desirable properties of variables and constraints
| Number | GMS | Tween 80 | particle size | PDI | EE | Zeta potential | Drug release | Desirability |
| 1 | 92.023 | 4 | 154.384±0.23 | 0.209±0.02 | 82.811±0.23 | -20.144±0.001 | 80.194±1.2 | 0.91 |
| 2 | 92.43 | 4 | 154.242±0.1 | 0.209±0.01 | 82.803±0.34 | -20.138±0.02 | 80.187±2.2 | 0.909 |
| 3 | 93.422 | 4 | 153.927±0.2 | 0.209±0.01 | 82.776±0.45 | -20.116±0.03 | 80.161±1.2 | 0.909 |
| 4 | 95.085 | 4 | 153.501±0.3 | 0.209±0.02 | 82.713±0.32 | -20.06±0.04 | 80.097±2.5 | 0.908 |
| 5 | 110.887 | 8 | 169.346±0.23 | 0.219±0.001 | 77.228±0.35 | -15.182±0.04 | 73.98±1.4 | 0.751 |
| 6 | 109.852 | 8 | 169.515±0.11 | 0.219±0.02 | 77.236±0.36 | -15.169±0.04 | 73.987±0.23 | 0.751 |
#All the values represent in Mean±SD (where n=3). The desirable plots were drawn to show the actual and predicted values. This characterization may enhance the outcome of the optimization to select the best formulation with desirable properties.
Acute toxicity testing of EDN in wistar rats
EDN were shown to be non-toxic in an acute oral toxicity study following OECD guidelines 423. Animals given 2000 mg/kg of EDN showed no signs of lethargy, toxicity, or aberrant behavior. Since the ED50 is often defined as being 10% of the LD50, the ED50 of EDN NPs was determined to be 2 mg/kg and 4 mg/kg for the investigation. The results of the studies conducted on rats are included in table 7.
Table 8: Acute toxicity study of ENPs at a dose of 2000 mg/kg
| Parameters | 1sth | 2ndh | 3rdh | 4thh |
| Piloerection | - | - | - | - |
| Edema | - | - | - | - |
| Urine stains | - | - | - | - |
| Alopecia | - | - | - | - |
| Loss of writhing reflux | - | - | - | - |
| Circling | - | - | - | - |
| Nasal sniffing | + | + | + | + |
| Lacrimation | - | - | - | - |
| Seizures | - | - | - | - |
| Righting reflex | + | + | + | + |
| Grip strength | + | + | + | + |
| Eye closure at touch | + | + | + | + |
| Rearing | + | + | + | + |
| Straub tail | - | - | - | - |
+=Present/affected,-=Absent/not affected
Table 9: Protective effect of ENP on scopolamine-induced memory and behavioral
| Group | Drug treatment | % Alternation |
| I | Control | 69.3±5.00 |
| II | Scopolamine | 24.5±3.39α |
| III | Donepezil | 61.3±5.68a |
| IV | ENP-Low | 44.83±3.81a |
| V | ENP-High | 53.5±4.41a |
Impairment in the Y-Maze test
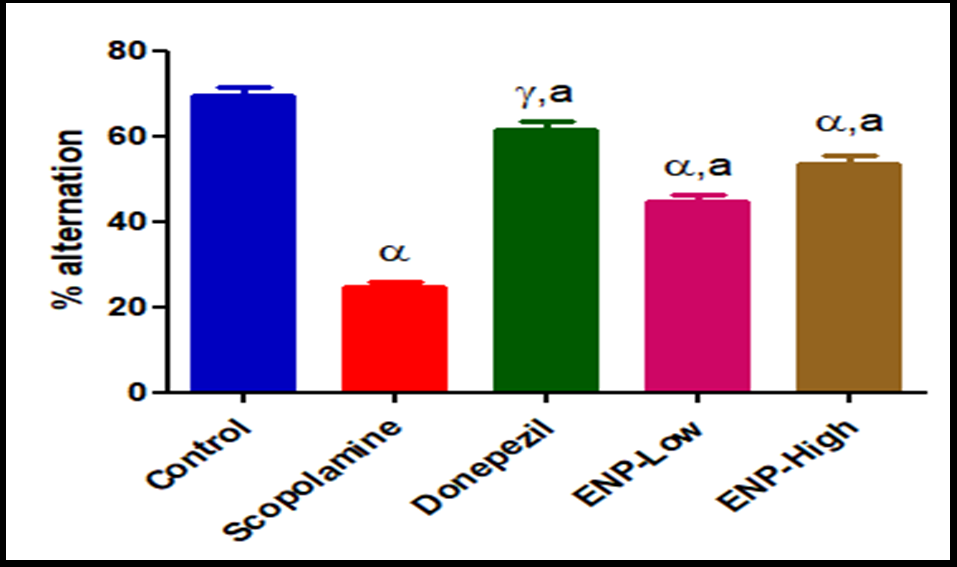
Fig. 8: Protective effect of ENP on scopolamine-induced memory and behavioral impairment in the Y-maze test, #Bars with "α" are significantly different from the control, #Groups labeled only "a" are not significantly different from each other.
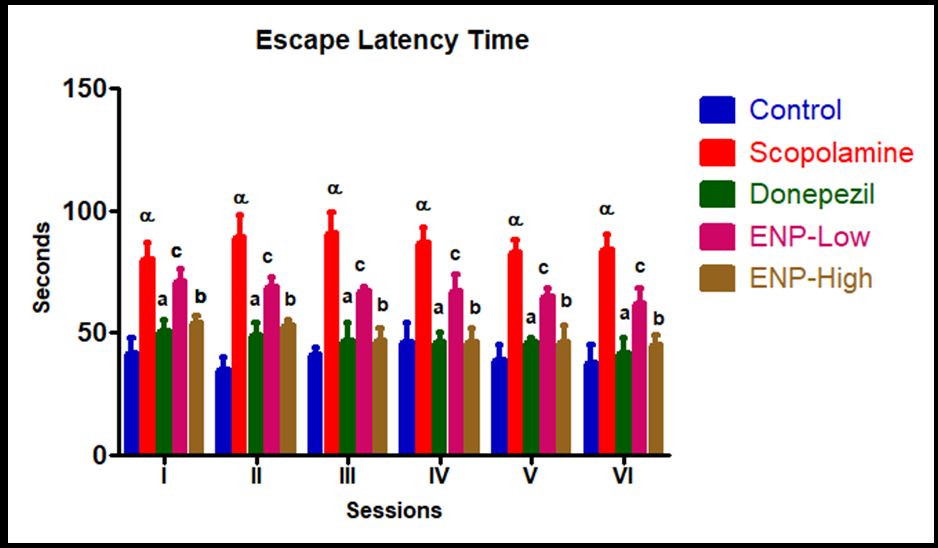
Fig. 9: Effect of ENP on the acquisition of spatial memory by the morris water maze test, #For each session, Scopolamine bars marked α are significantly different from control and other groups, #within each session, bars marked a, b, c indicates which groups' escape latency times are significantly different from others, #If bars share a letter, their means are statistically similar for that session
Table 10: Effect of ENP on retention of spatial memory by Morris water maze.
| Group | Drug treatment | Probe trial | |
| I | II | ||
| I | Control | 52±5.21 | 58±6.1 |
| II | Scopolamine | 74±6.7α | 86±5.4α |
| III | Donepezil | 57±4.8a | 64±5.7a |
| IV | ENP-Low | 61±3.9c | 63±3.5c |
| V | ENP-High | 59±2.8b | 55±4.7b |
#All the values represented in mean±SD (where n=3)
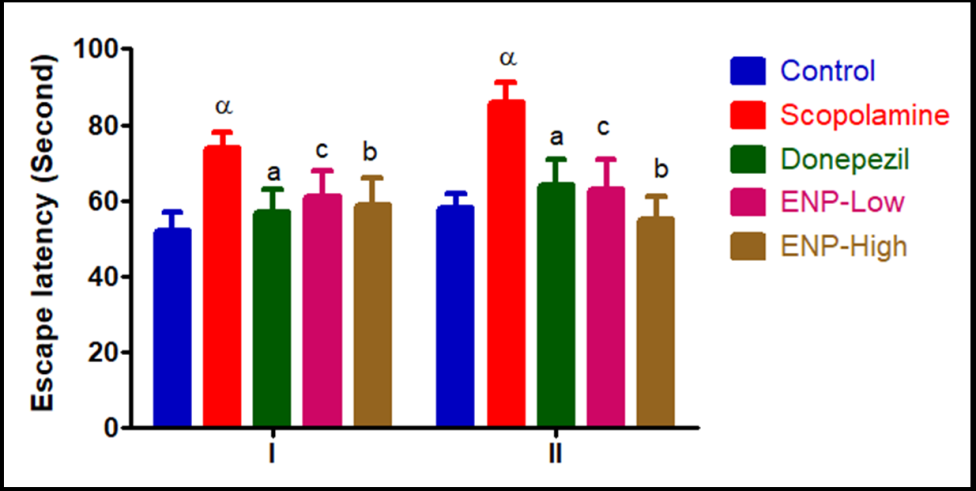
Fig. 10: Effect of ENP on retention of spatial memory by morris water maze, #For each session, scopolamine bars marked α are significantly different from control and other groups, #Within each session, bars marked a, b, c indicate which groups' escape latency times are significantly different from others, #If bars share a letter, their means are statistically similar for that session
Using the Y-maze test to record the rats' spontaneous alternation behavior, researchers looked at how ENPs affected their spatial working memory. In this study, the behavioral alteration score of 24.5±3.39% was considerably lower in the scopolamine (2 mg/kg) treatment group compared to the control group's 69±5.00%. Compared to the scopolamine group and the control group, the ENP-treated groups significantly increased the spontaneous alternation (44.83±3.81% for low dosage and 53.5±4.41±2.84% for high dose, respectively) (fig. 9). Rats given scopolamine showed much more locomotor activity than the control group. Using ENP significantly reduced the number of augmented arm entries. These results suggest that ENP may reduce the locomotor activity generated by scopolamine. Consistent with previous research, this study found that scopolamine-treated rats exhibited less spontaneous change behavior compared to control rats [31].
Morri’s water-maze test was used to investigate ENP's influence on memory enhancement as well. The animals were trained in four daily attempts to find the platform. The acquisition study ran for six days before scopolamine injection. Recorded as escape latency in seconds, their spatial learning scores were the findings of the experiment, indicating that the scopolamine-administered group showed a notable drop in escape latency relative to the control (fig. 10).
The rats underwent the spatial probe experiment on day 11, 24 h after the fourth training session, to assess their recall of the platform's location. The average duration in the target quadrant (i. e., percentage of time spent in the quadrant containing the target platform) was significantly reduced in the scopolamine-treated rats compared to the vehicle control during the acquisition trial. ENP low and high dose therapy significantly increased the duration spent in the target quadrant compared to those treated alone with scopolamine. The rats underwent an additional spatial memory probing experiment on day 14, 24 h after the last training session. The data indicated a significant difference between the vehicle control and the scopolamine-treated rats; however, it was equivalent to the results of the initial probe session. Furthermore, the rat administered ENP far surpassed the one treated alone with scopolamine. Scientific studies indicate that cholinergic dysfunction is a primary pathogenic process occurring in the neocortex and hippocampus, regions of the brain that govern learning, memory, and behavior. The results of the behavioral investigation indicate that ENP therapy dosage-dependently reduced the scopolamine-induced deficits in memory and recall in the rat brain.
CONCLUSION
SLN formulations are the most favorable novel drug delivery systems to deliver the drug through the nasal route of administration to improve the brain delivery of EDN. The reduced particle size of less than 200 nm is required to cross the olfactory channels in the nose, the nose-to-brain delivery pathway, and it was achieved by the formulation showing GMS (93.422 mg) and Tween 80 (4 mg). The other parameters were also optimized by the observations drawn in favor of the design of experiments. In vivo studies reveal data related to the improvement in behavioral activities.
ABBREVIATIONS
SLN-Solid Lipid Nanoparticles, CCD-Central Composite Design, DoE-Design of Experiments, EE-Entrapment Efficiency, EDN-Edaravone, PDI-Polydispersity Index, NLC-Nanostructured lipid carriers, BBB-Blood-brain barrier, QbD-Quality by Design, CNS-Central nervous system, GMS-Glyceryl monostearate, ANOVA-Analysis of Variance, FTIR-Fourier Transform Infra-red, DSC-Differential Scanning Calorimetry, Nm-Nanometer, DR-Drug release, mEV-Milli Electro volte’s, PBS-Phosphate buffer saline, SD-standard deviation, CMA-critical Measurement attributes, ENP-Edaravone nanoparticle, RMP-Revolutions per minute.
FUNDING
Nil
AUTHORS CONTRIBUTIONS
All the authors are contributed their ideas from the inception of the research work. Primary author involved in the data collection, framework of the draft and development of the manuscript writings. Corresponding author involved in proofreading and editing of the manuscript.
CONFLICT OF INTERESTS
Declared none
REFERENCES
Astruc D. Introduction to nanomedicine. Molecules. 2015;21(1):E4. doi: 10.3390/molecules21010004, PMID 26791291.
Pentu N, Namitha G, Chandrika KU, Ram KA, Vallala VR, Morsu A. Targeted lipid-based vesicles as drug delivery systems in cancer treatment. Int J Pharm Investigation. 2025 Apr;15(3):770-6. doi: 10.5530/ijpi.20250171.
Girdhar V, Patil S, Banerjee S, Singhvi G. Nanocarriers for drug delivery: mini review. Curr Nanomed. 2018 Nov;8(2):88-99. doi: 10.2174/2468187308666180501092519.
Mistry A, Stolnik S, Illum L. Nanoparticles for direct nose-to-brain delivery of drugs. Int J Pharm. 2009;379(1):146-57. doi: 10.1016/j.ijpharm.2009.06.019, PMID 19555750.
Mittal D, Ali A, Md S, Baboota S, Sahni JK, Ali J. Insights into direct nose to brain delivery: current status and future perspective. Drug Deliv. 2014 Mar;21(2):75-86. doi: 10.3109/10717544.2013.838713, PMID 24102636.
Pandey S, Nainwal N, Negi T, Lohar AK, Kumar S, Kumar S. Nose-to-brain delivery of microcarrier in the treatment of neurodegenerative diseases. J Appl Pharm Sci. 2024;15(3):22-9. doi: 10.7324/JAPS.2025.211124.
Pottoo FH, Sharma S, Javed MN, Barkat MA, Harshita, Alam MS. Lipid-based nanoformulations in the treatment of neurological disorders. Drug Metab Rev. 2020 Jan;52(1):185-204. doi: 10.1080/03602532.2020.1726942, PMID 32116044.
Giunchedi P, Gavini E, Bonferoni MC. Nose-to-brain delivery. Pharmaceutics. 2020;12(2):138. doi: 10.3390/pharmaceutics12020138, PMID 32041344.
Ribeiro ME, De Moura CL, Vieira MG, Gramosa NV, Chaibundit C, De Mattos MC. Solubilisation capacity of Brij surfactants. Int J Pharm. 2012 Oct;436(1-2):631-5. doi: 10.1016/j.ijpharm.2012.07.032, PMID 22842626.
Shimizu H, Nishimura Y, Shiide Y, Yoshida K, Hirai M, Matsuda M. Bioequivalence study of oral suspension and intravenous formulation of edaravone in healthy adult subjects. Clin Pharmacol Drug Dev. 2021 Oct;10(10):1188-97. doi: 10.1002/cpdd.952, PMID 33955162.
Shimizu H, Nishimura Y, Shiide Y, Akimoto M, Yashiro M, Ueda M. Pharmacokinetics of edaravone oral suspension in patients with amyotrophic lateral sclerosis. Clin Ther. 2023 Dec;45(12):1251-8. doi: 10.1016/j.clinthera.2023.09.025, PMID 37953075.
Dinda A, Biswal I, Chowdhury P, Mohapatra R. Formulation development and evaluation of paclitaxel-loaded solid lipid nanoparticles using glyceryl monostearate. J Appl Pharm Sci. 2013;3(8):133-8. doi: 10.7324JAPS.2013.3823.
Helgason T, Awad TS, Kristbergsson K, McClements DJ, Weiss J. Effect of surfactant surface coverage on formation of solid lipid nanoparticles (SLN). J Colloid Interface Sci. 2009 Jun;334(1):75-81. doi: 10.1016/j.jcis.2009.03.012, PMID 19380149.
Eller RH, Eder KM, Gohla S. Solid lipid nanoparticles (SLN) for controlled drug delivery a review of the state of the art. European Journal of Pharmaceutics and Biopharmaceutics. 2000 Jul 3;50(1):161-77. doi: 10.1016/S0939-6411(00)00087-4.
Hassan H, Adam SK, Alias E, Meor Mohd Affandi MM, Shamsuddin AF, Basir R. Central composite design for formulation and optimization of solid lipid nanoparticles to enhance oral bioavailability of acyclovir. Molecules. 2021 Sep;26(18):5432. doi: 10.3390/molecules26185432, PMID 34576904.
Hao J, Wang F, Wang X, Zhang D, Bi Y, Gao Y. Development and optimization of baicalin-loaded solid lipid nanoparticles prepared by coacervation method using central composite design. Eur J Pharm Sci. 2012 Sep;47(2):497-505. doi: 10.1016/j.ejps.2012.07.006, PMID 22820033.
Tavares Luiz M, Santos Rosa Viegas J, Palma Abriata J, Viegas F, Testa Moura De Carvalho Vicentini F, Lopes Badra Bentley MV. Design of experiments (DoE) to develop and to optimize nanoparticles as drug delivery systems. Eur J Pharm Biopharm. 2021;165:127-48. doi: 10.1016/j.ejpb.2021.05.011, PMID 33992754.
Laxmi BV, Bhikshapathi DV, Rajesham VV, Poornima P, Sandhya P, Arjun G. Maximizing the potential of ibrutinib: multi-factor optimization and interaction analysis for improved nanobubble formulation and bioavailability performance. Int J App Pharm. 2025;17(5):214-26. doi: 10.22159/ijap.2025v17i5.54081.
Vaishnavi CE, Ajitha Azhakesan Narendra Pentu. QBD approach for the development of nanosponge-loaded topical gel of fucoidan for the treatment of rheumatoid arthritis: in vitro ex-vivo and in vivo assessment. Int J App Pharm. 2025;17(2):402-14. doi: 10.22159/ijap.2025v17i2.52746.
Souto EB, Fangueiro JF, Fernandes AR, Cano A, Sanchez Lopez E, Garcia ML. Physicochemical and biopharmaceutical aspects influencing skin permeation and role of SLN and NLC for skin drug delivery. Heliyon. 2022 Feb;8(2):e08938. doi: 10.1016/j.heliyon.2022.e08938, PMID 35198788.
Sathya S, Manogari BG, Thamaraiselvi K, Vaidevi S, Ruckmani K, Devi KP. Phytol-loaded PLGA nanoparticles ameliorate scopolamine-induced cognitive dysfunction by attenuating cholinesterase activity, oxidative stress and apoptosis in Wistar rat. Nutr Neurosci. 2022 Mar;25(3):485-501. doi: 10.1080/1028415X.2020.1764290, PMID 32406811.
Shehata MK, Ismail AA, Kamel MA. Nose to brain delivery of astaxanthin-loaded nanostructured lipid carriers in rat model of Alzheimer’s disease: preparation in vitro and in vivo evaluation. Int J Nanomedicine. 2023 Mar;18:1631-58. doi: 10.2147/IJN.S402447, PMID 37020692.
Subramanian M, Munuswamy K, Pitchaimuthu P. Neuroprotective effects of withaferin a nanoparticles on scopolamine rat model of Alzheimer’s disease. Indian J Pharm Educ Res. 2023 Jul;57(3s):s620-5. doi: 10.5530/ijper.57.3s.70.
Danish SM, Gupta A, Khan UA, Hasan N, Ahmad FJ, Warsi MH. Intranasal cerium oxide nanoparticles ameliorate cognitive function in rats with Alzheimer’s via anti-oxidative pathway. Pharmaceutics. 2022 Mar;14(4):756. doi: 10.3390/pharmaceutics14040756, PMID 35456590.
Maurice T, Lockhart BP, Privat A. Amnesia induced in mice by centrally administered β-amyloid peptides involves cholinergic dysfunction. Brain Res. 1996 Jan;706(2):181-93. doi: 10.1016/0006-8993(95)01032-7, PMID 8822355.
Morris R. Developments of a water-maze procedure for studying spatial learning in the rat. J Neurosci Methods. 1984 May;11(1):47-60. doi: 10.1016/0165-0270(84)90007-4, PMID 6471907.
Demetzos C. Differential scanning calorimetry (DSC): a tool to study the thermal behavior of lipid bilayers and liposomal stability. J Liposome Res. 2008 Sep;18(3):159-73. doi: 10.1080/08982100802310261, PMID 18770070.
Correia AC, Moreira JN, Sousa Lobo JM, Silva AC. Design of experiment (DoE) as a quality by design (QbD) tool to optimise formulations of lipid nanoparticles for nose-to-brain drug delivery. Expert Opin Drug Deliv. 2023 Dec;20(12):1731-48. doi: 10.1080/17425247.2023.2274902, PMID 37905547.
Yu LX, Amidon G, Khan MA, Hoag SW, Polli J, Raju GK. Understanding pharmaceutical quality by design. AAPS J. 2014;16(4):771-83. doi: 10.1208/s12248-014-9598-3, PMID 24854893.
Gupta S, Kesarla R, Chotai N, Misra A, Omri A. Systematic approach for the formulation and optimization of solid lipid nanoparticles of efavirenz by high-pressure homogenization using design of experiments for brain targeting and enhanced bioavailability. BioMed Res Int. 2017 Jan;2017:5984014. doi: 10.1155/2017/5984014, PMID 28243600.
Shah B, Khunt D, Bhatt H, Misra M, Padh H. Application of quality by design approach for intranasal delivery of rivastigmine loaded solid lipid nanoparticles: effect on formulation and characterization parameters. Eur J Pharm Sci. 2015;78:54-66. doi: 10.1016/j.ejps.2015.07.002, PMID 26143262.
Pezeshki A, Zirak MB. Effect of surfactant concentration on the particle size stability and potential zeta of beta carotene nano lipid carrier. IJCMAS. 2015;4(9):924-32.
Reed GF, Lynn F, Meade BD. Use of coefficient of variation in assessing variability of quantitative assays. Clin Diagn Lab Immunol. 2002 Nov;9(6):1235-9. doi: 10.1128/CDLI.9.6.1235-1239.2002, PMID 12414755.
Yasir M, Sara UV, Chauhan I, Gaur PK, Singh AP, Puri D. Solid lipid nanoparticles for nose to brain delivery of donepezil: formulation optimization by box–behnken design in vitro and in vivo evaluation. Artif Cells Nanomed Biotechnol. 2017;46(8):1-14. doi: 10.1080/21691401.2017.1394872.
Kwak S. Are only p-values less than 0.05 significant? A p-value greater than 0.05 is also significant. J Lipid Atheroscler. 2023 May;12(2):89-95. doi: 10.12997/jla.2023.12.2.89, PMID 37265851.
Vakilinezhad MA, Tanha S, Montaseri H, Dinarvand R, Azadi A, Akbari Javar HA. Application of response surface method for preparation optimization and characterization of nicotinamide-loaded solid lipid nanoparticles. Adv Pharm Bull. 2018;8(2):245-56. doi: 10.15171/apb.2018.029, PMID 30023326.
Siddiqui A, Alayoubi A, El Malah Y, Nazzal S. Modeling the effect of sonication parameters on size and dispersion temperature of solid lipid nanoparticles (SLNs) by response surface methodology (RSM). Pharm Dev Technol. 2014 May;19(3):342-6. doi: 10.3109/10837450.2013.784336, PMID 23590412.
Hao J, Fang X, Zhou Y, Wang J, Guo F, Li F. Development and optimization of solid lipid nanoparticle formulation for ophthalmic delivery of chloramphenicol using a box-behnken design. Int J Nanomedicine. 2011;6:683-92. doi: 10.2147/IJN.S17386, PMID 21556343.