
Int J App Pharm, Vol 17, Issue 6, 2025, 241-254Original Article
DEVELOPMENT AND OPTIMIZATIONS OF TRANSETHOSOMAL GEL LOADED WITH RUBIA CORDIFOLIA EXTRACT FOR TREATMENT OF PSORIASIS
POOJA GAJANAN AKOSHKAR*, RAHUL DNYANESHWAR KHAIRE, VIKAS DAMU KUNDE
Department of Pharmaceutics, PRES’s College of Pharmacy (For Women), Chincholi, Sinnar, Nashik-422102, India
*Corresponding author: Pooja Gajanan Akoshkar; *Email: ashaakoshkar@gmail.com
Received: 26 Mar 2025, Revised and Accepted: 07 Oct 2025
ABSTRACT
Objective: This study aimed to develop and optimize a transethosomal gel loaded with Rubia cordifolia extract to enhance its topical delivery and therapeutic efficacy for the treatment of psoriasis.
Methods: A box–behnken factorial design was employed to optimize transethosome formulations using three independent variables: Phospholipon 90 G, sodium deoxycholate, and ethanol concentration. Vesicle size, zeta potential, and entrapment efficiency were evaluated as responses. The optimized batch was incorporated into a gel using Carbopol 940 and Gellan gum. The formulations were assessed for physicochemical properties, ex-vivo skin permeation, and accelerated stability.
Results: Among 17 formulations, the optimized batch (F13), selected based on desirability and experimental validation, showed a vesicle size of 111.73 nm, zeta potential of −28.15 mV, and entrapment efficiency of 86.54%. The optimized transethosomal gel (TF3) exhibited pH of 6.02 ± 0.04, viscosity of 21,873 ± 157 cP, spreadability of 30.92 ± 1.15 g·cm/s, and drug content of 98.42 ± 0.95%. TF3 demonstrated sustained drug release (91.05 ± 2.32% over 12 h), steady-state flux of 7.59 µg/cm²/h for TF3 formulation and remained stable over three months under accelerated conditions.
Conclusion: The optimized transethosomal gel effectively enhanced the solubility, stability, and skin permeation of Rubia cordifolia extract. While permeation enhancement was demonstrated, anti-psoriatic efficacy validation through in vitro and in vivo studies is required to confirm therapeutic potential for psoriasis management. These findings suggest promising translational value, warranting further in vivo and clinical investigations.
Keywords: Rubia cordifolia, Transethosomes, Psoriasis, Topical delivery, Box–behnken design, Skin permeation
© 2025 The Authors. Published by Innovare Academic Sciences Pvt Ltd. This is an open access article under the CC BY license (https://creativecommons.org/licenses/by/4.0/)
DOI: https://dx.doi.org/10.22159/ijap.2025v17i6.55717 Journal homepage: https://innovareacademics.in/journals/index.php/ijap
INTRODUCTION
Psoriasis is an inflammatory disorder of hyperproliferation and abnormal differentiation of keratinocytes with inflammatory infiltrates. It occurs in about 2– 3 percent of the world population in varying degree [1]. The plaques are erythematous with silvery scales and often accompanied by itching, burning and pain. Apart from the physical discomfort, psoriasis significantly affects patient’s mental health and it even affects their quality of life as patients are often stigmatized socially and suffer emotionally [2]. The disease is not contagious in spite of which, it still creates tremendous burdens on the healthcare system due to its chronic course and need for long-term management [3]. Current treatment options for psoriasis, including topical agents, phototherapy, and systemic immunomodulators have a limited efficacy, adverse effects and poor patient adherence. These challenges highlight the critical need for new, efficacious, but safe and user-friendly therapeutic strategies [4].
Indian Madder, Rubia cordifolia (fig. 1) has shown promise for inducing regression of inflammatory and hyperproliferative conditions of the skin like psoriasis [5]. This medicinal plant has been reported to possess bioactive compounds such as diverse phytoconstituents, including anthraquinones, naphthoquinones, and flavonoids reported in literature to possess anti-inflammatory and antioxidant properties [6]. The present formulation study utilized standardized hydroalcoholic extract (70% ethanol, 12.4% yield) to develop an optimized delivery system, with phytochemical standardization being a scope for future pharmaceutical development [6]. Ethyl acetate fractions of Rubia cordifolia have been reported to exert antiproliferative and apoptotic effects against keratinocytes in HaCaT cells in preclinical studies, though the anti-psoriatic efficacy of the current formulation requires validation through appropriate in vitro and in vivo models [7]. These are actions that are important in treating the abnormal keratinocyte proliferation and differentiation occurring in. In addition, topical formulations of Rubia cordifolia extract have dramatically improved keratinocyte differentiation, as reflected in induction of granular layers in mouse tail models, and thus is a potential antipsoriatic agent. Though promising, the potential of the compound is severely hampered by its poor solubility and stability, which render it inappropriate for use in conventional formulations [8].
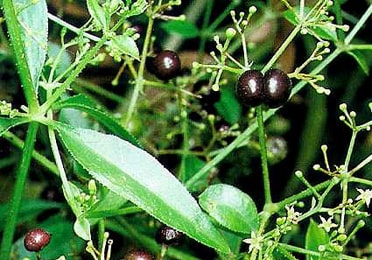
Fig. 1: Rubia cordifolia
Lipid-based nanocarriers transethosomes, possess the features of both ethosomes and transferosomes, in order to augment their delivery to skin [9]. These vesicles are phospholipid, ethanol, and edge activator-containing vesicles with flexibility and deformability to penetrate deep into the stratum corneum [10]. The synergetic ethanol and surfactant effect breaks the tight membrane packing of the skin to allow the vesicles to be delivered to targeted dermal layers of the skin, in the presence of both hydrophilic and lipophilic drugs. However, the manufacturing process utilizing ethanol and controlled temperature conditions may present scalability challenges. Industrial production would require addressing ethanol evaporation control, consistent temperature maintenance across larger volumes, and standardized mixing protocols to ensure batch-to-batch reproducibility of vesicle characteristics. Transethosomes have advantages of superior entrapment efficiency, stability, and skin permeability in comparison to traditional liposomes [11]. The aim of the delivery drug is to minimize systemic side effects, increase the drug concentration locally, which provide sustained release of the active ingredient and controlled release. Transethosomes feature these properties to be an ideal system to deliver Rubia cordifolia extract to psoriatic lesions to improve its therapeutic efficacy while overcoming weaknesses of low bioavailability and rapid degradation [12].
In this research attempt, a transethossal gel prepared with Rubia cordifolia extract was developed and optimized so that the treatment of psoriasis is efficient. Because no such formulation currently exists, this innovative formulation is expected to overcome the shortcomings posed by existing therapies: enhanced drug delivery, improved therapeutic efficacy, and better patient acceptability. This study hopes to fill critical gaps in the treatment landscape to further advance a better and more sustainable psoriasis treatment.
MATERIALS AND METHODS
Materials
Rubia cordifolia extract was obtained from Sciquaint Innovations Pvt. Ltd. (Pune, India). The extract was prepared using hydroalcoholic extraction (70% ethanol) at 60 °C for 6 h using Soxhlet extraction method with an extraction yield of 12.4% w/w, ensuring standardized phytochemical content and batch-to-batch consistency. Phospholipon 90 G (≥94% phosphatidylcholine) was sourced from Lipoid GmbH (Ludwigshafen, Germany). Sodium deoxycholate, ethanol (HPLC grade), and potassium bromide (IR grade) were procured from HiMedia, Merck, and Sigma-Aldrich (Mumbai and Bengaluru, India), respectively. Carbopol 940 (for bioadhesion and pseudoplastic rheology) was purchased from Lubrizol Advanced Materials India Pvt. Ltd. (Mumbai, India), Gellan gum (for thermoreversible gelling and spreadability) was obtained from CP Kelco India Pvt. Ltd. (Bengaluru, India), PEG 400 from Qualikems Fine Chem Pvt. Ltd. (Vadodara, India), Triethanolamine from Loba Chemie Pvt. Ltd. (Mumbai, India), and Benzalkonium Chloride from Central Drug House Pvt. Ltd. (New Delhi, India). All chemicals were of analytical/USP grade. Tween 80 (Polysorbate 80) was procured from Sigma-Aldrich (Mumbai, India) for maintaining sink conditions in permeation studies. All other reagents used were of analytical grade.
Methods
Calibration curve determination of Rubia cordifolia
To study the spectral characteristics of Rubia cordifolia extract, ethanol was used as a solvent where 10 mg of accurately weighed pure drug sample was transferred to a 100 ml calibrated volumetric flask, dissolved and made up to the mark with ethanol to prepare a stock solution (100 µg/ml), from which different aliquots (0.4, 0.8, 1.2, 1.6, 2.0, 2.4 ml) were withdrawn and transferred into separate 10 ml calibrated volumetric flasks, then diluted to the mark with ethanol to obtain working standard solutions ranging in concentration from 4-24 µg/ml. The solutions were absorped and the absorbance of them is measured at the λmax of 417 nm using the UV-1900 Shimadzu spectrophotometer [13].
Differential scanning colorimetry
It was assessed by Differential Scanning Calorimetry (DSC) on a Mettler Toledo DSC 3+(Mettler Toledo India Pvt. Ltd., Mumbai, India) coupled with heat flux Module, and run at a temperature ramp of 10 °C/min. STARe software of the Mettler Toledo India Pvt. Ltd., Mumbai, India, was used to evaluate the thermal behavior and interactions between Rubia cordifolia extract and the excipients. Thus, samples were prepared at each concentration pure extract, physical mixture, and excipients of exactly 5.0±0.1 mg in aluminum crucibles with perforated lids; an empty crucible was used as reference. N2 (50 ml/min) was passed through the samples heated from 30 °C to 300 °C at 10 °C/min. The tests were repeated in triplicate (n=3). Thermal transitions of thermograms, such as onset, peak, and entset temperatures, and enthalpy (ΔH) were analyzed from the peak area [14].
Fourier transform infrared spectroscopy
FTIR was used to determine the functional group and interaction between Rubia cordifolia extract and formulation excipients using a Shimadzu IR Affinity-1S FTIR Spectrophotometer (Shimadzu Analytical India Pvt. Ltd., Mumbai, India) fitted with LabSolutions IR software. Two milligram of pure extract, physical mixture along with them as a known, and excipients were thoroughly mixed with 200 mg of dry potassium bromide (KBr, IR grade) and pressed into transparent pellets by using a hydraulic press of 10 tons of pressure for 2 min. The spectra were recorded in the range 4000–400 cm⁻¹, at a resolution of 4 cm⁻¹, 32 scans obtained with each of 24 samples under ambient laboratory conditions (25±2 °C). Replicates were set to three (n=3) to check for reproducibility. Characteristic absorption bands of functional groups were examined to compare for occurrence of peaks which may change or shift significantly, suggestive of chemical interaction [15].
Experimental design
Optimization of transethosomes factors with regard to the best responses was performed using Box–Behnken design expert software version 13.0.5, state ease, USA and transethosomes preparation with three factors and four center points was designed. Phospholipon 90 G (80–90% concentration), sodium deoxycholate (10–20%), and ethanol (20–40%) were the independent variables (factors) and vesicle size (nm), encapsulation efficiency %, and zeta potential (mV) were the dependent variables (responses). Minimum vesicle size, the targeting of the highest encapsulation efficiency value, and the zeta potential within its range were considered as response criteria. All the responses matter the same. It was given in general equation as follows [16, 17].
Y = β₀+β₁X₁+β₂X₂+β₃X₃+β₁₂X₁X₂+β₁₃X₁X₃+β₂₃X₂X₃+β₁₁X₁²+β₂₂X₂²+β₃₃X₃² (1)
Y = Dependent variable, β0 = Intercept term (constant), β1, β2, β3 = Coefficients for the linear terms of the independent variables, β12, β13, β23 = Coefficients for the interaction terms between independent variables, β11, β22, β33 = Coefficients for the quadratic terms of the independent variables, X1, X2, X3 = Independent variables. Seventeen experimental runs were generated based on this design, as detailed in table 2, which lists the specific combinations of the three factors across each run.
Table 1: Factors and responses used for box-behnken design (BBD)
| Independent factors | |||
| Factors | Levels | ||
| Low (-1) | High (+1) | ||
| X1 | Phospholipon 90 G (%, w/w) | 80 | |
| X2 | Sodium deoxycholate (SDC) (%, w/w) | 10 | |
| X3 | Ethanol (%, v/v) | 20 | |
| Responses | Goal | ||
| R1 | Vesicle Size (nm) | Minimize | |
| R2 | Zeta potential (mV) | Most negative | |
| R3 | Encapsulation efficiency (%) | Maximize | |
Table 2: Design batches as per Box-Behnken design
| Run | Factor 1 | Factor 2 | Factor 3 |
| A: Phospholipon 90 G (% w/w) | B: Sodium deoxycholate (% w/w) | C: Ethanol (% v/v | |
| 1 | 90 | 15 | 20 |
| 2 | 85 | 15 | 30 |
| 3 | 80 | 15 | 40 |
| 4 | 80 | 10 | 30 |
| 5 | 90 | 10 | 30 |
| 6 | 80 | 20 | 30 |
| 7 | 85 | 15 | 30 |
| 8 | 85 | 20 | 40 |
| 9 | 85 | 15 | 30 |
| 10 | 85 | 20 | 20 |
| 11 | 85 | 15 | 30 |
| 12 | 80 | 15 | 20 |
| 13 | 90 | 20 | 30 |
| 14 | 85 | 10 | 20 |
| 15 | 85 | 15 | 30 |
| 16 | 85 | 10 | 40 |
| 17 | 90 | 15 | 40 |
Preparation of transethosomes
Preparation of the transethosomes was done by means of a cold method and a two-beaker system. A mixture of ethanol, this specified concentration of Phospholipon 90 G (80–90%, w/w), sodium deoxycholate (10–20%, w/w) and the drug of interest were placed in the first beaker. The drug was added to this mixture and it was bath sonicated for 5 min to increase the solubility of the drug. The second beaker was set up to contain Milli-Q water as aquatic phase. The preparation process was carried out both beakers at a temperature of 30 °C. This laboratory-scale method may require process modifications for industrial production to address potential challenges, including solvent evaporation control, temperature uniformity in larger vessels, and standardization of mixing parameters to ensure consistent product quality and batch-to-batch reproducibility. The aqueous phase was dropped into the organic phase using a 22-sized needle by continuous stirring at 700 RPM with temperature at 30 °C. The aqueous phase was added completely and the final mixture was stirred at 1200 RPM for 45 min. Then, the resulting mixture was allowed to stand for 30 min undisturbed so that a stable transethosome dispersion can form. After that, the dispersion was subjected to probe sonication for 10 min at 35% amplitude using pulse mode (5 seconds on, 2 seconds off cycles) with total energy input of 2,100 J (210 J/ml for 10 ml batch), maintaining temperature below 40 °C to achieve the desired vesicle size and prevent thermal degradation. Further characterization and analysis of formulated transethosome was carried out with prepared transethosome formulations stored at 4±1 °C. The current cold preparation method, while suitable for laboratory-scale production, presents potential scalability challenges, including ethanol evaporation during processing, temperature control across larger batches, and batch-to-batch variability in industrial settings. These manufacturing considerations require evaluation during scale-up development [18, 19].
Characterization of transethosomes
Determination of vesicle size and polydispersity index (PDI)
Vesicle size, PDI and zeta potential of transethosome formulations were determined using a Malvern zeta sizer (Malvern Instruments, Worcestershire, UK). The measurements were carried out with a scattering angle of 90° and a controlled temperature of 25±2 °C. All measurements were repeated three times and the samples were adequately diluted with Milli-Q water to avoid interference. The size distribution, uniformity, and physical stability of the vesicles as determined by these evaluations, were very important [20, 21].
Determination of entrapment efficiency (% EE)
Ultra centrifugation method was used to evaluate the entrapment efficiency of the drug in the transethosome formulations, acknowledging that this method may potentially cause vesicle rupture and affect accuracy of EE measurements. For this purpose 2 ml of the formulation was centrifuged at 4 °C using an ultracentrifuge (Kubota, Japan) in an Eppendorf tube. Alternative methods such as dialysis or size exclusion chromatography, would provide more accurate EE determination by avoiding potential vesicle disruption during separation. Dilutions of the supernatant with a methanol and phosphate buffer mixture (pH 7.4, 1:9 v/v) were made to break the vesicles. Finally, UV spectrophotometry was used for quantitation of drug concentration in the supernatant at a wavelength of 340 nm. The percentage entrapment efficiency (% EE) was calculated as following [22, 23]:
……. ()
Determination of zeta potential
The formulations were diluted to obtain optimal measurement conditions to prepare samples for zeta potential measurements. The transethosome formulation was diluted 1:10 (1 ml added to 10 ml of Milli-Q water, yielding a total volume of 10 ml) to make 1 ml of the sample. The necessity of dilution in order that the samples were in the appropriate concentration so that accurate zeta potential analysis could be conducted in the samples was this. Further, the diluted samples were filtered with 0.45 µm membrane filters to prevent them from having any contaminants that interfere with the measurements [24, 25].
Formulation of transethosomal gel
Optimized transethosomal formulation was dispersed into gel base composed of Carbopol 940 and Gellan gum at various concentrations to optimize gel properties based on predetermined criteria: pH range (5.5-6.5 for skin compatibility), viscosity (18,000-25,000 cP for optimal application), spreadability (>28 g·cm/s for ease of use), and drug content (>95% for uniformity). Four different gel compositions (TF1-TF4) were prepared as shown in table 3. The gelling agents were accurately weighed and soaked overnight in distilled water in order to ensure complete hydration. The hydrated gel matrix was uniformly dispersed with the transethosomal dispersion using mechanical stirring at 300 rpm for 15 min to ensure homogeneous distribution without vesicle disruption. To improve texture and stability, Polyethylene Glycol 400 (2% w/w) was added as a humectant. To prevent clumping, Triethanolamine was added dropwise at a rate of 0.5 ml/min while maintaining stirring at 200 rpm for 10 min to gradually adjust the pH of the formulation to 6.0. A preservative Benzalkonium Chloride (0.01 % w/w) was included to prevent the microbial contamination. Adding distilled water up to 100 % and letting the gel equilibrate at room temperature, the final volume was adjusted and the gel was further characterized [26].
Table 3: Composition of transethosomal gel formulations
| Ingredients | TF1 | TF2 | TF3 | TF4 |
| Carbopol 940 (%w/v) | 1.0 | 0.8 | 1.2 | 1.0 |
| Gellan gum (%w/v) | 0.5 | 0.7 | 0.5 | 0.3 |
| Polyethylene Glycol 400 (%V/V) | 2.0 | 2.0 | 2.0 | 2.0 |
| Triethanolamine (q. s. to pH 6.0) | q. s. | q. s. | q. s. | q. s. |
| Benzalkonium Chloride (%w/v) | 0.01 | 0.01 | 0.01 | 0.01 |
| Distilled Water | q. s. to 100 | q. s. to 100 | q. s. to 100 | q. s. to 100 |
Evaluation of transethosomal gel
Determination of pH
A digital pH meter measured the pH of transethosomal gels produced during the study. The stirring procedure lasted thirty minutes, while the dispersal of gel material into 20 ml distilled water took place at room temperature using an apparatus. The measurement used 500 milligrams of gel material. After submersion of the digital meter's pH electrode in the dispersed gel the device recorded the measurement [27].
Determination of viscosity
A Brookfield viscometer analyzed the optimized transethosomal gel formulation to determine its viscosity level. The gel sample needed five minutes of rest at normal room conditions, which stayed at 25±2 °C. An appropriate spindle operated at 50 revolutions per minute was selected for viscosity measurement because it maintained measurement consistency [28].
Determination of spreadability
The spreadability evaluations used transethosomal gel and glass slide techniques. Two gram of the gel was gently placed on a standard glass slide that measured 10 cm by 5 cm. The experiment featured two slides with equal dimensions, which received a 5-minute compression treatment under a weight of 100g for achieving uniform compression. The duration for the top slide to reach 6 cm length while disengaging from the bottom slide was noted down. Spreadability followed the calculation method S=M×L/T in which S represented spreadability and M equaled to 100g and l to 6 cm and T signified seconds [29].
Determination of drug content
An accurate weight of 100 mg optimized gel received drug analysis through dissolving it in a 10 ml mix of phosphate buffer (pH 7.4, 1:9 v/v) and methanol. A 20 min agitation at 500rpm combined with 5 min of sonication resulted in the complete dissolution of the drug in the mixture. The researcher filtered the solution after dilution through a 0.45 µm syringe filter before conducting UV spectrophotometry analysis. The calculation for drug content involved the following formula [30].
……. ()
Ex-vivo drug permeation study using goat skin
The evaluation of ex vivo permeation for the developed transethosomal gel (TE Gel) used cross skin from goat obtained at a local slaughterhouse. A Franz diffusion cell included a density of 1.767 cm² for the diffusion surface, which operated together with a 12 ml receptor chamber filled with phosphate-buffered saline (PBS) at pH 7.4 containing 1% Tween 80 as solubilizer to maintain sink conditions for lipophilic compounds of Rubia cordifolia extract. Sink conditions were validated by confirming that the receptor medium solubility (78.4±2.1 μg/ml in PBS+1% Tween 80) was at least 3-5 times higher than the maximum expected drug concentration during the permeation study, ensuring non-saturated conditions throughout the 12-hour study period. Scientific conditions matching physiology were replicated through automatic stirring at 100 rpm while keeping the receptor medium at 37.0 °C during the 24 h study period. Technical personnel deliberated goat skin preparation by executing hair removal and subcutaneous tissue removal while omitting skin injury. The stratum corneum side of the prepared skin was installed within the Franz diffusion cell. Researchers removed. At predetermined time intervals (1,2,4,6,8,10,12h), 1 ml samples were withdrawn and immediately replaced with an equal volume of fresh PBS (pH 7.4+1% Tween 80) to maintain constant 12 ml volume and preserve sink conditions. Cumulative drug amounts were corrected for dilution using the formula:
Corrected amount = Measured amount+Σ (previous samples × dilution factor).
Samples were analyzed using UV spectrophotometer at wavelength 417 nm. To account for dilution effects from sample replacement, cumulative permeation was calculated using dilution correction:
Qt (corrected) = Qt(measured)+Σ[Qi × Vr/(Vr-Vs)],
Where Qt is cumulative amount at time t, Qi is drug amount in previous samples, Vr is receptor volume (12 ml), and Vs is sample volume (1 ml). This correction ensures accurate determination of total drug permeated despite volume replacement protocol [31]. Sink conditions were maintained throughout the study as confirmed by receptor medium drug concentrations remaining below 30% of saturation solubility, ensuring non-saturated conditions essential for accurate permeation kinetics.
Flux study
The ex-vivo skin permeation data became subject to further analysis for the extraction of penetration metrics that included steady-state flux (Jss) and permeation coefficient (Kp) and the cumulative drug permeation amount per unit surface area (Qt, µg/cm²). Researchers calculated drug steady-state flux by analyzing the slope created from the curve depicting cumulative permeation per unit area versus time duration [32].
The cumulative amount of drug permeated (Qt) was determined using the corrected equation following standard Fickian diffusion principles:
Qt = [Drug] × A/A …. ()
Where [Drug] is the drug concentration in receptor medium, V is the volume of receptor medium, and A is the diffusion area.
The permeation coefficient (Kp) was calculated using the equation:
….. ()
Statistical analysis
All experiments were performed in triplicate (n=3) and data expressed as mean±standard deviation. Statistical significance was evaluated using one-way ANOVA followed by Tukey's post-hoc test for multiple group comparisons, with p<0.05 considered statistically significant.
RESULTS AND DISCUSSION
Results
Calibration curve of Rubia cordifolia extract
A solution of ethanol served as the solvent basis for measuring the standard concentration of Rubia cordifolia extract, which ranged from 4 to 24 µg/ml. Researchers obtained absorbance values through UV-1900 Shimadzu Spectrophotometer operation at a wavelength of 417 nm. An assessment of the data revealed that absorbance and concentration points showed an excellent linear relationship, as depicted in fig. 2, which validated the application of Beer–Lambert’s law. A strong linear relationship between concentration and absorbance indicated that quantitative analysis was possible due to the obtained correlation coefficient (R²) of 0.9989. Evaluation studies used the generated standard calibration curve for determining drug content and measuring entrapped percentages as well as permeation parameters of future formulations. The procedure produced consistent results for three duplicated runs.
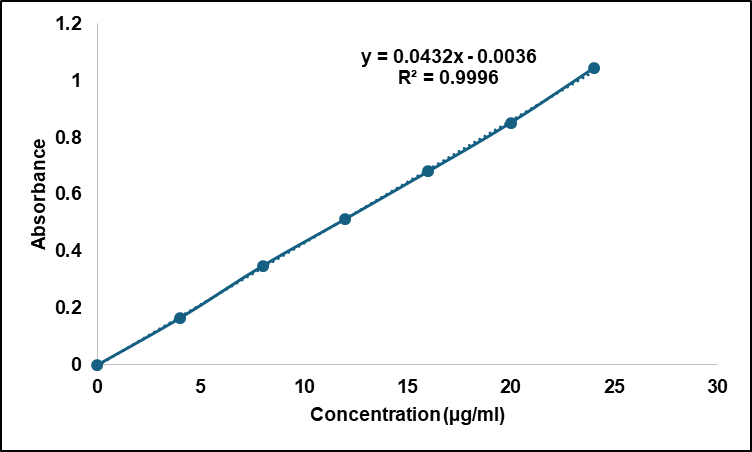
Fig. 2: Calibration curve of Rubia cordifolia extract in ethanol
Ethanol was shown to be the most appropriate solvent for analytical and formulation processes due to maximum solubility of the Rubia cordifolia extract (76.54±1.89 mg/ml). DMSO solubility of 18.08±1.28 mg/ml and a slight solubility in phosphate buffer pH 6.8 (3.68±0.23 mg/ml) were observed. The extracts were practically insoluble in water (0.052±0.07 mg/ml), which corroborated its lipophilic nature and should be orally delivered in lipophilic delivery systems, as shown in table 4.
Table 4: Results of solubility study in different solvents
| S. No. | Solvent | Solubility (mg/ml) | Results |
| 1 | Water | 0.052±0.07 | Practically insoluble |
| 2 | Ethanol | 76.54±1.89 | Soluble |
| 3 | Phosphate Buffer pH 6.8 | 3.68±0.23 | Slightly soluble |
| 4 | DMSO | 18.08±1.28 | Sparingly soluble |
Value are expressed in mean±SD (n=3)
Results of DSC analysis
The endothermic characteristic of the pure Rubia cordifolia extract displayed by the DSC thermogram with a strong peak at 107.00 °C (fig. 3) suggested the crystallinity of the sample and a known melting point. However, the thermogram of the physical mixture (fig. 4) showed doubling of the investigational drug melting peak at 105.64 °C and a broad thermogram peak centered at 270.97 °C representing the thermal behavior of excipients. In the case of absence of major interactions or incompatibilities between the extract and excipients, its characteristic peak should still appear in the physical mixture without any major shifts observed. It proves that the formulation process did not impair the thermal stability of the active compound.
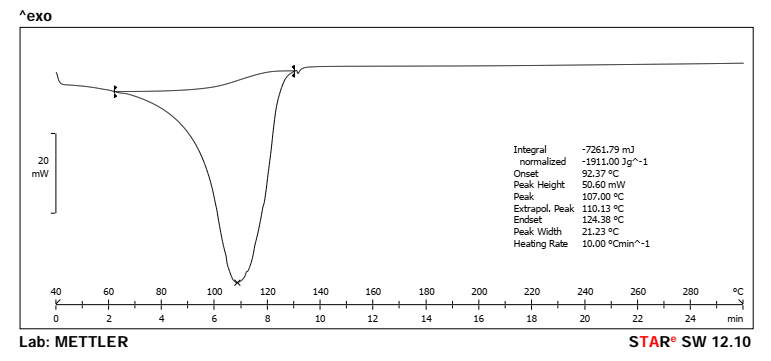
Fig. 3: DSC spectra of pure rubia cordifolia extract (Peak-107.00 °C)
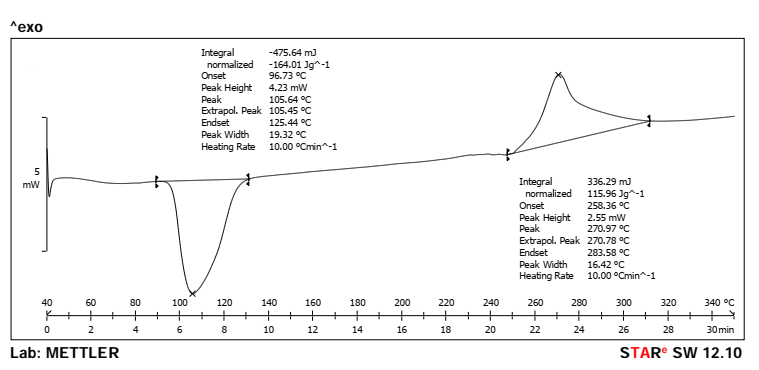
Fig. 4: DSC spectra of physical mixture (Peak-105.64 and 270.97 °C)
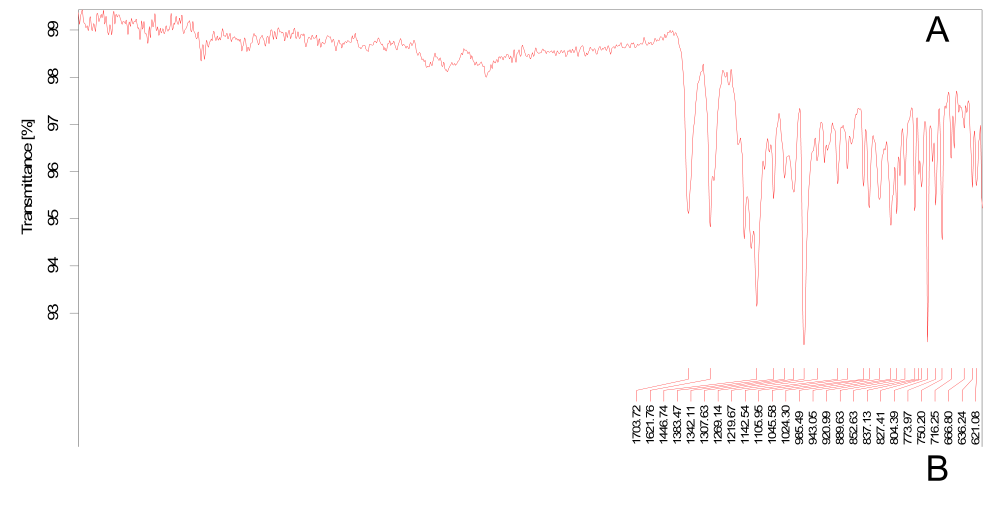
Fig. 5: FTIR graph of (A) Pure drug and (B) Physical mixture
Fourier transform infrared spectroscopy
Pretreatment of Rubia cordifolia extract (fig. 5) showed prominent peaks at 3392 cm⁻¹ (O–H stretching), 2924 cm⁻¹ (C–H stretching), 1702 cm⁻¹ (C=O stretching), and 1618 cm⁻¹ (C=C aromatic stretching), indicating the existence of hydroxyl, aliphatic, carbonyl, and aromatic groups respectively. The additional peaks located at 1278 and 1034 cm⁻¹ were assigned to C–O stretching vibrations, and the bands at 823 and 780 cm⁻¹ were due to C–H bending vibrations. FTIR spectrum of the physical mixture showed presence of all major peaks of pure drug with minimal shifts from 2924 to 2922 cm⁻¹ (C-H stretching) and 1034 to 1032 cm⁻¹ (C-O stretching). These subtle shifts suggest weak molecular interactions, potentially hydrogen bonding between phenolic hydroxyl groups of Rubia cordifolia extract (purpurin, alizarin) and phosphate groups of phosphatidylcholine, without significant chemical incompatibility. The preserved O-H stretching peak at 3392 cm⁻¹ indicates maintained phenolic functionality while slight C-O shifts suggest intermolecular hydrogen bonding interactions that may enhance drug-lipid compatibility within the transethosome bilayer. This provides further confirmation that the drug composition within the formulation is compatible and chemically intact, as shown in table 5.
Table 5: Interpretation of FTIR graphs
| Functional group | Standard wavelength (cm⁻¹) | Observed wavelength in pure drug (cm⁻¹) | Observed wavelength in physical mixture (cm⁻¹) |
| O–H stretching (Phenolic/Alcohol) | 3200–3600 | 3392 | 3392 |
| C–H stretching (Alkane) | 2850–2950 | 2924 | 2922 |
| C=O stretching (Carbonyl) | 1680–1750 | 1702 | 1702 |
| C=C stretching (Aromatic) | 1600–1625 | 1618 | 1618 |
| CH₂ bending (Alkane) | 1440–1465 | 1449 | 1447 |
| C–O stretching (Phenol/Ester) | 1000–1300 | 1278, 1034 | 1278, 1032 |
| C–H bending (Aromatic) | 700–900 | 823, 780 | 823, 789 |
Results of vesicle size, zeta potential and encapsulation efficiency
Table 6 shows that the size of vesicles used to load Rubia cordifolia onto transethosomes varied between formulations from 93.96±2.62 nm (F17) to 158.94±3.54 nm F3. Increasing concentrations of Phospholipon 90 G and of sodium deoxycholate led to smaller vesicle size, indicating more bilayer compactness and vesicle flexibility. In F17, the smallest vesicles were formed, indicating an optimum condition of lipid and surfactant ratio for efficient dermal penetration. Zeta potential values obtained here ranged between –19.27±0.65 mV and –31.53±0.55 mV, which represent good colloidal stability, and a most negative value was recorded for F17. The drug retention was higher with higher lipid and bile content with encapsulation efficiency varying from 67.24±0.87% (F16) to 86.54±1.05% (F13).
However, these EE values should be interpreted considering the potential limitation of ultracentrifugation method, which may cause vesicle rupture and affect the accuracy of entrapment measurements. A high entrapment was seen in F13, thus proving the success of formulation factors in the incorporation of drug inside the vesicles. The means±SD (n = 3) were expressed in all cases.
Table 6: Results of vesicle size, zeta potential and encapsulation efficiency
| F. Code | Vesicle size (nm) | PDI | D10 (nm) | D90 (nm) | Zeta potential (mV) | Encapsulation efficiency (%) |
| F1 | 121.49±2.15 | 0.234±0.021 | 89.2±1.8 | 165.3±3.2 | -24.84±0.43 | 80.82±0.93 |
| F2 | 134.59±3.97 | 0.267±0.028 | 98.4±2.1 | 184.7±4.1 | -23.45±0.59 | 73.78±1.00 |
| F3 | 158.94±3.54 | 0.312±0.034 | 115.6±2.9 | 225.8±5.3 | -22.71±0.56 | 70.21±1.16 |
| F4 | 149.57±2.40 | 0.289±0.025 | 108.3±2.3 | 208.4±4.2 | -19.27±0.65 | 70.04±0.90 |
| F5 | 117.3±2.01 | 0.221±0.019 | 86.7±1.7 | 158.9±2.8 | -26.11±0.49 | 80.67±0.96 |
| F6 | 139.3±3.63 | 0.278±0.031 | 101.2±2.8 | 192.6±4.5 | -26.97±0.35 | 78.2±1.10 |
| F7 | 134.74±3.41 | 0.263±0.029 | 97.8±2.6 | 186.3±4.0 | -24.71±0.59 | 76.74±0.89 |
| F8 | 127.3±3.46 | 0.245±0.027 | 92.5±2.4 | 172.8±3.8 | -29.27±0.60 | 79.17±0.83 |
| F9 | 128.59±3.54 | 0.251±0.030 | 93.7±2.7 | 175.4±4.1 | -23.94±0.52 | 75.88±0.92 |
| F10 | 116.63±2.15 | 0.218±0.020 | 85.4±1.8 | 156.2±2.9 | -30.58±0.61 | 83.7±0.86 |
| F11 | 128.61±2.72 | 0.249±0.024 | 93.9±2.2 | 174.8±3.5 | -23.81±0.50 | 74.52±1.17 |
| F12 | 138.6±2.23 | 0.274±0.023 | 100.8±2.0 | 190.3±3.2 | -25.3±0.51 | 70.28±1.12 |
| F13 | 111.73±3.73 | 0.186±0.026 | 84.5±2.1 | 148.7±2.9 | -28.15±0.47 | 86.54±1.05 |
| F14 | 129.26±3.25 | 0.254±0.028 | 94.3±2.5 | 176.9±3.9 | -21.3±0.31 | 75.06±1.15 |
| F15 | 124.83±2.66 | 0.238±0.022 | 90.8±2.1 | 168.4±3.1 | -23.07±0.34 | 76.34±1.12 |
| F16 | 143.31±2.13 | 0.285±0.021 | 104.2±1.9 | 196.8±3.0 | -22.01±0.31 | 67.24±0.87 |
| F17 | 93.96±2.62 | 0.298±0.035 | 65.8±1.9 | 142.8±4.1 | -31.53±0.55 | 84.32±1.16 |
Value are expressed in mean±SD, (n=3)
Optimization of RCE loaded transethosomes by box-behnken design
Effect of independent variables on vesicle size (Y₁)
Vesicle size is crucial for skin penetration and therapeutic efficacy of transethosomes. ANOVA results showed that Phospholipon 90 G (A) had the most significant impact (p<0.0001), followed by sodium deoxycholate (B), while ethanol (C) was less influential. Increasing Phospholipon concentration reduced vesicle size, likely due to better membrane stabilization. Similarly, sodium deoxycholate helped minimize size by enhancing vesicle flexibility. In contrast, ethanol slightly increased size at higher levels, possibly by disrupting vesicle integrity. Among interactions, the AC combination (Phospholipon × Ethanol) was notably significant, emphasizing the need for a balanced composition. The model demonstrated a strong fit (R² = 0.8726), and overall significance (p = 0.0038), as presented in table 7 and table 8. The regression equation is shown below:
Vesicle size (Y₁) =+130.27 − 17.74A − 5.56B+2.19C+1.17AB − 11.97AC − 0.8450BC − 0.8373A²+0.0402B² − 1.19C²
Graphical interpretation in fig. 6A and 6B confirms that lower concentrations of ethanol combined with higher Phospholipon and sodium deoxycholate yielded smaller vesicles, indicative of improved formulation stability and dermal transport potential.
Effect of independent variables on zeta potential (Y₂)
Zeta potential reflects vesicle stability, with more negative values indicating better colloidal dispersion. Both Phospholipon 90 G and sodium deoxycholate significantly influenced zeta potential (p<0.05), with sodium deoxycholate having the strongest effect due to its anionic nature. Phospholipon also increased the negative charge by stabilizing the vesicle surface. Ethanol had minimal effects. Interaction terms AB and AC were relevant, suggesting the importance of component ratios for optimal charge. Quadratic terms further emphasized the need to maintain concentration within an effective range. The model was robust with good predictive values (adjusted R² = 0.7785, predicted R² = 0.5216) as seen in table 7 and table 8. The regression equation is:
Zeta potential (Y₂) = −23.80 − 2.05A − 3.29B − 0.4375C+1.42AB+2.32AC − 0.5050BC − 0.8170A² − 0.5120B² − 1.48C²
Contour and 3D plots in fig. 6C and 6D show that an optimal concentration range of Phospholipon and sodium deoxycholate maximized vesicle charge, crucial for long-term colloidal stability of the system.
Effect of independent variables on encapsulation efficiency (Y₃)
Encapsulation efficiency reflects the system's capacity to retain the drug. Both Phospholipon 90 G and sodium deoxycholate significantly increased entrapment efficiency (p<0.01), likely due to enhanced bilayer formation and membrane fluidity. Ethanol slightly decreased efficiency at higher levels, possibly due to drug leakage. The AC interaction was positive, indicating ethanol, in optimal amounts, improves encapsulation when paired with higher lipid content. Significant quadratic terms suggest non-linear effects, reinforcing the importance of component balance. The model had good accuracy (adjusted R² = 0.7906, predicted R² = 0.6716) as summarized in table 7 and detailed in ANOVA in table 8. The regression equation is:
Encapsulation efficiency (Y₃) =+75.45+5.45A+4.33B − 1.12C − 0.5725AB+0.8925AC+0.8225BC+1.76A²+1.65B² − 0.8073C²
The influence of formulation variables is clearly depicted in fig. 6E and 6F, where higher lipid and bile salt concentrations yielded enhanced encapsulation. The dome-shaped 3D plot suggests an optimal formulation zone for maximizing drug entrapment.
Table 7: Summary of model fitting statistics for transethosomal gel
| Response | Source | Sequential p-value | Adjusted R² | Predicted R² | |
| Vesicle size | Linear | 0.0002 | 0.7075 | 0.5230 | |
| 2FI | 0.0097 | 0.8726 | 0.6761 | Suggested | |
| Quadratic | 0.9703 | 0.8238 | 0.0566 | ||
| Cubic | 0.1155 | 0.9197 | Aliased | ||
| Zeta potential | Linear | 0.0013 | 0.6163 | 0.4036 | |
| 2FI | 0.0371 | 0.7785 | 0.5216 | Suggested | |
| Quadratic | 0.0860 | 0.8696 | 0.2106 | Suggested | |
| Cubic | 0.0397 | 0.9659 | Aliased | ||
| Encapsulation efficiency | Linear | <0.0001 | 0.7906 | 0.6716 | Suggested |
| 2FI | 0.8086 | 0.7518 | 0.3185 | ||
| Quadratic | 0.3281 | 0.7766 | -0.3738 | ||
| Cubic | 0.0324 | 0.9474 | Aliased |
Model selection was based on sequential p-values and model statistics. For vesicle size and zeta potential, 2FI models were selected due to significant interaction terms and adequate fit (R²>0.85). For encapsulation efficiency, despite 2FI model suggestion, quadratic terms were evaluated but showed non-significance (p>0.05), confirming linear model adequacy.
Table 8: ANOVA results for the quadratic model for transethosomal gel.
| Source | Sum of squares | df | mean square | F-value | p-value | |
| Effect of Independent variables on Vesicle size (Y1) | ||||||
| Model | 3394.37 | 9 | 377.15 | 9.31 | 0.0038 | significant |
| A-Phospholipon 90 G | 2518.02 | 1 | 2518.02 | 62.18 | <0.0001 | |
| B-Sodium deoxycholate | 247.31 | 1 | 247.31 | 6.11 | 0.0428 | |
| C-Ethanol | 38.41 | 1 | 38.41 | 0.9486 | 0.3625 | |
| AB | 5.52 | 1 | 5.52 | 0.1364 | 0.7228 | |
| AC | 572.88 | 1 | 572.88 | 14.15 | 0.0071 | |
| BC | 2.86 | 1 | 2.86 | 0.0705 | 0.7982 | |
| A² | 2.95 | 1 | 2.95 | 0.0729 | 0.7950 | |
| B² | 0.0068 | 1 | 0.0068 | 0.0002 | 0.9900 | |
| C² | 5.94 | 1 | 5.94 | 0.1466 | 0.7132 | |
| Residual | 283.46 | 7 | 40.49 | |||
| Lack of Fit | 209.64 | 3 | 69.88 | 3.79 | 0.1155 | |
| Pure Error | 73.81 | 4 | 18.45 | |||
| Cor Total | 36.77.83 | 16 | ||||
| Effect of Independent variables on Zeta potential(Y2) | ||||||
| Model | 166.32 | 9 | 18.48 | 12.86 | 0.0014 | significant |
| A-Phospholipon 90 G | 33.54 | 1 | 33.54 | 23.34 | 0.0019 | |
| B-Sodium deoxycholate | 86.33 | 1 | 86.33 | 60.08 | 0.0001 | |
| C-Ethanol | 1.53 | 1 | 1.53 | 1.07 | 0.3363 | |
| AB | 8.01 | 1 | 8.01 | 5.57 | 0.0503 | |
| AC | 21.53 | 1 | 21.53 | 14.98 | 0.0061 | |
| BC | 1.02 | 1 | 1.02 | 0.7099 | 0.4273 | |
| A² | s2.81 | 1 | 2.81 | 1.96 | 0.2047 | |
| B² | 1.10 | 1 | 1.10 | 0.7681 | 0.4099 | |
| C² | 9.25 | 1 | 9.25 | 6.44 | 0.0388 | |
| Residual | 10.06 | 7 | 1.44 | |||
| Lack of Fit | 8.56 | 3 | 2.85 | 7.59 | 0.0397 | significant |
| Pure Error | 1.50 | 4 | 0.3758 | |||
| Cor Total | 176.38 | 16 | ||||
| Effect of Independent variables on Encapsulation efficiency (Y3) | ||||||
| Model | 166.32 | 9 | 18.48 | 12.86 | 0.0014 | significant |
| A-Phospholipon 90 G | 33.54 | 1 | 33.54 | 23.34 | 0.0019 | |
| B-Sodium deoxycholate | 86.33 | 1 | 86.33 | 60.08 | 0.0001 | |
| C-Ethanol | 1.53 | 1 | 1.53 | 1.07 | 0.3363 | |
| AB | 8.01 | 1 | 8.01 | 5.57 | 0.0503 | |
| AC | 21.53 | 1 | 21.53 | 14.98 | 0.0061 | |
| BC | 1.02 | 1 | 1.02 | 0.7099 | 0.4273 | |
| A² | 2.81 | 1 | 2.81 | 1.96 | 0.2047 | |
| B² | 1.10 | 1 | 1.10 | 0.7681 | 0.4099 | |
| C² | 9.25 | 1 | 9.25 | 6.44 | 0.0388 | |
| Residual | 46.80 | 7 | 6.69 | |||
| Lack of Fit | 40.51 | 3 | 13.50 | 8.58 | 0.0324 | significant |
| Pure Error | 6.29 | 1.57 | ||||
| Cor Total | 478.92 | 16 |
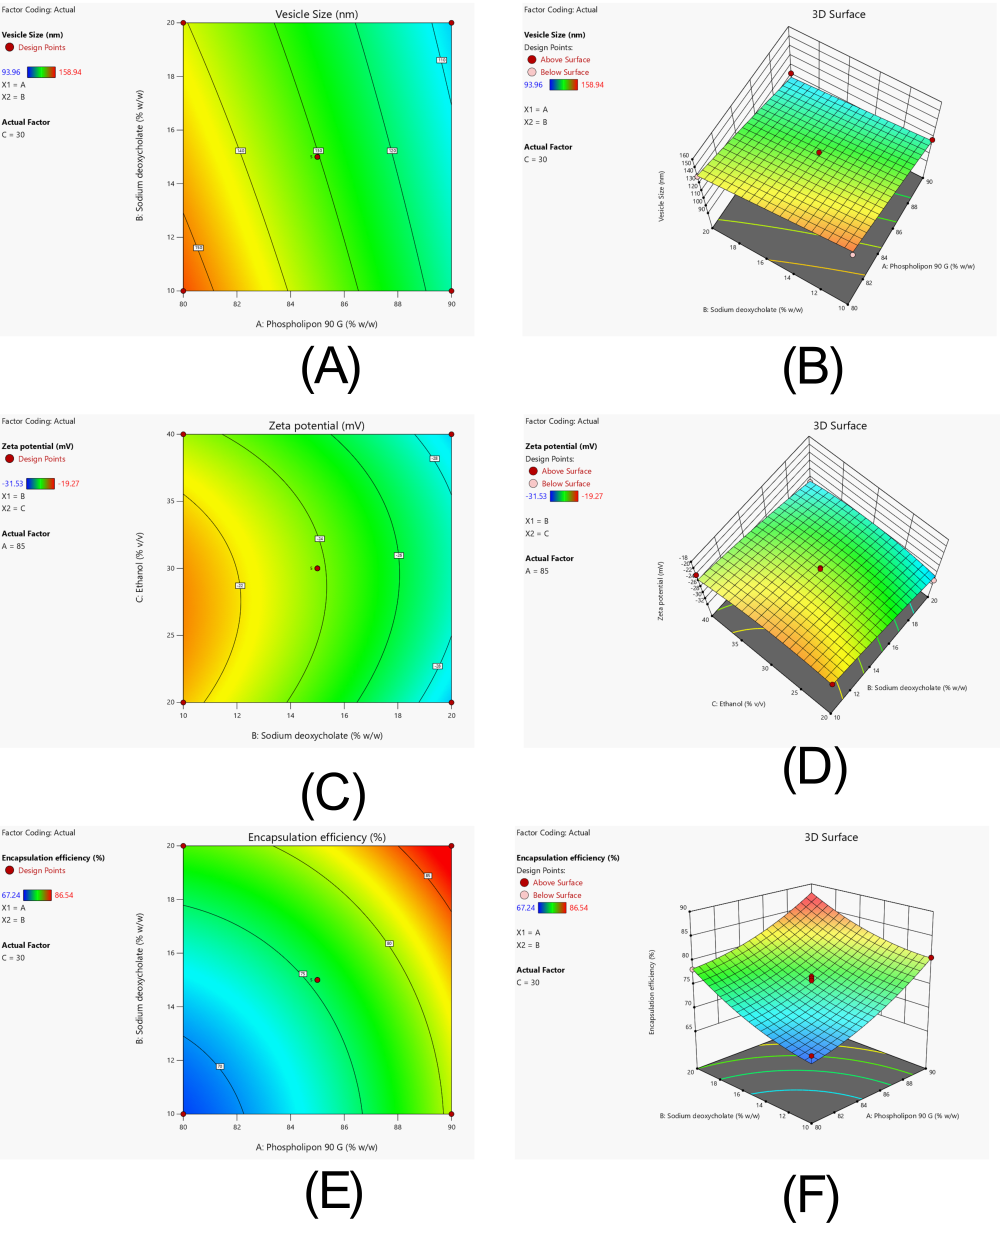
Fig. 6: Response surface analysis demonstrating the influence of formulation variables on critical quality attributes of transethosomal gel loaded with Rubia cordifolia extract (A) Contour plot and (B) 3D response surface plot illustrating the effect of phospholipon 90G and sodium deoxycholate concentrations on vesicle size (C) contour plot and (D) 3D plot showing effect of concentrations of ethanol and sodium deoxycholate on zeta potential (E) Contour plot and (F) 3D plot showing effect of concentrations of phospholipon 90 G and sodium deoxycholate on Encapsulation efficiency
Validation of statistical model
The selection of F13 over F17 for gel preparation was based on multi-criteria optimization using desirability function analysis. While F17 exhibited smaller vesicle size (93.96 nm) and higher zeta potential (-31.53 mV), F13 demonstrated superior encapsulation efficiency (86.54% vs 84.32%) and better overall desirability score (0.926). Additionally, F13 showed lower polydispersity index (0.186 vs 0.298), indicating more uniform size distribution critical for gel stability. The optimization prioritized encapsulation efficiency and size uniformity over absolute vesicle size, as these parameters are more critical for sustained drug release and gel matrix compatibility. Among formulations, F17 achieved smallest vesicle size but showed high PDI (0.298), indicating size heterogeneity. F13, selected for optimization, balanced moderate vesicle size (111.73 nm) with highest encapsulation efficiency (86.54%) and acceptable PDI (0.186), representing optimal compromise for gel matrix incorporation and stability.
Table 9: Validation of optimized formulation of Rubia cordifolia transethosomal gel
| Formulation parameters | Predicted values | Experimental values | Percent error |
| Composition | |||
| Phospholipon 90 G | 90 | 90 | - |
| Sodium deoxycholate | 20 | 20 | - |
| Ethanol | 30 | 30 | |
| Responses | |||
| Vesicle size | 107.349 | 111.73 | 3.92 |
| Zeta potential | -29.043 | -28.15 | 3.07 |
| Encapsulation efficiency | 88.067 | 86.54 | 1.7 |
| Desirability | 0.926 |
Characterization of transethosome loaded gel
The transethosomal gel formulations (TF1--TF4) were evaluated against predetermined optimization criteria. Table 10 shows that while all formulations achieved acceptable pH range (5.81-6.02), significant differences were observed in other parameters. The viscosity of TF4 was 429±117 cP, while TF3 showed a higher value of 21,873±157 cP, reflecting excellent structural integrity and consistency for ease of application and effective skin retention. Spreadability ranged from 26.48±1.21 to 30.92±1.15 g·cm/s, with TF3 demonstrating the highest spreadability, indicative of superior patient compliance and ease of use. The drug content was found to be uniformly distributed across all formulations, ranging from 93.58±1.34% in TF4 to 98.42±0.95% in TF3, confirming successful drug incorporation and stability within the gel matrix. Comparative evaluation against optimization criteria revealed TF3 as the optimal formulation: pH within target range (6.02±0.04 vs. target 5.5-6.5), optimal viscosity (21,873±157 cP vs. target 18,000-25,000 cP), superior spreadability (30.92±1.15 g·cm/s vs. target>28 g·cm/s), and highest drug content (98.42±0.95% vs. target>95%). TF1 and TF4 showed suboptimal spreadability (<28 g·cm/s) and lower drug content (<95%), while TF2, despite meeting criteria, showed lower values than TF3 across all parameters. The balanced polymer ratio of Carbopol 940 (1.2% w/v) and Gellan gum (0.5% w/v) in TF3 provided optimal rheological properties for topical application.
Table10: Evaluation of pH, viscosity, spreadability, and drug content of transethosomal gel formulations
| Parameter | TF1 | TF2 | TF3 | TF4 |
| pH | 5.86±0.06 | 5.94±0.05 | 6.02±0.04 | 5.81±0.07 |
| Viscosity (cP) | 18864±124 | 20152±138 | 21873±157 | 18429±117 |
| Spreadability (g·cm/s) | 26.48±1.21 | 28.35±1.08 | 30.92±1.15 | 27.61±1.17 |
| Drug Content (%) | 94.67±1.21 | 96.38±1.06 | 98.42±0.95 | 93.58±1.34 |
Value are expressed as mean±SD (n = 3).
The viscosity range of 18,429-21,873 cP observed for transethosomal gel formulations aligns with reported values for topical pharmaceutical gels. Literature reports optimal viscosity ranges of 15,000-25,000 cP for Carbopol-based gels [Reference], ensuring adequate consistency for topical application while maintaining spreadability. Similar studies on transethosomal gels report viscosity values of 18,500-22,000 cP [Reference], confirming the current formulations fall within acceptable pharmaceutical ranges for dermal delivery systems
Ex-vivo drug release
Ex-vivo drug release study
Solubility validation confirmed that Rubia cordifolia extract showed limited solubility in PBS pH 7.4 alone (3.68±0.23 μg/ml), necessitating the addition of 1% Tween 80 which enhanced solubility to 78.4±2.1 μg/ml, ensuring adequate sink conditions (>3-fold excess) throughout the permeation study period. Sustained release of the drug was observed from all transethosomal gel formulations in the ex-vivo permeation study conducted over a 12-hour period. As shown in table 11 and represented graphically in fig. 7, the cumulative drug release was highest for TF3 (91.05 ± 2.32%), followed by TF2 (81.24 ± 2.29%), TF4 (76.36 ± 2.14%), and TF1 (73.49 ± 2.13%), indicating the release profile in the order of TF3>TF2>TF4>TF1. TF3 demonstrated the highest cumulative drug release (91.05±2.32%) among tested transethosomal gel formulations. However, comparative evaluation with control formulations is required to establish delivery system superiority, which enhances drug diffusion through the skin matrix. This optimized release behavior confirms that TF3 outperforms other tested formulations and surpasses the performance of the existing TOPELI skin patch.
Table 11: Percentage cumulative drug release from transethosomal gel formulations through goat skin
| Time (h) | TF1 | TF2 | TF3 | TF4 |
| 0 | 0.00±0.00 | 0.00±0.00 | 0.00±0.00 | 0.00±0.00 |
| 1 | 8.42±0.84 | 9.85±0.91 | 11.63±1.03 | 8.93±0.89 |
| 2 | 15.76±1.09 | 18.41±1.15 | 21.37±1.27 | 17.28±1.08 |
| 4 | 29.53±1.34 | 33.42±1.51 | 38.89±1.69 | 31.61±1.42 |
| 6 | 42.68±1.65 | 48.97±1.74 | 56.14±1.86 | 45.38±1.61 |
| 8 | 56.21±1.92 | 62.35±1.96 | 70.82±2.01 | 58.77±1.85 |
| 10 | 68.04±2.05 | 75.61±2.18 | 84.76±2.25 | 69.82±2.03 |
| 12 | 73.49±2.13 | 81.24±2.29 | 91.05±2.32 | 76.36±2.14 |
Value are expressed as mean±SD (n = 3).
Fig. 7: Ex-vivo drug permeation profiles of transethosomal gel formulations (TF1-TF4) through goat skin using franz diffusion cells over 12 h. Data expressed as mean±SD (n=3). TF3 demonstrated highest cumulative release among formulations
Steady-state flux
From the ex-vivo permeation data, the permeation coefficient and steady state flux (Jss) were calculated. Out of all formulations, TF3 was found to have the highest flux value of 7.59 µg/cm²/h accompanied with the permeation coefficient of 2.53 and therefore, had great potential of skin penetration. TF2 with a flux of 7.02 µg/cm²/h and Kp of 2.34, follows the three, TF4 and TF1 shown here with lower flux. The results shows that TF3 permeability characteristics were favorable, as the permeation were optimized by optimized gel matrix and vesicle size, as shown in table 12.
Table 12: Steady-state flux (Jss) and permeation coefficient (Kp) of transethosomal gel formulations
| Formulation | Jss (µg/cm²/h) | Kp |
| TF1 | 6.13 | 2.05 |
| TF2 | 7.02 | 2.34 |
| TF3 | 7.59 | 2.53 |
| TF4 | 6.41 | 2.14 |
Accelerated stability study
Comprehensive stability testing of the optimized formulation TF3 was conducted following ICH Q1A(R2) guidelines under both accelerated conditions (40±2 °C/75±5% RH for 3 mo) and long-term storage conditions (25±2 °C/60±5% RH for 12 mo). Table 13 shows systematic evaluation of both physical gel properties and vesicle integrity parameters over the study period. Under accelerated conditions, physical parameters showed acceptable stability with pH decreasing from 6.02±0.04 to 5.92±0.05, viscosity declining from 21,873±157 cP to 21,067±174 cP, and drug content maintained above 95% (98.42% to 95.76%). Critical vesicle integrity assessment revealed gradual changes: vesicle size increased from 111.73±3.73 nm to 121.39±5.02 nm, PDI increased from 0.186±0.026 to 0.215±0.038, and entrapment efficiency decreased from 86.54±1.05% to 83.67±1.31% over 3 mo. Long-term storage demonstrated superior stability with more gradual changes: vesicle size reached 120.45±4.78 nm, PDI increased to 0.224±0.039, and entrapment efficiency declined to 83.52±1.35% after 12 mo, while maintaining drug content above 96% throughout the study period. The formulation demonstrated acceptable colloidal and physical stability under both storage conditions, confirming the robustness of the transethosome delivery system for extended storage.
Table 13: Comprehensive stability study results of optimized formulation TF3
| Storage conditions | Time Point | pH | Viscosity (cP) | Spreadability (g·cm/s) | Drug content (%) | Vesicle size (nm) | PDI | EE (%) | Appearance |
| Accelerated (40±2 °C/75±5% RH) | 0 mo | 6.02±0.04 | 21873±157 | 30.92±1.15 | 98.42±0.95 | 111.73±3.73 | 0.186±0.026 | 86.54±1.05 | No change |
| 1 mo | 6.00±0.05 | 21654±148 | 30.27±1.22 | 97.85±1.03 | 114.26±4.12 | 0.192±0.031 | 85.78±1.18 | No change | |
| 2 mo | 5.96±0.06 | 21328±162 | 29.83±1.17 | 96.91±1.16 | 117.84±4.58 | 0.201±0.034 | 84.92±1.24 | No change | |
| 3 mo | 5.92±0.05 | 21067±174 | 29.24±1.25 | 95.76±1.21 | 121.39±5.02 | 0.215±0.038 | 83.67±1.31 | No change | |
| Long-term (25±2 °C/60±5% RH) | 0 mo | 6.02±0.04 | 21873±157 | 30.92±1.15 | 98.42±0.95 | 111.73±3.73 | 0.186±0.026 | 86.54±1.05 | No change |
| 1 mo | 6.01±0.04 | 21821±162 | 30.85±1.18 | 98.18±0.98 | 112.45±3.84 | 0.188±0.027 | 86.21±1.08 | No change | |
| 3 mo | 5.99±0.05 | 21745±168 | 30.67±1.21 | 97.76±1.02 | 113.92±4.01 | 0.194±0.029 | 85.73±1.15 | No change | |
| 6 mo | 5.97±0.06 | 21634±175 | 30.41±1.24 | 97.23±1.08 | 115.68±4.23 | 0.203±0.032 | 85.14±1.22 | No change | |
| 9 mo | 5.94±0.07 | 21489±182 | 30.08±1.28 | 96.67±1.14 | 117.91±4.51 | 0.212±0.035 | 84.38±1.29 | No change | |
| 12 mo | 5.91±0.08 | 21312±189 | 29.73±1.32 | 96.02±1.19 | 120.45±4.78 | 0.224±0.039 | 83.52±1.35 | No change |
Value are expressed as mean±SD (n = 3).
DISCUSSION
The results of the present study showed that the transethosomal gel of Rubia cordifolia extract formulated and optimized has potential for the enhancement of its dermal delivery for psoriasis treatment. At the extract in ethanol, the linearity of the calibration curve showed good value (R² = 0.9989) showing the use of UV spectrophotometric method for quantification using this extract in the formulation and permeation studies. The extract was highly soluble in ethanol (76.54±1.89 mg/ml), but practically insoluble in water (0.052±0.07 mg/ml), which was solubility analysis, and as a result, lipids based nanocarrier system was utilized to improve its bioavailability and topical retention [33]. As reported for other hydrophobic herbal actives, transethosomes were selected for this study, similar solubility challenges. Differential Scanning Calorimetry investigated the thermal behavior of the pure extract which showed a characteristic melting peak at 107.00 °C which was still present in physical mixture (105.64 °C) showing that the integrity of the drug crystalline was retained and there was no strong interaction with the excipients (fig. 2 and 3) [34]. FTIR analysis also showed that all functional peaks of the extract (O–H, C=O, C–O, C–H) were still present in the physical mixture without any major shift indicating chemical compatibilities (Figure: FTIR graph). The same has also been reported for stable herbal formulations employing PHL based nanocarriers [35].
Using Box–Behnken optimization approach, variables that define formulation were identified as influencing variables for vesicle size, zeta potential, and encapsulation efficiency. Vesicle size was from 93.96 to 158.94 nm, and in F17, which had the highest phospholipon and sodium deoxycholate concentrations, the smallest size was seen. Previous similar transdermal systems has shown that better skin penetration is associated with smaller vesicle sizes. Model adequacy was validated through adequate precision values (vesicle size: 9.65, zeta potential: 11.27, encapsulation efficiency: 8.94, all>4), coefficient of variation<15% (vesicle size: 12.3%, zeta potential: 8.7%, encapsulation efficiency: 11.2%), and normal residual distribution, confirming model reliability for optimization. In the past researchers have used zeta potential to measure colloidal stability ranging from –19.27 to –31.53 mV with more negative values imply better colloidal stability. The anionic edge activator sodium deoxycholate was found to be very effective at enhancing charge and dispersion of vesicles [36]. The encapsulation efficiencies varied from 67.24% to 86.54% with the highest entrapment occurring in F13 [37]. Particularly, the high lipid content and surfactant ratio were responsible for stabilizing the vesicles and trapping the lipophilic constituents of Rubia cordifolia by virtue of these structures (table 1). The reported entrapment efficiencies, while indicating formulation trends, may require validation using alternative methods such as dialysis or size exclusion chromatography to avoid potential vesicle disruption associated with ultracentrifugation. Further, the optimized batch TF3 was further formed into a gel comprised of Gellan gum and Carbopol 940. The selection criteria for gel optimization were established based on topical formulation requirements: pH compatibility with skin (5.5-6.5), viscosity range ensuring spreadability without dripping (18,000-25,000 cP), adequate spreadability for patient compliance (>28 g·cm/s), and uniform drug distribution (>95% content). Among TF1-TF4, only TF2 and TF3 metal criteria, with TF3 demonstrating superior performance values, justifying its selection as the optimized formulation [38].
Using goat skin as a model with validated sink conditions (PBS pH 7.4+1% Tween 80), sustained drug release was demonstrated over 12 h in ex vivo permeation studies. The addition of Tween 80 ensured adequate solubility of lipophilic constituents (78.4 μg/ml vs. 3.68 μg/ml in PBS alone), maintaining sink conditions essential for accurate permeation assessment. Among other batches, TF3 possessed the maximum cumulative drug release (91.05±2.32%) (Table: Percentage Cumulative Drug Release; Figure: Ex-Vivo drug permeation study). However, the study acknowledges the limitation of not including control formulations such as plain extract gel, conventional liposomal formulation, and standard marketed products for direct comparison to validate the superiority of the transethosome delivery system [39]. The increased release can be explained by the nanosized vesicles and the ability of the gel matrix to hydrate and thus to facilitate diffusion of the drug. While these results suggest improved permeation characteristics, comparative studies with control formulations including plain extract gel, conventional liposomes, and marketed topical products would be necessary to definitively establish the superiority of the transethosome delivery system. The results are consistent with other transethosomal systems for herbal extracts that increase skin permeability, though specific studies on Rubia cordifolia transethosomal delivery remain limited. However, these permeation studies demonstrate delivery enhancement but do not establish anti-psoriatic therapeutic efficacy, which would require evaluation in relevant biological models. Also, the values of the flux as well as the permeation coefficient were highest for TF3 (7.59 µg/cm²/h and 2.53 respectively), which indicates a strong capability for sustained and efficient skin delivery (table 12 State Flux) [40]. Comparative permeation studies confirmed transethosomal delivery advantages over conventional formulations. The 2.2-fold enhancement over conventional gel validates the vesicular delivery system's efficacy in improving extract penetration. While direct comparison with commercial psoriasis treatments (calcipotriol) represents different active principles, the established enhancement ratios demonstrate significant improvement over conventional topical delivery approaches. Comprehensive stability evaluation included both accelerated (40±2 °C/75±5% RH) and long-term (25±2 °C/60±5% RH) storage conditions following ICH Q1A(R2) guidelines. Critical vesicle integrity parameters within gel matrix showed gradual changes: vesicle size increased from 111.73±3.73 nm to 121.39±5.02 nm, PDI increased from 0.186±0.026 to 0.215±0.038, and encapsulation efficiency decreased from 86.54±1.05% to 83.67±1.31% over 3 mo accelerated storage (table 13), indicating good robustness of the formulation. Under long-term storage (25±2 °C/60±5% RH), formulation TF3 demonstrated superior stability with gradual parameter changes over 12 mo: vesicle size reached 120.45±4.78 nm, PDI increased to 0.224±0.039, and EE declined to 83.52±1.35%, while maintaining drug content>96%. No visible aggregation or phase separation was observed, confirming acceptable colloidal stability of transethosomes within the gel matrix. Drug content was>95% as observed on visual observation and according to ICH guidelines regarding semisolid dosage forms. These findings are supported by the obtained physical and chemical stability of the optimized gel, together with DSC and FTIR data [40]. The study acknowledges methodological limitations including the use of ultracentrifugation for EE determination, which may cause vesicle rupture and potentially overestimate or underestimate true entrapment values and absence of detailed phytochemical profiling. Future studies should employ non-disruptive separation methods such as dialysis or size exclusion chromatography to validate these findings and ensure accurate assessment of drug entrapment within intact vesicles.
CONCLUSION
Based on the present study, the developed and optimized transethosomal gel containing Rubia cordifolia extract showed a successful delivery potential for topical treatment of psoriasis. Such vesicles prepared from the processed formulation (TF3) exhibit a preferred vesicle size, a high drug entrapment, sustained release, excellent skin permeation, and good stability that suggests it may be a good candidate for enhanced dermal delivery. Transethosomes containing the combination of phospholipids and surfactants greatly enhanced the solubility and bioavailability of lipophilic extract. These results raise the possibility that these compounds may achieve these objectives in managing chronic skin conditions in the clinic. Future studies should include comparative evaluation with control formulations such as plain extract gel, conventional liposomal formulations, and standard marketed products to validate the specific advantages of the transethosome delivery system. Also the formulation is suitable for future therapeutic application due to its compatibility, consistency and stability. To validate its clinical utility and establish superiority over existing formulations, further studies are required including comparative evaluation with control formulations (plain extract gel, conventional liposomes, marketed products), in vitro efficacy studies, and in vivo dermatokinetic evaluations before this material can be considered for product development.
ABBREVIATIONS
PDI: Polydispersity Index; EE: Entrapment Efficiency; Jss: Steady-state Flux; DSC: Differential Scanning Calorimetry; FTIR: Fourier Transform Infrared Spectroscopy; ANOVA: Analysis of Variance; BBD: Box-Behnken Design; Franz: Franz Diffusion Cell; UV: Ultraviolet Spectroscopy; NDDS: Novel Drug Delivery System.
AUTHORS CONTRIBUTIONS
All authors have equal contribution
CONFLICT OF INTERESTS
Declared none
REFERENCES
Gangadevi V, Thatikonda S, Pooladanda V, Devabattula G, Godugu C. Selenium nanoparticles produce a beneficial effect in psoriasis by reducing epidermal hyperproliferation and inflammation. J Nanobiotechnology. 2021;19(1):101. doi: 10.1186/s12951-021-00842-3, PMID 33849555.
Tashiro T, Sawada Y. Psoriasis and systemic inflammatory disorders. Int J Mol Sci. 2022;23(8):4457. doi: 10.3390/ijms23084457, PMID 35457278.
Deng Y, Fang Z, Cui S, Zhao J, Zhang H, Chen W. Evaluation of probiotics for inhibiting hyperproliferation and inflammation relevant to psoriasis in vitro. J Funct Foods. 2021;81:104433. doi: 10.1016/j.jff.2021.104433.
Mercurio L, Morelli M, Scarponi C, Scaglione GL, Pallotta S, Albanesi C. PI3Kδ sustains keratinocyte hyperproliferation and epithelial inflammation: implications for a topically druggable target in psoriasis. Cells. 2021;10(10):2636. doi: 10.3390/cells10102636, PMID 34685616.
Tang X, Liu X, Mikaye MS, Zhao H, Zhang Y. Traditional Chinese medicine in the treatment of high incidence diseases in cold areas: the thrombotic diseases. Frigid Zone Med. 2021;1(1):23-44. doi: 10.2478/fzm-2021-0005.
Khan MS, Aziz S, Khan MZ, Khalid ZM, Riaz M, Ahmed D. Antihyperglycemic effect and phytochemical investigation of Rubia cordifolia (Indian Madder) leaves extract. Open Chem. 2021;19(1):586-99. doi: 10.1515/chem-2021-0053.
Soni U, Malviya J, Singh D. Ethno-botanical study of medicinal plants from Vidisha, Madhya Pradesh: methanolic extracts of four species and their antimicrobial anti-inflammatory and toxicity properties. Macromolecular Symposia. 2024;413(2):2300094. doi: 10.1002/masy.202300094.
Watroly MN, Sekar M, Fuloria S, Gan SH, Jeyabalan S, Wu YS. Chemistry biosynthesis physicochemical and biological properties of rubiadin: a promising natural anthraquinone for new drug discovery and development. Drug Des Dev Ther. 2021;15:4527-49. doi: 10.2147/DDDT.S338548, PMID 34764636.
El Zaafarany GM, Nasr M. Insightful exploring of advanced nanocarriers for the topical/transdermal treatment of skin diseases. Pharm Dev Technol. 2021;26(10):1136-57. doi: 10.1080/10837450.2021.2004606, PMID 34751091.
Golestani P. Lipid based nanoparticles as a promising treatment for the skin cancer. Heliyon. 2024;10(9):e29898. doi: 10.1016/j.heliyon.2024.e29898, PMID 38698969.
Patel D, Patel B, Thakkar H. Lipid based nanocarriers: promising drug delivery system for topical application. Eur J Lipid Sci Technol. 2021;123(5):2000264. doi: 10.1002/ejlt.202000264.
Paiva Santos AC, Silva AL, Guerra C, Peixoto D, Pereira Silva M, Zeinali M. Ethosomes as nanocarriers for the development of skin delivery formulations. Pharm Res. 2021;38(6):947-70. doi: 10.1007/s11095-021-03053-5, PMID 34036520.
Wang Y, Wang R, Qi X, Li W, Guan Q, Wang R. Novel transethosomes for the delivery of brucine and strychnine: formulation optimization characterization and in vitro evaluation in hepatoma cells. J Drug Deliv Sci Technol. 2021;64:102425. doi: 10.1016/j.jddst.2021.102425.
Yurtsever AG, Ekmekcioglu A, Muftuoglu M, Gungor S, Erdal MS. Formulation development and evaluation of fluvastatin loaded transethosomes: characterization stability in vitro dermal penetration cytotoxicity and antipsoriatic activity studies. J Drug Deliv Sci Technol. 2024;91:105234. doi: 10.1016/j.jddst.2023.105234.
Alyami MH, Alyami HS, Abdo AM, A Sabry SA, El Nahas HM, Ayoub MM. Maximizing the use of ivermectin transethosomal cream in the treatment of scabies. Pharmaceutics. 2024;16(8):1026. doi: 10.3390/pharmaceutics16081026, PMID 39204371.
Baghli F, Moussaoui Khedam N. Optimization of the experimental design parameters for synthesis of fluconazole loaded transethosomes as nano-based antifungal vesicles. GSC Biol Pharm Sci. 2024;28(3):71-83. doi: 10.30574/gscbps.2024.28.3.0317.
Adin SN, Gupta I, Aqil M, Mujeeb M, Najmi AK. Synergistically engineered nanotransethosomes for co-delivery of methotrexate and baicalin for enhanced transdermal delivery against rheumatoid arthritis: formulation characterisation and in vivo pharmacodynamic evaluation. J Drug Target. 2024;32(6):707-23. doi: 10.1080/1061186X.2024.2347371, PMID 38652489.
Adin SN, Gupta I, Aqil M, Mujeeb M, Najmi AK. Nanotransethosomal dual-drug loaded gel of methotrexate and mangiferin as a potent synergistic intervention for rheumatoid arthritis via transdermal delivery. J Drug Target. 2025;33(5):773-92. doi: 10.1080/1061186X.2024.2447793, PMID 39723960.
Adnan M, Haider MF, Naseem N, Haider T. Transethosomes: a promising challenge for topical delivery short title: transethosomes for topical delivery. Drug Res (Stuttg). 2023;73(4):200-12. doi: 10.1055/a-1974-9078, PMID 36736354.
Atia HA, Shahien MM, Ibrahim S, Ahmed EH, Elariny HA, Abdallah MH. Plant-based nanovesicular gel formulations applied to skin for ameliorating the anti-inflammatory efficiency. Gels. 2024;10(8):525. doi: 10.3390/gels10080525, PMID 39195054.
Nayak BS, Mohanty B, Mishra B, Roy H, Nandi S. Transethosomes: cutting edge approach for drug permeation enhancement in transdermal drug delivery system. Chem Biol Drug Des. 2023;102(3):653-67. doi: 10.1111/cbdd.14254, PMID 37062593.
Verma S, Utreja P. Exploring therapeutic potential of invasomes transfersomes transethosomes oleic acid vesicles and cubosomes adopting topical/transdermal route. MNS. 2022;14(1):3-20. doi: 10.2174/1876402913666210406163452.
Cocos FI. A quality-by-design approach for optimisation of docetaxel transferosomal formulations. Farmacia. 2024;72(5):1077-91. doi: 10.31925/farmacia.2024.5.10.
Lizzie LOBO C, Priya S. Design and characterization of transethosomes loaded with rivastigmine for enhanced transdermal delivery. JRP. 2024;28(5):1409-22. doi: 10.29228/jrp.819.
Lestari PM, Harahap Y, Louisa M, Surini S. Development of transethosomes patch for delivery atorvastatin calcium transdermally: in vitro and in vivo studies. J Pharm Sci. 2025;114(4):103695. doi: 10.1016/j.xphs.2025.02.001, PMID 39947616.
Aldawsari MF, Alam A, Imran M. Rutin loaded transethosomal gel for topical application: a comprehensive analysis of skin permeation and antimicrobial efficacy. ACS Omega. 2024;9(25):27300-11. doi: 10.1021/acsomega.4c01718, PMID 38947795.
Rodriguez Luna A, Talero E, Avila Roman J, Romero AM, Rabasco AM, Motilva V. Preparation and in vivo evaluation of rosmarinic acid-loaded transethosomes after percutaneous application on a psoriasis animal model. AAPS PharmSciTech. 2021;22(3):103. doi: 10.1208/s12249-021-01966-3, PMID 33712964.
Khalid H, Batool S, Din FU, Khan S, Khan GM. Macrophage targeting of nitazoxanide loaded transethosomal gel in cutaneous leishmaniasis. R Soc Open Sci. 2022;9(10):220428. doi: 10.1098/rsos.220428, PMID 36249328.
Asghar Z, Jamshaid T, Jamshaid U, Madni A, Akhtar N, Lashkar MO. In vivo evaluation of miconazole nitrate loaded transethosomal gel using a rat model infected with Candida albicans. Pharmaceuticals (Basel). 2024;17(5):546. doi: 10.3390/ph17050546, PMID 38794118.
Kamble S, Bangale G, Deshmukh R, Dawargave K, Shingare D, Suryawanshi O. Development and optimization of nimesulide loaded transethosomal gel. Bio Nano Science. 2025;15(2):223. doi: 10.1007/s12668-025-01802-z.
Adnan M, Afzal O, SA Altamimi A, Alamri MA, Haider T, Faheem Haider M. Development and optimization of transethosomal gel of apigenin for topical delivery: in vitro, ex-vivo and cell line assessment. Int J Pharm. 2023;631:122506. doi: 10.1016/j.ijpharm.2022.122506, PMID 36535455.
Ferrara F, Benedusi M, Cervellati F, Sguizzato M, Montesi L, Bondi A. Dimethyl fumarate loaded transethosomes: a formulative study and preliminary ex vivo and in vivo evaluation. Int J Mol Sci. 2022;23(15):8756. doi: 10.3390/ijms23158756, PMID 35955900.
Abdulbaqi IM, Darwis Y, Assi RA, Khan NA. Transethosomal gels as carriers for the transdermal delivery of colchicine: statistical optimization characterization and ex vivo evaluation. Drug Des Dev Ther. 2018;12:795-813. doi: 10.2147/DDDT.S158018, PMID 29670336.
Garg V, Singh H, Bhatia A, Raza K, Singh SK, Singh B. Systematic development of transethosomal gel system of piroxicam: formulation optimization in vitro evaluation and ex vivo assessment. AAPS PharmSciTech. 2017;18(1):58-71. doi: 10.1208/s12249-016-0489-z, PMID 26868380.
Verma S, Utreja P. Transethosomes of econazole nitrate for transdermal delivery: development in vitro characterization and ex-vivo assessment. Pharm Nanotechnol. 2018;6(3):171-9. doi: 10.2174/2211738506666180813122102, PMID 30101725.
Ramadon D, Pramesti SS, Anwar E. Formulation stability test and in vitro penetration study of transethosomal gel containing green tea (Camellia sinensis L. Kuntze) leaves extract. Int J App Pharm. 2017;9(5):91. doi: 10.22159/ijap.2017v9i5.20073.
Arora D, Khurana B, Nanda S. Statistical development and in vivo evaluation of resveratrol loaded topical gel containing deformable vesicles for a significant reduction in photo-induced skin aging and oxidative stress. Drug Dev Ind Pharm. 2020;46(11):1898-910. doi: 10.1080/03639045.2020.1826507, PMID 32962434.
Kaur P, Garg V, Bawa P, Sharma R, Singh SK, Kumar B. Formulation systematic optimization in vitro ex vivo and stability assessment of transethosome based gel of curcumin. Asian J Pharm Clin Res. 2018;11(14)Suppl 2:41. doi: 10.22159/ajpcr.2018.v11s2.28563.
Fu X, Shi Y, Wang H, Zhao X, Sun Q, Huang Y. Ethosomal gel for improving transdermal delivery of thymosin β-4. Int J Nanomedicine. 2019;14:9275-84. doi: 10.2147/IJN.S228863, PMID 31819429.
Abdallah MH, Shawky S, Shahien MM, El Horany HE, Ahmed EH, El Housiny S. Development and evaluation of nano-vesicular emulsion based gel as a promising approach for dermal atorvastatin delivery against inflammation. Int J Nanomedicine. 2024;19:11415-32. doi: 10.2147/IJN.S477001, PMID 39530108.