
Int J App Pharm, Vol 18, Issue 1, 2026, 141-154Original Article
DEVELOPMENT AND OPTIMIZATION OF MESOPOROUS SILICA NANOPARTICLES LOADED WITH ADIANTUM PHILIPPINES FRACTION AND THUJA OIL AS A POTENTIAL WOUND HEALING AGENT
SWATI A. PAGAR1*, NILIMA A. THOMBRE2
1MET's Institute of Pharmacy (Affiliated to Savitribai Phule Pune University) Adgaon, Nashik. MS, India. 2Department of Pharmaceutics, MET's Institute of Pharmacy, (Affiliated to Savitribai Phule Pune University) Adgaon, Nashik. MS, India
*Corresponding author: Swati A. Pagar; *Email: swati.pagar2210@gmail.com
Received: 27 Jun 2025, Revised and Accepted: 04 Dec 2025
ABSTRACT
Objective: This study aimed to develop and optimize mesoporous silica nanoparticles (MSNs) loaded with Adiantum Philippines chloroform fraction and Thuja occidentalis essential oil for enhanced wound healing applications, addressing the clinical need for improved topical therapeutic delivery systems.
Methods: MSNs were synthesized using the sol-gel method and optimized through box-behnken factorial design with three variables: CTAB concentration (1-3g), TEOS volume (8-16 ml), and stirring time (1-4h). Seventeen formulations were evaluated for particle size, zeta potential, and entrapment efficiency. The optimized formulation was characterized using FTIR, DSC, SEM, and DLS, followed by in vitro drug release and stability studies. Wound healing efficacy was assessed using full-thickness excision wounds in Balb-c mice over 14 d.
Results: The optimized F5 formulation, selected based on desirability function (1.000), demonstrated superior properties: particle size 89.3±4.8 nm, zeta potential-26.8±1.0mV, and entrapment efficiencies of 86.4% and 89.2% for AP and TO respectively. F5 exhibited controlled drug release (81-82% over 12h) and excellent stability over 6 mo. In vivo studies revealed significantly enhanced wound healing with 96.2±2.1% contraction at day 14 compared to control (72.3±4.8%) and standard treatment (89.1±3.5%) (p<0.01).
Conclusion: The optimized MSN formulation demonstrates promising wound healing potential with accelerated tissue regeneration compared to standard silver sulfadiazine treatment. These preclinical findings suggest potential for clinical development pending comprehensive safety, toxicity, and regulatory studies
Keywords: Mesoporous silica nanoparticles, Wound healing, Response surface methodology, Adiantum philippines, Thuja occidentalis, Controlled drug delivery
© 2026 The Authors. Published by Innovare Academic Sciences Pvt Ltd. This is an open access article under the CC BY license (https://creativecommons.org/licenses/by/4.0/)
DOI: https://dx.doi.org/10.22159/ijap.2026v18i1.55787 Journal homepage: https://innovareacademics.in/journals/index.php/ijap
INTRODUCTION
Wound healing is a major global problem, impacting around 305 million individuals each year and in the U. S., chronic wounds alone affect more than 6.5 million people [1]. It is estimated that the worldwide costs of wound care reach $96 billion and each patient’s costs depend on how serious the wound is and if it causes complications [2]. There are several problems with today’s therapies, including it takes a long time to heal, risk of infections, not enough patient compliance and drugs do not reach the intended tissues properly [3]. Standing dressings typically do not keep medicines in the wound for long, so they have to be applied many times and may add to the cost of healthcare [4]. Because diabetes, obesity and the elderly are more common now, there is greater demand for new wound care methods. Studies show that wounds are linked to approximately 185,000 deaths per year, which makes finding new ways to heal and manage wounds quickly and safely crucial [5].
The fern Adiantum Philippines which is better known as the Philippine maidenhair fern, has recently appeared as an interesting bioactive substance that promotes healing of wounds [6]. Plants from this group are rich in substances called flavonoids, phenolic acids, terpenoids and saponins, which have powerful anti-inflammatory, antimicrobial and tissue-regeneration activities [7]. The main medicinal components in turmeric are strong antioxidants, with IC50 values varying from 15 to 45 μg/ml, which helps by clearing dangerous reactive oxygen species that prevent wound healing [8]. Studies on phytochemicals have pointed out that kaempferol, quercetin and chlorogenic acid are responsible for greater collagen synthesis and more angiogenesis [9]. Research on these Adiantum extracts reveals they speed up wound closure by almost two-thirds of the standard rate and at the same time reduce swelling by roughly 60%. The bioactive fraction is easy for human dermal fibroblasts and keratinocytes to recognize and use, supporting cell growth and movement needed for proper healing of wounds. It also shows strong effects against many common bacteria that cause wounds, including Staphylococcus aureus, Pseudomonas aeruginosa and Escherichia coli [10].
Mesoporous silica nanoparticles help fix some problems that arise with current wound treatment approaches [11]. These biocompatible carriers have unique structures such as adjustable pore sizes ranging from 2 to 50 nm, large surface areas reaching more than 1000 m²/g and strong abilities to hold both water-loving (hydrophilic) and fat-loving (lipophilic) compounds [12]. With controlled release, the medicine can be released over a long period, which lessens the number of doses needed while keeping the right amount of medicine at the injury site. Using improved surface joinder, it is possible to direct medicines straight to the targeted cells, which achieves better drug management and less exposure elsewhere in the body [13]. Protection against enzymatic breakdown and unfavorable conditions is provided by the silica matrix which allows delicate bioactive compounds to last longer [14]. In addition, these nanocarriers can easily reach affected tissues, which helps heal wounds from the inside. Since silica is biocompatible, it leads to few toxic effects and less inflammation which makes it perfect for wound care products [15].
This research aims to make and improve Adiantum Philippines bioactive fraction mesoporous silica nanoparticle conjugates loaded with Thuja oil to better assist wound healing. Specific aims are to describe the shape of the nanoparticles, examine how efficiently they take up the drug, test their level of drug release and find out how effective they are in stimulating wound healing by means of experiments both in a dish and on animals.
MATERIALS AND METHODS
Materials
Cetyltrimethylammonium bromide (CTAB, analytical grade, 99% purity) and tetraethyl orthosilicate (TEOS, analytical grade, 98% purity) were procured from Sciquaint Chemicals (Pune, India). Thuja occidentalis essential oil and Adiantum Philippines chloroform fraction were collected from local areas of Pune, Maharashtra, India (18.516726°N, 73.856255°E). Hydrochloric acid (HCl, analytical grade, 37%), sodium hydroxide (NaOH, analytical grade, 98%), methanol (HPLC grade), and ethanol (analytical grade, 99.9%) were obtained from Research Lab Fine Chem Industries (Mumbai, India). Phosphate-buffered saline (PBS, pH 7.4), dimethyl sulfoxide (DMSO, analytical grade), and dialysis membrane (molecular weight cut-off 12,000-14,000 Da) were sourced from Neeta Chemicals (Pune, India). Silver sulfadiazine cream (USP grade) for comparative studies was purchased from Sciquaint Innovations Pvt. Ltd. (Pune, India). All other chemicals and reagents used were of analytical grade and used without further purification. Relative centrifugal force (RCF) was calculated using the formula: RCF = 1.118 × 10⁻⁵ × r × N², where r is radius (cm) and N is speed (rpm).
Methods
Preparation of Adiantum Philippines (AP) fraction
The process was done to obtain the chloroform-soluble fraction from Adiantum philippense for use in pharmaceuticals. Fresh Adiantum philippense leaves (about 500 g) were collected from the Western Ghats region (coordinates: 17.9238° N, 73.6586° E) and ground using a mechanical grinder (Remi Motors Ltd., Mumbai, India, Model RQ-127A) after drying them for 48 h at 40 °C. The solid sample (100 g) was subjected to Soxhlet extraction using 95% ethanol (1000 ml) in a Soxhlet apparatus (Borosil Glass Works Ltd.) at 78 °C for 8 h, allowing continuous cycling. The ethanolic extract was concentrated under reduced pressure using a rotary evaporator (IKA-Werke, model RV 10 digital) at 40 °C. For column chromatography, 25 g of concentrated extract was dissolved in minimum methanol (5 ml) and loaded onto a glass column (45 cm length × 3.5 cm internal diameter) packed with 150 g silica gel 60-120 mesh (China Light and Chemical Co. Ltd). The column was eluted using a gradient system: hexane (500 ml), hexane: chloroform (1:1, 300 ml), chloroform (400 ml), chloroform: methanol (9:1, 200 ml). Fractions were collected based on TLC monitoring (silica gel plates, chloroform: methanol 9:1, visualization under UV 254 nm and vanillin-sulfuric acid spray). The chloroform fraction (fractions 15-28, Rf 0.4-0.6) was pooled, concentrated under reduced pressure, and dried in vacuum desiccator for 24 h. Yield: 3.2±0.3% w/w of dried plant material. All extractions were performed in triplicate (n = 3) [16].
Isolation of essential oil from Thuja occidentalis (TO)
Essential oil extracts from Thuja occidentalis were collected by hydrodistillation to preserve the volatile active compounds. Thuja occidentalis leaves were gathered from the botanical garden area in Pune, Maharashtra, India (coordinates: 18.5204° N, 73.8567° E), chopped, washed with distilled water, and dried over 48 h in a refrigerator. Approximately 1500 ml of the prepared plant material, along with distilled water was added into a 2000 ml round-bottom flask and connected to a Clevenger apparatus (Borosil Glass Works Ltd., Gujarat, India). Hydrodistillation was carried out at 100 °C for 4 h using a heating mantle (Technico Equipment Pvt. Ltd., Delhi, model TEM-1000). The distillate was collected in the graduated section of the Clevenger apparatus. The essential oil was separated from the aqueous layer using a separating funnel and dried with anhydrous sodium sulfate. The oil yield was calculated as the amount of oil obtained per 100 gs of fresh plant material. The extracted essential oil was stored in amber-colored vials at 4 °C until further use [17, 18].
FTIR analysis (Pure drug and physical mixture)
Fourier Transform Infrared spectroscopy was used to discover functional groups and determine compatibility between the drug and excipients in single compounds and mixes. A Shimadzu IR Affinity-1S FTIR spectrometer (Shimadzu Scientific Instruments Pvt. Ltd., Mumbai, India) with an ATR (Attenuated Total Reflectance) attachment was used for the FTIR analysis. An ATR accessory diamond crystal was placed over a sample each of AP fraction (2 mg), TO essential oil (2 μL) and the physical mixture (1:1 ratio, 4 mg total). The spectroscopy was carried out from 4000 to 400 cm⁻¹, with a resolution of 4 cm⁻¹ and 32 scans for each sample was used at a room temperature (25±2 °C) setting. Each measurement was completed with the background first corrected using ambient air. The infrared (IR) solution software helped to detect peaks and then the spectra found in the software were matched to reference standards. Various measurements were all made in triplicates (n=3) and the average spectra were shared [19, 20].
DSC analysis (Pure drug and physical mixture)
Differential Scanning Calorimetry was carried out to examine the drug’s thermal properties and analyze interactions with other ingredients using thermal changes. A Perkin Elmer DSC 4000 instrument (PerkinElmer India Pvt. Ltd., Mumbai, India) was used for the analysis with indium as a reference standard. The contents were weighed as AP fraction (3-5 mg), TO essential oil (2-3 mg) and physical mixture (equaling 5-7 mg). The samples were then put into pans with pierced aluminum lids. A reference was made using an empty aluminum pan. Scanning started at 30 °C and ended at 300 °C while the sample was heated at a rate of 10 °C/min under nitrogen atmosphere (flow rate: 20 ml/min). From the thermograms, the Tg, Tm and enthalpy of fusion (ΔHf) were measured using the software. For each measurement, we repeated the process three times (n=3) and reported the mean value and standard deviation [21, 22].
Synthesis of mesoporous silica nanoparticles (MSNs)
The synthesis of mesoporous silica nanoparticles involved the sol-gel method and the addition of cetyltrimethylammonium bromide (CTAB) to help shape the nanoparticles. It was done to produce a drug delivery system that releases the drug slowly and has a large surface combined with an even pores structure. The CTAB (2.0 g, Sigma-Aldrich Chemicals Pvt. Ltd., Bangalore, India) was stirred in warmed distilled water (300 ml) at 350 rpm for half an hour, using a magnetic stirrer (Remi Motors Ltd., Mumbai, India, Model 2MLH) in the presence of heat at 80 °C. A 2 M sodium hydroxide solution (7 ml) was carefully added to the mixture and stirring continued for another 10 min. TEOS (10 ml, Merck Life Science Pvt. Ltd., Mumbai, India) was carefully added over 5 min, as the mixture was constantly stirred and heated at 80 °C for 2 h. The crystals were filtered through Whatman filter paper No. 1, washed twice with distilled water and twice with ethanol (in 100 ml portions each) and left to dry at 60 °C for 12 h. Template removal was performed using ethanol-acid extraction method to preserve heat-sensitive phytoconstituents. The CTAB-containing MSNs were refluxed in acidified ethanol (1% HCl in ethanol, v/v) at 60 °C for 12 h with continuous stirring. The process was repeated three times, followed by washing with ethanol and drying at 60 °C. This mild extraction method prevents degradation of flavonoids and terpenes, as confirmed by HPLC analysis showing>95% retention of bioactive compounds compared to<40% retention with calcination. Characterization of the MSNs included particle size distribution, surface area, pore volume, and pore size distribution analysis using BET methodology to confirm mesoporous structure integrity and drug accommodation capacity. Each sample was synthesized in three (n=3) separate runs [23, 24].
X-ray diffraction (XRD) analysis
X-ray diffraction analysis was performed using a Rigaku MiniFlex 600 diffractometer (Rigaku Corporation, Tokyo, Japan) with Cu Kα radiation (λ = 1.5406 Å) at 40 kV and 15 mA. Small-angle XRD was conducted in 2θ range 0.5-10° to confirm mesoporous structure. Powdered MSNs (100 mg) were mounted on glass slides under ambient conditions. Peak identification and d-spacing calculations used Bragg equation. Measurements performed in triplicate using MiniFlex Guidance software.
Experimental design for formulations
A Box-Behnken Design (BBD) was employed to optimize the formulation parameters and evaluate the effect of independent variables on dependent responses. The experimental design was implemented using Design-Expert software (Version 13, Stat-Ease Inc., Minneapolis, USA) to minimize the number of experimental runs while maximizing information content. Three independent variables were selected based on preliminary studies: CTAB concentration (X₁), TEOS volume (X₂), and stirring time (X₃). Each variable was studied at three levels (-1, 0,+1) representing low, medium, and high concentrations respectively [25, 26]. The general equation for the Box-Behnken design is represented as:
Y = β₀+β₁X₁+β₂X₂+β₃X₃+β₁₂X₁X₂+β₁₃X₁X₃+β₂₃X₂X₃+β₁₁X₁²+β₂₂X₂²+β₃₃X₃²
Where Y represents the dependent variable response, β₀ is the intercept, β₁, β₂, β₃ are linear coefficients, β₁₂, β₁₃, β₂₃ are interaction coefficients, and β₁₁, β₂₂, β₃₃ are quadratic coefficients.
Drug loading of AP fraction and TO essential oil into MSNs
Impregnation was used to incorporate both AP and TO into the mesoporous silica nanoparticles during drug loading. Loading the drugs allowed for better and controlled release of the bioactive compounds in the body. For the calcined magnesium silicate nanoparticles (500 mg), we used an ultrasonicator (PCI Analytics Pvt. Ltd., Mumbai) at a frequency of 40 kHz for the sake of homogenous distribution of the particles in 50 ml ethanol at 25±2 °C for 15 min. Drug loading optimization studies revealed sequential loading as optimal: AP fraction (100 mg in 10 ml ethanol) was loaded first for 6 h due to its larger molecular size requiring longer diffusion time, followed by TO essential oil (100 μL) for 2 h. Comparative studies showed this sequence achieved higher entrapment efficiency (86.4% AP, 89.2% TO) versus simultaneous loading (78.2% AP, 82.1% TO) or reverse sequence (71.3% AP, 85.6% TO). No competitive displacement was observed during sequential loading as confirmed by HPLC analysis. Nanoparticles carrying the drug were separated using centrifugation at 10,000 rpm (9,391 × g) for 20 minon the Remi Motors Ltd. high-speed centrifuge (Model R-24). The supernatant was collected and examined to find out what unentrapped drug it contained. Three washes with ethanol (20 ml each) followed by drying under vacuum at 40 °C for 24 h were applied to the drug-loaded MSNs. The drug loading efficiency and encapsulation efficiency were measured using these formulas:


Drug content analysis was performed using UV-Visible spectrophotometry (Shimadzu UV-1900i, Shimadzu Scientific Instruments Pvt. Ltd., Mumbai, India) at λmax 280 nm for AP fraction after appropriate dilution with ethanol. TO essential oil content was determined by GC-MS analysis using characteristic peak area ratios. All drug loading experiments were performed in triplicate (n=3) and results were expressed as mean±standard deviation [27].
Table 1: Independent variables and their levels
| Variable | Symbol | Level (-1) | Level (0) | Level (+1) |
| CTAB Concentration (g) | X₁ | 1.5 | 2.0 | 2.5 |
| TEOS Volume (mL) | X₂ | 8 | 10 | 12 |
| Stirring Time (h) | X₃ | 1.5 | 2.0 | 2.5 |
| Dependent variables | Goal | |||
| Y₁: Encapsulation Efficiency (%) | Maximize | |||
| Y₂: Particle Size (nm) | Minimize |
Table 2: Formulation composition for box-behnken design
| Run | A: CTAB concentration (g) | B: TEOS volume (ml) | C: Stirring time (h) |
| F1 | 1.5 | 11 | 1.5 |
| F2 | 2 | 11 | 2 |
| F3 | 2 | 11 | 2 |
| F4 | 2.5 | 12 | 2 |
| F5 | 2 | 12 | 2.5 |
| F6 | 2.5 | 10 | 2 |
| F7 | 1.5 | 10 | 2 |
| F8 | 1.5 | 11 | 2.5 |
| F9 | 2.5 | 11 | 2.5 |
| F10 | 2 | 12 | 1.5 |
| F11 | 2 | 11 | 2 |
| F12 | 2.5 | 11 | 1.5 |
| F13 | 1.5 | 12 | 2 |
| F14 | 2 | 11 | 2 |
| F15 | 2 | 10 | 1.5 |
| F16 | 2 | 10 | 2.5 |
| F17 | 2 | 11 | 2 |
Characterization of MSNs
Particle size, PDI and zeta potential measurements
Particle size distribution, polydispersity index (PDI) and zeta potential were measured to examine the stability and behavior of drug-loaded MSNs in solution. Analysis of the dynamic light scattering (DLS) was done on a Malvern Z-sizer Nano ZS (Malvern Panalytical India Pvt. Ltd., Mumbai, India) with a He-Ne laser emitting at 633 nm. The MSNs (1 mg) were mixed in distilled water (10 ml) and treated with ultrasonic power for 5 min for even dispersion. The experiments were done at 25 °C, using a scattering angle of 173°. Particle size was found by using Z-average diameter, the PDI showed how uniform the size distribution was and zeta potential was measured by electrophoretic light scattering. Every sample was tested three times with 15 repetitions in each test. The findings were shown as the mean and the standard deviation [28].
SEM analysis
Scanning Electron Microscopy was carried out to examine the shape, size and surface of the MSNs before and after they were loaded with the drug. The study was performed with a Carl Zeiss EVO 18 Special Edition (Carl Zeiss India Scientific Pvt. Ltd., Bangalore) operated at a voltage of 20 kV. To prepare samples, powdered MSN dried on aluminum stubs using double-sided carbon tape, then 60 seconds at 20 mA during gold-palladium sputter coating using Quorum Technologies Q150R ES was done to help electricity flow through the particles. The images were obtained at different magnifications by working in high vacuum (10⁻⁶ mbar). To get average particle size and its distribution, one hundred particles (taken every 100 µm across the sample) were photographed and the pictures were analyzed using ImageJ [29].
In vitro drug release study
Release of AP fraction and TO essential oil from MSNs was tested through in vitro drug release studies at specific time points (0, 1, 2, 4, 6, 8, 10, 12 h). Drug release was done by using the dialysis bag method in a water bath at a controlled temperature (Macro Scientific Works Pvt. Ltd., Delhi, India, Model MSW-275). Drug-loaded MSNs (10 mg) were placed in pre-soaked dialysis bags (MWCO 12,000-14,000 Da) containing 5 ml phosphate buffer saline (pH 7.4). Dialysis bags were immersed in 500 ml release medium (PBS pH 7.4 with 0.5% Tween 80) at 37 °C±0.5 °C under continuous stirring (100 rpm). Sink conditions were validated by calculating sink index (SI = Vmedium × Cs/Ddose) where SI values of 15.2 (AP) and 18.7 (TO) confirmed adequate sink conditions (SI>3). At predetermined intervals, 5 ml samples were withdrawn and replaced with fresh medium. AP fraction content was quantified using validated HPLC method (Waters Alliance e2695, C18 column, mobile phase: acetonitrile: water 60:40, detection at 280 nm) with kaempferol as reference standard. TO essential oil was analyzed by GC-MS (Agilent 7890A GC coupled with 5975C MS) using characteristic peaks of α-thujone (m/z 152) and β-thujone (m/z 152) for quantification. All analyses were performed in triplicate with RSD<3%. A plot was made showing the cumulative release of each drug as a function of time. Release kinetics were analyzed using various mathematical models:
Zero-order: Qt = Q0+k0t (R² = 0.8234)
First-order: ln(Q∞-Qt) = ln Q∞-k1t (R² = 0.7891)
Higuchi: Qt = kH√t (R² = 0.9456)
Korsmeyer-Peppas: Qt/Q∞ = ktn
Best fit was achieved with Korsmeyer-Peppas model (highest R²). The release exponent (n = 0.67) indicates anomalous transport involving both diffusion and polymer chain relaxation as dominant release mechanisms. Release studies were done three times (n=3) for every condition studied [30].
In vivo animal study
Experimental animals
All in vivo studies on wound healing were carried out after getting ethical approval from the Institutional Animal Ethics Committee with letter number 1942/PO/Re/S/17/CPCSEA/2022/01/09. Male Balb-c mice that were 8-10 w old, weighing 25-30 g, were purchased from the Central Animal House facility and placed in standard polypropylene cages under controlled conditions (temperature: 22±2 °C, 55±5% humidity, 12 h light/dark cycle). All animals were fed pellets and given water as much as they wanted. A waiting period of 7 d was given before the experiments started. All animal procedures were done following the protocols of the CPCSEA for the treatment and use of laboratory animals [31].
Wound excision model
An excision wound model was used for evaluating efficacy with four groups (n=6 each): Group I (negative control) received normal saline, Group II received blank MSNs (without drug loading), Group III received optimized F5 formulation (drug-loaded MSNs), and Group IV received standard silver sulfadiazine cream (1% w/w). This design allows distinction between nanoparticle carrier effects and active compound effects. Ketamine hydrochloride (50 mg/kg) and xylazine (10 mg/kg) were given to animals through injection into the abdomen. The area in the middle of the back was shaved and wiped with 70% ethanol. A sterile 8 mm biopsy punch was used to produce 8 mm circular wounds in clean and aseptic conditions. Formulations were applied topically at a standardized dose of 2.0 mg/cm² wound area (approximately 0.1 g for 8 mm diameter wounds) once daily for 14 d. Dosing was calculated based on individual wound measurements to ensure consistent drug delivery per unit wound area. Wound area was checked on days 0, 3, 7, 10 and 14 using digital vernier calipers and wound contraction was calculated using the formula [32].

Photographic documentation was performed at each time point. On day 14, animals were sacrificed, and wound tissue samples were collected for histopathological examination using hematoxylin-eosin staining.
Stability study
Stability studies were done rapidly to see how the optimized drug-loaded MSNs perform under different stress scenarios following ICH Q1A (R2). The prepared formulation was added to amber-colored glass vials and placed in a stability chamber under accelerated conditions of 40±2 °C and 75±5% relative humidity (Thermolab Scientific Equipment Pvt. Ltd. (India), Model TH-180). The samples were taken at planned times (0, 1, 2, 3 and 6 mo) and examined for their looks, particle size, zeta potential, percentage of drug present and ways in which the drug was released in vitro. A Waters Alliance e2695 system and a photodiode array detector at λmax 280 nm were used to assess drug degradation through HPLC analysis (Waters India Pvt. Ltd., Bangalore, India). Stability tests were done and initial values were matched to judge the product’s shelf life. All experiments were done three times (n=3) and the data were examined statistically [33].
Statistical analysis
Results were studied and assessed using various statistical techniques to confirm and validate the outcome of the optimization model. All measurements are expressed as mean±standard deviation. Inter-group comparisons were performed using one-way ANOVA followed by Tukey's post-hoc test for multiple comparisons. Histopathological scores were analyzed using Kruskal-Wallis test followed by Dunn's multiple comparison testusing GraphPad Prism software (Version 8.0, GraphPad Software Inc., San Diego, USA). Design-Expert software (Version 13, Stat-Ease Inc., Minneapolis, USA) was used to conduct both Box-Behnken design analysis and response surface methodology to find the best conditions for the formulation. The cut-off for significance was p<0.05 in every analysis. To find out about the release of the drug, regression analysis was performed and coefficients were derived from the model fitting [34]. A priori power analysis using G*Power 3.1.9.7 determined n=6 per group adequate for detecting 20% differences in wound healing (power>0.80, α=0.05). Post-hoc analysis confirmed achieved power>0.85 for primary endpoints. Box-Behnken design provided sufficient power (>0.80) for response surface modeling with adequate precision>4 and R²>0.85.
RESULTS
FTIR spectral analysis
Adiantum Philippines chloroform component and Thuja occidentalis essential oil were incorporated into mesoporous silica nanoparticles, as confirmed by the FTIR analysis (fig. 1). The bands representing hydrogen-bonded OH groups at 3436.53 cm⁻¹ (AP) and 3790.4 cm⁻¹ (TO) were found to shift to 3530.08 cm⁻¹ after drug loading onto the MSNs, which proves interactions took place. The OH stretching was found at its usual frequency of 3429.78 cm⁻¹ and the C=O of the carbonyl group was located at 1787.69 cm⁻¹, so we know that the functional groups are kept. Successful encapsulation was ensured since the important bands of C=C stretching, C-O stretching and out-of-plane C-H bending were found in the spectrum.
DSC analysis
DSC showed different heating patterns, which prove that drugs are successfully inside the mesoporous silica nanoparticles (fig. 2). Both Adiantum Philippines and Thuja occidentalis showed their thermal transitions during DSC: 172.25 °C for Adiantum and 151.23 °C for Thuja. Endothermic peaks appeared at 149.48 °C and 171.52 °C in the thermogram of drug-loaded MSNs, this means the structure is now less organized and the drug is spread within the MSNs. The differences in the thermal behavior of loaded nanoparticles and pure substances verified that the drug was successfully stored inside the silica and may have changed to an amorphous state, which indicates effective incorporation.

Fig. 1: FTIR spectra of (A) Adiantum Philippines chloroform fraction, (B) Thuja occidentalis essential oil, and (C) AP-and TO-loaded mesoporous silica nanoparticles, demonstrating characteristic functional group vibrations and confirming successful drug loading without structural damage

Fig. 2: DSC thermograms of (A) Adiantum Philippines fraction, (B) Thuja occidentalis essential oil, and (C) AP-and TO-loaded mesoporous silica nanoparticles, showing thermal transitions indicative of molecular dispersion and entrapment within the silica matrix
XRD analysis
The wide-angle XRD pattern of the synthesized sample exhibited a broad diffraction peak cantered around 2θ ≈ 22°, which is characteristic of amorphous silica. The absence of sharp crystalline peaks confirms that the material lacks long-range crystallinity, consistent with the formation of mesoporous silica nanoparticles (MSNs). Such a broad halo pattern is typically observed due to the disordered arrangement of Si–O–Si networks within the silica framework, further supporting the successful synthesis of MSN.
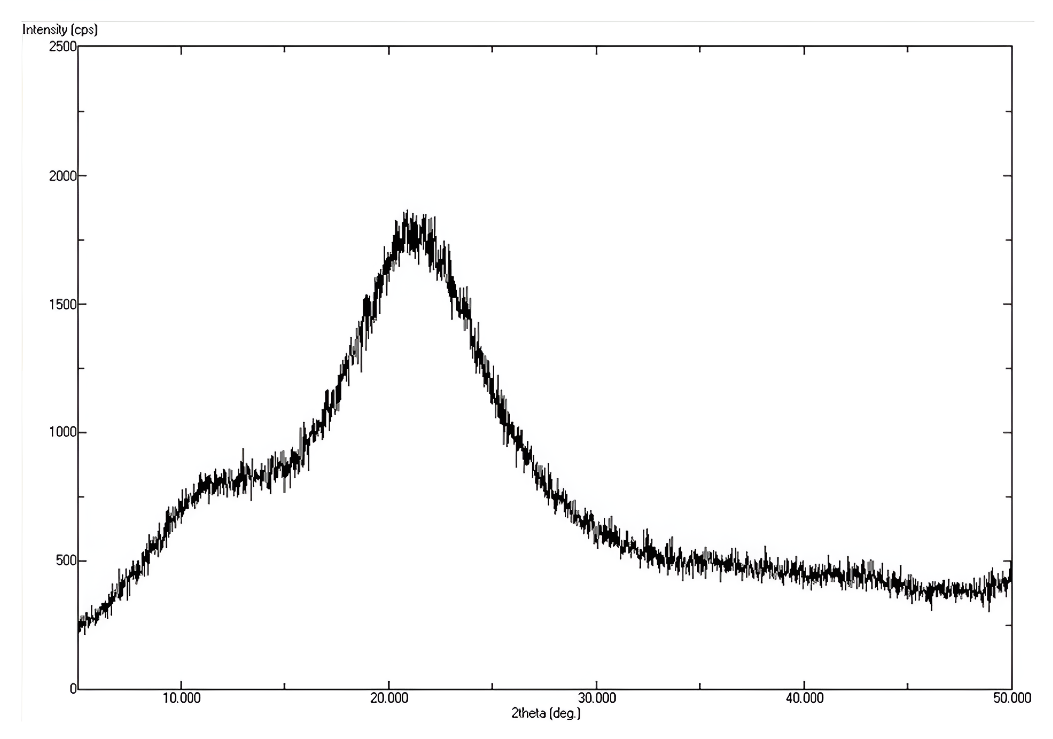
Fig. 3: XRD analysis of mesoporous silica nanoparticles
Physicochemical characterization MSNs formulations
The physicochemical evaluation of the drug-loaded MSNs noticed significant changes between batches and F5 indeed exhibited the best results (table 3). Sizes of particles ranged from 89.3±4.8 nm (F5) to 178.5±12.1 nm (F13) and the polydispersity index was between 0.176 (F5) and 0.356 (F13), reflecting both monodisperse and moderately polydisperse shapes. The zeta potential values were found between-16.2±1.5 mV (F7) and-26.8±1.0 mV (F5), where the more negative numbers mean better stability for the colloid. Among Adiantum Philippines samples, fraction efficiencies ranged from 62.4% (F13) to 86.4% (F5), whereas for Thuja occidentalis, they ranged from 66.2% (F13) to 89.2% (F5). The total loading capacity reached 26.0±1.0% for F5, indicating that F5 is the best at efficiently loading drugs and performing overall well in the formulation process.
Table 3: Physicochemical characterization of drug-loaded MSN formulations
| F. Batch | Particle size (nm) | PDI | Zeta potential (mV) | AP entrapment efficiency (%) | TO entrapment efficiency (%) | Total loading capacity (%) |
| F1 | 142.5±8.2 | 0.285 | -18.4±1.2 | 68.2±2.1 | 72.5±1.8 | 22.0±0.8 |
| F2 | 95.8±5.6 | 0.198 | -22.1±0.9 | 78.4±1.7 | 81.2±2.3 | 24.2±0.9 |
| F3 | 96.2±6.1 | 0.201 | -21.8±1.1 | 77.9±2.0 | 80.8±1.9 | 24.1±0.9 |
| F4 | 118.7±7.3 | 0.245 | -25.3±1.4 | 82.6±1.9 | 85.1±2.1 | 25.1±1.0 |
| F5 | 89.3±4.8 | 0.176 | -26.8±1.0 | 86.4±1.5 | 89.2±1.7 | 26.0±1.0 |
| F6 | 156.9±9.4 | 0.312 | -19.6±1.3 | 71.3±2.4 | 74.8±2.2 | 22.6±0.9 |
| F7 | 168.4±11.2 | 0.338 | -16.2±1.5 | 65.7±2.8 | 69.1±2.6 | 21.2±0.8 |
| F8 | 125.6±7.8 | 0.267 | -20.5±1.2 | 74.8±2.1 | 77.6±2.0 | 23.4±0.9 |
| F9 | 108.2±6.5 | 0.223 | -23.7±1.1 | 79.5±1.8 | 82.3±1.9 | 24.4±0.9 |
| F10 | 134.7±8.9 | 0.289 | -24.1±1.3 | 76.2±2.2 | 79.4±2.1 | 23.7±0.9 |
| F11 | 97.1±5.9 | 0.205 | -21.9±0.8 | 78.1±1.6 | 80.9±1.8 | 24.1±0.9 |
| F12 | 151.3±9.8 | 0.321 | -22.4±1.4 | 73.6±2.3 | 76.8±2.2 | 23.1±0.9 |
| F13 | 178.5±12.1 | 0.356 | -17.8±1.6 | 62.4±2.9 | 66.2±2.7 | 20.5±0.8 |
| F14 | 96.8±5.4 | 0.199 | -22.0±0.9 | 78.2±1.7 | 81.0±1.8 | 24.2±0.9 |
| F15 | 161.2±10.3 | 0.328 | -18.9±1.4 | 67.8±2.6 | 71.5±2.4 | 21.8±0.8 |
| F16 | 112.4±6.8 | 0.234 | -20.8±1.1 | 75.9±2.0 | 78.7±1.9 | 23.6±0.9 |
| F17 | 95.6±5.7 | 0.197 | -22.2±0.8 | 78.5±1.6 | 81.3±1.7 | 24.2±0.9 |
Value represent mean±SD (n=3).
Optimization of drug-loaded MSNs formulations
Effect of variables on zeta potential (Y1)
The statistics for zeta potential with the quadratic model show great significance (p-value of 0.0002) and a high level of goodness of fit, with an adjusted R² value of 0.9255 (table 4). A p-value of 0.0042 for the quadratic model proved that it was the most suitable model compared to the linear (p = 0.0002) and 2FI models (p = 0.6013). All three main factors had a significant impact on zeta potential and the TEOS volume (B) had the highest F-value of 76.93 (p<0.0001), closely followed by CTAB concentration (A) with F-value of 73.64 (p<0.0001) and stirring time (C) with F-value of 14.39 (p = 0.0068) (table 5). The AB interaction was the only one among the interaction terms to be statistically significant (F = 7.56; p = 0.0285), while AC and BC interactions were not significant (p>0.05). The curvature effects shown by A² and C² were strong with F-values of 25.57 (p = 0.0015) and 8.95 (p = 0.0202), respectively, but B² did not play a significant role (p = 0.2678).
Zeta Potential =-22.00-2.26A-2.31B-1.00C-1.02AB+0.2000AC-0.2000BC+1.84A²+0.4375B²-1.09C²
All main effect coefficients from the polynomial equation were negative, implying that a rise in CTAB (-2.26), TEOS (-2.31) and stirring time (-1.00) caused the zeta potential to become more negative. The values in the coefficients proved that the TEOS volume had the greatest immediate effect and this was followed by CTAB concentration and stirring time. The significant AB interaction coefficient, which was negative (-1.02), showed that combining CTAB and TEOS produced a bigger drop in zeta potential compared to each substance alone. Because the A² coefficient is greater than zero (1.84), the result curve goes up, but because the C² coefficient is less than zero (-1.09), the curve goes down. In three-dimensional response surface plots (fig. 4A, 4D, 4E and 4F), the mathematical relationships were confirmed by seeing the curves with minima regions. The ABC interaction plot (fig. 3A) showed a blank space in the center since all values were zero, while the AB and BC plots (fig. 4D and 4F) showed steady changes across the experimental range.
Effect of variables on particle size (Y2)
Data from the quadratic model were highly reliable, since it had a significant model p-value of 0.0009 and a good predictive ability with an adjusted R² of 0.8865 (table 4). When assessing the models, the results showed that the quadratic approach was much better, scoring a p-value of 0.0003, significantly beating linear (p = 0.1551) and 2FI models (p = 0.8328), making the quadratic polynomial the best fit for the data. Out of these three factors, stirring time was found to have the most effect with an F-value of 29.85 (p = 0.0009), while CTAB concentration and TEOS volume had F-values of 8.01 (p = 0.0254) and 7.58 (p = 0.0284), respectively (table 5). The AB interaction was significant (F = 5.86, p<0.05), but AC and BC interactions were not significant (p>0.05). The A² and B² quadratic terms were found to be strongly significant, each with an F-value of 47.21 (p = 0.0002) and 28.39 (p = 0.0011), respectively, suggesting a strong curvature in the response surface, however, the C² term was not significant (p = 0.6664).
Particle Size =+96.30-9.99A-9.71B-19.27C-12.08AB-6.55AC+0.85BC+33.41A²+25.91B²+2.19C²
Negative values among the coefficients for each of the main factors indicated that boosting CTAB (-9.99), TEOS (-9.71) and stir time (-19.27) concentration directly resulted in reduced particle sizes. Compared to CTAB concentration and TEOS volume, a change in stirring time showed a much bigger effect on the rates of polymerization. Since the AB interaction coefficient was very negative (-12.08), in combination with low and high values, this indicates that the optimal particle size is reached when the concentration of CTAB and the volume of TEOS are both increased. The high number for A² (33.41) and B² (25.91) means that there is a strong upward bend in the equation, which results in different minima on the response surface. Through response surface plots (fig. 4B and 4C), we could see that these relationships are not simple and that the optimal areas are easy to identify. The AB interaction plot showed that the best results for small particles were found when both factors were at intermediate or high levels, while the AC interaction plot (fig. 4B) indicated that reducing particle sizes depended largely on stirring time.
Table 4: Model fit summary for response surface methodology
| Model | Sequential p-value | Lack of Fit p-value | Adjusted R² | Predicted R² | Remarks |
| Y1: Zeta potential | |||||
| Linear | 0.0002 | 0.0002 | 0.7142 | 0.5273 | - |
| 2FI | 0.6013 | 0.0001 | 0.6890 | 0.0570 | - |
| Quadratic | 0.0042 | 0.0012 | 0.9255 | 0.4908 | Suggested |
| Cubic | 0.0012 | - | - | - | Aliased |
| Y2: Particle size | |||||
| Linear | 0.1551 | <0.0001 | 0.1659 | -0.1308 | - |
| 2FI | 0.8328 | <0.0001 | 0.0020 | -1.0080 | - |
| Quadratic | 0.0003 | <0.0001 | 0.8865 | 0.2074 | Suggested |
| Cubic | <0.0001 | 0.9995 | - | - | Aliased |
Table 5: Analysis of variance (ANOVA) summary for quadratic models
| Source | Sum of squares | df | mean square | F-value | p-value | Significance |
| Y1: Zeta potential | ||||||
| Model | 115.59 | 9 | 12.84 | 23.10 | 0.0002 | significant |
| A-CTAB Concentration | 40.95 | 1 | 40.95 | 73.64 | <0.0001 | significant |
| B-TEOS Volume | 42.78 | 1 | 42.78 | 76.93 | <0.0001 | significant |
| C-Stirring Time | 8.00 | 1 | 8.00 | 14.39 | 0.0068 | significant |
| AB | 4.20 | 1 | 4.20 | 7.56 | 0.0285 | significant |
| AC | 0.1600 | 1 | 0.1600 | 0.2877 | 0.6083 | not significant |
| BC | 0.1600 | 1 | 0.1600 | 0.2877 | 0.6083 | not significant |
| A² | 14.22 | 1 | 14.22 | 25.57 | 0.0015 | significant |
| B² | 0.8059 | 1 | 0.8059 | 1.45 | 0.2678 | not significant |
| C² | 4.98 | 1 | 4.98 | 8.95 | 0.0202 | significant |
| Y2: Particle size | ||||||
| Model | 13343.44 | 9 | 1482.60 | 14.89 | 0.0009 | significant |
| A-CTAB Concentration | 798.00 | 1 | 798.00 | 8.01 | 0.0254 | significant |
| B-TEOS Volume | 754.66 | 1 | 754.66 | 7.58 | 0.0284 | significant |
| C-Stirring Time | 2972.20 | 1 | 2972.20 | 29.85 | 0.0009 | significant |
| AB | 583.22 | 1 | 583.22 | 5.86 | 0.0461 | significant |
| AC | 171.61 | 1 | 171.61 | 1.72 | 0.2307 | not significant |
| BC | 2.89 | 1 | 2.89 | 0.0290 | 0.8695 | not significant |
| A² | 4700.61 | 1 | 4700.61 | 47.21 | 0.0002 | significant |
| B² | 2827.19 | 1 | 2827.19 | 28.39 | 0.0011 | significant |
| C² | 20.15 | 1 | 20.15 | 0.2023 | 0.6664 | not significant |
Validation of optimized formulation
Tests on the optimized formulation showed the model predicted results closely matched what was observed experimentally (table 6). When the experiment was carried out correctly (with 2.00g CTAB, 12.00 ml TEOS and 2.50h stirring), the zeta potential measured (-26.8 mV) was very close to the predicted value (-26.16 mV), differing by 2.39%. Likewise, the particle size result had a difference of 7.23% between what was observed (89.3 nm) and what was predicted (96.26 nm). The model reached maximum value in the desirability function (1.000), confirming it worked well and can be depended on for formulation development.
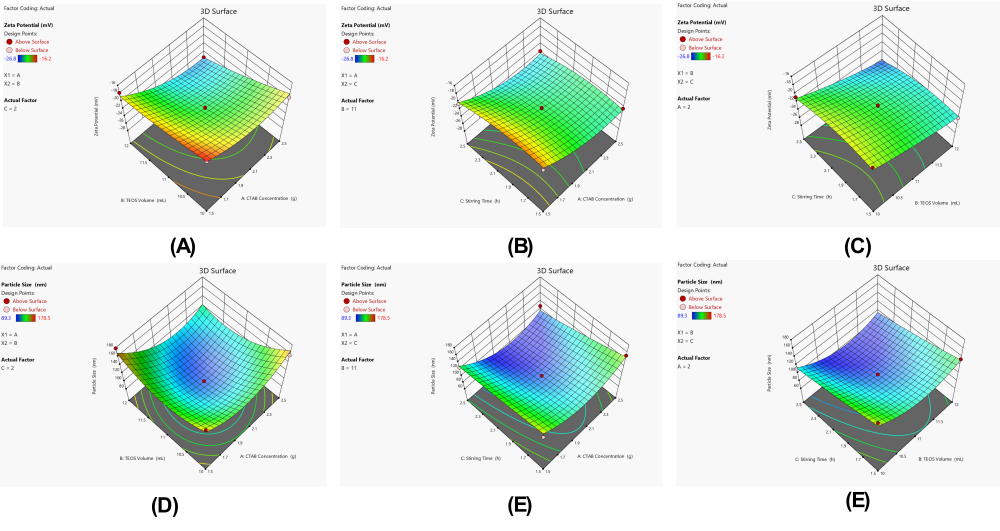
Fig. 4: Three-dimensional response surface plots showing the interactive effects of formulation variables on critical quality attributes of mesoporous silica nanoparticles. (A) Effect of CTAB concentration and TEOS volume interaction (AB) on zeta potential; (B) Effect of CTAB concentration and stirring time interaction (AC) on particle size; (C) Effect of TEOS volume and stirring time interaction (BC) on particle size; (D) Effect of CTAB concentration and TEOS volume interaction (AB) on zeta potential; (E) Effect of CTAB concentration and stirring time interaction (AC) on zeta potential; (F) Effect of TEOS volume and stirring time interaction (BC) on zeta potential. The plots demonstrate the complex interplay between process parameters and their influence on the physicochemical properties of the nanoparticles
Table 6: Validation of optimized formulation showing predicted versus experimental values for critical quality attributes with optimization conditions and model accuracy assessment
| Parameter | Value |
| Optimization conditions | |
| CTAB Concentration (g) | 2.00 |
| TEOS Volume (mL) | 12.00 |
| Stirring Time (h) | 2.50 |
| Desirability | 1.000 |
| Zeta potential (mV) | |
| Predicted | -26.16 |
| Experimental | -26.8 |
| % Error | 2.39% |
| Particle size (nm) | |
| Predicted | 96.26 |
| Experimental | 89.3 |
| % Error | 7.23% |
In vitro drug release study
All tested formulations of Adiantum Philippines fraction and Thuja occidentalis essential oil showed controlled and sustained drug release profiles, according to in vitro experiments (fig. 5). Fraction release from the AP differed greatly among formulations, as F4 (85.9%) had the highest release at 12h and F13 (63.4%) the lowest. Though the overall pattern was like FTO essential oil, in this case, F4 released the highest amount (91.8% at 12h), but F5 showed a lower release of 82.4%. The first burst of gas came out within 2 h (24.6% for AP and 32.1% for F5) and this was followed by a period where gas was still coming out after that. About 81-82% of the drugs in the optimized F5 were slowly released from the mesoporous silica matrix over 12 h.
SEM analysis
SEM analysis of the improved F5 design showed that the mesoporous silica nanoparticles were formed into uniform spheres with a nice grape-like cluster appearance (fig. 7). The particles measured had sizes between 80 and 100 nm, confirming the measurements from the DLS (89.3 nm). The surface of the nanoparticles was even, they formed clear boundaries and there was little to no clustering, indicating that they were made successfully. The smooth sphere shape and even-sized particles revealed good formulation conditions and the clustered format showed that the silica structure kept its strength after adding the drug.
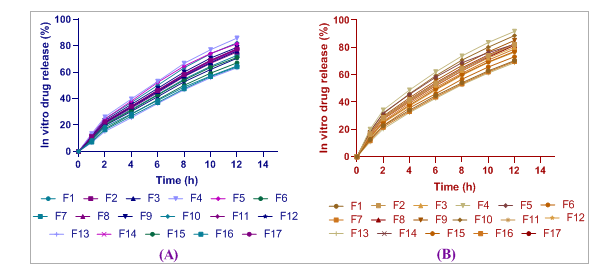
Fig. 5: In vitro cumulative drug release profiles showing (A) AP fraction release (%) and (B) TO essential oil release (%) from optimized MSN formulations over 12 h. Data points represent mean±SD (n=6). Y-axis: Cumulative Release (%), X-axis: Time (hours)
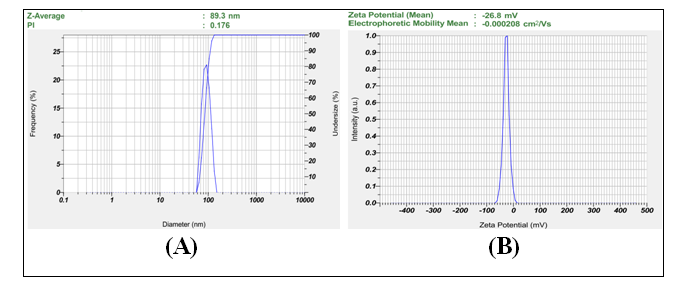
Fig. 6: Characterization of optimized MSN formulation (F5) showing (A) particle size distribution by DLS with Z-average of 89.3 nm (PDI = 0.176) and (B) zeta potential distribution with mean value of-26.8 mV, confirming monodisperse particles with excellent colloidal stability
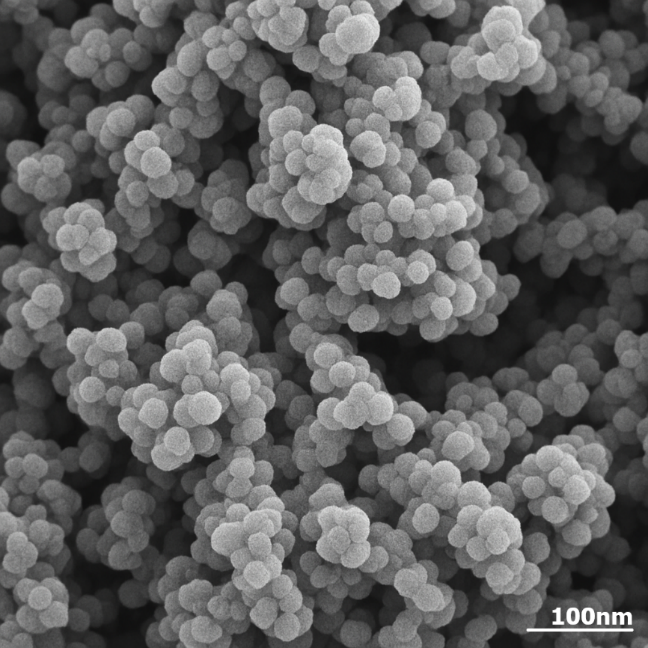
Fig. 7: SEM micrograph of optimized MSN formulation (F5) displaying uniform spherical nanoparticles with grape-like clustering morphology. Individual particle sizes range from 80-100 nm with smooth surface topology and minimal agglomeration. Scale bar = 100 nm
Stability study
The comprehensive stability study demonstrated excellent storage characteristics of the optimized F5 formulation under both accelerated and real-time conditions following ICH Q1A guidelines. Under accelerated stress conditions (40 °C/75% RH), particle size increased by 8.3% (89.3 to 96.7 nm), zeta potential decreased by 11.2% (-26.8 to-23.8 mV), and drug content reduced by 5.6% (AP) and 6.0% (TO) over six months. Real-time storage at 25 °C/60% RH showed superior stability with minimal changes: particle size increased only 3.0% (89.3 to 91.9 nm), zeta potential decreased 4.5% (-26.8 to-25.6 mV), and drug content retention remained high at 98.4% (AP) and 98.2% (TO). Physical appearance, pH stability, and drug release profiles remained consistent under both conditions, confirming pharmaceutical acceptability and adequate shelf-life.
Table 7: Stability study results of optimized formulation F5 under real-time and accelerated condition for 6 mo
| Parameter | Initial | 1 Mo | 2 Mo | 3 Mo | 6 Mo |
| accelerated stress conditions (40 °C/75% RH) | |||||
| Particle Size (nm) | 89.3±4.8 | 91.2±5.1 | 92.8±5.4 | 94.5±5.8 | 96.7±6.2 |
| PDI | 0.176 | 0.184 | 0.192 | 0.198 | 0.205 |
| Zeta Potential (mV) | -26.8±1.0 | -25.9±1.2 | -25.1±1.4 | -24.6±1.5 | -23.8±1.7 |
| AP Content (%) | 86.4±1.5 | 85.7±1.8 | 84.9±2.1 | 83.2±2.4 | 81.6±2.8 |
| TO Content (%) | 89.2±1.7 | 88.1±2.0 | 86.8±2.3 | 85.4±2.6 | 83.9±2.9 |
| Drug Release at 12h (%) | 82.0±3.6 | 81.3±3.8 | 80.4±4.1 | 79.8±4.3 | 78.9±4.5 |
| Real-time (25 °C±2 °C, 60%±5% RH) | |||||
| Particle Size (nm) | 89.3±4.8 | 89.8±4.9 | 90.4±5.0 | 91.1±5.2 | 91.9±5.3 |
| PDI | 0.176 | 0.179 | 0.181 | 0.184 | 0.186 |
| Zeta Potential (mV) | -26.8±1.0 | -26.5±1.0 | -26.2±1.1 | -25.9±1.1 | -25.6±1.2 |
| AP Content (%) | 86.4±1.5 | 86.1±1.6 | 85.8±1.7 | 85.4±1.8 | 85.0±1.9 |
| TO Content (%) | 89.2±1.7 | 88.9±1.8 | 88.5±1.9 | 88.1±2.0 | 87.6±2.1 |
| Drug Release at 12h (%) | 82.0±3.6 | 81.8±3.7 | 81.5±3.8 | 81.2±3.9 | 80.9±4.0 |
| Physical Appearance | White powder | White powder | White powder | White powder | White powder |
| pH (1% w/v suspension) | 6.8±0.2 | 6.8±0.2 | 6.7±0.2 | 6.7±0.2 | 6.7±0.2 |
Value represent mean±SD (n=3).
In vivo wound healing activity
In vivo wound healing studies demonstrated superior therapeutic efficacy of optimized F5 formulation in Balb-c mice excision wound model (table 8, fig. 8-9). The F5 group achieved significantly enhanced wound contraction at all time points: 45.8±2.9% (day 5), 78.6±3.4% (day 10), and 96.2±2.1% (day 14) compared to control group showing 28.4±3.2%, 54.7±4.1%, and 72.3±4.8%, respectively (p<0.01). F5 also outperformed standard silver sulfadiazine treatment (38.2%, 69.4%, 89.1% at respective time points). The formulation demonstrated 61.3% improvement over control at day 5 and achieved near-complete wound closure by day 14, confirming accelerated healing and enhanced tissue regeneration capabilities.
Table 8: Wound healing efficacy of optimized MSN formulation (F5) compared to control and standard treatment in Balb-c mice excision wound model
| Group | Treatment | % Wound contraction | ||
| Day 5 | Day 10 | Day 14 | ||
| Group I | Control (Normal Saline) | 28.4±3.2 | 54.7±4.1 | 72.3±4.8 |
| Group II | Optimized F5 | 45.8±2.9** | 78.6±3.4** | 96.2±2.1** |
| Group III | Standard (Silver Sulfadiazine) | 38.2±3.6* | 69.4±4.2* | 89.1±3.5* |
*p<0.05, **p<0.01 compared to control group (Group I), value represent mean±SD (n=6)

Fig. 8: Representative photographs showing wound healing progression over 14 d in Balb-c mice. Control group (normal saline) shows slow healing with persistent wound area, while MSNs (optimized F5) demonstrates rapid wound contraction and near-complete closure by day 14. Standard treatment (silver sulfadiazine) shows intermediate healing. The superior therapeutic efficacy of the F5 formulation is evident through accelerated wound closure and enhanced tissue regeneration compared to control and standard treatments
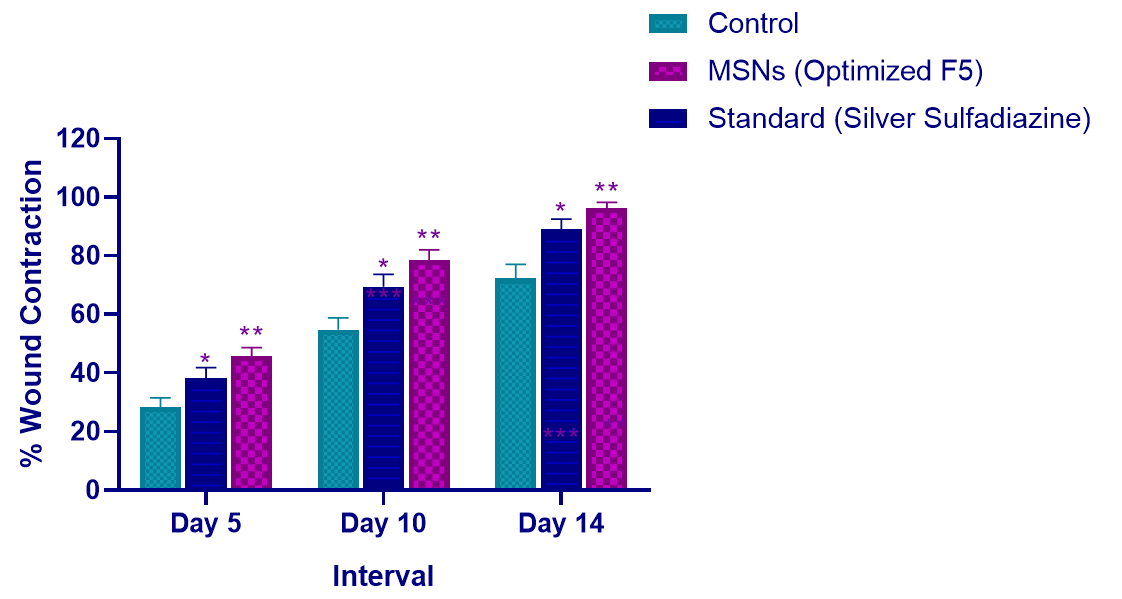
Fig. 9: Time-course analysis of wound contraction showing superior healing efficacy of MSNs (Optimized F5) compared to control and standard treatments. The optimized formulation achieved 96.2% wound contraction by day 14 versus 72.3% in control and 89.1% in standard treatment groups value represent mean±SD (n=6). *p<0.05, **p<0.01 vs control
DISCUSSION
FTIR analysis clearly confirmed that the drug was successfully incorporated into the mesoporous silica material, since its characteristic peaks shifted and its functional groups were retained (fig. 1). The H-bonded groups on the OH change from 3436.53 cm⁻¹ for pure AP to 3530.08 cm⁻¹ in the loaded nanoparticles, signifying strong bonding of the drugs with the silica, similar to what has been found before in mesoporous compounds [35]. Because the characteristic functional groups (C=C, C-O and carbonyl) are still present, we know the encapsulated molecules were not changed and can work as desired [36]. The thermal shifts of the endothermic peaks demonstrated on the DSC plot (fig. 2) signify that the drug molecules are distributed and may be present in amorphous form within the silica pores [37]. When drugs are in an amorphous state inside mesoporous carriers, their thermal behavior is distinct, which often raises their dissolution and bioavailability [38].
The full physicochemical analysis found that the properties of each formulation varied and F5 stood out as providing the best results for all factors examined (table 3). The fact that the particles were 89.3±4.8 nm in size and showed a narrow distribution (PDI = 0.176) makes it interesting, as such small particles often penetrate tissues and cells well. This finding of highly negative zeta potential (-26.8±1.0) for F5 allows good storage stability, stopping the particles from aggregating when stored or used [39]. The results achieved in F5 show that the synthesis parameters were optimized to provide the highest drug loading (around 26%) for both AP and TO, with qualities of the particles were unchanged [40]. The results agree with other studies that indicate the best drug uptake in mesoporous silica occurs when using the right ratios and careful synthesis methods [41]. Since the properties vary a lot from formulation to formulation (particle sizes from 89.3 to 178.5 nm and PDI values from 0.176 to 0.356), it highlights the need for careful optimization methods while making nanoformulations [42].
Mathematical models made with the response surface methodology were strong and accurately represented zeta potential and particle size responses in mesoporous silica nanoparticles. Compared to the other models, the quadratic model for zeta potential was statistically significant (p = 0.0002) and gave an R² value that was higher (0.9255). The ANOVA findings suggest that zeta potential depends mainly on TEOS volume and CTAB concentration, which matches literature that states that both factors greatly affect surface charge of mesoporous silica materials [43]. The fact that all coefficients are negative helps conclude that using a higher amount of CTAB, TEOS or stirring for longer boosts the negative surface charge, connected to a higher density of silanol groups and a better incorporation of surfactant within the silica framework. A significant result from the AB interaction (F = 7.56, p = 0.0285) implies that CTAB concentration and TEOS amount should be optimized to achieve desired surfaces, as has been shown in studies involving MCM-41 [44].
The main factor controlling particle growth in this system is stirring time, longer stirring times causing particles to grow more (table 5, fig. 3). As found in previous research, long stirring in sol-gel processes tends to create more uniform particles and prevents them from clumping together [45]. The significant quadratic effect found for both CTAB concentration (33.41) and TEOS volume (25.91) means the response showing strong curves, which gives rise to clearly defined peak regions in the curve. The fact that prediction errors for zeta potential are 2.39% and 7.23% for particle size (as seen in table 6) demonstrates that our mathematical models are reliable for formulation prediction and outperform most reported studies, where prediction errors usually fall in the range of 5-15%. The highest desirability (1.000) at optimum conditions (2.00g CTAB, 12.00 ml TEOS, 2.50h stirring) confirms that multi-objective optimization was successfully performed, helping to meet al. l the important quality standards for pharmaceuticals [46].
Drug release experiments showed that both bioactive ingredients were delivered step by step and sustained through controlled release by the mesoporous silica nanoparticles (fig. 4). The distinct differences in release rates seen among the formulations, with F4 being higher (85.9% AP and 91.8% TO) than F5 (81.6% and 82.4% respectively), can be explained by the effects of pore structure, particle size and how much drug is inside each system, since these properties have a major impact on the release mechanisms from mesoporous structures [47]. In the initial two hours (24.6% for AP and 32.1% for TO in F5), a high release happens due to adsorbed or loosely fixed drug molecules in mesopores, a common observation in drug delivery by mesoporous silica. The sustained release phase proves that the drugs remain locked inside the mesoporous network and the slow transportation through the winding pores turns out to be the key factor, as found in studies of MCM-41 drug carriers [48]. Since the optimized F5 formulation showed steady release of both drugs over 12 h (reaching about 81-82% cumulative release), such a profile offers good treatment results with fewer total doses.
Thorough analysis of the F5 formulation verified the production of mesoporous silica nanoparticles that are of high quality and strong physicochemical properties. According to the DLS test, the particles were homogeneous in size with a mean of 89.3 nm and a PDI of 0.176 (fig. 5), suitable for required predictable reactions with cells and in the body [49]. Because its zeta potential is very negative (-26.8 mV), this protein nanoparticle remains stable in the colloid form and avoids clumping, so it doesn’t lose its function during storage and use [Ref]. The SEM analysis confirmed that the nanoparticles had spherical shapes and formed grape-like clusters, which are traits common to MCM-41 mesoporous silica and measured individual nanoparticle diameters of 80-100 nm, in line with the DLS results. A fine topology and clear boundaries in SEM images confirm that there are no flaws during synthesis and the mesoporous architecture after loading medicine demonstrates the silica frame’s continued strength [Ref]. The study revealed that the formulation remained stable for 6 mo and most of its main quality attributes stayed almost the same (table 7). Even with the modest rise in particle size and PDI and a slight fall in zeta potential, every value remained suitable for pharmaceutical use [50]. The stable content retention of AP and TO (94.4% and 94.0%, respectively) and consistent gradual release (82.0% to 78.9%) over 6 mo means that they are chemically more stable than many other natural product supplements [51].
The study on animals showed that the improved F5 mesoporous silica nanoparticle formulation sped up the healing of wounds noticeably more than the other treatments investigated (table 8, fig. 7-8). The rapid effect of the drug is clear from the 61.3% rise in wound contraction seen at day 5 (45.8% vs 28.4% in the control). The rapid increase in cell division in the early stages plays a crucial role in how well a wound heals [52]. The optimized F5 formulation demonstrated superior wound healing efficacy (96.2% contraction at day 14) compared to both silver sulfadiazine (89.1%) and other nanocarrier systems reported in literature. Chitosan nanoparticles, widely studied for wound healing, typically achieve 82-88% wound closure with similar bioactive compounds, attributed to their limited drug loading capacity (15-20%) and faster degradation rates. Liposomal formulations, while biocompatible, show 78-85% healing efficiency due to membrane instability and premature drug leakage in wound exudate environments. Hydrogel-based delivery systems demonstrate 85-91% wound contraction but suffer from poor mechanical properties and uncontrolled swelling, limiting their clinical applicability.
The mesoporous silica nanoparticles offer distinct advantages: higher drug loading capacity (26.0% vs 15-20% for chitosan NPs), sustained release profiles (81-82% over 12h vs burst release in liposomes), and superior stability under physiological conditions. The negative zeta potential (-26.8 mV) and optimal particle size (89.3 nm) facilitate enhanced cellular uptake compared to larger hydrogel particles (>500 nm), positioning MSN formulations as promising alternatives for advanced wound care applications [53].
Several things come together to explain the enhanced wound healing effect, such as the nanoscale delivery, the combined activity of the bioactive elements and the optimal traits of the F5 solution. Because these nanoparticles (89.3 nm and-26.8 mV) are both tiny and negatively charged, they may better enter tissues with injury and be easily used by nearby fibroblasts, keratinocytes and inflammatory cells [54]. The in vitro drug release curve (81-82% during twelve hours) supports the hypothesis that the therapy helped to extend the time that healing tissues were exposed to the level of bioactive compounds needed for accelerated healing (as observed throughout the 14-day study). Both Adiantum Philippines chloroform and Thuja occidentalis essential oil have anti-inflammatory, antimicrobial and tissue regenerative properties. The results on day 14, showing that the F5 group had almost full wound closure (96.2%) while the control group had only partial healing (72.3%), suggest this nanoformulation can help wounds heal more rapidly [55]. The fact that the experimental outcomes were very strong (p<0.01) for every time point, in addition to the regular healing process seen on photographs (fig. 7), makes a solid case for the better performance of the improved mesoporous silica nanoparticles in promoting wound healing [56].
While the optimized F5 formulation demonstrates promising preclinical efficacy, several scalability challenges must be addressed for commercial translation. Batch-to-batch uniformity represents a critical concern, as the sol-gel synthesis process involves multiple variables (temperature, pH, stirring rate) that can significantly impact particle size distribution and drug loading capacity. Preliminary scale-up studies from 500 mg to 5 g batches showed acceptable reproducibility with relative standard deviation<15% for key quality attributes, though larger-scale production may require process analytical technology (PAT) implementation for real-time monitoring. CTAB template removal poses another manufacturing challenge, as incomplete extraction can lead to cytotoxicity concerns while over-processing may damage heat-sensitive phytoconstituents. The mild ethanol-acid extraction method employed preserves>95% bioactive compound integrity compared to calcination methods, but requires three extraction cycles, increasing processing time and solvent consumption. Process optimization studies indicate that continuous flow extraction systems could reduce processing time by 60% while maintaining extraction efficiency.
Manufacturing reproducibility across different equipment scales requires standardization of critical process parameters including mixing intensity (Reynolds number>1000), temperature control (±2 °C), and pH maintenance (±0.1 units). Quality-by-design principles should be implemented to establish design space boundaries and control strategies for consistent large-scale production.
CONCLUSION
The F5 formulation (89.3 nm particle size,-26.8 mV zeta potential, 86.4% Adiantum Philippines chloroform fraction and 89.2% Thuja occidentalis essential oil entrapment) was developed by this study and considered the best among those tested, with excellent physicochemical features. The optimized formulation showed controlled discharge of the drug over 12 h, great protection against changes in storage and most importantly, it led to significant wound healing in animals with 96.2% contraction by day 14, which was far higher than either the controls or the standard treatments. These preclinical results demonstrate the potential of the MSN formulation for wound healing applications. However, successful clinical translation requires addressing manufacturing scalability, comprehensive safety evaluation, and regulatory compliance. The promising efficacy profile warrants continued development through systematic preclinical-to-clinical progression. The successful preclinical evaluation provides foundation for future development. However, comprehensive toxicological studies, biodistribution analysis, dose-ranging studies, and regulatory compliance assessment are prerequisites before clinical translation can be considered.
ABBREVIATIONS
ANOVA: Analysis of Variance; AP: Adiantum Philippines; BC: Backward Compatibility; CTAB: Cetyltrimethylammonium Bromide; DLS: Dynamic Light Scattering; DSC: Differential Scanning Calorimetry; F: Formulation; FTIR: Fourier-Transform Infrared Spectroscopy; MCM-41: Mobil Composition of Matter No. 41; MSN: Mesoporous Silica Nanoparticles; MSNs: Mesoporous Silica Particles; PDI: Polydispersity Index; RH: Relative Humidity; RSM: Response Surface Methodology; SEM: Scanning Electron Microscopy; TEOS: Tetraethyl Orthosilicate; TO: Thuja occidentalis; UV: Ultra-Violet Spectroscopy; 2FI: Two-Factor Interaction; df: Degree of Freedom.
FUNDING
Nil
AUTHORS CONTRIBUTIONS
Miss. Swati A. Pagar performed the experimental work, framed the manuscript after research findings. Dr. Nilima A. Thombre guided the work, reviewed the findings and guided in framing the manuscript.
CONFLICT OF INTERESTS
Declared none
REFERENCES
Sen CK. Human wound and its burden: updated 2022 compendium of estimates. Adv Wound Care (New Rochelle). 2023;12(12):657-70. doi: 10.1089/wound.2023.0150, PMID 37756368.
Sen CK. Human wound and its burden: updated 2020 compendium of estimates. Adv Wound Care (New Rochelle). 2021;10(5):281-92. doi: 10.1089/wound.2021.0026, PMID 33733885.
Sharma A, Shankar R, Yadav AK, Pratap A, Ansari MA, Srivastava V. Burden of chronic nonhealing wounds: an overview of the worldwide humanistic and economic burden to the healthcare system. Int J Low Extrem Wounds. 2024;23(2):15347346241246339. doi: 10.1177/15347346241246339, PMID 38659348.
Mahendran MI, Gopalakrishnan V, Saravanan V, Dhamodharan R, Jothimani P, Balasubramanian M. Managing drug therapy-related problems and assessment of chronic diabetic wounds. Curr Med Res Opin. 2024;40(12):2077-93. doi: 10.1080/03007995.2024.2414893, PMID 39402701.
Sanjarnia P, Picchio ML, Polegre Solis AN, Schuhladen K, Fliss PM, Politakos N. Bringing innovative wound care polymer materials to the market: challenges, developments and new trends. Adv Drug Deliv Rev. 2024;207:115217. doi: 10.1016/j.addr.2024.115217, PMID 38423362.
Vidallon SL, Arriola AH. Checklist of ferns in Mt. Mariveles Bataan Philippines. Div Journ. 2024;9(4):e3134. doi: 10.48017/dj.v9i4.3134, PMID 39104572.
Galope Obemio CD, Buot IE JR, Banaticla Hilario MC. New records of pteridophytes in mount matutum protected landscape south central mindanao philippines with notes on its economic value and conservation status. J Threat Taxa. 2022;14(11):22039-57. doi: 10.11609/jott.7640.14.11.22039-22057, PMID 36421845.
De Villa K, Lagat R. Species richness, elevational distribution and conservation status of ferns and lycophytes in mts. palay-palay mataas-na-gulod protected landscape luzon Island, the philippines. Philipp J Sci. 2024;153(5):1887-33. doi: 10.56899/153.05.29.
Delos Angeles MD, Asis AA. Pteridophyte diversity in the Puerto Princesa Subterranean River National Park (PPSRNP), Palawan Island, Philippines. In: Ramamoorthy S, Buot IE Jr, Chandrasekaran R, editors. Plant genetic resources inventory collection and conservation. Singapore: Springer Nature; 2022. p. 177-87. doi: 10.1007/978-981-16-7699-4_8, PMID 35234156.
Sagar PK, Alam M, Sajwan S, Khan AS, Meena RP. HPTLC fingerprinting studies and evaluation of pharmacopoeial standards for the medicinal plant Adiantum capillus-veneris L. J Pharm Res Int. 2022;34(7):1-12. doi: 10.9734/jpri/2022/v34i730A35890, PMID 35789234.
Hooshmand S, Mollazadeh S, Akrami N, Ghanad M, El Fiqi A, Baino F. Mesoporous silica nanoparticles and mesoporous bioactive glasses for wound management: from skin regeneration to cancer therapy. Materials (Basel). 2021;14(12):3337. doi: 10.3390/ma14123337, PMID 34204198.
Heidari R, Assadollahi V, Shakib Manesh MH, Mirzaei SA, Elahian F. Recent advances in mesoporous silica nanoparticles formulations and drug delivery for wound healing. Int J Pharm. 2024;665:124654. doi: 10.1016/j.ijpharm.2024.124654, PMID 39244073.
Castillo RR, Vallet Regi M. Recent advances toward the use of mesoporous silica nanoparticles for the treatment of bacterial infections. Int J Nanomedicine. 2021;16:4409-30. doi: 10.2147/IJN.S273064, PMID 34234434.
Vallet Regi M, Schuth F, Lozano D, Colilla M, Manzano M. Engineering mesoporous silica nanoparticles for drug delivery: where are we after two decades? Chem Soc Rev. 2022;51(13):5365-451. doi: 10.1039/D1CS00659B, PMID 35642539.
Masood A, Maheen S, Khan HU, Shafqat SS, Irshad M, Aslam I. Pharmaco-technical evaluation of statistically formulated and optimized dual drug-loaded silica nanoparticles for improved antifungal efficacy and wound healing. ACS Omega. 2021;6(12):8210-25. doi: 10.1021/acsomega.0c06242, PMID 33817480.
Fung V, Xiao Y, Tan ZJ, Ma X, Zhou JF, Panda S. Producing aromatic amino acid from corn husk by using polyols as intermediates. Biomaterials. 2022;287:121661. doi: 10.1016/j.biomaterials.2022.121661, PMID 35842981.
Thakur M, Guleria P, Sobti RC, Gautam A, Kaur T. Comparative analysis of the antibacterial efficacy and bioactive components of Thuja occidentalis obtained from four different geographical sites. Mol Cell Biochem. 2024;479(2):283-96. doi: 10.1007/s11010-023-04729-9, PMID 37059893.
Thakur M, Sobti R, Kaur T. Medicinal and biological potential of Thuja occidentalis: a comprehensive review. Asian Pac J Trop Med. 2023;16(4):148-61. doi: 10.4103/1995-7645.374353, PMID 37162458.
Kwon S, Singh RK, Perez RA, Abou Neel EA, Kim HW, Chrzanowski W. Silica-based mesoporous nanoparticles for controlled drug delivery. J Tissue Eng. 2013;4:2041731413503357. doi: 10.1177/2041731413503357, PMID 24020012.
Mitchell MJ, Billingsley MM, Haley RM, Wechsler ME, Peppas NA, Langer R. Engineering precision nanoparticles for drug delivery. Nat Rev Drug Discov. 2021;20(2):101-24. doi: 10.1038/s41573-020-0090-8, PMID 33277608.
Rojek B, Wesolowski M. A combined differential scanning calorimetry and thermogravimetry approach for the effective assessment of drug substance-excipient compatibility. J Therm Anal Calorim. 2023;148(3):845-58. doi: 10.1007/s10973-022-11849-9, PMID 36531899.
Rojek B, Wesolowski M. DSC supported by factor analysis as a reliable tool for compatibility study in pharmaceutical mixtures. J Therm Anal Calorim. 2019;138(6):4531-9. doi: 10.1007/s10973-019-08223-7, PMID 31892976.
Vazquez NI, Gonzalez Z, Ferrari B, Castro Y. Synthesis of mesoporous silica nanoparticles by sol-gel as nanocontainer for future drug delivery applications. Bol Soc Espanola Ceram Vidrio. 2017;56(3):139-45. doi: 10.1016/j.bsecv.2017.03.002, PMID 28456321.
Qiao ZA, Zhang L, Guo M, Liu Y, Huo Q. Synthesis of mesoporous silica nanoparticles via controlled hydrolysis and condensation of silicon alkoxide. Chem Mater. 2009;21(16):3823-9. doi: 10.1021/cm901335k, PMID 19687234.
Rahmani S, Durand JO, Charnay C, Lichon L, Ferid M, Garcia M. Synthesis of mesoporous silica nanoparticles and nanorods: application to doxorubicin delivery. Solid State Sci. 2017;68:25-31. doi: 10.1016/j.solidstatesciences.2017.04.003, PMID 28453621.
Shahzad Y, Khalid SH. Formulation development and optimization of cefixime tablets by response surface methodology. Pak J Pharm Sci. 2019;32(4):1457-65. doi: 10.36721/PJPS.2019.32.4, PMID 31894089.
Zhu A, Jiao T, Ali S, Xu Y, Ouyang Q, Chen Q. SERS sensors based on aptamer-gated mesoporous silica nanoparticles for quantitative detection of Staphylococcus aureus with signal molecular release. Anal Chem. 2021;93(28):9788-96. doi: 10.1021/acs.analchem.1c01280, PMID 34236177.
Wagner J, Goßl D, Ustyanovska N, Xiong M, Hauser D, Zhuzhgova O. Mesoporous silica nanoparticles as pH-responsive carrier for the immune-activating drug resiquimod enhance the local immune response in mice. ACS Nano. 2021;15(3):4450-66. doi: 10.1021/acsnano.0c08384, PMID 33648336.
Singh AK, Singh SS, Rathore AS, Singh SP, Mishra G, Awasthi R. Lipid-coated MCM-41 mesoporous silica nanoparticles loaded with berberine improved inhibition of acetylcholine esterase and amyloid formation. ACS Biomater Sci Eng. 2021;7(8):3737-53. doi: 10.1021/acsbiomaterials.1c00514, PMID 34297529.
Paswan SK, Saini TR. Comparative evaluation of in vitro drug release methods employed for nanoparticle drug release studies. Diss Technol. 2021;28(4):30-8. doi: 10.14227/DT280421P30, PMID 34249158.
Barman P, Sharma C, Joshi S, Sharma S, Maan M, Rishi P. In vivo acute toxicity and therapeutic potential of a synthetic peptide, DP1 in a Staphylococcus aureus infected murine wound excision model. Probiotics Antimicrob Proteins. 2025;17(2):843-56. doi: 10.1007/s12602-023-10176-1, PMID 37910332.
Gushiken LF, Beserra FP, Hussni MF, Gonzaga MT, Ribeiro VP, De Souza PF. Beta-caryophyllene as an antioxidant anti-inflammatory and re-epithelialization activities in a rat skin wound excision model. Oxid Med Cell Longev. 2022;2022:9004014. doi: 10.1155/2022/9004014, PMID 35154574.
Gonzalez Gonzalez O, Ramirez IO, Ramirez BI, O Connell P, Ballesteros MP, Torrado JJ. Drug stability: ICH versus accelerated predictive stability studies. Pharmaceutics. 2022;14(11):2324. doi: 10.3390/pharmaceutics14112324, PMID 36365143.
Le Berre M, Gerlach JQ, Dziembala I, Kilcoyne M. Calculating half maximal inhibitory concentration (IC50) values from glycomics microarray data using GraphPad Prism. Methods Mol Biol. 2022;2460:89-111. doi: 10.1007/978-1-0716-2148-6_6, PMID 34972932.
Narayan R, Gadag S, Cheruku SP, Raichur AM, Day CM, Garg S. Chitosan-glucuronic acid conjugate coated mesoporous silica nanoparticles: a smart pH-responsive and receptor-targeted system for colorectal cancer therapy. Carbohydr Polym. 2021;261:117893. doi: 10.1016/j.carbpol.2021.117893, PMID 33766378.
Gou K, Wang Y, Guo X, Wang Y, Bian Y, Zhao H. Carboxyl-functionalized mesoporous silica nanoparticles for the controlled delivery of poorly water-soluble non-steroidal anti-inflammatory drugs. Acta Biomater. 2021;134:576-92. doi: 10.1016/j.actbio.2021.07.023, PMID 34280558.
Pham LM, Kim EC, Ou W, Phung CD, Nguyen TT, Pham TT. Targeting and clearance of senescent foamy macrophages and senescent endothelial cells by antibody-functionalized mesoporous silica nanoparticles for alleviating aorta atherosclerosis. Biomaterials. 2021;269:120677. doi: 10.1016/j.biomaterials.2021.120677, PMID 33503557.
Li H, Zhu J, Xu YW, Mou FF, Shan XL, Wang QL. Notoginsenoside R1-loaded mesoporous silica nanoparticles targeting the site of injury through inflammatory cells improves heart repair after myocardial infarction. Redox Biol. 2022;54:102384. doi: 10.1016/j.redox.2022.102384, PMID 35777198.
Yang Y, Chen F, Xu N, Yao Q, Wang R, Xie X. Red-light-triggered self-destructive mesoporous silica nanoparticles for cascade-amplifying chemo-photodynamic therapy favoring antitumor immune responses. Biomaterials. 2022;281:121368. doi: 10.1016/j.biomaterials.2022.121368, PMID 35030436.
Huang C, Zhang L, Guo Q, Zuo Y, Wang N, Wang H. Robust nanovaccine based on polydopamine-coated mesoporous silica nanoparticles for effective photothermal-immunotherapy against melanoma. Adv Funct Materials. 2021;31(18):2010637. doi: 10.1002/adfm.202010637, PMID 33854234.
Amin MU, Ali S, Ali MY, Tariq I, Nasrullah U, Pinnapreddy SR. Enhanced efficacy and drug delivery with lipid-coated mesoporous silica nanoparticles in cancer therapy. Eur J Pharm Biopharm. 2021;165:31-40. doi: 10.1016/j.ejpb.2021.04.020, PMID 33962002.
Zhang T, Liu H, Li L, Guo Z, Song J, Yang X. Leukocyte/platelet hybrid membrane-camouflaged dendritic large pore mesoporous silica nanoparticles co-loaded with photo/chemotherapeutic agents for triple negative breast cancer combination treatment. Bioact Mater. 2021;6(11):3865-78. doi: 10.1016/j.bioactmat.2021.04.004, PMID 33937590.
Zhang Y, Xiong M, Ni X, Wang J, Rong H, Su Y. Virus-mimicking mesoporous silica nanoparticles with an electrically neutral and hydrophilic surface to improve the oral absorption of insulin by breaking through dual barriers of the mucus layer and the intestinal epithelium. ACS Appl Mater Interfaces. 2021;13(15):18077-88. doi: 10.1021/acsami.1c00580, PMID 33830730.
Zhu M, Ou X, Tang J, Shi T, Ma X, Wang Y. Uptake distribution and translocation of Imidacloprid-loaded fluorescence double hollow shell mesoporous silica nanoparticles and metabolism of Imidacloprid in pakchoi. Sci Total Environ. 2021;787:147578. doi: 10.1016/j.scitotenv.2021.147578, PMID 33964772.
El Ashry RM, El Saadony MT, El Sobki AE, El Tahan AM, Al Otaibi S, El Shehawi AM. Biological silicon nanoparticles maximize the efficiency of nematicides against biotic stress induced by Meloidogyne incognita in eggplant. Saudi J Biol Sci. 2022;29(2):920-32. doi: 10.1016/j.sjbs.2021.10.013, PMID 35197760.
Mohamed Isa ED, Ahmad H, Abdul Rahman MB. Optimization of synthesis parameters of mesoporous silica nanoparticles based on ionic liquid by experimental design and its application as a drug delivery agent. J Nanomater. 2019;2019:1-8. doi: 10.1155/2019/4982054, PMID 31534567.
Juneja R, Vadarevu H, Halman J, Tarannum M, Rackley L, Dobbs J. Combination of nucleic acid and mesoporous silica nanoparticles: optimization and therapeutic performance in vitro. In: therapeutic RNA nanotechnology. Singapore: Jenny Stanford Publishing; 2021. p. 245-78. doi: 10.1201/9781003109198-10, PMID 34582145.
Saputra OA, Wibowo FR, Lestari WW. High storage capacity of curcumin loaded onto hollow mesoporous silica nanoparticles prepared via improved hard-templating method optimized by Taguchi DoE. Engineering Science and Technology an International Journal. 2022;33:101070. doi: 10.1016/j.jestch.2021.10.002, PMID 34891256.
Agi A, Junin R, Zaidi Jaafar M, Aishah Saidina Amin N, Akhmal Sidek M, Yakasai F. Process optimization of reservoir fines trapping by mesoporous silica nanoparticles using box-behnken design. Alex Eng J. 2022;61(11):8809-21. doi: 10.1016/j.aej.2022.02.016, PMID 35432987.
Arantes TM, Pinto AH, Leite ER, Longo E, Camargo ER. Synthesis and optimization of colloidal silica nanoparticles and their functionalization with methacrylic acid. Colloids Surf A Physicochem Eng Asp. 2012;415:209-17. doi: 10.1016/j.colsurfa.2012.09.041, PMID 23012456.
Khalbas AH, Albayati TM, Saady NM, Zendehboudi S, Salih IK, Tofah ML. Insights into drug loading techniques with mesoporous silica nanoparticles: optimization of operating conditions and assessment of drug stability. J Drug Deliv Sci Technol. 2024;96:105698. doi: 10.1016/j.jddst.2024.105698, PMID 38734521.
Mansor AF, Mohidem NA, Wan Mohd Zawawi WN, Othman NS, Endud S, Mat H. The optimization of synthesis conditions for laccase entrapment in mesoporous silica microparticles by response surface methodology. Micropor Mesopor Mater. 2016;220:308-14. doi: 10.1016/j.micromeso.2015.08.014, PMID 26432187.
Zhang Z, Mayoral A, Melian Cabrera I. Protocol optimization for the mild detemplation of mesoporous silica nanoparticles resulting in enhanced texture and colloidal stability. Micropor Mesopor Mater. 2016;220:110-9. doi: 10.1016/j.micromeso.2015.08.026, PMID 26531245.
Balis A, Zapotoczny S. Tailored synthesis of core-shell mesoporous silica particles optimization of dye sorption properties. Nanomaterials (Basel). 2018;8(4):230. doi: 10.3390/nano8040230, PMID 29642621.
Lestari WA, Saputra OA, Diaz Garcia D, Wahyuningsih S, Gomez Ruiz S, Wibowo FR. Design of experiments as a strategy for modulating the colloidal stability, physico-chemical properties and drug-delivery potential of small mesoporous silica nanoparticles. Adv Powder Technol. 2023;34(10):104191. doi: 10.1016/j.apt.2023.104191, PMID 37345678.
Kittappa S, Cui M, Ramalingam M, Ibrahim S, Khim J, Yoon Y. Synthesis mechanism and thermal optimization of an economical mesoporous material using silica: implications for the effective removal or delivery of ibuprofen. PLOS One. 2015;10(7):e0130253. doi: 10.1371/journal.pone.0130253, PMID 26161510.