
Int J App Pharm, Vol 17, Issue 6, 2025, 184-191Original Article
BIOANALYTICAL METHOD DEVELOPMENT AND VALIDATION OF REMDESIVIR IN HUMAN PLASMA BY LC-MS/MS AS PER ICH M10 GUIDELINE
SUBHRANSHU PANDA1, TUSHAR CHAVAN2*, RAVINDRA BHAVSAR3
12School of Pharmaceutical Sciences, Jaipur National University, Jagatpura, Jaipur, Rajasthan-302017, India. 3Department of Clinical, Pharmadesk Solutions Pvt Ltd, Navi Mumbai, Maharashtra-400710, India
*Corresponding author: Tushar Chavan; *Email: tusharchavan21@gmail.com
Received: 04 Jul 2025, Revised and Accepted: 02 Sep 2025
ABSTRACT
Objective: Remdesivir, an adenosine analogue prodrug widely used during Coronavirus disease 2019 (COVID-19) pandemic. In this research, the objective was to develop a cost-effective and robust bioanalytical method capable of accurately quantifying remdesivir in human clinical studies as per ICH M10 guideline.
Methods: Development of a liquid chromatography-tandem mass spectrometry (LC-MS/MS) method with electro spray ionisation (ESI) source primarily involved extensive chromatographic optimization trials. Among various tested columns, Waters Symmetry C18 (5 µm, 3.9 mm×150 mm) demonstrated most consistent and well-defined chromatographic response when used with a highly organic acidified mobile phase, achieving a short run time of 3 min. For extraction method optimization, multiple approaches were evaluated, with protein precipitation emerging as preferred technique with environmentally friendly reagent use.
Results: Bioanalytical method validation was performed well as per ICH M10 (International Council for harmonisation of Technical Requirements for pharmaceuticals for Human Use) guidelines. The method demonstrated good linearity from 50-5000 ng/ml, with a correlation coefficient (R²) of 0.9978. The within-run and between-run precision for all quality control (QC) levels remained up to 6.65%, while accuracy ranged from 95.22-110.74%. Remdesivir was stable under freeze-thaw, auto sampler, bench top and long-term settings, with a percentage change of±15%. The paired t-test analysis revealed no significant difference between fresh and stability samples (p>0.1).
Conclusion: Validated calibration range of 50–5000 ng/ml is suitable for bioanalysis of remdesivir in human clinical studies involving intravenous infusion, considering reported Cmax of approximately 2229 ng/ml. This study highlights the integration of advanced LC-MS/MS techniques for quantification of remdesivir using remdesivir D5 as an internal standard in human plasma.
Keywords: Remdesivir, Bioanalytical, Method validation, Bioanalysis, Clinical study, ICHM10, LC-MS/MS
© 2025 The Authors. Published by Innovare Academic Sciences Pvt Ltd. This is an open access article under the CC BY license (https://creativecommons.org/licenses/by/4.0/)
DOI: https://dx.doi.org/10.22159/ijap.2025v17i6.55897 Journal homepage: https://innovareacademics.in/journals/index.php/ijap
INTRODUCTION
Remdesivir (GS-5734), an adenosine analogue used to treat ribonucleic acid (RNA) virus infections like Coronavirus disease 2019 (COVID-19), Ebola, etc. This action remdesivir exhibited by blocking RNA synthesis, hence reducing sickness duration and severity. This research was initiated to have an effective but broad-spectrum small molecule against RNA viruses [1]. This requirement arose considering the ongoing or recent outbreak of global pandemics such as SARS, MERS and Ebola virus [2]. In 2020, the United States Food and Drug Administration (USFDA) approved remdesivir for use in adults and children. This use was limited to patients with confirmed or suspected COVID-19 who admitted in hospital with SPO2 level of less than or equal to 94 %. Later on, this drug usage approved in paediatric population with confirm COVID-19 cases [3]. Remdesivir demonstrates its pharmacodynamic properties by primarily targeting the viral replication cycle via RNA polymer enzyme [4]. Once it gets administered, it is metabolised into remdesivir triphosphate, which is comparable to adenosine triphosphate (ATP), a main building block of viral RNA [5]. As a result, it competes with natural ATP to promote viral growth. Remdesivir (fig. 1) is a carboxylic ester, pyrrolotriazine, nitrile, phosphoramidate ester, C-nucleoside and aromatic amine with the chemical formula C27H35N6O8P with a molecular weight of 602.58g/mol.
The route of administration of remdesivir is intravenous, where it is metabolised predominantly in liver. Remdesivir is 88-93.60 % bound to human plasma proteins. Already developed bioanalytical methods mostly involved use of protein precipitation, addition it was considered as it will be faster for processing and better throughput for our high-volume clinical setup, so considering all these facts and protein binding, first preferred bioanalytical extraction method was protein precipitation [6, 7].

Fig. 1: Structure of remdesivir
This study focuses solely on the quantification of remdesivir in human plasma for bioanalytical support of studies, as well as to serve a gold standard method to compare with other bioanalytical methods in research work where the primary analyte of interest is the parent drug. The method was not designed or intended for comprehensive pharmacokinetic profiling or metabolite quantification. Also, clinical questions cantered on initial exposure to the parent drug following intravenous administration, where peak plasma levels of remdesivir are most relevant. A review of the literature reveals that a limited number of published articles focus on the estimation of remdesivir using liquid chromatography-tandem mass spectrometry (LC-MS/MS) coupled with ESI, but most have limitations when compared with our validated assay.
However, some of these methods are developed using rat plasma like Srinivasa Rao, along with three coworkers who published LC-MS/MS method in 2022. This method was developed in Rat plasma with a calibration range of 1 ng/ml to 20ng/ml using LC-MS/MS and similarly, Ping Du et al. along with four coworkers, published LC-MS/MS method in 2021 in rat plasma with a calibration range of 2 to 1000 ng/ml using LC-MS/MS [8, 9]. Both methods were in rat plasma with a very narrow calibration curve (CC) range compared to method we validated. Nguyen, along with seven coworkers published LC-MS/MS method in 2021 in Human plasma with a calibration range of 0.5–5000 ng/ml using protein precipitation, but with a 4 min run time, which is greater than method we developed [10]. Harahap, along with two coworkers, published LC-MS/MS method in 2023 which was also developed in human plasma with a calibration range of 0.002–8 μg/ml using protein precipitation but using a non-standard collection technique [11]. Alvarez along with four coworkers, published LC-MS/MS method in 2021, which was developed in human plasma with a calibration range of 5 to 2500 µg/l using LC-MS/MS, but in comparison to this, our method is more appropriate in terms of calibration range in human plasma [12]. It also revealed that some methods are having a drawback of poor sensitivity and non-availability of deuterated internal standard like Xiao along with nine coworkers published LC-MS/MS method in 2021 in Human plasma with calibration range of 4–4000 ng/ml using LC-MS/MS and protein precipitation as extraction method by utilising LC-MS/MS in the case of biological samples [13]. Notably, none of the reported methods fully comply with the ICH M10 guidelines for method validation (MV). So here we would like to highlight that the current method demonstrates faster run time (3 min), use of a deuterated internal standard (remdesivir-D5) and validation over linearity range (50–5000 ng/ml), which makes it suitable for clinical application. In comparison to methods developed in rat plasma or those lacking full compliance with ICH M10, our approach offers advantages in both regulatory alignment and simplicity. Based on reported Cmax of 2,229 ng/ml in healthy human subjects, lower limit of quantification (LLOQ) for this research was set at 5% of Cmax and upper limit of quantification (ULOQ) was determined as twice Cmax like Permata et al. Researcher shown in their work [14]. Accordingly, the aim was set to develop and validate a bioanalytical method of remdesivir using remdesivir D5 as an internal standard as per ICHM 10 guideline over LC-MS/MS with a linearity range of 50-5000 ng/ml [15].
MATERIALS AND METHODS
Materials
Remdesivir and remdesivir-D5 were sourced from Vivan Life Sciences, Thane, India. HPLC-grade Acetonitrile and Methanol (J. T. Baker), Ammonium Acetate, Ammonium Formate, Formic Acid (Merck) and Milli-Q water were used. Human blank plasma lots containing 2-Ethylenediaminetetraacetic acid (K2EDTA) as an anticoagulant (1.8 mg/ml K2EDTA) were procured from Clinical Lab, Mumbai, India, which were purely collected for research purpose.
Analytical equipment
Thermo Fisher Scientific Accela HPLC coupled with a TSQ ENDURA mass spectrometer LC-MS/MS was used in this research. Electro spray ionisation (ESI) mode was used in this instrument in MRM mode. This instrument is well recognized for its high sensitivity and robustness, making it suitable for bioanalytical method development (MD) and MV of remdesivir.
Preparation of stock and intermediate working dilutions
Separate stock solutions were prepared for CC and quality control (QC) samples of remdesivir. During stability assessments, fresh CC and QC stock solutions were weighed and prepared. Remdesivir used in this study had an assay purity of>99.7% and was dissolved in methanol to obtain a 1 µg/ml stock solution. Each day, fresh stock and working dilutions were prepared, so stock stability and required temperature conditions were not evaluated. From stock, working dilutions were prepared as per concentrations referred in table 1 in methanol: water (80:20% v/v) diluent ranging from 50 to 5000 ng/ml. QC samples were prepared at four levels: LLOQ (50 ng/ml), Low QC (LQC) (150 ng/ml), Medium QC (MQC) (2000 ng/ml) and High QC (HQC) (4000 ng/ml), following ICH M10 recommendations [16].
Mass parameters optimisation
Mass parameter was tuned on LC-MS/MS-TSQ ENDURA (Thermo Fisher Scientific) without integrating a high-performance liquid chromatography (HPLC) system. During tuning process, only mass profile was activated. A 100 ng/ml solution of remdesivir in Methanol was prepared and continuously infused into ESI source using a syringe infusion pump with a flow of 10 μl/min for direct mass spectrometric optimisation. The objective of tuning was to obtain optimised quadrupole-1 (Q1) and 2 (Q2) responses by systematically adjusting compound-dependent and source-dependent parameters to achieve optimal ionization and detection [17, 18].
Table 1: Targeted CC and QC concentrations
| Level | Criteria | Concentrations |
| CC-1 | LLOQ | 50 ng/ml |
| CC-2 | 2x of LLOQ | 100 ng/ml |
| CC-3 | 5 % of ULOQ | 250 ng/ml |
| CC-4 | 15 % of ULOQ | 750 ng/ml |
| CC-5 | 50 % of ULOQ | 2500 ng/ml |
| CC-6 | 75 % of ULOQ | 3750 ng/ml |
| CC-7 | 90 % of ULOQ | 4500 ng/ml |
| CC-8 | ULOQ | 5000 ng/ml |
| LLOQ QC | 100 % of LLOQ | 50 ng/ml |
| LQC | 3 x of LLOQ | 150 ng/ml |
| MQC | 50 % of ULOQ | 2500 ng/ml |
| HQC | 80 % of ULOQ | 4000 ng/ml |
Similarly, approximately 2 mg of remdesivir D5 (assay purity>99.2%) was weighed and dissolved in methanol, which further diluted to a concentration of 1000 ng/ml to use as the required internal standard dilution.
Chromatographic optimization
Following mass tuning, multiple trials were conducted using different HPLC columns and varying mobile phase compositions to optimize chromatographic conditions. The objective was to achieve a well-defined peak shape without fronting or tailing, along with a satisfactory chromatographic response [19].
Optimization of the extraction method
In extraction trials, liquid-liquid extraction and protein precipitation was considered as first choice for extraction method trials and then liquid-liquid or solid phase extraction were evaluated. Protein precipitation with different reagents were explored after looking at chromatographic response observed [20, 21].
Bioanalytical method validation
To perform MV of remdesivir human plasma, acceptance criteria were set as per current industry practice and as per USFDA ICH M10 guidelines, which aim to provide guidance about bioanalytical MV and biostudy sample analysis [22]. Selectivity, sensitivity, matrix effect (ME), autosampler carry over test (ASCOT), precision and accuracy batch (PAB), specificity, within and between run precision and accuracy (PA), freeze-thaw (FT) stability, autosampler (AS) stability, bench top (BT) stability and long-term (LT) stability were evaluated [23, 24].
During MV, percent change and percent accuracy were evaluated using below formula:
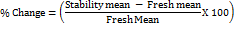
These calculations were considering the ICH M0 guideline requirement for bioanalytical MV and study sample analysis. Considering limited scope and budget, instead of conducting stock solution stability, freshly prepared stock solutions were used for all validation runs.
Calibration linearity and determining weighting factor
CC standard samples from PAB were back calculated using three weighting factors that is x, 1/x and 1/x2 to evaluate best weighting factor for remdesivir quantification using a bioanalytical method in human plasma. The weighting factor with least sum of absolute relative error (ARE) was selected as it was more balanced and appropriate while constructing linearity plot. The formula for % ARE is as mentioned below:

Selectivity and sensitivity
Selectivity was assessed using six different human plasma lots. One blank sample of each lot was processed along with one set of freshly spiked and prepared CC standards and batch evaluation QCs in human plasma. Responses of interfering peaks at retention time (RT) of remdesivir in blank samples should be less than 20% of response of LLOQ sample and responses of interfering peak at m/z and RT of remdesivir D5 shall be 5 % of mean response of internal standard observed in CC and QC samples.
To determine sensitivity, five individual aliquots of LLOQ samples were processed and analysed on two different occasions. Signal-to-Noise ratio for all LLOQ samples evaluated which should be ≥ 10. Precision should be within acceptance criteria of ≤ 20 % and accuracy should be within acceptance criteria of 80-120 % of nominal.
Matrix effect
ME was evaluated by preparing low and high QC samples by spiking 2.5 % of spiking solution of HQC and LQC of remdesivir in six different human blank plasma lots containing K2EDTA as an anticoagulant and analysed along with freshly processed CC standards and batch qualifying QCs. Percent accuracy of QC samples shall be within 85-115 % for all samples from all matrix lots. The % coefficient of variation (% CV) of QC sample shall be±15 % for each matrix lot.
Autosampler carry-over test
ASCOT was performed by injecting processed samples in sequence as extracted blank plasma, extracted ULOQ, extracted blank, extracted LLOQ, extracted blank, extracted ULOQ, Extracted blank and at last extracted LLOQ. Response obtained in Blank (after 1st and 2nd injection of extracted high sample) samples at m/z and RT of remdesivir should be ≤ 20 % of LLQQ response and should be ≤ 5 % response at m/z and RT of remdesivir D5 with respect to remdesivir D5 response obtained for entire batch.
Recovery
Recovery was determined by comparing remdesivir response observed at QC with detector response obtained from recovery samples with extracted spiked QC samples at 150, 2500 and 4000 ng/ml concentration level. Percent recovery obtained from each QC level shall be ≤ 15 % for both remdesivir and remdesivir D5.
Precision and accuracy batch
PA batch consisting of Blank, zero, 1 set of CCs and 5 sets of QCs at LLOQ QC, LQC, MQC and HQC level processed using optimized extraction method. Acceptance criteria of blank were same as selectivity blank samples. Back calculated concentration (BCC) of calibration standards shall not exceed±15 % of their respective nominal concentrations, except for LLOQ for which it shall not exceed±20 %. At least 75 % of non-zero standards must meet above criteria and standards that do not meet acceptance criteria shall be eliminated from generated CC.
Specificity
Specificity refers to capability of a bioanalytical method to identify and distinguish remdesivir from other substances like medications likely to be used alongside intended treatment. To investigate specificity possible interference by usual co-administered (concomitant) drugs that is caffeine (Cmax: 10 µg/ml) [25], ibuprofen (Cmax: 15 µg/ml) [26], diclofenac (Cmax: 100 µg/ml) [27], paracetamol (Cmax: 10 µg/ml) [28], ondansetron (Cmax: 40 ng/ml) [29] and ranitidine (Cmax: 800 ng/ml) [30] were spiked in human blank plasma such that final concentrations were near to Cmax of particular co-administered drugs and were evaluated along with one set of freshly spiked and prepared CC standards and batch evaluation QCs.
Freeze-thaw and autosampler stability
To evaluate FT stability, five different aliquots of LQC and HQC stability samples after freezing for 24 h were removed and thawed for 1 h and then again stored at-20±5 °C. Likewise, after completion 3 cycles, FT stability was assessed by analysing stability samples along with one set of freshly spiked CC standards and freshly spiked batch qualifying QC’s. Whereas to evaluate AS stability, processed LQC and HQC samples were stored in AS for 18 h. After stability duration, FT stability samples along with one set of freshly spiked CC standards and freshly spiked batch qualifying QC’s were processed and analysed. Percent change shall not be more than 15 % while comparing mean back-calculated values of stability samples against nominal values.
Bench top and long-term stability
To evaluate BT stability, five different aliquots of LQC and HQC stability samples were kept on bench at room temperature for 5 h. Whereas to evaluate LT stability, LQC and HQC stability samples were stored in a deep freezer at-20±5 °C for 16 d. After stability duration, stability samples along with one set of freshly spiked CC standards and freshly spiked batch qualifying QC’s were processed and analysed as per optimised extraction method. Percent change shall not be more than 15 % while comparing mean back-calculated values of stability samples against nominal values. We did not perform LT stability at-70 °C for a longer duration, as our study did not intend to store clinical samples under deep-freeze conditions for a longer time. However, LT stability at-20 ± 5 °C for 16 d demonstrated acceptable stability and based on well-documented trends for plasma analyte preservation, it is reasonable to infer that remdesivir would exhibit even longer duration stability at-70 °C.
RESULTS AND DISCUSSION
Mass parameters optimisation
The ESI source in positive ion mode produced a significantly stronger response during tuning compared to the negative ion mode like Srinivasa Rao reported in their research work [8]. In positive polarity, the precursor ions of remdesivir and remdesivir-D5 were observed at mass-to-charge (m/z) ratios of 603.3 and 608.0, respectively. Upon fixing Q1, scanning of Q2 revealed prominent product ions at m/z 327.8 for remdesivir and 332.9 for remdesivir-D5, as shown in fig. 2. Mass spectrometric parameters were optimized with collision energies of 5.0 and 20.0 eV, a chromatographic peak width of 10, dwell time of 331.1 milliseconds, CID gas pressure of 1.5 psi, ion spray voltage of 4000 V, vaporizer temperature of 350 °C, sheath gas pressure of 45.0 psi and auxiliary gas pressure of 1.0 psi.
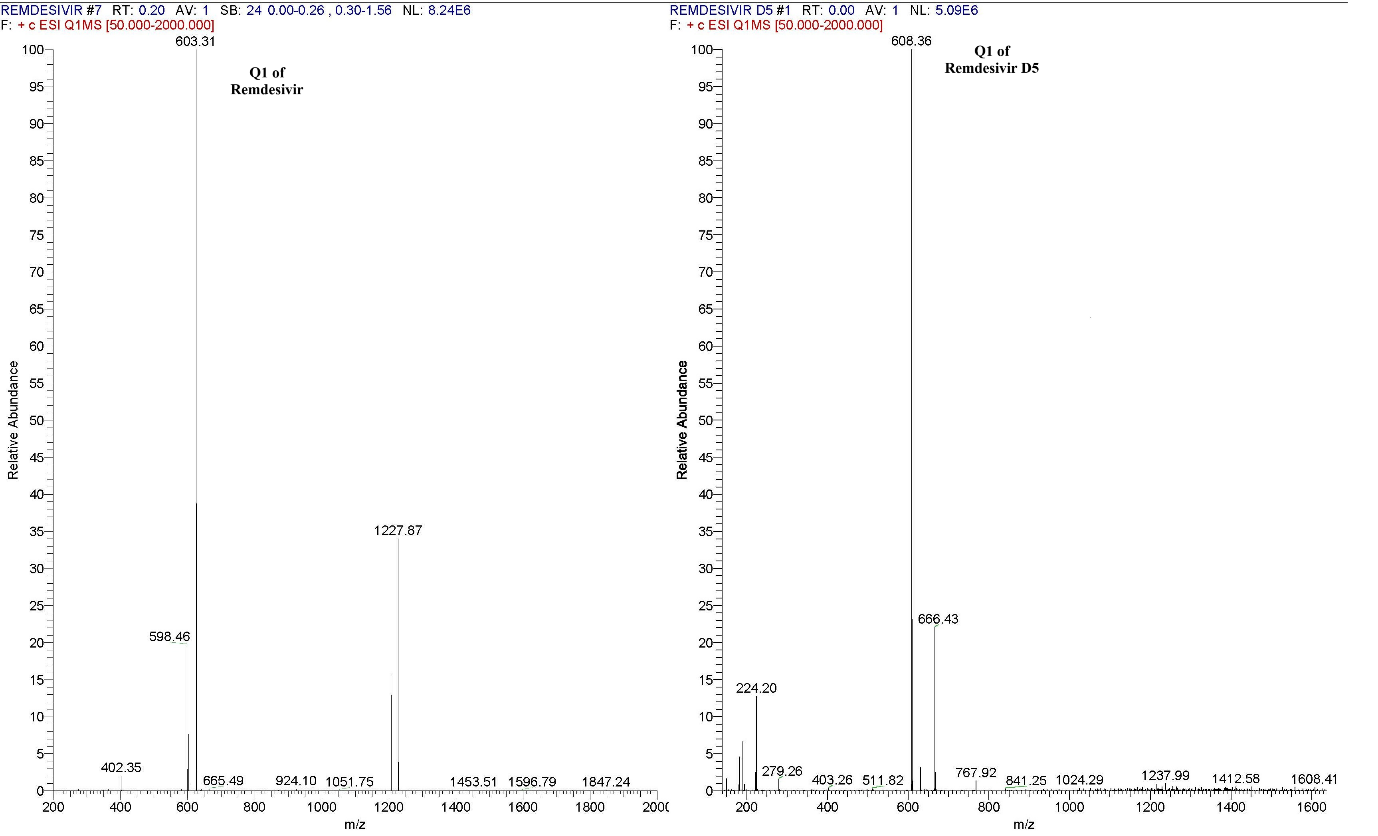
Fig. 2: Parent ion mass spectra of remdesivir and remdesivir D5
In positive polarity mode, a strong and consistent response was observed, leading to final tuning parameters being set to ensure optimal sensitivity and reproducibility.
Chromatographic optimization
Initial trials with a Hypersil Gold C18 column (150×4.6 mm, 5 µm) using methanol: 2 mmol ammonium acetate (70:30% v/v) as the mobile phase resulted in suboptimal peak shapes for both remdesivir and remdesivir-D5. Several other columns were also evaluated during method development. After multiple optimization attempts, the best peak shapes were obtained with a Waters Symmetry C18 column (150×3.9 mm, 5 µm) using methanol: 10 mmol ammonium acetate, pH 3.0 (95:5% v/v) as the mobile phase, which provided the highest organic content. The optimized flow rate was set at 0.7 ml/min with an injection volume of 20 µl**, yielding sufficient response on LC-MS/MS. A column oven temperature of 40 °C and AS temperature of 10 °C supported a total run time of 3 min, which is among the shortest reported for similar methods using an isocratic program. The rinsing solution for the injection needle was acetonitrile: 10 mmol ammonium acetate (90:10% v/v) [31].
Extraction method optimization
Protein precipitation initially produced a good response for the remdesivir peak, but recovery was low. In the final optimized procedure, 200 µl** of spiked human plasma, fortified with 50 µl** of 1000 ng/ml remdesivir-D5 to achieve a spiked concentration of 250 ng/ml, was precipitated using 1% acidified acetonitrile with formic acid instead of 100% methanol. The mixture was vortexed for 15 min at 1000 rpm using a Vibramax instrument and centrifuged at 4000 rpm for 10 min. The resulting supernatant was carefully separated with a micropipette and maintained at 10 °C in the AS before injection. A 20 µl** aliquot was injected into the LC-MS/MS system, yielding a well-defined, symmetric peak with acceptable recovery. Based on these results, protein precipitation with 1% acidified acetonitrile was selected as the optimized extraction method for MV [32].
Calibration linearity and determining weighting factor
Percent ARE observed as 30.96, 25.70 and 22.97% with weighting factor of x, 1/x and 1/x2, respectively. So, as per fig. 3, lowest % ARE was observed for 1/x2 with passing of all CC standards.
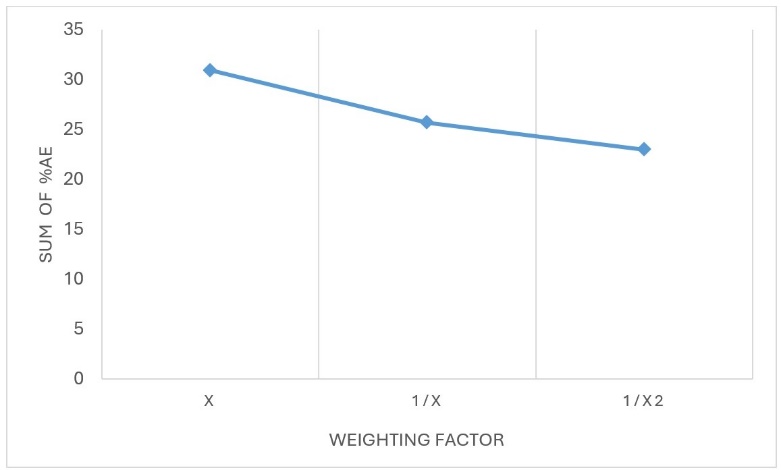
Fig. 3: Trend of %ARE across various weighting factors, hence, 1/x2 was considered as weighting factor for bioanalysis in human plasma
Selectivity and sensitivity
As shown in fig. 4, when compared with LLOQ of remdesivir at 50 ng/ml, no interference was observed in all six plasma lots at m/z and RT of remdesivir and remdesivir-D5.
Since no interference was observed in any of human blank plasma batches, human plasma method was found selective for remdesivir bioanalysis in human plasma.
During sensitivity estimation, Signal to noise ratio for all LLOQ samples observed in range of 175.0-259.8, which is more than 10. Precision was of LLOQ at concentration of 50ng/ml, found up to 4.64% and accuracy up to 98.00%.
Matrix effect
Precision of LQC and HQC samples, which were analysed to evaluate ME, found ranged between 1.70-3.54% (at 150 ng/ml) and 0.73-1.68% (at 4000 ng/ml), which was within acceptance criteria of ≤15%. Accuracy of ME samples ranged between 99.14-99.87% (at 150 ng/ml) and 107.63-110.52% (at 4000 ng/ml), which was within acceptance criteria of 85-115%. As observed in this method, ME was minimal with high accuracy, ranging from 99.14% to 110.52% and low variability (% CV ≤ 3.54%) across different plasma lots. Whereas reported ME for Alvarez is on higher side with % CV of<9% [12].
Autosampler carry-over test
After 1st and 2nd injection of extracted ULOQ samples, extracted blank samples shows zero interference at RT and m/z of remdesivir and remdesivir D5. So, method and system were considered as free from carryover of remdesivir and remdesivir D5.
Recovery
Batch qualifying QC samples met acceptance criteria, with precision for mean % recovery at each QC level ≤ 15% for both remdesivir and remdesivir D5. The percent coefficient of variation (% CV), that is precision was obtained by dividing the standard deviation (SD) by mean value and multiplying by 100 at each level using excel formula. The overall recovery was determined to be 91.87% for remdesivir and 85.65% for remdesivir D5. Recovery in human plasma was found consistent and acceptable at all QC levels. The lower IS recovery (85.65%) compared to remdesivir (91.87%) might be due to some variation in spiking, but it has no impact on assay reproducibility. This indicates good extraction efficiency of the method across the QC levels, suitable for clinical application. This recovery is very much on higher side in comparison with already reported method of remdesivir by Harahap by less than 70% [11].
Precision and accuracy batch
In all PA batches (PA batches 1-3), blank and zero samples were found free from interference for remdesivir. Also, BCC of calibration standards ranges from 97.36-105.18% which does not exceed±15 % of their respective nominal concentrations as shown in table 3. CC linearity was evaluated using least-squares regression analysis with a weighting factor of 1/x². Non-zero standards meeting above criteria with correlation coefficient (R²) value of 0.9978 as shown in fig. 5 along with chromatograms which is greater than researcher reported in their reported literature [8]. The %CV at each level was observed to be less than 4% which was calculated from the mean and SD, when all three PA batches were compared statistically using Microsoft Excel.
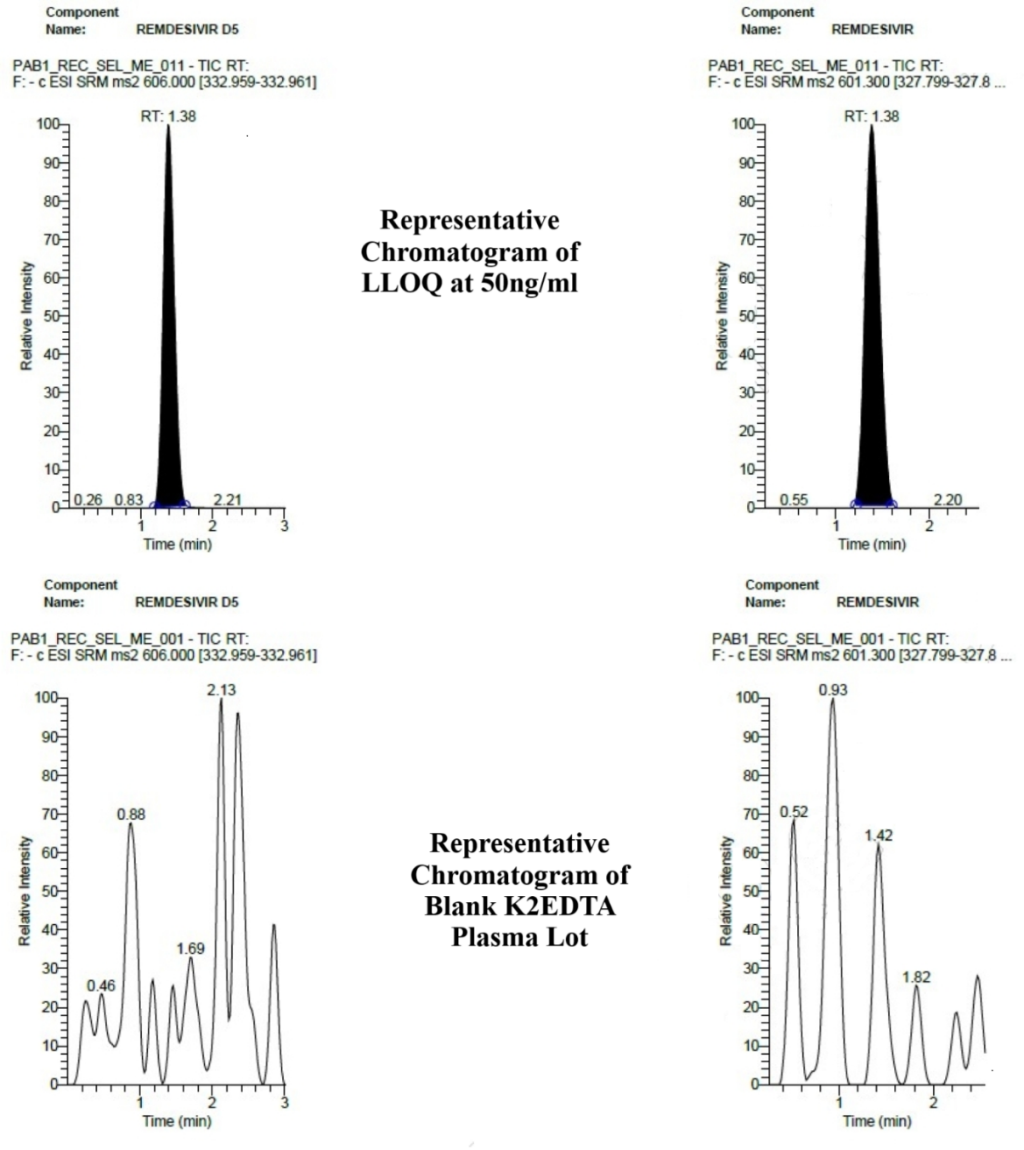
Fig. 4: Representative chromatograms of LLOQ and blank K2EDTA human plasma lot
Table 2: Recovery of analyte at each level
| QC | LQC (% Recovery) | MQC (% Recovery) | HQC (% Recovery) |
| 1 | 102.06 | 105.81 | 87.90 |
| 2 | 93.10 | 87.33 | 91.14 |
| 3 | 101.20 | 86.79 | 91.72 |
| 4 | 81.80 | 89.14 | 92.65 |
| 5 | 87.54 | 84.87 | 94.97 |
| Mean±SD | 93.1±8.72 | 90.8±8.53 | 91.7±2.57 |
| %CV | 9.37 | 9.39 | 2.80 |
| Overall mean % recovery±SD | 91.87± 1.18 | ||
| Overall %CV | 1.29 |
All mean and overall mean recovery values are expressed as mean±SD, n=5
Table 3: CC data for PA batches
| CC ID | PAB-1 BCC (ng/ml) | PAB-2 BCC (ng/ml) | PAB-3 BCC (ng/ml) | Mean±SD (ng/ml) | %CV | % Nominal |
| CC-1 | 47.67 | 49.56 | 48.80 | 48.68±0.95 | 1.96 | 97.36 |
| CC-2 | 108.61 | 101.96 | 104.97 | 105.18±3.33 | 3.17 | 105.18 |
| CC-3 | 257.17 | 249.53 | 249.47 | 252.06±4.43 | 1.76 | 100.82 |
| CC-4 | 730.303 | 741.21 | 743.93 | 738.48±7.21 | 0.98 | 98.46 |
| CC-5 | 2484.82 | 2503.95 | 2584.95 | 2524.57±53.15 | 2.11 | 100.98 |
| CC-6 | 3737.82 | 3809.71 | 3712.33 | 3753.28±50.50 | 1.35 | 100.09 |
| CC-7 | 4495.024 | 4526.71 | 4450.02 | 4490.59±38.54 | 0.86 | 99.79 |
| CC-8 | 4842.13 | 4896.59 | 4858.43 | 4865.71±27.95 | 0.57 | 97.31 |
All mean values are expressed as mean±SD, n=3
PAB-1 was considered for within-run calculations, whereas all three PA batches were considered for between-run calculations. In within-run calculations, the mean BCC and SD were derived from BCC values obtained at each QC level of PAB-1. While the % nominal, calculated by dividing the mean BCC by the nominal concentration. In between run calculations, similarly, precision and accuracy were calculated using data of all three PA batches. Results from this analysis were presented in table 4.
Table 4: Within and between run precision and accuracy
| QC Level | Within-run from PAB-1 | Between run from PAB-1, 2 and 3 batches | ||||
| mean BCC±SD (ng/ml) N=5 | %CV | % Nominal | Mean BCC±SD (ng/ml) N=15 | %CV | % Nominal | |
| LLOQ QC (50.0 ng/ml) | 47.60±2.20 | 4.64 | 95.22 | 47.84±1.86 | 3.89 | 95.69 |
| LQC (150.0 ng/ml) | 156.87±10.43 | 6.65 | 104.58 | 153.02±7.06 | 4.61 | 102.01 |
| MQC (2500.0 ng/ml) | 2696.67±38.46 | 1.43 | 107.87 | 2688.92±56.17 | 2.09 | 107.56 |
| HQC (4000.0 ng/ml) | 4429.51±25.63 | 0.58 | 110.74 | 4334.92±84.55 | 1.95 | 108.37 |
All mean values are expressed as mean±SD, n=5 for within-run from PAB-1 and n=15 for between-run from PAB-1, 2 and 3 batches.
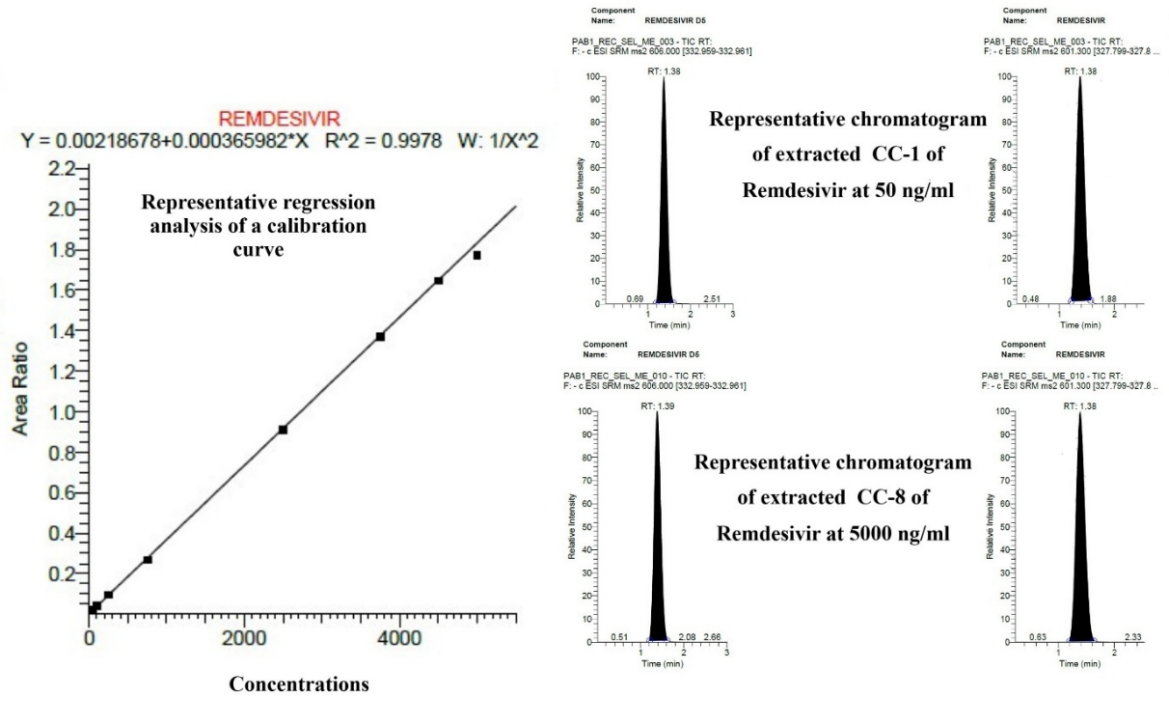
Fig. 5: Representative regression analysis, extracted CC-1 (LLOQ) and CC-8 (ULOQ) from PA batch
The within run and between-run results demonstrated that both PA were well within the acceptance limits defined by ICH M10. Within-run and between-run precision did not exceed 6.65% and 4.61% respectively, confirming reproducibility of the method across replicates and runs. These results are very much with narrow range than reported method by Nguyen [10]. The % nominal values for within-run (95.22–110.74%) and between-run (95.69–108.37%) calculations also fell within the acceptable range, establishing method accuracy. Overall, the PA results within these tight ranges confirm that the developed LC-MS/MS assay for remdesivir is reliable, robust and suitable for bioanalytical applications.
Specificity
Batch evaluation QCs were found within acceptance criteria. No interference was observed at m/z and RT of remdesivir and remdesivir-D5 specificity samples in presence of concomitant drugs, which indicates quantification method is specific for remdesivir in presence of concomitant drugs.
Freeze-thaw and autosampler stability
The percent change of LQC and HQC samples were within acceptance criteria of±15 %, while comparing mean of back-calculated values of stability samples against nominal values after 3 FT cycles and after AS stability of 18 h which was set at 10 °C, as shown in table 5. Other reported method demonstrated stability to only 2 FT cycles, which is less than our validated method [11]. Additionally, a paired t-test was conducted using MedCalc® version 23.1.7 software for the t-test (Student’s t-test) to compare the LQC and HQC concentrations of freshly prepared plasma samples and those subjected to FT, as well as AS stability samples. The results of p>0.05 showed no statistically significant difference between the groups.
Table 5: FT and AS stability
| Value | FT stability (3 cycles) | AS stability (18 h) | ||
| FT LQC | FT HQC | AS LQC | AS HQC | |
| Nominal concentration (ng/ml) | 150.00 | 4000.00 | 150.00 | 4000.00 |
| mean BCC±SD (ng/ml) | 151.78±5.51 | 4412.87±113.72 | 149.19±1.87 | 4367.52±153.27 |
| %CV | 3.63 | 2.58 | 1.26 | 3.51 |
| % Change | 1.58 | 2.06 | -0.15 | 1.01 |
| P-value | 0.417 | 0.283 | 0.727 | 0.899 |
All mean values are expressed as mean±SD, n=5, Hence, remdesivir was found stable for after 3 FT cycles and for 18 h during AS stability.
Bench top and long-term stability
Percent change of LQC and HQC samples were within acceptance criteria of±15 %, while comparing mean of back-calculated values of stability samples against nominal values after BT stability of 5 h and after LT storage of 16 d, as shown in table 6. Additionally, a paired t-test was conducted to compare the LQC and HQC concentrations of freshly prepared plasma samples and those subjected to BT, as well as LT stability samples. The results of p>0.05 showed no statistically significant difference between the groups.
Table 6: BT and LT stability assessment in plasma
| Value | BT stability (5 h) | LT stability (16 d) | ||
| BT LQC | BT HQC | LT LQC | LT HQC | |
| Nominal concentration (ng/ml) | 150.00 | 4000.00 | 150.00 | 4000.00 |
| mean BCC±SD (ng/ml) | 143.80±2.54 | 4356.03±63.91 | 147.34±4.44 | 4350.55±168.26 |
| %CV | 1.77 | 1.47 | 3.02 | 3.87 |
| % Change | -5.86 | 2.46 | -3.54 | 2.33 |
| P-value | 0.143 | 0.261 | 0.107 | 0.427 |
All mean values are expressed as mean±SD, n=5, Hence, remdesivir was found stable for 5 h during BT stability and for 16 d during LT stability storage in human plasma.
CONCLUSION
Human plasma bioanalytical method, considering conventional method is having purpose as gold standard method when compared with any other bioanalytical method with it. So, our current method focused solely on quantifying the parent drug remdesivir involving immediate pharmacokinetic profiling during early-phase human clinical studies and comparing with other bioanalytical methods. We acknowledge that GS-441524 and GS-704277 play a pharmacodynamic role and agree that its inclusion would be scientifically and regulatorily advantageous. Future work will include the development and validation of a comprehensive method for GS-441524 and GS-704277 quantification in accordance with ICH M10 guideline. All MV parameters meet predefined criteria in line with the ICH M10 guideline and acceptance criteria, which were predefined at the beginning of research work. Hence LC-MS/MS bioanalytical method for the determination of remdesivir using remdesivir D5 as internal standard in Human plasma containing K2EDTA as an anticoagulant was validated successfully with respect to system suitability, autosampler carry over test, selectivity, ruggedness, sensitivity, specificity, matrix effect, recovery and important Stabilities. During stability evaluations, as all p-values exceeded 0.05, no statistically significant degradation was observed in stability samples compared to freshly prepared ones. A simple protein precipitation method was used for extraction of remdesivir from human plasma. LC-MS/MS method is validated for the quantification of remdesivir alone in human plasma over the range of 50–5000 ng/ml, using a protein precipitation extraction method and it meets the criteria defined under ICH M10 guidelines which is sufficient to analyse samples collected from any clinical study of remdesivir IV in humans.
FUNDING
This research is completed by authors at own cost and without any grant from any funding agencies.
AUTHORS CONTRIBUTIONS
The overall study concept and experimental design were developed by S. P. and T. C., forming the foundation of the analytical strategy. T. C. provided all required standard, material and chemical for method development and validation. The manuscript was drafted by all authors along with contributed to data analysis, interpretation and manuscript revision. S. P. and T. C. critically reviewed the manuscript for scientific accuracy and clarity.
CONFLICT OF INTERESTS
The authors completed this research work without any influence or financial interests or personal relationships and same reported in this paper.
REFERENCES
Lo MK, Jordan R, Arvey A, Sudhamsu J, Shrivastava Ranjan P, Hotard AL. GS-5734 and its parent nucleoside analog inhibit filo pneumo and paramyxoviruses. Sci Rep. 2017;7:43395. doi: 10.1038/srep43395, PMID 28262699.
Farina N, Ramirez GA, De Lorenzo R, Di Filippo L, Conte C, Ciceri F. COVID-19: pharmacology and kinetics of viral clearance. Pharmacol Res. 2020;161:105114. doi: 10.1016/j.phrs.2020.105114, PMID 32758635.
Lai CC, Shih TP, Ko WC, Tang HJ, Hsueh PR. Severe acute respiratory syndrome coronavirus 2 (SARS-CoV-2) and coronavirus disease-2019 (COVID-19): the epidemic and the challenges. Int J Antimicrob Agents. 2020;55(3):105924. doi: 10.1016/j.ijantimicag.2020.105924, PMID 32081636.
Amirian ES, Levy JK. Current knowledge about the antivirals remdesivir (gs-5734) and gs-441524 as therapeutic options for coronaviruses. One Health. 2020;9:100128. doi: 10.1016/j.onehlt.2020.100128, PMID 32258351.
Thomas SN, French D, Jannetto PJ, Rappold BA, Clarke WA. Liquid chromatography tandem mass spectrometry for clinical diagnostics. Nat Rev Methods Primers. 2022;2(1):96. doi: 10.1038/s43586-022-00175-x, PMID 36532107.
Humeniuk R, Mathias A, Cao H, Osinusi A, Shen G, Chng E. Safety tolerability and pharmacokinetics of remdesivir an antiviral for treatment of COVID-19, in healthy subjects. Clin Transl Sci. 2020;13(5):896-906. doi: 10.1111/cts.12840, PMID 32589775.
Nishikawa A, Ito I, Yonezawa A, Itohara K, Matsubara T, Sato Y. Pharmacokinetics of gs-441524, the active metabolite of remdesivir in patients receiving continuous renal replacement therapy: a case series. J Infect Chemother. 2024;30(4):348-51. doi: 10.1016/j.jiac.2023.10.015, PMID 37866621.
Rao NS, Adimulapu A, Babu BN, Rambabu G. Development and validation of an HPLC-MS/MS method for the determination of remdesivir in rat plasma. J Pharm Res Int. 2022;34(28):23-31. doi: 10.9734/jpri/2022/v34i28B36032.
Du P, Wang G, Yang S, Li P, Liu L. Quantitative HPLC-MS/MS determination of NUC, the active metabolite of remdesivir and its pharmacokinetics in rat. Anal Bioanal Chem. 2021;413(23):5811-20. doi: 10.1007/s00216-021-03561-8, PMID 34302183.
Nguyen R, Goodell JC, Shankarappa PS, Zimmerman S, Yin T, Peer CJ. Development and validation of a simple selective and sensitive LC-MS/MS assay for the quantification of remdesivir in human plasma. J Chromatogr B Analyt Technol Biomed Life Sci. 2021;1171:122641. doi: 10.1016/j.jchromb.2021.122641, PMID 33756448.
Harahap Y, Noer RF, Simorangkir TP. Development and validation of method for analysis of favipiravir and remdesivir in volumetric absorptive microsampling with ultra-high-performance liquid chromatography tandem mass spectrophotometry. Front Med (Lausanne). 2023;10:1022605. doi: 10.3389/fmed.2023.1022605, PMID 37228397.
Alvarez JC, Moine P, Etting I, Annane D, Larabi IA. Quantification of plasma remdesivir and its metabolite GS-441524 using liquid chromatography coupled to tandem mass spectrometry. Application to a COVID-19 treated patient. Clin Chem Lab Med. 2020;58(9):1461-8. doi: 10.1515/cclm-2020-0612, PMID 32573468.
Xiao D, John Ling KH, Tarnowski T, Humeniuk R, German P, Mathias A. Validation of LC-MS/MS methods for determination of remdesivir and its metabolites gs-441524 and gs-704277 in acidified human plasma and their application in COVID-19 related clinical studies. Anal Biochem. 2021;617:114118. doi: 10.1016/j.ab.2021.114118, PMID 33508271.
Permata D, Harahap Y, Ramadon D. Method development and validation of cefoperazone and sulbactam in dried blood spots by high-performance liquid chromatography photodiode array detector. Int J App Pharm. 2022;14(5):214-9. doi: 10.22159/ijap.2022v14i5.45078.
Sahakijpijarn S, Moon C, Warnken ZN, Maier EY, De Vore JE, Christensen DJ. In vivo pharmacokinetic study of remdesivir dry powder for inhalation in hamsters. Int J Pharm X. 2021;3:100073. doi: 10.1016/j.ijpx.2021.100073, PMID 34977555.
EMA. CHMP/ICH. Committee for medicinal products for human use ICH guideline m10 on Bioanalytical Method Validation and study sample analysis step; 2022.
Prakash C, Shaffer CL, Nedderman A. Analytical strategies for identifying drug metabolites. Mass Spectrom Rev. 2007;26(3):340-69. doi: 10.1002/mas.20128, PMID 17405144.
Xu RN, Fan L, Rieser MJ, El Shourbagy TA. Recent advances in high-throughput quantitative bioanalysis by LC-MS/MS. J Pharm Biomed Anal. 2007;44(2):342-55. doi: 10.1016/j.jpba.2007.02.006, PMID 17360141.
Ramesh D, Habibuddin M. Application of validated RP-HPLC method for simultaneous determination of metaxalone and diclofenac potassium in plasma. Int J Curr Pharm Sci. 2024;16(4):89-94. doi: 10.22159/ijcpr.2024v16i4.5039.
Rahmania TA, Harahap Y, Sandy K. Azithromycin and oseltamivir quantification method developed and validated using liquid chromatography-tandem mass spectrometry in dried blood spot. Int J App Pharm. 2024;16(2):182-7. doi: 10.22159/ijap.2024v16i2.49051.
Tijare LK, Nt R, Un M. A review on bioanalytical method development and validation. Asian J Pharm Clin Res. 2016;9(9):6-10. doi: 10.22159/ajpcr.2016.v9s3.14321.
Kaza M, Karazniewicz Lada M, Kosicka K, Siemiątkowska A, Rudzki PJ. Bioanalytical method validation: new FDA guidance vs. EMA guideline. Better or worse? J Pharm Biomed Anal. 2019;165:381-5. doi: 10.1016/j.jpba.2018.12.030, PMID 30590335.
U. S. Food and Drug Administration. M10 bioanalytical method validation and study sample analysis: guidance for industry; 2022. Available from: https://www.fda.gov/vaccines-blood-biologics/guidance-compliance-regulatory-information-biologics/biologics-guidances.
Viswanathan CT, Bansal S, Booth B, DeStefano AJ, Rose MJ, Sailstad J. Quantitative bioanalytical methods validation and implementation: best practices for chromatographic and ligand binding assays. Pharm Res. 2007;24(10):1962-73. doi: 10.1007/s11095-007-9291-7, PMID 17458684.
Koch G, Datta AN, Jost K, Schulzke SM, Van Den Anker J, Pfister M. Caffeine citrate dosing adjustments to assure stable caffeine concentrations in preterm neonates. J Pediatr. 2017;191:50-56.e1. doi: 10.1016/j.jpeds.2017.08.064, PMID 29173321.
Huang C, Yin Z, Yang Y, Mo N, Yang H, Wang Y. Evaluation of pharmacokinetics and safety with bioequivalence of ibuprofen sustained release capsules of two formulations in Chinese healthy volunteers: bioequivalence study. Drug Des Dev Ther. 2023;17:1881-8. doi: 10.2147/DDDT.S404756, PMID 37384214.
Pena E, Inatti A, Martin XS. Bioequivalence study of diclofenac 150 mg xr: a single dose randomized open label 2-period crossover study in healthy adult volunteers. JBM. 2023;11(11):23-32. doi: 10.4236/jbm.2023.1111003.
Sevilla Tirado FJ, Gonzalez Vallejo EB, Leary AC, Breedt HJ, Hyde VJ, Fernandez Hernando N. Bioavailability of two new formulations of paracetamol compared with three marketed formulations in healthy volunteers. Methods Find Exp Clin Pharmacol. 2003;25(7):531-5. doi: 10.1358/mf.2003.25.7.778092, PMID 14571283.
Jia C, Zhao N, Song H, Hu Y, Xu Y, Guo C. Bioequivalence analysis of ondansetron hydrochloride tablets in healthy Chinese subjects: a randomized open label two period crossover phase I study. Drugs RD. 2024;24(4):531-8. doi: 10.1007/s40268-024-00493-3, PMID 39467943.
Bawazir SA, Gouda MW, El Sayed YM, Al Khamis KI, Al Yamani MJ, Niazy EM. Comparative bioavailability of two tablet formulations of ranitidine hydrochloride in healthy volunteers. Int J Clin Pharmacol Ther. 1998;36(5):270-4. PMID 9629991.
Shah SK, Dey S, De S. Simultaneous determination of atorvastatin and atenolol in rabbit plasma by RP-HPLC method and its application in pharmacokinetic study. Int J Curr Pharm Sci. 2022;14(2):72-8. doi: 10.22159/ijcpr.2022v14i2.1968.
Li W, Zhang J, Tse FL. Strategies in quantitative LC-MS/MS analysis of unstable small molecules in biological matrices. Biomed Chromatogr. 2011;25(1-2):258-77. doi: 10.1002/bmc.1572, PMID 21204113.