
Int J App Pharm, Vol 17, Issue 6, 2025, 267-276Original Article
QUALITY BY DESIGN-BASED RP-HPLC METHOD DEVELOPMENT, DEGRADATION KINETICS, AND INTEGRATED GREEN AND BLUE ASSESSMENT FOR TEPOTINIB
SYAMALA P. N. S., SREEDEVI ADIKAY*
Division of Pharmaceutical Chemistry, Institute of Pharmaceutical Technology, Sri Padmavati Mahila Visvavidyalayam, Tirupati, Andhra Pradesh-517502, India
*Corresponding author: Sreedevi Adikay; *Email: sreedevi@spmvv.ac.in
Received: 15 Jul 2025, Revised and Accepted: 22 Aug 2025
ABSTRACT
Objective: Tepotinib, a recent Food and Drug Administration (FDA) approved anticancer drug, currently lacks an official pharmacopeial RP-HPLC method for quantification, and its degradation kinetics remain unexplored. This study aimed to develop a rapid, robust, and eco-friendly RP-HPLC method for the quantification of tepotinib and to investigate its degradation kinetics.
Methods: An Analytical Quality by Design (AQbD) approach was employed. The critical method parameters were screened using a Plackett–Burman design and further optimized through a Central Composite Design. Chromatographic separation was achieved on a SunFire C18 column (250 × 4.6 mm, 5 µm) using a methanol: 0.1% OPA (52:48, v/v) mobile phase at a flow rate of 1.0 mL/min with UV detection at 272 nm. Forced degradation studies were conducted under hydrolytic, oxidative, and thermal stress. The resulting degradation kinetics were then determined. The method was validated according to the ICH Q2(R2) guidelines. Greenness and sustainability were evaluated using various green analytical metrics and the Efficient-Valid-Green (EVG) framework.
Results: The developed method achieved efficient separation of tepotinib in only five minutes with a retention time of 2.4 min. Method validation confirmed excellent linearity over 22.5–157.5 µg/ml (R² = 0.9995),%RSD for intra-and inter-day precision were 0.7 and 0.5 %, mean recovery was 99.94 %. LOD and LOQ were 0.38 µg/ml and 1.14 µg/ml, respectively. Forced degradation studies revealed significant degradation under hydrolytic, oxidative, and thermal conditions, following zero-order kinetics. The greenness assessment indicated a low ecological impact, reduced solvent consumption, and minimal waste generation.
Conclusion: An AQbD-based, environmentally friendly RP-HPLC method was successfully developed and validated for quantifying tepotinib and was applied to study its degradation kinetics. This method offers environmental sustainability and is suitable for routine pharmaceutical quality control of tepotinib.
Keywords: Tepotinib, Reverse-phase high-performance liquid chromatography (RP-HPLC), Analytical quality by design (AQbD), Degradation kinetics, Forced degradation, Greenness assessment
© 2025 The Authors. Published by Innovare Academic Sciences Pvt Ltd. This is an open access article under the CC BY license (https://creativecommons.org/licenses/by/4.0/)
DOI: https://dx.doi.org/10.22159/ijap.2025v17i6.56082 Journal homepage: https://innovareacademics.in/journals/index.php/ijap
INTRODUCTION
According to the World Health Organization (2024), by 2050, the number of cancer cases worldwide is expected to rise to over 35 million, an increase of about 77% compared to 2022 [1]. This dramatic increase underscores the need for new treatment options, reliable analytical methods, and better healthcare strategies to detect, monitor, and manage this growing burden. Among all cancers, lung cancer remains one of the most common, with more than 2.5 million new cases reported each year, making up approximately 12.4% of the total global cancer load [2]. This study focused on tepotinib (TPB), an important targeted mesenchymal-epithelial transition (MET) tyrosine kinase inhibitor used to treat certain forms of lung cancer, particularly in patients with MET exon 14 alterations, where traditional treatments often fail. TPB offers a promising alternative by selectively inhibiting MET receptor tyrosine kinase and blocking the Hepatocyte Growth Factor (HGF)-triggered phosphorylation cascade, thereby suppressing tumor cell proliferation, migration, and survival [3]. First approved by the FDA in 2020 and fully approved in 2024, following the results of the VISION trial (NCT02864992) [4, 5], TPB has quickly become a valuable treatment option for this patient group. Developed by Merck KGaA (Darmstadt, Germany), TPB is a white crystalline powder (C₂₉H₂₈N₆O₂; 492.58 Da) that is readily soluble in methanol but practically insoluble in water [6]. Its pyridazinone core, benzonitrile group, and methyl piperidinyl side chain (fig. 1) are responsible for its therapeutic action but also bring challenges for analysis, including poor aqueous solubility, complex chromatographic behavior, and a tendency to degrade under stress conditions [7].
Despite its clinical relevance, there is no official pharmacopeial RP-HPLC method for TPB and its degradation profile under stress conditions has not been thoroughly explored. Conventional one-factor-at-a-time (OFAT) method development is time-consuming and often overlooks interactions between critical method variables (CMVs). In contrast, the AQbD approach provides a more systematic and risk-based method for defining the Analytical Target Profile (ATP), identifying CMVs, and creating a robust method design space [8]. Combining AQbD with Green Analytical Chemistry (GAC) principles further reduces hazardous waste, encourages the use of safer solvents, and reduces energy consumption [9]. In this study, the greenness of the developed method was carefully assessed using multiple tools including Analytical Eco Scale (AES), Analytical Method Greenness Score (AMGS), Complex modified Green Analytical Procedure Index (Complex MoGAPI), Analytical Greenness Metric Approach (AGREE), Blue Applicability Grade Index (BAGI), and the Efficient-Valid-Green (EVG) framework to ensure that the optimized method aligns with modern sustainability goals and minimizes environmental impact. Understanding the degradation kinetics of TPB is equally important as it provides crucial information about its rate constants, half-lives, and shelf life, all of which help guide proper storage, packaging, and formulation stability [10, 11]. Although several RP-HPLC methods for TPB have been published, none has systematically applied a complete QbD-based strategy that also addresses environmental sustainability and regulatory flexibility [12–18]. Therefore, this study aimed to fill this important gap by developing and validating a robust, efficient, and environmentally friendly AQbD-based RP-HPLC method for quantifying TPB along with a detailed evaluation of its degradation kinetics under ICH-recommended stress conditions. By doing so, this work supports safer, greener, and more reliable quality control of TPB, ultimately helping ensure that patients receive stable and effective treatment with minimal environmental impact.

Fig. 1: Chemical structure of tepotinib
MATERIALS AND METHODS
Chemicals and reagents
Pure TPB (>99% purity) was obtained from Akrivis Pharma, Ltd. (Hyderabad, India). Reagent-grade OPA was procured from SD Fine Chem Ltd. High-performance liquid chromatography (HPLC)-grade methanol was obtained from Merck, Ltd., Mumbai, India. Analytical-grade HCl, NaOH, and H2O2 were obtained from Rankem (Gurugram, India).
Instrumentation
Chromatographic analysis was performed using a Waters HPLC 2695 system integrated with an autosampler, column heater, and a 2996 photodiode array detector. Data were acquired and processed using the Empower 2 software. A SunFire C18 column (250 mm×4.6 mm, 5 μm, 100 Å) was employed for separation. The experimental design was developed using Design Expert v13.1.0 (State-Ease 360). Additional equipment included a Sartorius analytical balance (BSA 2245S-CW), LABMAN ultrasonicator (LMUC3), pH meter (LMPH 15), vortex mixer (Remi CM 101), and hot air oven (Sisco India, 240V).
Preparation of solutions
Preparation of mobile phase
First, the aqueous phase was prepared by transferring 1 mL of ortho-phosphoric acid (OPA) into a 1000 mL volumetric flask. HPLC-grade water (100 ml) was added, mixed thoroughly, and diluted to volume with HPLC water. The mobile phase was prepared by mixing methanol and freshly prepared 0.1% OPA buffer (52:48 v/v), sonicated, and filtered through a 0.45 µm membrane filter. Methanol: Water (50:50 v/v) was prepared by mixing 500 mL of methanol with 500 mL of water.
Preparation of standard and test solutions
A standard stock solution of TPB at 900 µg/ml was prepared by weighing 45 mg of TPB in a 50 ml volumetric flask. The mixture was vortexed and sonicated for 10 min after adding 10 ml of the diluent and then diluted to the mark. A working standard solution of 90 µg/ml was prepared by diluting 1 ml of the stock solution to 10 ml with diluent. For the sample solution, TPB equivalent to 2250 µg/ml was weighed into a 100 ml volumetric flask, mixed with 50 ml diluent, sonicated for 25 min, and diluted to mark. A working sample solution of 90 µg/ml was prepared by diluting 0.2 ml of the stock solution to 10 ml with diluent.
Method development
The QbD approach was used to develop an HPLC method for TPB by gathering prior knowledge and understanding the characteristics of the drug. Because of TPB’s UV activity and lipophilicity of TPB, RP-HPLC was selected as the analytical technique (fig. 1). Critical Analytical Attributes (CAAs) such as Retention Time (Rt), Tailing Factor (Tf), and Number of Theoretical Plates (NTP) were defined based on the Analytical Target Profile (ATP) (table S1) [19]. To identify which chromatographic variables might significantly influence method performance, a systematic risk assessment was carried out using Failure Mode and Effects Analysis (FMEA). Nine factors were evaluated: the column type (A), flow rate (B), column oven temperature (C), organic solvent composition (D), sonication time (E), detection wavelength (F), diluent (G), injection volume (H), and column dimensions (I). Each factor was assigned a score for severity, occurrence, and detectability based on prior knowledge, literature reports, and preliminary trials. These scores were then multiplied to calculate the Risk Priority Number (RPN) for each parameter [20]. Based on the higher RPN values and practical significance, five parameters (flow rate, column temperature, organic solvent, wavelength, and injection volume) were selected for further evaluation using the Plackett–Burman design [21]. The remaining parameters, such as the column type and diluent, were fixed based on earlier experimental findings and had little impact on the critical responses. The complete risk matrix is presented in table S2.
Method optimization using the QbD approach
Screening and definition of design space
A Plackett–Burman design with five factors (aqueous phase percentage, flow rate, column temperature, wavelength, and injection volume) over 12 runs identified CAAs such as Rt, Tf, and NTP. Plackett–Burman design was selected for its ability to rapidly pinpoint the most influential factors from a set, while requiring only a minimal number of experiments. For further optimization, a CCD design was used with an aqueous phase (40–60%) and flow rate (0.8–1.2 ml/min) over 13 runs [22, 23]. CCD was chosen for its capability to capture both linear and nonlinear effects, enabling a more robust and efficient optimization process with fewer experimental runs. Regression analysis employed a second-order polynomial model incorporating only statistically significant terms (p<0.05) to develop the predictive equations. Response surface plots and numerical optimization identified optimal conditions targeting an Rt of 2–4 min, Tf of 1–1.5, and NTP ranging from 5000 to 8000.
Forced degradation studies of TPB
A stock solution of TPB was prepared by accurately weighing 225 mg of the sample and dissolving it in 50 ml of diluent to obtain a concentration of 4500 µg/ml. From this stock solution, 4 ml was accurately transferred into a 10 ml volumetric flask and diluted to volume with the same diluent, resulting in an intermediate solution of 1800 µg/ml. Subsequently, the intermediate solution (0.5 ml) was diluted to 10 ml to prepare the working standard solution with a concentration of 90 µg/ml [24].
Hydrolytic degradation (Acidic, alkaline, and neutral conditions)
To assess hydrolytic stability, 4 ml of TPB stock solution was placed into five separate 10 ml volumetric flasks. Each flask was filled with different stress-inducing media: 0.1 N HCl, 0.5 N HCl, 0.1 N NaOH, 0.5 N NaOH, and distilled water. The solutions are subjected to the stress conditions listed in table 1.
Oxidative degradation
For oxidative stress testing, 4 ml of the TPB stock solution was diluted to 10 ml using 3% and 5% hydrogen peroxide (H₂O₂) solutions in separate flasks. The samples were subjected to the conditions outlined in table 1.
Thermal (Moist heat) degradation
Thermal degradation was evaluated by diluting 4 ml of the TPB stock solution to 10 ml with a diluent (methanol: water (1:1)), followed by exposure to moist heat (table 1).
Sample collection, preparation, and storage
At predetermined time intervals (table 1), degraded samples were withdrawn and appropriately volume-adjusted using suitable solvents. The samples subjected to acidic or alkaline stress were neutralized using equimolar amounts of NaOH or HCl. All the collected samples were stored under refrigerated conditions (2–8 °C) until analysis. Prior to injection into the HPLC system, a 0.5 ml sample was diluted to 10 mL with the mobile phase.
Assay of TPB sample
The TPB was assayed using Equation.1
 … (1)
… (1)
Table 1: Experimental conditions for stress-induced degradation of TPB
| Stress condition | Solvent | Temperature (°C) | Sampling time (h) |
Hydrolytic Neutral Acid Base |
H2O 0.1 N HCl 0.5 N HCl 0.1 N NaOH 0.5 N NaOH |
60 ℃ | 0, 1, 2, 3, 6, 24, 48, 72 |
| Oxidizing | 3% H2O2 5% H2O2 |
60 ℃ | 0, 1, 2, 3, 6, 24, 48, 72 |
| Thermal | Methanol | 60 ℃ | 0, 1, 2, 3, 6, 24, 48, 72 |
| Sampling was performed at various time points as shown. HCl: Hydrochloric acid; NaOH: Sodium hydroxide; H₂O₂: Hydrogen peroxide. |
RESULTS AND DISCUSSION
Method development
TPB, a small molecule with UV-absorbing groups, is well-suited for RP-HPLC analysis. A C18 column was selected for optimal hydrophobic interaction and resolution. Various mobile phases, including methanol, acetonitrile, and OPA (pH 3.0–4.0), were tested. Methanol is preferred owing to its low toxicity and low cost. OPA improved the peak symmetry via ion pairing-or pH control [25].
Screening and method optimization using CCD and data analysis
Five variables (aqueous phase, flow rate, temperature, wavelength, and injection volume) were screened using the PBD. Among the variables assessed during the risk analysis, wavelength and injection volume were initially ranked as medium-to-high risk [26]. However, based on Plackett–Burman results and preliminary trials, both were found to cause minimal variation in key responses. Therefore, the wavelength was fixed at 272 nm (λmax) to ensure optimal sensitivity, and the injection volume was set at 10 µl to maintain a balance between the signal strength and peak shape. Half-normal plots and Pareto charts indicated that only the percentage of the aqueous phase and the flow rate significantly affected Rt. In contrast, their influence on NTP and Tf was negligible (fig. S1 to fig. S6). A CCD was employed for method optimization using Design Expert® 13.5.0. Flow rate (X₁) and aqueous phase composition (X₂) were selected as critical method parameters (CMPs), while Rt (Y₁), NTP (Y₂), and Tf (Y₃) were chosen as CAAs. Thirteen experimental runs were performed (table 2) to study the effects of the percentage of the aqueous phase and flow rate on the retention time, theoretical plates, and tailing factor [27, 28].
Table 2: Outcomes of the CCD optimization
| Input variables | Response variables | |||||
| Standard run | Run | % Aqueous phase | Flow rate (ml/min) | Retention time (min) | Number of theoretical plates | Tailing factor |
| 1 | 10 | 40 | 0.8 | 3.049 | 6998.6 | 1.1 |
| 2 | 2 | 60 | 0.8 | 3.708 | 7446.5 | 1.12 |
| 3 | 1 | 40 | 1.2 | 2.049 | 4525.6 | 1.1 |
| 4 | 5 | 60 | 1.2 | 2.473 | 5168.1 | 1 |
| 5 | 6 | 35.8579 | 1 | 2.404 | 5669 | 1.16 |
| 6 | 11 | 64.1421 | 1 | 3.167 | 6393.7 | 1.1 |
| 7 | 8 | 50 | 0.717157 | 3.683 | 7995.8 | 1.1 |
| 8 | 13 | 50 | 1.28284 | 2.08 | 4410 | 1 |
| 9 | 3 | 50 | 1 | 2.622 | 5770 | 1.07 |
| 10 | 9 | 50 | 1 | 2.634 | 5555 | 1.08 |
| 11 | 12 | 50 | 1 | 2.635 | 5700 | 1.08 |
| 12 | 4 | 50 | 1 | 2.635 | 5638 | 1.07 |
| 13 | 7 | 50 | 1 | 2.64 | 5704 | 1.07 |
A quadratic model was applied to evaluate the linear, interactive, and quadratic effects, represented by the following general equation:
 ……. (4)
X₁ and X₂ represent the percentage of aqueous phase and flow rate, respectively. The term X₁X₂ indicates the interaction between these two factors, indicating how they jointly influence the response. The squared terms, X₁² and X₂², reflect the nonlinear effects of methanol composition and flow rate on the chromatographic parameters. Positive coefficients denote a direct relationship, while negative coefficients indicate an inverse relationship. Both CMPs significantly influenced all three CAAs, showing interaction and curvature effects.
 …. (5)
For Y1, the positive coefficient of X₁ indicates that increasing the proportion of the aqueous phase leads to a longer retention time, whereas the negative coefficient of X₂ shows that increasing the flow rate shortens retention time. The negative X₁X₂ interaction term suggests that the combined effect of aqueous phase and flow rate slightly reduces retention time. The positive quadratic terms for both X₁² and X₂² indicate a curvature in the response, implying that extreme values of these factors tend to increase retention time.
 …. (6)
For Y2, the positive coefficient of X₁ indicates that increasing the aqueous phase slightly increases the number of theoretical plates, whereas the large negative coefficient of X₂ shows that higher flow rates considerably reduce column efficiency. The positive X₁X₂ interaction term suggests that using higher levels of both aqueous phase and flow rate together can marginally improve efficiency. The positive quadratic terms for X₁² and X₂² indicate a curved response surface, meaning that both very low and very high values of these factors can enhance the number of theoretical plates.
 …… (7)
For Y3, the negative coefficients of X₁ and X₂ indicate that increasing the aqueous phase or the flow rate slightly decreases the tailing factor, suggesting an improvement in peak symmetry. The negative X₁X₂ interaction term shows that using higher levels of both factors together further reduces tailing. The positive quadratic term for X₁² suggests that very high or very low aqueous phase values can increase tailing, whereas the negative quadratic term for X₂² indicates that extreme flow rate values help reduce tailing.
ANOVA results (table 3) confirmed that the developed models for retention time (Y₁), theoretical plates (Y₂), and asymmetry (Y₃) were statistically significant, with high R², adjusted R², and predicted R² values, and non-significant lack-of-fit tests, indicating excellent model fit. Both aqueous phase and flow rate had strong effects on all three responses; interaction effects were important for Y₁ and Y₃ but negligible for Y₂. Significant quadratic terms indicated curvature in the responses, confirming non-linear relationships. The regression models for Y₁ and Y₂ showed outstanding goodness of fit (R² = 0.9998 and 0.9960, respectively). Response surface plots (fig. 2) and diagnostic plots supported model validity: normal probability plots indicated residual normality, residuals vs. predicted plots showed homoscedasticity, and residuals vs. run order confirmed independence. Predicted vs. actual plots (R²>0.99) demonstrated close agreement, while Box–Cox plots (λ ≈ 1) showed no need for transformation (Supplementary fig. S7–S10). Numerical optimization achieved a desirability of 1 at 48.24% aqueous phase and 1.09 ml/min flow rate; these were adjusted for practicality to 48% aqueous phase and 1.0 ml/min for validation. Under these conditions, the observed Rt (2.36 min), NTP (5125), and Tf (1.06) were within the 95% prediction intervals (Rt = 2.38 min, NTP = 5350, Tf = 1.08), confirming the reliability and robustness of the model (fig. 3).
Table 3: Analysis of variance (ANOVA) for the effects of process parameters on retention time, theoretical plates, and asymmetry
| Response | Source | Sum of squares | df | Mean square | F-value | p-value | |
| Retention time (Response 1) | Model | 3.26 | 5 | 0.6512 | 6637.44 | <0.0001 | significant |
| A-Aqueous Phase | 0.5843 | 1 | 0.5843 | 5955.74 | <0.0001 | ||
| B-Flow rate | 2.53 | 1 | 2.53 | 25823.44 | <0.0001 | ||
| AB | 0.0138 | 1 | 0.0138 | 140.73 | <0.0001 | ||
| A² | 0.0368 | 1 | 0.0368 | 374.89 | <0.0001 | ||
| B² | 0.1014 | 1 | 0.1014 | 1033.22 | <0.0001 | ||
| Residual | 0.0007 | 7 | 0.0001 | ||||
| Lack of Fit | 0.0005 | 3 | 0.0002 | 3.79 | 0.1155 | not significant | |
| Pure Error | 0.0002 | 4 | 0.0000 | ||||
| Cor Total | 3.26 | 12 | |||||
| Theoretical plates (Response 2) | Model | 1.316E+07 | 5 | 2.631E+06 | 346.58 | <0.0001 | significant |
| A-Aqueous Phase | 5.593E+05 | 1 | 5.593E+05 | 73.67 | <0.0001 | ||
| B-Flow rate | 1.206E+07 | 1 | 1.206E+07 | 1588.46 | <0.0001 | ||
| AB | 9467.29 | 1 | 9467.29 | 1.25 | 0.3010 | ||
| A² | 1.745E+05 | 1 | 1.745E+05 | 22.98 | 0.0020 | ||
| B² | 4.147E+05 | 1 | 4.147E+05 | 54.61 | 0.0002 | ||
| Residual | 53146.53 | 7 | 7592.36 | ||||
| Lack of Fit | 26899.33 | 3 | 8966.44 | 1.37 | 0.3732 | not significant | |
| Pure Error | 26247.20 | 4 | 6561.80 | ||||
| Cor Total | 1.321E+07 | 12 | |||||
Tailing factor (Response 3) |
Model | 0.0223 | 5 | 0.0045 | 82.14 | <0.0001 | significant |
| A-Aqueous Phase | 0.0034 | 1 | 0.0034 | 62.53 | <0.0001 | ||
| B-Flow rate | 0.0085 | 1 | 0.0085 | 157.24 | <0.0001 | ||
| AB | 0.0036 | 1 | 0.0036 | 66.26 | <0.0001 | ||
| A² | 0.0045 | 1 | 0.0045 | 83.26 | <0.0001 | ||
| B² | 0.0015 | 1 | 0.0015 | 26.92 | 0.0013 | ||
| Residual | 0.0004 | 7 | 0.0001 | ||||
| Lack of Fit | 0.0003 | 3 | 0.0001 | 2.89 | 0.1657 | not significant | |
| Pure Error | 0.0001 | 4 | 0.0000 | ||||
| Cor Total | 0.0227 | 12 |
A is the aqueous phase %, and B is the flow rate. A² and B² are the squared terms (nonlinear effects), and AB shows the interaction between A and B. p<0.05 means it’s statistically significant. Lack of fit shows whether the model fits the data well. Since all models have a non-significant lack of fit, they are considered reliable.

Fig. 2: 2D contour and 3D response surface plots depicting the effects of the proportion of aqueous phase, flow rate on retention time (a–b), number of theoretical plates (c–d), and asymmetry (e–f)
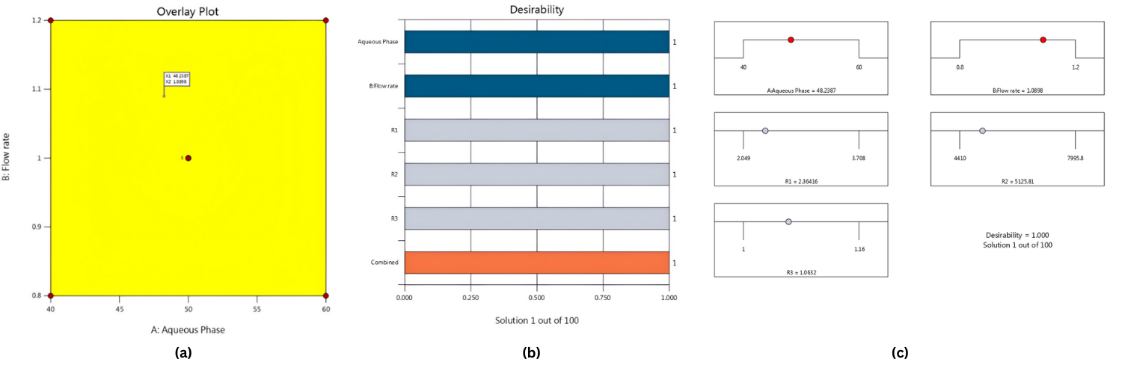
Fig. 3: Overlay plot of the optimized chromatographic solution (a). Desirability profile (b) Ramp solutions showing individual and combined desirability for factors and responses (c)
Forced degradation and kinetic studies
We prepared a 4500 µg/ml stock solution to make the degradation study process smoother and more consistent. Because we needed to carry out multiple stress conditions (such as acid, base, neutral, oxidative, and thermal degradation) at different time points, having a single concentrated stock made it easier to prepare samples uniformly. For each condition and time point, we just took 0.5 mL of this stock, made it up to 10 mL, and subjected it to degradation. Subsequently, we diluted it again to obtain a final concentration of 90 µg/ml for analysis. This strategy ensured consistency, minimized variability due to repeated weighing, and simplified the sample preparation for multiple degradation studies under controlled conditions.
In contrast, a 900 µg/ml stock solution was used for method validation studies, including system suitability, linearity, accuracy, and precision, where lower concentrations were adequate. Thus, the dual-stock strategy balanced the need for both sensitivity for degradation profiling and precision for validation studies. Forced degradation and kinetic studies under ICH-recommended conditions showed a significant reduction in the main peak area, indicating degradation. The peak purity plots are shown in fig. S10 to fig. S16, confirming the spectral purity of the main peak under all the stress conditions. The highest degradation was observed under acidic and alkaline conditions, indicating pH sensitivity. Moderate degradation was observed under moist and oxidative conditions, while minimal degradation was observed under dry conditions (table 4). The degradation followed zero-order kinetics, as supported by the linear plots of concentration versus time under all stress conditions (fig. 4). Kinetic parameters, including the degradation rate constant (k), time required for the drug to degrade by 50% (t₁/₂), and the time needed to retain 90% of the initial potency (t₉₀), were calculated using Equations (8)– (10), respectively [29].
 …… (8)
 ……. (9)
 …. (10)
Where C0 is the initial % (typically, 100%), where K is the rate constant, [C0] is the TPB concentration at time t = 0, and [Ct] is the concentration at time t. (table 3) these findings suggest that the TPB is unstable under extreme pH and humidity conditions. Therefore, formulations should be maintained at near-neutral pH (6–7), stored below 25 °C, and protected from light, moisture, and oxidative stress. Protective strategies include light-resistant containers, inert atmospheres (e. g., nitrogen flushing), and antioxidants.
Table 4: Summary of degradation kinetics
| Stress condition | Best fit model | R² value | t ½ (days) | t 90 (days) | Degraded % | K |
| 0.1 N HCl | Zero-order | 0.999 | 2.634 | 0.527 | 60.07 | 1.898E+01 |
| 0.5 N HCl | Zero-order | 0.993 | 2.310 | 0.462 | 68.33 | 2.164E-01 |
| 0.1 N NaOH | Zero-order | 0.991 | 3.037 | 0.607 | 54.93 | 1.647E-01 |
| 0.5 N NaOH | Zero-order | 0.99 | 2.797 | 0.559 | 56.91 | 1.788E-01 |
| Water | Zero-order | 0.993 | 6.460 | 1.292 | 24.58 | 7.740E-02 |
| 3% H₂O₂ | Zero-order | 0.990 | 3.335 | 0.667 | 36.61 | 1.499E-01 |
| 5% H₂O₂ | Zero-order | 0.990 | 3.119 | 0.624 | 46.81 | 1.603E-01 |
| Moist Heat | Zero-order | 0.992 | 3.796 | 0.759 | 38.90 | 1.317E-01 |
K is the zero-order degradation rate constant (day⁻¹); t1/2 is the half-life; t90is the time required for 10% degradation. R² indicates the goodness of fit. All degradation conditions showed best fit to the zero-order kinetic model. HCl: Hydrochloric acid; NaOH: Sodium hydroxide; H₂O₂: Hydrogen peroxide.
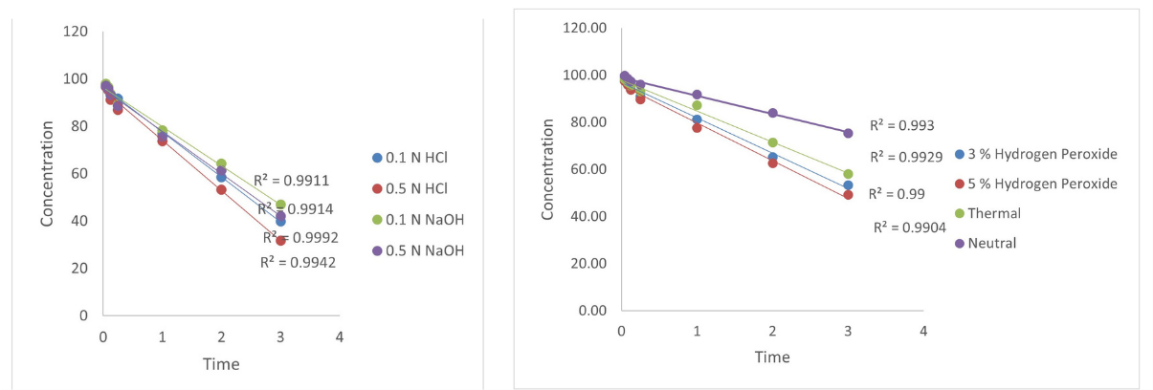
Fig. 4: Zero-order plots showing the degradation of Tepotinib under various stress conditions: acidic (0.1 N and 0.5 N HCl), basic (0.1 N and 0.5 N NaOH), oxidative (3% and 5% hydrogen peroxide), thermal, and neutral conditions
Validation outcomes
The validation outcomes were established in accordance with ICH Q2(R2) and Q14 guidelines [30, 31].
System suitability and specificity
Prior to method validation, system suitability was evaluated and met ICH requirements. The Tf was less than 2, and the NTP was greater than 2000, confirming efficient chromatographic performance. Specificity was demonstrated using a PDA detector with no interference at the Rt of the TPB sample (2.419 min), confirming peak purity and selectivity (fig. 5) The overlaid chromatograms of stressed sample solutions obtained under various degradation conditions are provided in the Supplementary Data (fig. S17).
Precision and accuracy
The results of the intra-and inter-day precision studies showed relative standard deviation (RSD) values below 1%, demonstrating the excellent reproducibility of the method (table 5). Accuracy was evaluated at three spiking levels: 50, 100, and 150% of the nominal concentration. The percent recoveries ranged from 99.67% to 100.18%, with %RSD values less than 2%, indicating high reliability of the method for quantitative analysis (table 5).
Robustness
Deliberately key chromatographic parameters, including flow rate (0.9–1.1 ml/min), column temperature (27–33 °C), and mobile phase composition (57:43 to 47:53, A: B) were varied. Despite these changes, the system suitability parameters, including Rt, NTP, and Tf, remained within the acceptable limits. The %RSD values were consistently<2%. The ability of the method to remain unaffected by minor deliberate variations in the parameters confirms its reliability (table 5).
Linearity and range
The method demonstrated a direct proportional relationship between concentration and peak area, confirming its suitability for quantitative analysis. A calibration curve was constructed over 22.5–157.5 μg/ml, producing a regression equation of y = 31173x+20044 with an r² of 0.9995, indicating excellent linearity across the tested range (fig. 6).

Fig. 5: Chromatogram of tepotinib standard (a) tepotinib sample (b)

Fig. 6: Calibration curve of tepotinib
LOD and LOQ
Based on the standard deviation of the response and slope method, LOD and LOQ were calculated to be 0.38 μg/ml and 1.14 μg/ml, respectively, confirming the sensitivity of the method. The calculated LOQ was further verified by analyzing spiked samples at the LOQ level, demonstrating acceptable precision and accuracy at this concentration (fig. S18).
Table 5: Performance characteristics: precision, accuracy, and robustness
| Method precision and intermediate precision results | |||
| Sample | Method precision (TPB standard peak area) | Intermediate precision (sample) | |
| % purity (Day 1) | % purity (Day 2) | ||
| 1 | 2840220 | 99.4 | 98.3 |
| 2 | 2845810 | 99.6 | 98.4 |
| 3 | 2839379 | 99.3 | 98.0 |
| 4 | 2888760 | 101.1 | 98.3 |
| 5 | 2860800 | 100.1 | 99.3 |
| 6 | 2866081 | 100.3 | 98.8 |
| Mean± SD | 2856842±19093.1 | 99.94±0.67 | 98.52±0.46 |
| %RSD | 0.7 | 0.7 | 0.5 |
| TPB: Tepotinib; %RSD: Relative Standard Deviation; SD: Standard Deviation. Method and intermediate precision were within acceptable limits (%RSD<2%). n=6 | |||
| Accuracy results | |||
| Level | Amount spiked (μg/ml) | Amount recovered (μg/ml) | % Recovery |
| 50% | 45 | 45.2 | 100.36 |
| 50% | 45 | 45.1 | 100.20 |
| 50% | 45 | 44.9 | 99.76 |
| 100% | 90 | 89.2 | 99.16 |
| 100% | 90 | 89.3 | 99.26 |
| 100% | 90 | 90.2 | 100.24 |
| 150% | 135 | 135.5 | 100.35 |
| 150% | 135 | 135.3 | 100.23 |
| 150% | 135 | 134.9 | 99.94 |
| Mean±SD | 99.94±0.49 | ||
| %RSD 0.48 | |||
| n=3 | |||
| Optimised condition | Condition variation | % RSD | Remarks |
| Flow 1.0 ml/min | Flow (-) 0.9 ml/min | 0.2 | %RSD were less than 2% |
| Flow (+) 1.1 ml/min | 0.3 | ||
Mobile phase 52% Methanol: 48 0.1% OPA in water |
Mobile phase (-) 47A: 53B | 0.3 | |
| Mobile phase (+) 57A: 43B | 0.3 | ||
| Temperature | Temp (-) 27 °C | 0.2 | |
| Temp (+) 33 °C | 0.3 | ||
| MeOH: Methanol; OPA: Ortho Phosphoric Acid; %RSD: Relative Standard Deviation. All %RSD values were<2%, indicating robustness of the method to small deliberate variations. | |||
Several RP-HPLC methods have been reported for estimating tepotinib in bulk and pharmaceutical dosage forms. However, these methods rely on conventional method development approaches and do not incorporate Quality by Design (QbD) strategies [12-18]. Additionally, the use of buffer-containing mobile phases, such as potassium dihydrogen orthophosphate, orthophosphoric acid, or trifluoroacetic acid, can complicate analysis because of issues such as buffer precipitation, reduced column life, and limited compatibility with detectors [12-16]. Moreover, acetonitrile is commonly used as an organic modifier, which is relatively more expensive and less environmentally friendly than methanol.
In contrast, the present study reports the first QbD-based RP-HPLC method for tepotinib, offering a simplified and robust approach by replacing acetonitrile with methanol and eliminating buffers. This approach not only reduces the cost and toxic waste but also enhances the environmental compatibility of the method. This method provides a short retention time of 2.416 min, high precision (RSD 0.5%), good recovery (99.95%), and excellent sensitivity (LOD 0.38 µg/ml, LOQ 1.14 µg/ml). Importantly, no previous methods have reported the degradation kinetics of tepotinib, making this study the first to explore and quantify the degradation behavior under different stress conditions. Furthermore, the greenness of the method was assessed using appropriate analytical eco-assessment tools, highlighting its suitability for sustainable analytical practice along with its high performance.
Green analytical metric tools assessment
Implementing green chemistry in analytical methods poses challenges such as balancing sustainability with performance, reliance on traditional solvents, the need for re-validation, high costs, lack of standardized greenness metrics, resistance to change, limited green alternatives, and inadequate training, which further hinder adoption [32]. The greenness of the developed RP-HPLC method was evaluated using six tools: ComplexMoGAPI, AGREE, AES, AMGS, BAGI, and EVG, which assess factors such as toxicity, energy and solvent use, waste, performance, and robustness for comprehensive environmental analysis.
Complex modified green analytical procedure index
The ComplexMoGAPI is an enhanced version of the original GAPI tool designed to evaluate analytical methods based on a broader spectrum of environmental and performance-related criteria [33]. It can be accessed at https://fotouhmansour.github.io/ComplexMoGAPI/. The assessment covered 1. Sample preparation, method, extraction scale, sample amount, and handling (collection, preservation, transport, and storage). 2. Reagents and solvent types, quantities, hazards, and additional treatments such as cleanup, derivatization, mineralization and solvent removal 3. Instrumentation assesses energy use, safety, and occupational hazards during quantification. 4. Waste generation considers the volume, nature, and treatment of the waste. 5. Energy consumption accounts for power usage through instruments and methods, thereby ensuring an overall sustainability evaluation. Each domain was visually represented by a pentagram, with color codes indicating the level of environmental impact: green for low, yellow for moderate, and red for high. In contrast to GAPI, ComplexMoGAPI incorporates numerical scoring to minimize subjectivity and provides a more refined visual layout, enabling direct comparison between methods. The assessment of the developed RP-HPLC method using ComplexMoGAPI is illustrated in fig. 7a, and the detailed domain-wise scores are provided in table S3. These results highlight environmentally significant areas and can guide potential improvements.
Analytical greenness metric approach
The AGREE tool is a downloadable software-based metric available at https://mostwiedzy.pl/AGREE. It quantitatively evaluates an analytical method based on in-situ analysis, solvent safety, energy efficiency, waste minimization, and the use of renewable resources. The tool generates a circular pictogram divided into 12 colored segments. Each segment is color-coded according to the degree of compliance, and an overall greenness score is assigned on a scale from 0 (non-green) to 1 (ideal green method) [34]. The developed method achieved an AGREE score of 0.65, (fig. 7b) (table S4), indicating good environmental sustainability with room for further improvement by replacing methanol (a GHS Category 3 solvent) with greener alternatives such as ethanol and by adopting instrument modifications such as shorter columns or lower flow rates to reduce solvent consumption and energy usage.
Analytical eco scale
AES is a semi-quantitative tool that evaluates the greenness of analytical methods using a 100-point scoring system. The assessment starts with a base score of 100, from which penalty points are deducted for factors such as the use of hazardous solvents (e. g., acetonitrile), large volumes of reagents, high energy consumption, and unsafe waste management practices Scores>75 indicate excellent green methods, scores between 50 and 75 are acceptable, and scores<50 require substantial environmental optimization [35]. The RP-HPLC method scored 77, indicating that it was environmentally friendly. The Eco-Scale evaluation, along with detailed penalty point deductions, is summarized in table S5, offering a comprehensive view of the methods ecological footprint.
Blue applicability grade index
BAGI is a unique tool that complements other green metrics such as AGREE and GAPI. This tool is available at (https://bagi-index.anvil.app). BAGI evaluates the practicality of analytical methods by considering factors such as time efficiency, cost-effectiveness, and ease of use. In BAGI, the 'blue' attributes specifically reflect cost-efficiency, time efficiency, simplicity, and overall user-friendliness. The methods were assigned BAGI scores ranging from 25 to 100, with higher scores indicating higher practicality. Additionally, BAGI employs a pictogram to visually illustrate the 'blueness' profile, providing an intuitive representation of a method’s practical performance [36]. The BAGI pictogram is shown in fig. 7c, and table S6 provides a detailed representation of the scoring outcomes, enabling the identification of potential areas for refinement.
Analytical method greenness score
AMGS is a freely available online tool that evaluates how green an analytical method is, looking beyond solvent waste [37]. It divides the environmental impact into three key areas: instrument energy, solvent production energy, and solvent health and safety risks. As shown in table S7, the developed RP-HPLC method (Method Number: 2025-06-06-17:54:40.887) was assessed for electricity use during analysis, environmental burden of solvent production, solvent toxicity and disposal, operating conditions, sample preparation, and overall technique. The instrument energy score from the AMGS tool was calculated to be 111.63, making up approximately 77% of the total greenness score. At first glance, this may seem high, but it is a result of the method being quite efficient in other areas, such as using less solvent, having a short run time, and generating minimal waste. Because the solvent energy (6.89) and solvent EHS score (26.74) were relatively low, the instrument energy naturally constituted the most significant portion. The AMGS calculation also includes factors such as idle time, column oven use, and detector type (in our case, PDA), all of which contribute to the energy score. Overall, the AMGS results show that this RP-HPLC method is not only reliable and efficient but also demonstrates a good level of environmental friendliness.
Efficient, valid, green framework
The EVG framework [38] offers a holistic view of the integration of efficiency, validation, and greenness. For efficiency, the implementation of DOE for screening/optimisation [39, 40], the number of CQAs, the number of CMPs, the time for analyzing one sample (cost), and the number of compounds analyzed per experiment were tested. Validation included type of validation, precision, accuracy (SE), quantitation limit, and robustness (number of factor variations). The greenness assessment covered the number of greenness tools used, sample treatment, reagents and solvents (number of GHS pictograms), instrumentation, energy consumption, and waste. The EVG radar chart (fig. 7d) demonstrates a well-balanced profile, supporting the suitability of this method for routine use in a sustainable analytical context. The full scoring matrix is shown in table S8.

Fig. 7: Evaluation of the proposed HPLC method greenness using a ComplexMoGAPI pictogram b AGREE pictogram score c BAGI pictogram, d EVG radar chart
CONCLUSION
A robust QbD-based green RP-HPLC method was successfully developed and validated for quantitative estimation of TPB. The design of experiments facilitated the systematic optimization of critical parameters, ensuring precision, accuracy, and specificity as per ICH guidelines. A comprehensive greenness assessment using the ComplexMoGAPI, AGREE, Analytical Eco-Scale, BAGI, and EVG tools demonstrated good environmental performance, with room for further improvement. This method offers a reliable, sustainable, and regulatory-compliant solution for the analysis of TPB in pharmaceutical formulations. In future work, greener alternatives such as ethanol could be explored for use in mobile phases. In addition, switching to shorter columns, micro-flow systems, or low-energy HPLC platforms can further reduce the solvent usage and power consumption.
AUTHORS CONTRIBUTIONS
Syamala P. N. S. conceptualized and designed the study, carried out the experiments, including method development, degradation kinetics, and greenness assessment, analyzed the data, and drafted the manuscript. Sreedevi Adikay provided supervision and expert guidance throughout the study and critically reviewed and revised the manuscript. Both authors have read and approved the final version of the manuscript.
FUNDING
Nil
CONFLICT OF INTERESTS
Declared none
REFERENCES
World Health Organization. Global Cancer Burden Growing Amidst Mounting Need for Services; 2024. Available from: https://www.who.int/news/item/01-02-2024-global-cancer-burden-growing-amidst-mounting-need-for-services.
Bray F, Laversanne M, Sung H, Ferlay J, Siegel RL, Soerjomataram I. Global cancer statistics 2022: GLOBOCAN estimates of incidence and mortality worldwide for 36 cancers in 185 countries. CA Cancer J Clin. 2024 Apr 4;74(3):229-63. doi: 10.3322/caac.21834, PMID 38572751.
Markham A. Tepotinib: first approval. Drugs. 2020 May 2;80(8):829-33. doi: 10.1007/s40265-020-01317-9, PMID 32361823.
Le X, Sakai H, Felip E, Veillon R, Garassino MC, Raskin J. Tepotinib efficacy and safety in patients with MET exon 14 skipping NSCLC: outcomes in patient subgroups from the VISION study with relevance for clinical practice. Clin Cancer Res. 2022;28(6):1117-26. doi: 10.1158/1078-0432.CCR-21-2733, PMID 34789481.
FDA Grants Accelerated Approval to Tepotinib for Metastatic Non-Small Cell Lung Cancer. FDA; 2021 Jun 11. Available from: https://www.fda.gov/drugs/resources-information-approved-drugs/fdagrants-accelerated-approval-tepotinib-metastatic-non-small-cell-lung-cancer.
Tepotinib. Drug Bank. Available from: https://go.drugbank.com.drugs/DB15133. [Last accessed on 17 Sep 2025].
Tepotinib. Pubchem, National Center for Biotechnology Information; 2025 Sep 17. Available from: https://pubchem.ncbi.nlm.nih.gov/compound/Tepotinib. [Last accessed on 17 Sep 2025].
Peraman R, Bhadraya K, Padmanabha Reddy Y. Analytical quality by design: a tool for regulatory flexibility and robust analytics. Int J Anal Chem. 2015;2015:868727. doi: 10.1155/2015/868727, PMID 25722723.
Meher AK, Zarouri A. Green analytical chemistry: recent innovations. Analytica. 2025 Mar 11;6(1):10. doi: 10.3390/analytica6010010.
Krishna MV, Dash RN, Jalachandra Reddy B, Venugopal P, Sandeep P, Madhavi G. Quality by design (QbD) approach to develop HPLC method for eberconazole nitrate: application oxidative and photolytic degradation kinetics. J Saudi Chem Soc. 2016 Sep;20:S313-22. doi: 10.1016/j.jscs.2012.12.001.
Bhangare D, Rajput N, Jadav T, Sahu AK, Tekade RK, Sengupta P. Systematic strategies for degradation kinetic study of pharmaceuticals: an issue of utmost importance concerning current stability analysis practices. J Anal Sci Technol. 2022 Mar 16;13(1):7. doi: 10.1186/s40543-022-00317-6.
Chepyala S, Medidi S, Malik JK. Development of a validated RP-HPLC/PDA method for the quantitative estimation of tepotinib in tablet dosage form. J Appl Pharm Sci. 2025;15(1):64-71. doi: 10.7324/JAPS.2024.184366.
Kumbhar ST, Kokare PS, Digge PB. Development of novel RP-HPLC method for estimating tepotinib in bulk and pharmaceutical dosage form. Int J Pharm Qual Assur. 2023 Dec 25;14(4):1188-93. doi: 10.25258/ijpqa.14.4.56.
Banoth RK, Nalluri P, Addanki S, Indireddy T, Soundarajan J. A novel stability-indicating RP-HPLC analytical method development and validation for the determination of tepotinib in bulk and pharmaceutical dosage form. Res J Pharm Technol. 2025 Feb 1;18(2):557-62. doi: 10.52711/0974-360X.2025.00083.
Mastanamma S. RP-HPLC method development and validation for the estimation of tepotinib in presence of its impurities in a tablet dosage form. Int J Pharm Sci Res. 2024 May 1;15(5):1506-16. doi: 10.13040/IJPSR.0975-8232.15(5).1506-16.
Begum H, Arsalan M, Jabeen M. Development and validation of liquid chromatography method for determination of tepotinib in bulk drug and in tablet dosage form. Int J Pharm Sci Rev Res. 2023 Jun;80(2). doi: 10.47583/ijpsrr.2023.v80i02.019.
Shirawar MM. Development and validation of stability indicating RP-HPLC method for the estimation of tepotinib in bulk and formulation. Eur Chem Bull. 2023;12(10):10877-91.
Vijaya SK, Nikhil J, Parthiban C, Sudhakar M. Method development and validation for the estimation of tepotinib in pharmaceutical dosage forms by RP-HPLC. Int J Pharm Pharm Res. 2022;26(1):468-77.
Tome T, Zigart N, Casar Z, Obreza A. Development and optimization of liquid chromatography analytical methods by using AQbD principles: overview and recent advances. Org Process Res Dev. 2019 Aug 14;23(9):1784-802. doi: 10.1021/acs.oprd.9b00238.
Tapre DN, Borikar SP, Jain SP, Walde SR, Tapadiya GG, Gurumukhi VC. Development and evaluation of novel famotidine-loaded fast-dissolving sublingual film using the quality-by-design approach. J Drug Deliv Sci Technol. 2023 Aug 1;85:104581. doi: 10.1016/j.jddst.2023.104581.
Aggarapu S, Galla R, Shaik NJ, Dasari SJ. Application of placket Burman and Box–Behnken designs to develop a sensitive and robust HPLC method for quantifying hypolipidemic drugs rosuvastatin and bempedoic acid in tablets. Future J Pharm Sci. 2025 May 26;11(1):1-13. doi: 10.1186/s43094-025-00814-6.
Salva C, Galla R. Correction: the novel quality by design concept in the development and validation of a stability indicating RP-HPLC PDA method for estimating terlipressin in an injectable dosage form. Chromatographia. 2024 Aug 2;87(9):617. doi: 10.1007/s10337-024-04354-8.
Narikimalli A, Galla R. AQbD-based approach for UPLC procedure development for the concurrent quantification of metformin vildagliptin Dapagliflozin and sitagliptin in bulk and tablets: response surface methodology paradigm. Anal Chem Lett. 2024 Jul 3;14(4):528-48. doi: 10.1080/22297928.2024.2376118.
Marothu VK, Dash RN, Vemula S, Donkena S, Devi R, Gorrepati M. Kinetics study of metaxalone degradation under hydrolytic oxidative and thermal stress conditions using stability indicating HPLC method. J Pharm Anal. 2012 Dec;2(6):431-6. doi: 10.1016/j.jpha.2012.08.004, PMID 29403778.
Moldoveanu SC, David V. Solvents buffers and additives used in the mobile phase. In: Selection of the HPLC method in chemical analysis. Amsterdam: Elsevier; 2017. p. 393-450. doi: 10.1016/B978-0-12-803684-6.00013-5.
Youssef YM, Mahrouse MA, Mostafa EA. Plackett-Burman and face-centered composite designs for development and optimization of chromatographic method for the simultaneous determination of glycopyrronium indacaterol and mometasone in their fixed dose combination inhaler green profile assessment. J Pharm Biomed Anal. 2023;234:115553. doi: 10.1016/j.jpba.2023.115553, PMID 37399700.
Tambare RS, Shahi SR, Gurumukhi VC, Kakade SM, Tapadiya GG. Quality by design (QbD) based development and validation of RP-HPLC method for buserelin acetate in polymeric nanoparticles: release study. Heliyon. 2024 Oct;10(20):e39172. doi: 10.1016/j.heliyon.2024.e39172, PMID 39640699.
Tapre DN, Borikar SP, Jain SP, Walde SR, Tapadiya GG, Gurumukhi VC. Development and evaluation of novel famotidine-loaded fast-dissolving sublingual film using the quality-by-design approach. J Drug Deliv Sci Technol. 2023 Aug 1;85:104581. doi: 10.1016/j.jddst.2023.104581.
Oliveira MA, Yoshida MI, Belinelo VJ, Valotto RS. Degradation kinetics of atorvastatin under stress conditions and chemical analysis by HPLC. Molecules. 2013 Jan 24;18(2):1447-56. doi: 10.3390/molecules18021447, PMID 23348997.
Validation of analytical procedures: text and methodology International Conference on Harmonisation (ICH). Geneva: ICH. 2023;Q2:R2.
Analytical Procedure Development International Conference on Harmonisation (ICH). Geneva: ICH. 2023:Q14.
Saleh SS, Obaydo RH, El Hamd MA, Rostom Y, Mohamed D, Lotfy HM. Guidelines for accurate application of green and white analytical concepts: merits versus demerits with insights of significant milestones of assessment tools applied for antiviral drugs. Microchem J. 2024 Apr 1;199:109917. doi: 10.1016/j.microc.2024.109917.
Mansour FR, Omer KM, Plotka Wasylka J. A total scoring system and software for complex modified GAPI (ComplexMoGAPI) application in the assessment of method greenness. Green Anal Chem. 2024 Jun 27;10:100126. doi: 10.1016/j.greeac.2024.100126.
Pena Pereira F, Wojnowski W, Tobiszewski M. AGREE-analytical greenness metric approach and software. Anal Chem. 2020 Jun 15;92(14):10076-82. doi: 10.1021/acs.analchem.0c01887, PMID 32538619.
Galuszka A, Migaszewski ZM, Konieczka P, Namiesnik J. Analytical eco-scale for assessing the greenness of analytical procedures. TrAC Trends Anal Chem. 2012 Jul;37:61-72. doi: 10.1016/j.trac.2012.03.013.
Manousi N, Wojnowski W, Plotka Wasylka J, Samanidou V. Blue applicability grade index (BAGI) and software: a new tool for the evaluation of method practicality. Green Chem. 2023 Jan 1;25(19):7598-604. doi: 10.1039/D3GC02347H.
Hicks MB, Farrell W, Aurigemma C, Lehmann L, Weisel L, Nadeau K. Making the move towards modernized greener separations: introduction of the analytical method greenness score (AMGS) calculator. Green Chem. 2019;21(7):1816-26. doi: 10.1039/C8GC03875A.
Vanga MG, Bukke SP, Kusuma PK, Narapureddy BR, Thalluri C. Integrating green analytical chemistry and analytical quality by design: an innovative approach for RP-UPLC method development of ensifentrine in bulk and inhalation formulations. BMC Chem. 2025 Mar 15;19(1):70. doi: 10.1186/s13065-025-01448-8, PMID 40089734.
Ahmad SU, Khabiya PR, Au TA, Raheman Bakhshi AR. Quality by design approach to develop stability stability-indicating reversed-phase high-performance liquid chromatography method development for ambroxol. Asian J Pharm Clin Res. 2021 Dec;14(12):44-9. doi: 10.22159/ajpcr.2021.v14i12.42939.
Srujani Ch, Annapurna P, Nataraj KS, Pawar KM. Analytical quality by design approach in RP-HPLC method development and validation for the estimation of duvelisib. Asian J Pharm Clin Res. 2021 Feb 7;14(2):99-108. doi: 10.22159/ajpcr.2021.v14i2.40181.