
Int J App Pharm, Vol 18, Issue 1, 2026, 558-567Original Article
STABILITY INDICATING AN LC-ESI-MS/MS METHOD FOR THE QUANTIFICATION OF MINOXIDIL IN PHARMACEUTICAL DOSAGE FORMS
PRIYANKA VALLABH DEULKAR, MUKTHINUTHALAPATI MATHRUSRI ANNAPURNA*
GITAM School of Pharmacy, GITAM (Deemed to be University), India
*Corresponding author: Mukthinuthalapati Mathrusri Annapurna; *Email: mmukthin@gitam.edu
Received: 18 Jul 2025, Revised and Accepted: 30 Oct 2025
ABSTRACT
Objective: The aim of the present study was to develop and validate a novel stability-indicating LC-ESI-MS/MS method for the quantification of Minoxidil in pharmaceutical dosage forms, ensuring specificity, accuracy, and robustness as per ICH guidelines.
Methods: A stability-indicating method was established using an AB SCIEX LC-ESI-MS/MS Triple Quad 5500+QTRAP system equipped with an Agilent ZORBAX C18 column (150 mm × 4.6 mm, 3 µm). The mobile phase consisted of 5 mmol ammonium formate, methanol, and 0.01% acetic acid in the ratio 28.9:71:0.1 (v/v/v) with isocratic elution at a flow rate of 1.2 ml/min. The detection was performed at 230 nm. The method was validated for linearity (2–150 µg/ml), precision, accuracy, limit of detection (LOD), limit of quantification (LOQ), and stress degradation studies under acidic, basic, thermal, and oxidative conditions.
Results: Minoxidil showed good linearity with an R² value of 0.9999. The LOD and LOQ were found to be 0.0621 µg/ml and 0.1853 µg/ml, respectively. The percentage RSD for intra-day and inter-day precision was below 2%, confirming the method’s precision. Accuracy studies showed recovery between 99.25%–99.81%. Stress degradation studies indicated Minoxidil undergoes degradation under acidic, basic, and oxidative conditions but is stable under thermal conditions. The method was successfully applied for the assay of marketed Minoxidil tablet and topical solution formulations with recoveries in the range of 98.64%–99.58%.
Conclusion: The developed LC-ESI-MS/MS method is simple, fast, precise, accurate, and stability-indicating. It is suitable for routine quantitative analysis of Minoxidil in various pharmaceutical dosage forms without interference from excipients or degradants.
Keywords: Minoxidil, LC-ESI-MS/MS, Stability-indicating method, Method validation, Stress degradation
© 2026 The Authors. Published by Innovare Academic Sciences Pvt Ltd. This is an open access article under the CC BY license (https://creativecommons.org/licenses/by/4.0/)
DOI: https://dx.doi.org/10.22159/ijap.2026v18i1.56151 Journal homepage: https://innovareacademics.in/journals/index.php/ijap
INTRODUCTION
Minoxidil (fig. 1) is chemically 6-piperidin-1-ylpyrimidine-2, 4-diamine 3-oxide. It acts directly as a peripheral vasodilator andused to lower high systolic and diastolic blood pressure. It can also be used as a topical application to treat androgenetic alopecia [1]. The molecular formula of Minoxidil is C9H15N5Owith molecular weight 209.2483 g/mol. It is It acts by causing vascular smooth muscle cells adenosine triphosphate-sensitive potassium channels to open and through the activation of extracellular signal-regulated kinase and the prevention of cell death. Minoxidil is believed to enhance the life of human follicle dermal papillary cells or hair cells.
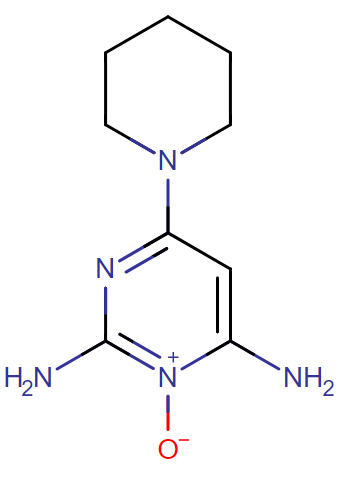
Fig. 1: Chemical structure of minoxidil
Analytical methods such as spectrophotometry [2-4], mass spectroscopy and liquid chromatography were developed for the determination of Minoxidil in pharmaceutical dosage forms and biological fluids.
Poorna Basuri et al., developed UHPLC-MS/MS method [5] for the estimation of Minoxidil in human plasma using acetonitrile: 0.1% formic acid in water (60:40) as mobile phase using Minoxidil D10 as internal standard and the linearity was found to be 0.00128-0.151075 µg/ml.
Zarghi et al., have developed an ion-pair HPLC method [6] for the determination of Minoxidil in human plasma using 0.01M sodium dihydrogen phosphate buffer: acetonitrile (60:40) containing 2.5 mmol sodium dodecyl sulphate adjusted to pH 3.5 as mobile phase (Detection wavelength 281 nm) and the linearity was found to be 0.002-0.1 µg/ml.
Mio et al., have developed a HPLC method [7] for the simultaneous determination of Minoxidil (Detection wavelength 240 nm) and Minoxidilsulfate (Detection wavelength 245 nm) using 0.1M formic acid (pH 2.0): methanol (65:35) as mobile phase and the linearity was found to be 1.0-100 µg/ml.
Hemant et al., have developed a HPLC method for the estimation of Minoxidil and related substance in topical formulation (Detection wavelength 282 nm) using a mixture of 2.0 ml of diethyl amine and 40 ml of glacial acetic acid in1000 ml of milli Q water as an aqueous solvent and 20%THF in methanolasan organic solvent and the linearity was found to be for 0.02-1.0 for related substances and 0.02 – 400 µg/ml for Minoxidil.
Lai-Hao and Pei-Tung developed a liquid chromatographic method [8, 9] using an electrochemical detector for the determination of Minoxidil in hair-growth pharmaceuticals using methanol: water (10:90; 20:80; 30:70; 40:60) that contained 1.0 mmol of potassium dihydrogen phosphate (pH 2.82) as mobile phase (Detection wavelength 288 nm) and the linearity was found to be 0.02-2.6 µg/ml.
In the present study the authors have proposed a new stability indicating LC-ESI-MS/MS method for the estimation of Minoxidil and the method was validated as per ICH guidelines [10].
MATERIALS AND METHODS
Materials
Minoxidil API was obtained as gift sample from Intas Pharmaceuticals (India). It is available as 5% topical solution as well as tablets with different brand names in India. A mixture of 5 mmol Ammonium formate: Methanol: 0.01% Acetic acid (28.9: 71: 0.1) was used as mobile phase. Minoxidil stock solution was prepared by dissolving 25 mg of Minoxidil in 25 ml volumetric flask with methanol (1000µg/ml) and dilutions were made with the mobile phase as per the requirement.
Instrumentation
AB SCIEX Instruments Linear Ion Trap Quadrupole LC-MS/MS Mass Spectrometer (Model no. 5068379-Y) QTRAP Enabled Triple Quad 5500+with Exion LC Binary Gradient AD Pump, Autosampler AD Autosampler, Column Oven AC Column Oven and Agilent column PDA detector was employed for the present study. Agilent ZORBOX C18 (150 mm x 4.6 mm x 3 µm) column was employed and the injection volume was 20 µl** and the total run time was 10 min (Detection wavelength 230 nm). A mixture of 5 mmol Ammonium formate: Methanol: 0.01% Acetic acid (28.9: 71: 0.1) was used as mobile phase.
MS conditions
The AB SCIEX Instruments Triple Quad 5500+QTRAP (Model 5068379-Y) was operated in positive ESI ionization mode using an Information Dependent Acquisition (IDA) method. The instrument parameters were optimized as follows: the curtain gas was set at 50, with high collision gas (CAD) applied. The Ion Spray Voltage (IS) was maintained at 5500 V, and the source temperature was set at 650 °C. Ion Source Gas 1 (GS1), which acts as the heater gas, was set at 60, while Ion Source Gas 2 (GS2), functioning as the nebulizer gas, was maintained at 65. The Declustering Potential (DP) was adjusted to 80, with an Entrance Potential (EP) of 10. The Collision Energy (CE) was set to 35 V with a Collision Energy Spread (CES) of 5 to ensure effective fragmentation and sensitivity during the analysis.
Preparation of stock solution
25 mg of Minoxidil API was accurately weighed and carefully transferred into a 25 ml volumetric flask and was dissolved in HPLC grade Methanol(1000 µg/ml) and this stock solution was sonicated for 30 min and then diluted with the mobile phase as per the requirement.
Preparation of sample solution
Tablets were finely powdered and a portion equivalent to 25 mg active pharmaceutical ingredient was weighed into a 25 ml volumetric flask and was dissolved in HPLC grade Methanol(1000 µg/ml) and this stock solution was sonicated for 30 min. Resulting solution was filtered through 0.45µ filter and from the filtrate, required working standards were prepared.
Method validation
2.0-150 µg/ml Minoxidil solutions were prepared from the stock solution (1000 µg/ml) on dilution with the mobile phase consisting of a mixture of 5 mmol Ammonium formate: Methanol: 0.01% Acetic acid (28.9: 71: 0.1) was used as mobile phase and each solution was injected (n=3) into the system and the average peak area from the respective chromatograms was calculated. A calibration graph was drawn by plotting the concentration of the drug solutions on the x-axis and the corresponding peak area of the chromatograms on the y-axis. The intraday precision studies were conducted on the same day at different equal time intervals and the inter-day precision studies were conducted on three successive days (Day 1, Day 2 and Day 3) and the % RSD was calculated. Accuracy studies were performed by spiking the formulation solution with 50%, 100% and 150% API solution and thereby the percentage recovery was calculated with the help of regression equation. The percentage relative standard deviation was calculated in all the validation parameters [10].
Assay of minoxidil tablets and topical solution
Minoxidil is available as tablets with brand names Morr FLonitab (Label claim: 2.5 mg) (Intas Pharmaceuticals Ltd), Minoxihead (Label claim: 2.5 mg) (Asher Pharmaceuticals), Minoxitop (Label claim: 2.5, 5.0, 10 mg) (Healing Pharma), Minoxiheart 5 (Label claim: 5.0 mg) (STERFS Healthcare Pvt. Ltd.), MorrF (Label claim: 10% Topical solution) (Intas Pharmaceuticals Ltd), Novaxdil (Label claim: 5 % Topical solution) (Novalab Health Care Pvt. Ltd) etc.
Minoxidil topical solution was extracted with methanol, sonicated and diluted as per the requirement (10µg/ml) and the percentage recovery was calculated as per the regression equations obtained.
Two different brands of Minoxidil tablets were also collected, powdered and powder equivalent to 25 mg of Monoxidil was extracted with methanol after sonication, filtered and then diluted with the mobile phase as per the requirement. The resulting solution was filtered through 0.24 μm membrane filter and each of these formulation solutions were injected in to the system. The peak area of the chromatogram (n =3) was noted and the percentage purity was calculated from the linear regression equation.
Stress degradation studies
During the acidic degradation study Minoxidil solution was heated with 0.1N HCl at 60 °C for about 30 min in a thermostat and neutralized with 0.1N NaOH solution. The contents were diluted with mobile phase and the resultant solution was injected into LC-MS/MS system and the peak area of Minoxidil was noted from the respective chromatogram and the mass spectrum was recorded [11].
During the acidic degradation study Minoxidil solution was heated with 0.1N NaOH at 60 °C for about 30 min in a thermostat and neutralized with 0.1N HCl solution. The contents were diluted with mobile phase and the resultant solution was injected into LC-MS/MS system and the peak area of Minoxidil was noted from the respective chromatogram and the mass spectrum was recorded.
During the thermal degradation study Minoxidil solution was heated at 60 °C for about 30 min in a thermostat and the contents were diluted with mobile phase and the resultant solution was injected into LC-MS/MS system and the peak area of Minoxidil was noted from the respective chromatogram and the mass spectrum was recorded.
During the oxidative degradation study Minoxidil solution was heated with hydrogen peroxide at 60ºC for about 30 min in a thermostat and then diluted with mobile phase and the resultant solution was injected into LC-MS/MS system and the peak area of Minoxidil was noted from the respective chromatogram and the mass spectrum was recorded.
RESULTS AND DISCUSSION
A new stability-indicating LC-ESI-MS/MS method has been proposed for the estimation of Minoxidil in pharmaceutical formulations using AB SCIEX Instruments LC-ESI-MS/MS (Model no. 5068379-Y) QTRAP Enabled Triple Quad 5500+with Agilent Zorbox C18 (150 mm x 4.6 mm x 3 µm) column and PDA detector. The total run time was 10 min and the detection wavelength was 230 nm. A mixture of 5 mmol Ammonium formate. Methanol: 0.01% Acetic acid (28.9: 71: 0.1) was used as mobile phase on isocratic mode with 1.2 ml/min as flow rate. A brief review of the reported methods was summarized and some of the parameters were compared with the present proposed method and the details were given in table 1. The optimized MRM transitions were 210.15/161.9 at CE of 30 V.
Table 1: Literature survey
| Method | Mobile phase (v/v) | λ (nm) | Linearity (µg/ml) | Reference |
UHPLC-MS/MS (Human plasma) |
Acetonitrile: 0.1% Formic acid (60:40) Minoxidil D10 (Internal standard) |
- | 0.0013-0.1511 | 5 |
Ion-pair HPLC (Human plasma) |
0.01M Phosphate buffer: Acetonitrile (60:40) 2.5 mmol sodium dodecyl sulphate (pH adjusted to 3.5) | 281 | 0.002-0.1 | 6 |
| HPLC | 0.1 M Formic acid (pH 2.0): Methanol (65: 35) | 240 | 1-100 | 7 |
| HPLC (Related substances) | Diethyl amine: Glacial acetic acid (Buffer): 20%THF in Methanol | 282 | 0.02-400 | 8 |
| HPLC | Methanol: Water with 1.0 mmol potassium dihydrogen phosphate (pH 2.82) | 288 | 0.02-2.6 | 9 |
| LC-ESI-MS/MS | 5 mmol Ammonium formate: Methanol: Glacial acetic acid (28.9: 71: 0.1) | 230 | 2-150 | Present method |
Minoxidil was eluted at Rt 2.07 min with theoretical plates more than 2000 and tailing factor less than 1.5 and the corresponding chromatograms of blank, Minoxidil API and the mass spectrum of Minoxidil with the optimized chromatographic conditions were fig. 2.
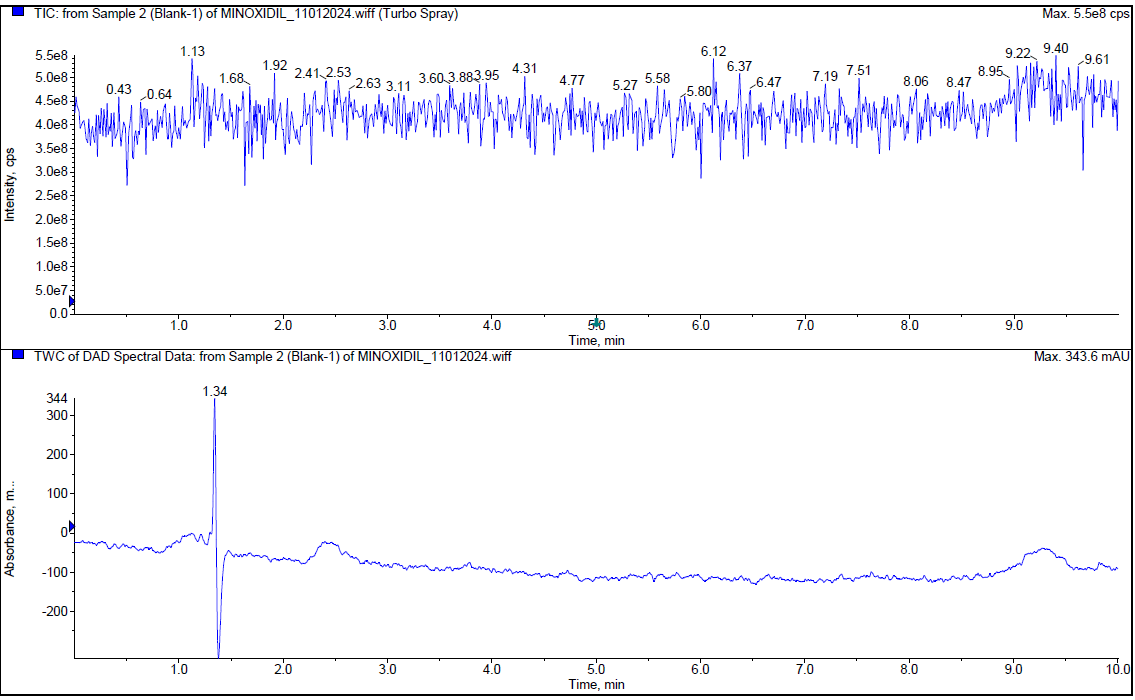 |
| Blank |
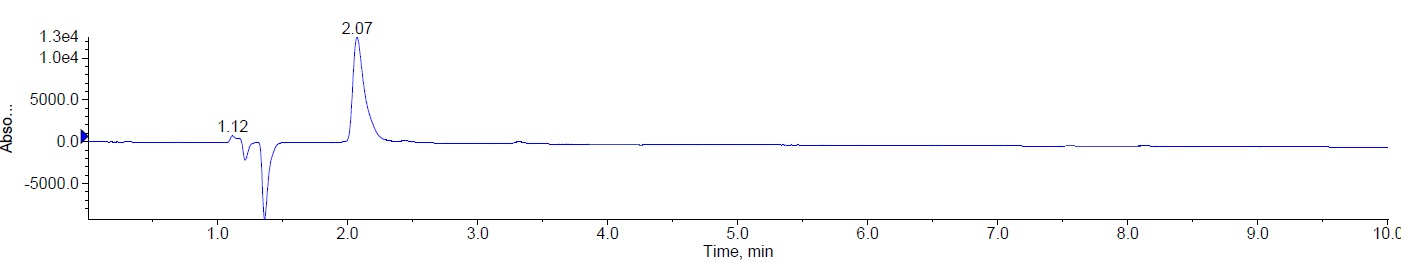 |
| Chromatogram of minoxidil (API) (10 µg/ml); Rt 2.07 min |
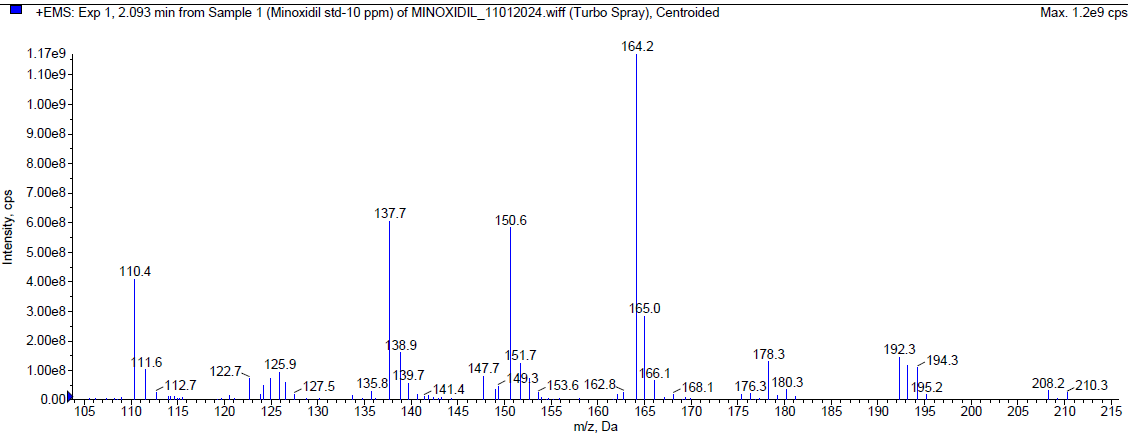 |
| Mass spectrum of minoxidil (MH+: m/z 210.30) |
| Fig. 2: Typical chromatograms and mass spectra of blank andminoxidil (API) |
Linearity, Precision, accuracy and robustness
Minoxidil obeys Beer-Lambert’s law over the concentration range 2.0-150 µg/ml (table 2) and the linear regression equation was found to be y = 1770.3x+412.71(R² = 0.9999) (fig. 3). The LOD and LOQ were found to be 0.0621 μg/ml and 0.1853 μg/ml respectively [12-15].
The % RSD in intraday precision (0.7649), interday precision (0.1219-1.6615) (table 3) was found to be less than 2.0% stating that the method is precise. In the accuracy study the % RSD was found to be 0.47-0.92 (<2) (table 4) with a recovery of 99.25-99.81 indicating that the method is accurate [16-19]. The method is evaluated with changes in critical parameters such as flow rate (±0.1 ml/min), and mobile phase organic phase (±0.2 ml) to demonstrate its reliability and consistency. Under these analytical conditions the method was within the limits.
Table 2: Linearity
| Conc. (µg/ml) | *Mean peak area |
| 2 | 3782 |
| 5 | 8901 |
| 10 | 18113 |
| 20 | 36274 |
| 40 | 71452 |
| 50 | 88512 |
| 80 | 143802 |
| 100 | 176927 |
| 120 | 212839 |
| 150 | 265397 |
*Mean of three replicates
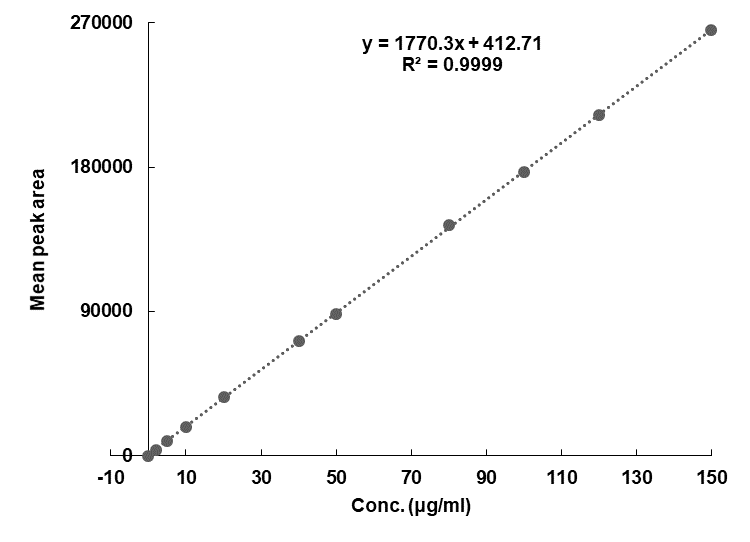
Fig. 3: Calibration curve
Table 3: Precision study
| Intraday precision study | ||
| Conc. (µg/ml) | mean peak area | *Mean peak area±SD (% RSD) |
| 10 | 18113 | 18272± 139.7769 (0.7649) |
| 10 | 18366 | |
| 10 | 18491 | |
| 10 | 18157 | |
| 10 | 18224 | |
| 10 | 18281 | |
| Interday precision study | ||
| Conc. (µg/ml) | Day 1 | Day 2 |
| 10 | 18113 | 18392 |
| 50 | 88512 | 88728 |
| 100 | 176927 | 176799 |
*Mean of three replicates
Table 4: Accuracy study
| Spiked conc. (µg/ml) | Formulation (µg/ml) | Amount recovered (µg/ml) | % Recovery* | % RSD |
| 5 (50 %) | 10 | 9.969 | 99.69 | 0.47 |
| 10 (100 %) | 10 | 9.981 | 99.81 | 0.92 |
| 15 (150 %) | 10 | 9.925 | 99.25 | 0.69 |
*Mean of three replicates
Assay of minoxidil topical solution and minoxidil tablets
The assay of Minoxidil topical solution as well as tablets was performed using the proposed method [19] with the optimized conditions and the percentage of purity of Minoxidil calculated using the linear regression equation was found to be 98.64-99.58 (table 5).
Stress degradation studies
Minoxidil (10µg/ml) was exposed to different stress conditions under the optimized chromatographic conditions and then injected in to the system. The details of stress degradation studies of Minoxidil were shown in table 6.
During the acidic degradation, Minoxidil was eluted at Rt 2.08 min and a degradant was observed at 7.79 min. about 5.29 % has undergone decomposition. The mass spectra of Minoxidil as well as the degradant were shown in fig. 4.
Table 5: Assay of minoxidil
| S. No. | Formulation | Label claim | *Observed amount | % Recovery* |
| 1 | Tablets Brand I | 2.5 mg | 2.4865 mg | 99.46 |
| 2 | Tablets Brand II | 2.5 mg | 2.4895 mg | 99.58 |
| 3 | Topical solution Brand I | 10% | 9.864 % | 98.64 |
| 4 | Topical solution Brand II | 5 % | 4.969 % | 99.38 |
*Mean of three replicates
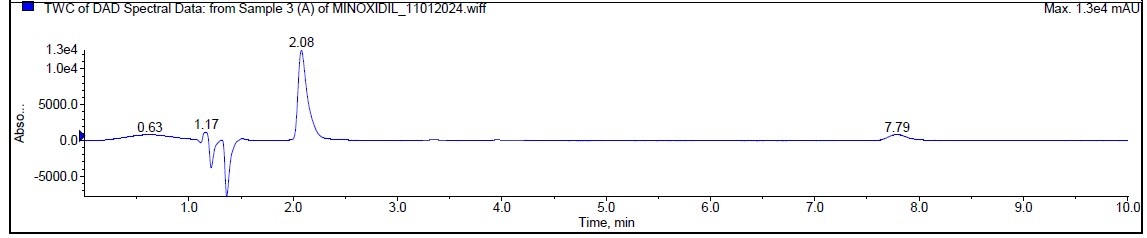 |
| Typical chromatogram of minoxidil (Rt 2.08 min) (Degradant at Rt 7.79 min) |
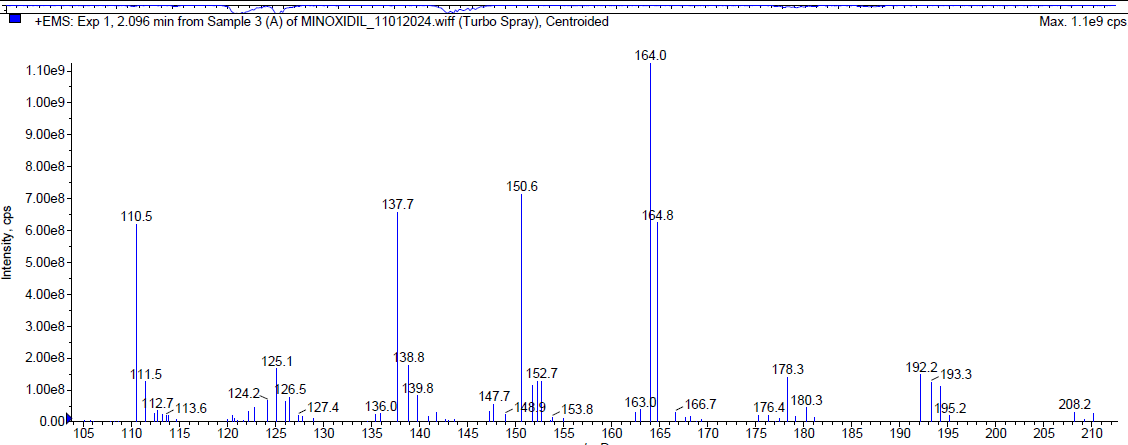 |
| Mass spectrum of minoxidil (Rt 2.096 min) |
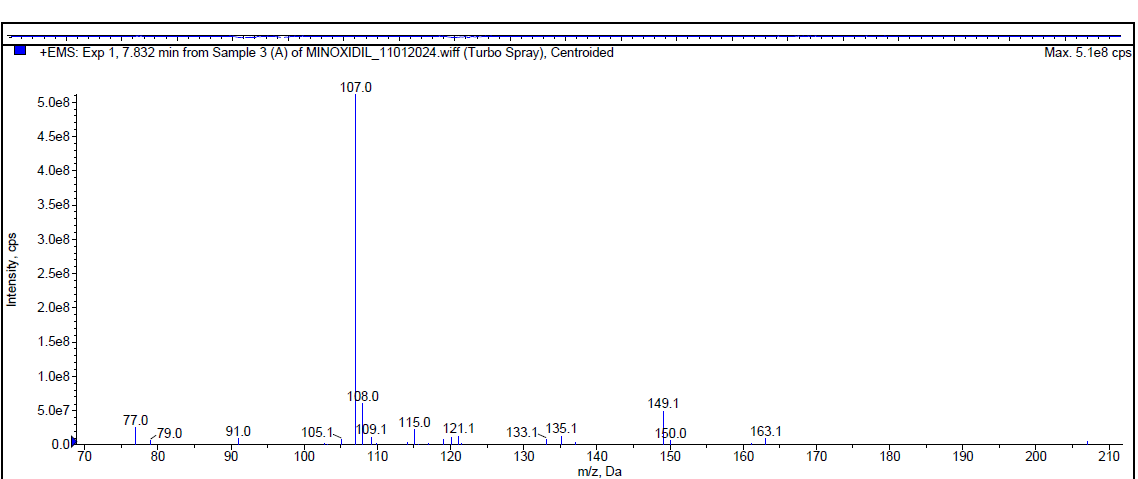 |
| Mass spectrum of minoxidil degradant (Rt 7.832 min) |
| Fig. 4: Typical chromatogram and mass spectra of minoxidil during acidic degradation |
During the thermal degradation, Minoxidil was [17-20] eluted at Rt 2.08 min and a degradant was observed at 4.01 min and 7.814 min but the percentage of Minoxidil was almost negligible i. e. less than 1% indicating that Minoxidil is quite resistant towards oxidation. The mass spectra of Minoxidil and its degradants were shown in fig. 5.
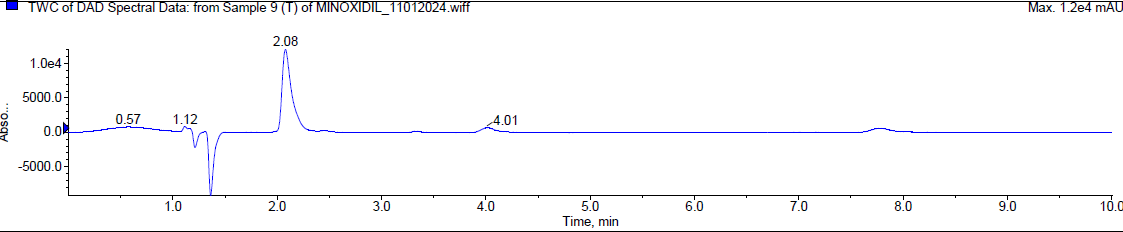 |
| Typical chromatogram of minoxidil (Rt 2.08 min) |
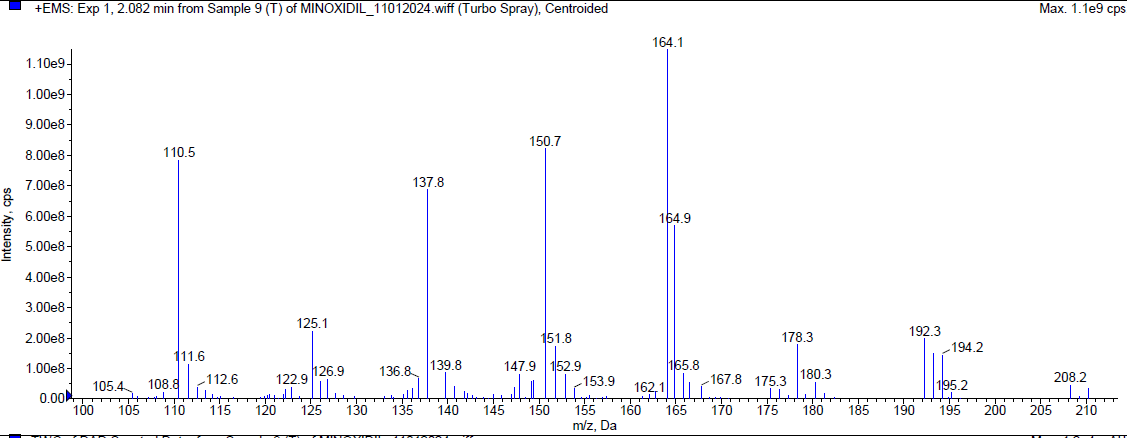 |
| Mass spectrum of minoxidil (Rt 2.082 min) |
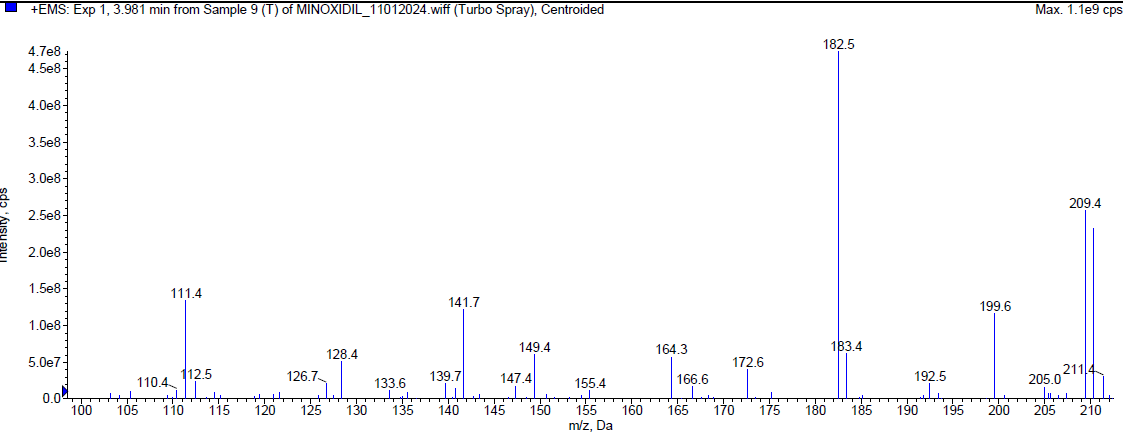 |
| Mass spectrum of minoxidil degradant (Rt 3.981 min) |
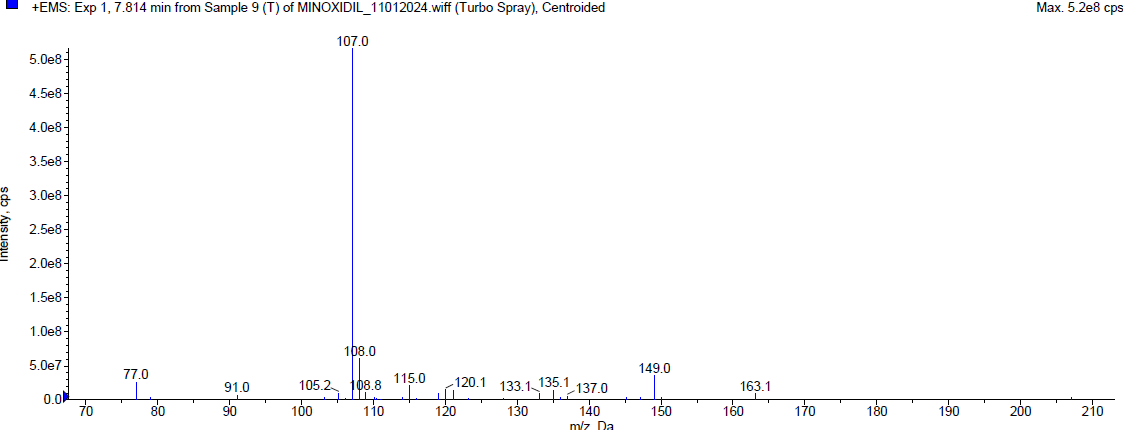 |
| Mass spectrum of minoxidil degradant (Rt 7.814 min) |
Fig. 5: Typical chromatogram and mass spectrum of minoxidil during thermal degradation
During the basic degradation, Minoxidil was eluted at Rt 2.07 min. Two degradants were observed at 4.02 min and 7.78 min and about 10.78 % of Minoxidil has undergone decomposition. The mass spectra of Minoxidil and its degradants were shown in fig. 6.
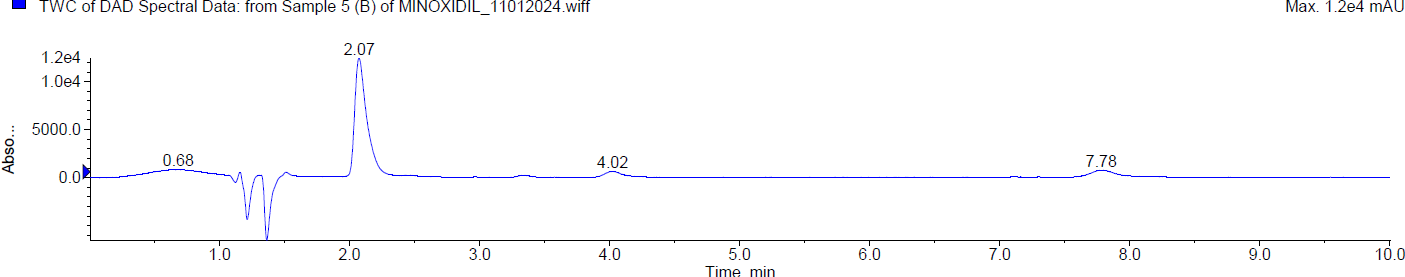 |
| Typical chromatogram of minoxidil (Rt 2.07 min) |
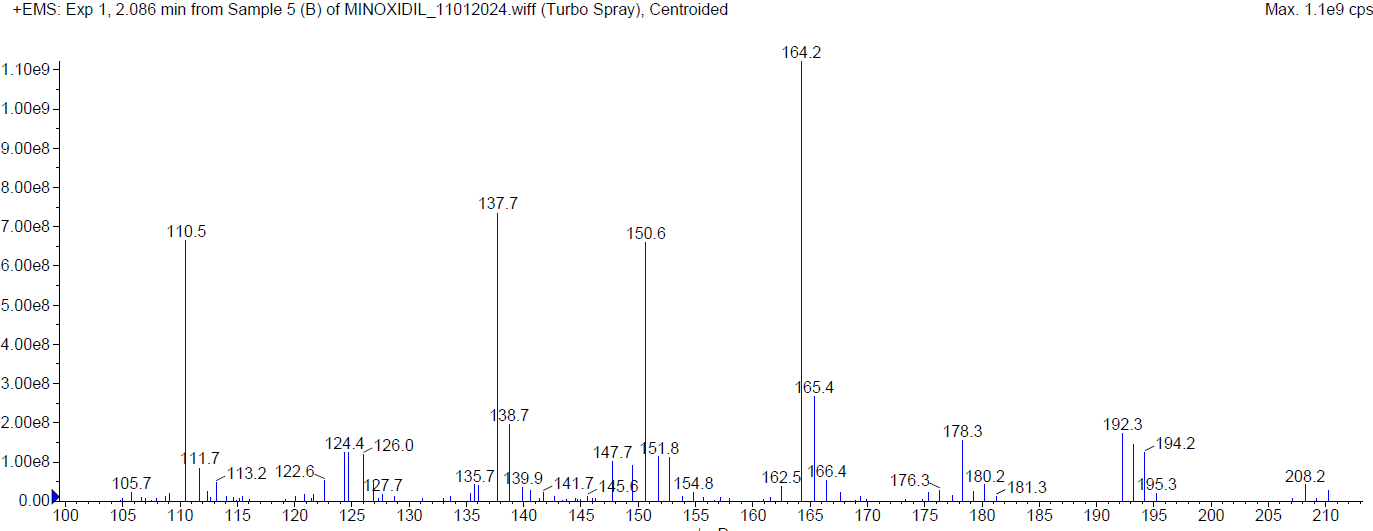 |
| Mass spectrum of Minoxidil (Rt2.086 min) |
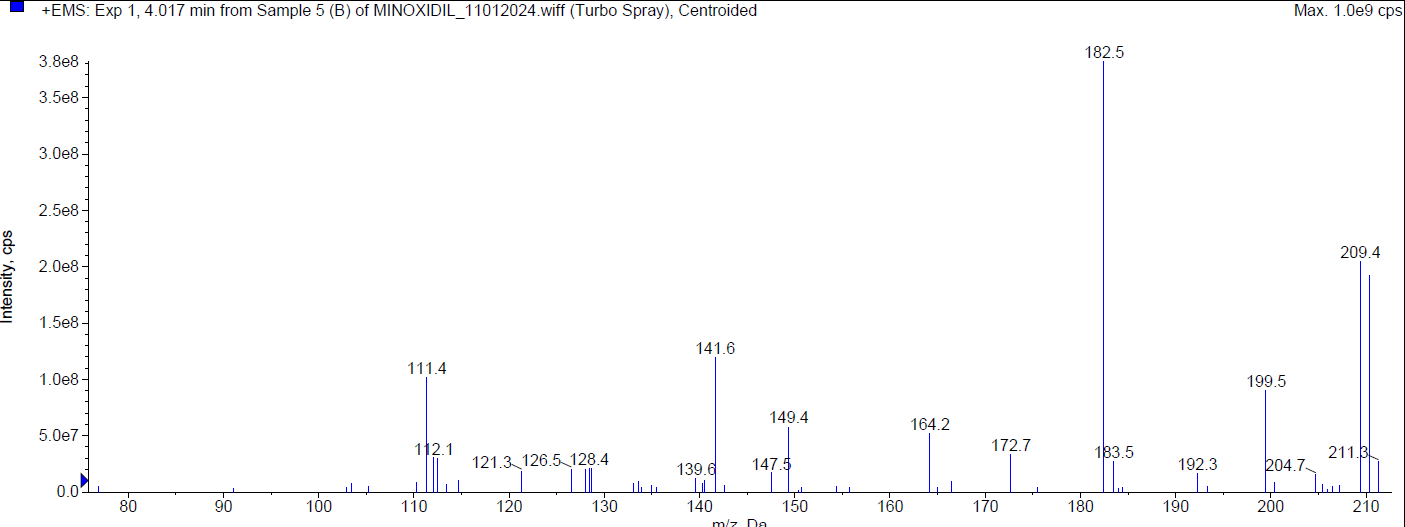 |
| Mass spectrum of minoxidil degradant (Rt 4.017 min) |
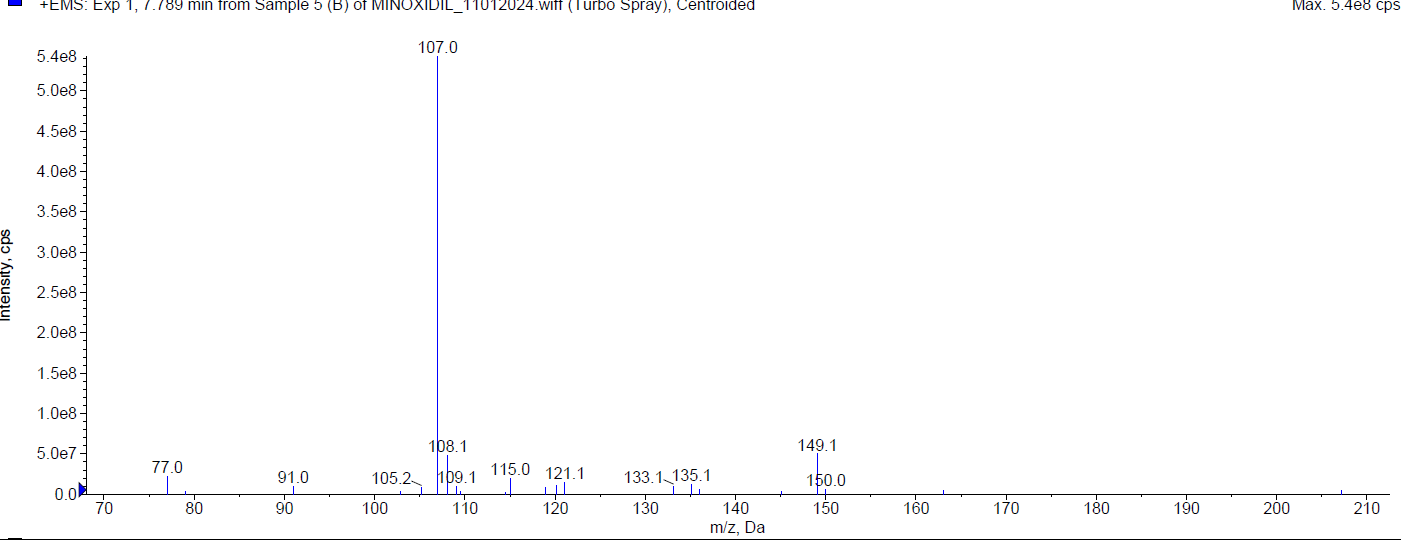 |
| Mass spectrum of minoxidil degradant (Rt 7.78 min) |
| Fig. 6: Typical chromatogram and mass spectrum of minoxidilduring basic degradation |
During the oxidation [20-24] degradation, Minoxidil was eluted at Rt 2.072 min and a degradant was observed at 1.21 min. about 17.64 % of Minoxidil has undergone decomposition. The mass spectra of Minoxidil and the peroxide degradant were shown in fig. 7.
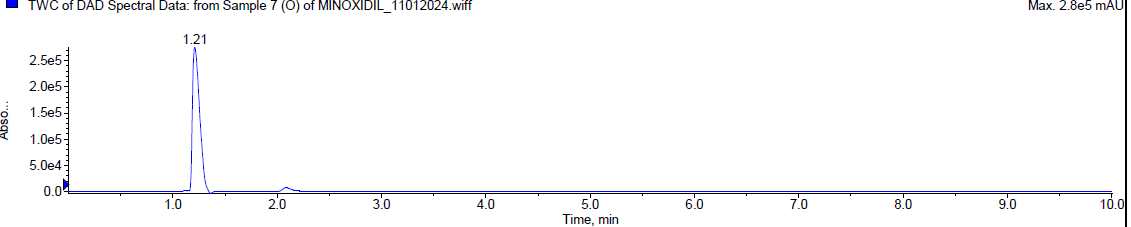 |
| Typical chromatogram of minoxidil (Rt 2.072 min) |
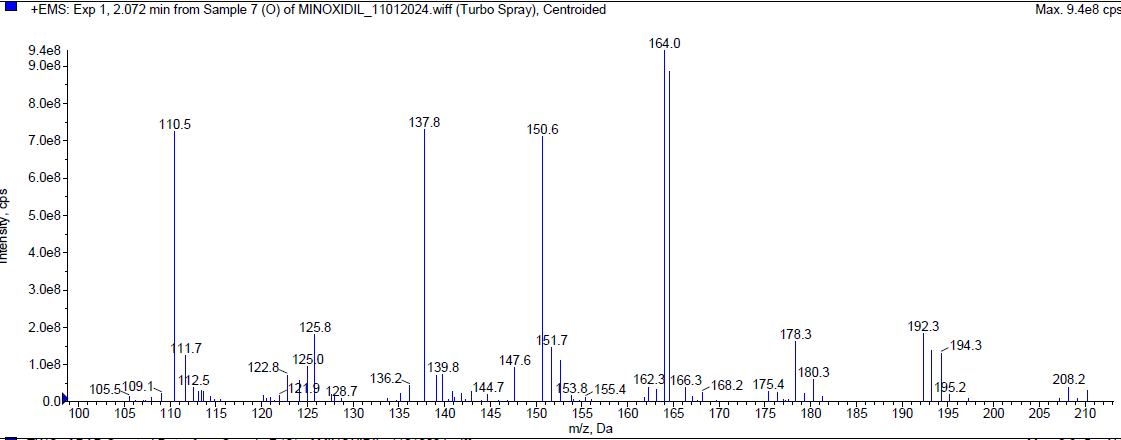 |
| Mass spectrum of minoxidil (Rt 2.072 min) |
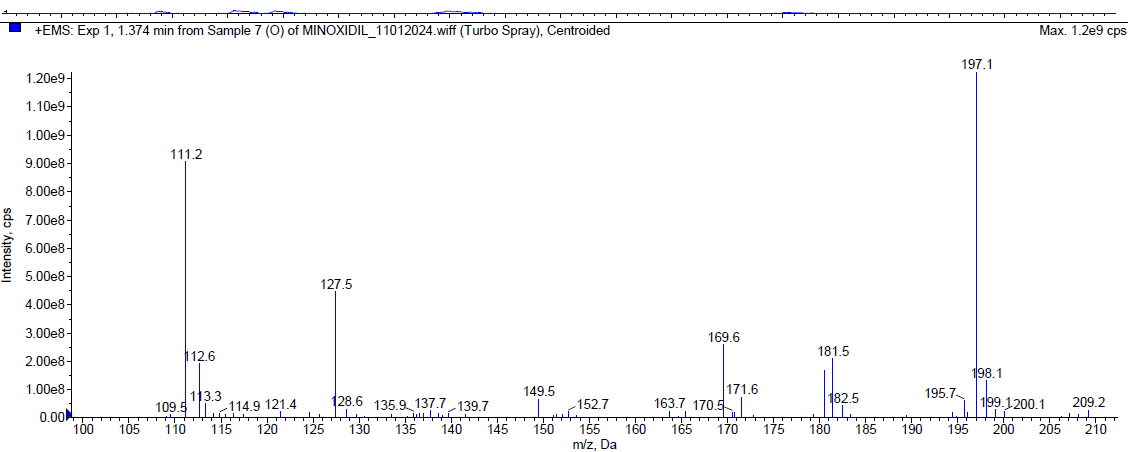 |
| Mass spectrum of minoxidil degradant (Rt 1.210 min) |
Fig. 7: Typical chromatogram and mass spectra of minoxidil during oxidative degradation
Table 6: Stress degradation studies
| Condition | Rt (min) | *Mean peak area | % Recovery* | % Drug degradation |
| Standard drug | 2.07 | 18113 | 100 | - |
| Acidic hydrolysis | 2.079 7.79 |
17155 | 94.71 | 5.29 |
| Thermal degradation | 2.0797 | 17964 | 99.18 | 0.82 |
| Alkaline hydrolysis | 2.0730 | 16161 | 89.22 | 10.78 |
| Oxidative degradation | 2.0848 | 14917 | 82.36 | 17.64 |
| Photo degradation | 2.071 | 18098 | 99.92 | 0.08 |
*Mean of three replicates
DISCUSSION
Analytical methods such as spectrophotometry [2-4], mass spectroscopy and liquid chromatography were developed for the determination of Minoxidil in pharmaceutical dosage forms and biological fluids. Poorna Basuri et al., developed UHPLC-MS/MS method [5] for the estimation of Minoxidil in human plasma using acetonitrile: 0.1% formic acid in water (60:40) as mobile phase using Minoxidil D10 as internal standard and the linearity was found to be 0.00128-0.151075 µg/ml. Zarghi et al., have developed an ion-pair HPLC method [6] for the determination of Minoxidil in human plasma using 0.01M sodium dihydrogen phosphate buffer: acetonitrile (60:40) containing 2.5 mmol sodium dodecyl sulphate adjusted to pH 3.5 as mobile phase (Detection wavelength 281 nm) and the linearity was found to be 0.002-0.1 µg/ml. Mio et al., have developed a HPLC method[7] for the simultaneous determination of Minoxidil (Detection wavelength 240 nm) and Minoxidil sulfate (Detection wavelength 245 nm) using 0.1M formic acid(pH 2.0): methanol (65:35) as mobile phase and the linearity was found to be 1.0-100 µg/ml.
Hemant et al., have developed a HPLC method for the estimation of Minoxidil and related substance in topical formulation (Detection wavelength 282 nm) using a mixture of 2.0 ml of diethyl amine and 40 ml of glacial acetic acid in 1000 ml of milli Q water as an aqueous solvent and 20%THF in methanolasan organic solvent and the linearity was found to be for 0.02-1.0 for related substances and 0.02 – 400 µg/ml for Minoxidil.
In the present study, Agilent Zorbox C18 (150 mm x 4.6 mm x 3 µm) column and PDA detector was employed for the present study. The total run time was 10 min and the detection wavelength was 230 nm. A mixture of 5 mmol Ammonium formate: Methanol: 0.01% Acetic acid (28.9: 71: 0.1) was used as mobile phase on isocratic mode with flow rate 1.2 ml/min were the optimised chromatographic conditions for the present study. Minoxidil has shown linearity over the concentration range 2-150 μg/ml and the method was validated as per ICH guidelines. The LOD and LOQ were found to be 0.0621 μg/ml and 0.1853 μg/ml. Stress degradation studies were performed and the method is found to be selective and specific.
CONCLUSION
The authors have developed a new stability indicating LC-ESI-MS/MS method for the estimation of Minoxidil and the method is fast, simple, accurate and precise and used for the routine analysis of Minoxidil in pharmaceutical formulations and there is no interference of excipients. AB SCIEX Instruments LC-ESI-MS/MS (Model no. 5068379-Y) QTRAP Enabled Triple Quad 5500+with Agilent Zorbox C18 (150 mm x 4.6 mm x 3 µm) column and PDA detector was employed for the present study. The total run time was 10 min and the detection wavelength was 230 nm. A mixture of 5 mmol Ammonium formate: Methanol: 0.01% Acetic acid (28.9: 71: 0.1) was used as mobile phase on isocratic mode with flow rate 1.2 ml/min were the optimised chromatographic conditions for the present study. Minoxidil has shown linearity over the concentration range 2-150 μg/ml and the method was validated as per ICH guidelines. The LOD and LOQ were found to be 0.0621 μg/ml and 0.1853 μg/ml. Stress degradation studies were performed and the method is found to be selective and specific.
ACKNOWLEDGEMENT
The authors are grateful to Intas Pharmaceuticals (India) for providing the gift samples of Minoxidil and the author’s declare no conflict of interest.
FUNDING
Nil
AUTHORS CONTRIBUTIONS
PVD prepared work plan, and MMA reviewed and corrected the article. Both authors agree with the submission and publication. Both authors have read and agreed to the published version of the manuscript.
CONFLICT OF INTERESTS
Declared none
REFERENCES
Lowenthal DT, Affrime MB. Pharmacology and pharmacokinetics of minoxidil. J Cardiovasc Pharmacol. 1980 Feb;2(2 Suppl):S93-106. doi: 10.1097/00005344-198000022-00002, PMID 6156363.
Khadeerunnisa S, VimalakKannan T, Vijaya Lakshmi T. Spectrophotometric determination and estimation of minoxidil in tablet dosage form by UV. Int J Res Pharm Chem Anal. 2019;1(2):47–51. doi: 10.33974/ijrpca.v1i2.73.
De Silva RA, Silva SF, Gomes PC, Gomes ET. Determination of minoxidil by bleaching the permanganate carrier solution in a flow-based spectrophotometric system. Anal Lett. 2011 Feb;44(3):349-59.
Mathrusri Annapurna M, Venkata Navya P, Narendra A. New spectrophotometric methods for the determination of minoxidil. Res J Pharm Technol. 2024 May;17(5):2372-8. doi: 10.52711/0974-360X.2024.00371.
Poorna Basuri PP, Vijayakumar R, Nalini CN. Estimation of minoxidil in human plasma using UHPLC-MS/MS and its application in pharmacokinetic study. J Chromatogr B Analyt Technol Biomed Life Sci. 2022 Aug;1192:123104. doi: 10.1016/j.jchromb.2022.123104, PMID 35168153.
Zarghi A, Shafaati A, Foroutan SM, Khoddam A. Rapid determination of minoxidil in human plasma using ion-pair HPLC. J Pharm Biomed Anal. 2004 Feb;36(2):377-9. doi: 10.1016/j.jpba.2004.06.007, PMID 15496332.
Ichida M, Fujita C, Sumie R, Miyano R, Inoue H. Simultaneous determination of minoxidil and minoxidil sulfate by high-performance liquid chromatography with UV-detection and its applications. Drug Discov. 2020 Jan;7:100050. doi: 10.1016/j.medidd.2020.100050.
PT, MV. Development and validation of a stability-indicating RP-HPLC method for simultaneous estimation of amlodipine besylate and telmisartan in tablet dosage form. Asian J Pharm Clin Res. 2018 Jan;11(1):236-40. doi: 10.22159/ajpcr.2018.v11i1.22336.
International Conference on Harmonisation (ICH). Validation of analytical procedures: text and methodology. ICH Q2(R1). Geneva: ICH; 2005 Nov.
International Conference on Harmonisation (ICH). Stability testing of new drug substances and products. ICH Q1A. Geneva; 2003 Feb.
Kiran G, Sandhya P, Shankar CH, Bhikshapathi DV, Mamatha P. LC–MS/MS quantification method development and validation for dabrafenib in biological matrices. J Appl Pharm Sci. 2023 Jan;13(1):180-6. doi: 10.7324/JAPS.2023.130117.
Dadhaniya T, Chaudhary K, Mehta P. Development of LC-MS/MS method for determination of iloperidone in rabbit plasma: application to a pharmacokinetic study. Int J Pharm Pharm Sci. 2013 Jul;7(4):294-7.
Adluri Phanindra Y, Shravan Kumar Y. Development and validation of sensitive LC-ESI-MS/MS method for the simultaneous estimation of dapagliflozin and saxagliptin in human plasma. Int J Pharm Pharm Sci. 2019 Apr;11(4):1-5. doi: 10.22159/ijpps.2019v11i4.31249.
Lolla S, Gubbiyappa KS, Cheruku S, Bhikshapathi DV. Validation of an LC-MS/MS method for quantitation of fostemsavir in plasma. J Pharmacol Toxicol Methods. 2023 Feb;120:107254. doi: 10.1016/j.vascn.2023.107254, PMID 36863666.
Puttagunta SB, Shaik RP, Bannoth CK, Challa BS, Awen BZ. Bioanalytical method for quantification of solifenacin in rat plasma by LC-MS/MS and its application to pharmacokinetic study. J Anal Sci Technol. 2014 Jan;5(1):35. doi: 10.1186/s40543-014-0035-0.
Momin SJ. A concise review on hyphenated techniques: liquid chromatography coupled with mass spectroscopy (LC-MS/MS). Int J Pharm Sci. 2025 Feb;3(2):1-7. doi: 10.5281/zenodo.14913274.
Jothula H, Navuluri S, Mulakayala NR. Stability based HPLC method for cyclophosphamide related substances in finished drug products: development and validation. Int J Curr Pharm Sci. 2024 May;16(3):42-51. doi: 10.22159/ijcpr.2024v16i3.4061.
Sellappan M, Devakumar D. Development and validation of RP-HPLC method for the estimation of escitalopram oxalate and flupentixol dihydrochloride in combined dosage form and plasma. Int J Pharm Pharm Sci. 2021 Feb;13(2):61-6. doi: 10.22159/ijpps.2021v13i2.30158.
Gurav P, Damle M. Bioanalytical method for estimation of teriflunomide in human plasma. Int J Pharm Pharm Sci. 2022 Sep;14(9):19-23. doi: 10.22159/ijpps.2022v14i9.45151.
Yatha R, Bhikshapathi D, Cheruku S, Bigala R. Development of fast and simple LC-ESI-MS/MS technique for the quantification of regorafenib: application to pharmacokinetics in healthy rabbits. Curr Pharm Anal. 2021 Nov;17(5):554-63.
Gupta NV, S RR, GR. Evaluation of process capability in manufacture of anti-hypertensive tablets 10 mg. Asian J Pharm Clin Res. 2017;10(4):477. doi: 10.22159/ajpcr.2017.v10i4.17161.
Logoyda L, Korobko D. High-performance liquid chromatography–mass spectrometry/mass spectrometry method development for quantitative determination of bisoprolol from Caco-2 cell monolayers. Asian J Pharm Clin Res. 2018 Apr;11(4):386-9. doi: 10.22159/ajpcr.2018.v11i4.24990.
Momin SJ. A concise review on hyphenated techniques: liquid chromatography coupled with mass spectroscopy (LC-MS/MS). Int J Pharm Sci. 2025 Feb;3(2):1-7. doi: 10.5281/zenodo.14913274.
Krishnan VS, Bhikshapathi D, Cheruku S. Method development and validation for the quantification of abametapir in biological matrices by LC-ESI-MS/MS. Indian J Pharm Educ Res. 2024 May;58(3):S1028-33. doi 10.5530/ijper.58.3s.102.