
Int J App Pharm, Vol 18, Issue 1, 2026, 340-356Original Article
EVALUATING THE THERAPEUTIC EFFICACY OF METFORMIN-BERBERINE LOADED NANOPARTICLES FOR THE TREATMENT OF TYPE 2 DIABETES-INDUCED ALZHEIMER’S DISEASE
RAVINA YADAV1a, RUCHI JAKHMOLA MANI1b, ARUN K. SHARMA2a, ASHISH KUMAR3a, DEEPSHIKHA PANDE KATARE1c*
1a,bProteomics and Translational Research Lab, Centre for Medical Biotechnology, Amity Institute of Biotechnology, Amity University, Noida-201301, India. 2aDepartment of Pharmacology, Amity Institute of Pharmacy, Amity University, Gurugram-122413, Haryana, India. 3aDepartment of Pharmaceutics, Amity Institute of Pharmacy, Amity University, Gurugram-122413, Haryana, India. 1cProteomics and Translational Research Lab, Centre for Medical Biotechnology, Amity Institute of Biotechnology, Amity University, Noida-201301, India
*Corresponding author: Deepshikha Pande Katare; *Email: drdeepshikha26@outlook.com
Received: 23 Jul 2025, Revised and Accepted: 22 Nov 2025
ABSTRACT
Objective: To develop and evaluate a novel drug delivery system (NDDS) of Metformin and Berberine-loaded solid lipid nanoparticles (MBSLNPs) for neuroprotection in type 2 diabetes mellitus (T2DM) induced Alzheimer’s disease (AD) model.
Methods: MBSLNPs were prepared by hot homogenization and ultrasonication, characterized for particle size, zeta potential, drug loading, and FTIR (fourier transform infrared spectroscopy) compatibility. In vitro release kinetics were modeled, and in vivo efficacy was assessed in a combined streptozotocin (STZ) and amyloid-β (Aβ) rat model by performing behavioral, biochemical, and histopathological analyses. Safety of blank SLNs was evaluated in healthy rats.
Results: MBSLNPs exhibited a mean particle size of 102±5 nm, zeta potential of –29±3mV, and high drug loading, with no FTIR incompatibilities. Drug release followed first-order kinetics (R²=0.9955) with Fickian diffusion (n=0.43). In vivo, MBSLNPs significantly improved memory performance in Morris Water Maze and Y-Maze compared with free drug (p<0.01) and disease control (p<0.001). Oxidative stress markers like malondialdehyde (MDA), thiobarbituric acid reactive substances (TBARS) were reduced, while antioxidant enzymes like superoxide dismutase (SOD), glutathione peroxidase (GPx), glutathione (GSH) increased significantly (p<0.01 vs. disease control). Pro-inflammatory cytokines (TNF-α, IL-6, NF-κB) decreased markedly (p<0.001), and acetylcholinesterase (AChE) activity was normalized (p<0.01 vs. free drug) in addition to lower cortical and hippocampal Aβ-40/42 levels in MBSLNP-treated rats (p<0.001). Semi-quantitative histopathology showed significantly reduced neuronal loss and gliosis compared with both disease and free drug groups. Safety evaluation of blank SLNs revealed no significant changes in Serum glutamate oxaloacetate transaminase (SGOT), serum glutamate pyruvate transaminase (SGPT), creatinine, or blood nitrogen (BUN).
Conclusion: MBSLNPs demonstrate superior neuroprotective and hepatoprotective efficacy over free drugs, suggesting their translational potential as a combined therapeutic strategy for AD with concurrent liver dysfunction. Thiobarbituric acid reactive substances (TBARS), glutathione peroxidase (GPx), acetylcholinesterase (AChE), serum glutamate oxaloacetate transaminase (SGOT), serum glutamate pyruvate transaminase (SGPT) [26], blood glucose levels, and histological analysis of brain tissue.
Keywords: Type 2 diabetes mellitus, Alzheimer’s disease, Liver-brain axis, Berberine hydrochloride, Solid lipid nanoparticles, Targeted drug delivery
© 2026 The Authors. Published by Innovare Academic Sciences Pvt Ltd. This is an open access article under the CC BY license (https://creativecommons.org/licenses/by/4.0/)
DOI: https://dx.doi.org/10.22159/ijap.2026v18i1.56212 Journal homepage: https://innovareacademics.in/journals/index.php/ijap
INTRODUCTION
Alzheimer’s disease (AD) is the most prevalent neurodegenerative disorder globally, representing an escalating public health emergency. Currently, 55 million individuals are affected by AD, which is projected to triple by 2050 and presenting as seventh leading cause of global mortality [1]. Emerging evidence of longitudinal cohort studies (Rotterdam Study) identifies the type 2 diabetes mellitus (T2DM) as a significant risk factor that could nearly double the risk of developing AD [2]. These intersecting epidemics pose a substantial healthcare threat (particularly in aging populations) and re-classifies the AD pathology as type 3 diabetes (T3DM), highlighting shared pathophysiological mechanisms, including insulin resistance, chronic neuroinflammation, and neuronal oxidative stress [3, 4]. Diabetes-induced hepatic dysfunction contributes to AD progression, emphasizing the pathological relevance of the hepatic-brain axis as a mechanistic bridge between peripheral metabolic dysregulation and neurodegeneration [5, 6]. Further the exacerbated accumulation of amyloid-beta (Aβ) plaques causes neurotoxicity and disrupt synaptic communication [7, 8]. Concurrently, the systemic inflammation in T2DM propagates neuroinflammation via elevated pro-inflammatory cytokines (tumor necrosis factor-alpha (TNF-α) and interleukin-6 (IL-6)), which breach the blood-brain barrier (BBB) and activate microglia and astrocytes [9]. These glial cells, in turn, generate cytotoxic reactive oxygen species (ROS) and chronic neuroinflammation, which exacerbate mitochondrial dysfunction and synaptic loss [10, 11].
Despite these mechanistic overlaps, current therapies for AD and diabetic associated hepatic injury-induced neurodegeneration remain siloed and inadequate. Donepezil (Acetylcholinesterase inhibitors) and Memantine (N-Methyl-D-Aspartate receptor antagonists), offer transient symptomatic relief in AD by enhancing cholinergic transmission and modulating glutamatergic signalling, respectively [12]. However, these treatments do not address the underlying pathophysiological mechanisms driving AD progression. Similarly, T2DM treatments like metformin, which improves peripheral insulin sensitivity, exhibit limited BBB permeability and fail to address cerebral insulin resistance effectively [13]. This therapeutic gap underscores the need for novel interventions that target the shared mechanisms of AD and hepatic malfunctioning in diabetic condition. To bridge this therapeutic gap, we propose a novel nanotheranostic platform, such as solid lipid nanoparticles (SLNs) co-encapsulating metformin and berberine hydrochloride. Berberine is a bioactive alkaloid from Berberis species, exhibits potent anti-inflammatory, anti-acetylcholinesterase (IC50: 0.44 μM), and nuclear factor erythroid 2–related factor 2 (Nrf2)-mediated antioxidant properties [14]. Berberine's anti-inflammatory effects are mediated through the inhibition of pro-inflammatory cytokines and the activation of anti-inflammatory pathways, while its antioxidant properties are attributed to the activation of the Nrf2 pathway, which upregulates the expression of antioxidant enzymes [15]. Metformin, on the other hand, restores AMP-activated protein kinase (AMPK)-dependent insulin sensitivity and reduces Aβ42 neurotoxicity. AMPK activation by metformin enhances glucose uptake and metabolism, reduces oxidative stress, and inhibits the production of Aβ peptides [16]. SLNs engineered for BBB penetration enable targeted delivery to hippocampal and cortical neurons, overcoming the pharmacokinetic limitations of conventional therapies. Preclinical models demonstrate that this dual-pathway approach concurrently mitigates insulin resistance, suppresses ROS overproduction, and inhibits neuroinflammatory pathways, which are key drivers of T3DM pathogenesis [17, 18]. The combined delivery of Metformin and Berberine via SLNs is hypothesized to produce an additive neuroprotective effect, potentially mediated through complementary anti-inflammatory and antioxidant mechanisms. This approach is supported by previous work by Jakhmola Mani et al. (2023) [19], who demonstrated that systemic metabolic disturbances, including liver injury, can exacerbate neurodegenerative processes via inflammatory mediators and impaired amyloid clearance. Such findings strengthen the rationale for a dual-drug delivery strategy that addresses both central and peripheral pathological drivers. The present study targets to synthesize and characterize SLNs co-encapsulating metformin and berberine hydrochloride, with the goal of validating their translational potential as a promising therapeutic strategy affecting the multifactorial pathophysiology of AD and T2DM.
MATERIALS AND METHODS
Chemicals and reagents
Metformin hydrochloride (≥98% purity) and streptozotocin (STZ) were purchased from Sigma-Aldrich (St. Louis, MO, USA), while berberine hydrochloride (≥98% purity) was obtained from HiMedia Laboratories Pvt. Ltd. (Mumbai, India). Glyceryl monostearate, Tween 80, and Poloxamer 188 were sourced from Merck Life Science Pvt. Ltd. (Bengaluru, India). Analytical-grade ethanol and chloroform were procured from SD Fine Chemicals Ltd. (Mumbai, India). Aβ-40 (Catalog No. E-EL-R3030) and Aβ-42 (Catalog No. E-EL-R1402) sandwich ELISA kits were purchased from Elabscience, USA, while other ELISA kits were obtained from Abcam Singapore Pte Ltd, Singapore. All other chemicals and solvents used were of analytical grade.
Instruments
Key instruments included fourier-transform infrared spectroscopy (FTIR; IRSpirit-X, Shimadzu, Kyoto, Japan), UV–Vis spectrophotometer (UV-1800, Shimadzu, Kyoto, Japan), high-performance liquid chromatography (HPLC; Shimadzu LC-20AT, Kyoto, Japan), scanning electron microscopy (SEM; ZEISS EVO 18, Germany), transmission electron microscopy (TEM; JEM-2100, JEOL Ltd., Tokyo, Japan), particle size and zeta potential analyzer (Zetasizer Nano ZS90, Malvern Panalytical Ltd., Malvern, UK), rotor-stator homogenizer (Ultra-Turrax T25, IKA®-Werke GmbH and Co. KG, Staufen, Germany), ultrasonicator (UP200S, Hielscher, Germany), digital melting and boiling point apparatus (EQ-DP-10, Equiptronics, India), and microscope (Motic BA310, Motic, China). Behavioral assessments were performed using an open-field apparatus (Model ENV-515, Med Associates Inc., St. Albans, VT, USA) and a Morris water maze setup (custom-fabricated, Panlab S. L., Barcelona, Spain).
Pre-formulation studies
Drug-excipient compatibility
Drug-excipient compatibility studies were conducted using FTIR to ensure that the active pharmaceutical ingredients (APIs) and excipients did not interact adversely. Physical mixtures of Berberine Hydrochloride, Metformin Hydrochloride, poloxamer 407, and sesame oil (2–3 mg each) were homogenized with potassium bromide (KBr, 100 mg) and compressed into pellets under vacuum. FTIR spectra (4000–400 cm⁻¹) were analysed for functional group interactions. The absence of new absorption peaks or shifts in characteristic bands (e. g., O–H stretch at 3300 cm⁻¹, C=O at 1650 cm⁻¹) confirmed compatibility, indicating that the components could be safely combined in the formulation [20].
Physicochemical characterization
The melting point of Metformin and Berberine Hydrochloride was determined in triplicate using a capillary tube method to ensure consistency and purity. Saturation solubility was assessed in various solvents (water, methanol, ethanol, acetone, chloroform, and benzene) with pH adjusted to 7.4 using 0.1 M HCl and phosphate-buffered saline (PBS). Excess drug was added to 10 ml of each solvent, agitated for 24 h at 25 °C, and filtered. Drug concentration was quantified via UV-Vis spectrophotometry at λmax = 230 nm (Metformin Hydrochloride) and 265 nm (Berberine Hydrochloride). The partition coefficient (Log P) was determined by equilibrating 10 mg of each drug in a 1:1 water/n-octanol system for 2 h. Phases were separated, and drug concentrations were quantified using pre-validated calibration curves, providing insights into the drugs' solubility and lipophilicity [20].
Preparation of metformin-berberine solid lipid nanoparticles (MBSLNPs)
MBSLNPs were prepared via hot homogenization and ultrasonication, techniques that ensure uniform particle size and stability. The lipid phase, comprising 5% (w/v) sesame oil and APIs (1:1 ratio of Metformin-Berberine Hydrochloride), was heated to 70 °C to melt the lipids and dissolve the drugs. The aqueous phase contained 2% (w/v) poloxamer 407 in deionized water, also heated to 70 °C to match the lipid phase temperature. The lipid phase was emulsified into the aqueous phase under high-speed homogenization (25,000 rpm, 10 min) to form a coarse emulsion. This emulsion was then ultrasonicated (40% amplitude, 30 min) to reduce droplet size and achieve a nanoemulsion. The nano emulsion was cooled to 25 °C for lipid solidification, and nanoparticles were lyophilized (-49 °C, 24 h) to obtain a free-flowing powder, ensuring long-term stability and ease of handling [20].
Characterization of MBSLNPs
MBSLNPs were characterized by morphology using scanning electron microscopy (SEM) and transmission electron microscopy (TEM). These techniques provided detailed images of the nanoparticles, revealing their shape and surface characteristics. Particle size distribution, polydispersity index (PDI), and zeta potential were analyzed via dynamic light scattering [21, 22]. These measurements ensured that the nanoparticles were uniformly sized, stable, and had the desired surface charge for optimal biological interactions [20, 23].
In vitro drug release study
For in vitro drug release studies, 10 mg of MBSLNPs were suspended in PBS (pH 7.4, 1% Tween 80) within a dialysis membrane (MWCO 12–14 kDa) and agitated at 100 rpm (37 °C). Aliquots were withdrawn at predetermined intervals (0–48 h), and drug release was quantified spectrophotometrically. Release kinetics were modeled using zero-order, first-order, Higuchi, and Korsmeyer-Peppas equations to understand the release mechanisms and predict the in vivo behaviour of the nanoparticles [20].
Drug loading and encapsulation efficiency
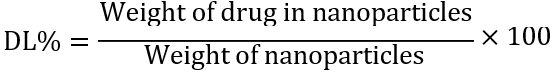
The drug loading (DL%) and encapsulation efficiency (EE%) of Metformin and Berberine in MBSLNPs were determined using a validated high-performance liquid chromatography (HPLC) method. Briefly, 10 mg of lyophilized MBSLNPs were accurately weighed and dissolved in 1 ml methanol, followed by sonication for 15 min to ensure complete disruption of the nanoparticle matrix. The solution was centrifuged at 15,000 rpm for 10 min, and the supernatant was analyzed using an HPLC system equipped with a C18 column (250 × 4.6 mm, 5 µm; Phenomenex, USA). The mobile phase for Metformin consisted of phosphate buffer (pH 6.8): acetonitrile (60:40 v/v), while Berberine was analyzed using methanol: water: acetic acid (50:49:1 v/v/v). Detection wavelengths were 233 nm for Metformin and 345 nm for Berberine. DL% and EE% were calculated using the following equations:
In vivo experimental design
Establishment and standardization of AD model in rats
The present study used eighteen albino wistar rats (either sex, weighing 200–250 g), procured from the Central Animal House Facility, Amity University Noida, Uttar Pradesh INDIA, registered with the Committee for the Purpose of control and supervision of experiments on animals (CPCSEA), Government of India to establish and validate an AD model. All experimental protocols were approved (503/CPCSEA) by the institutional animal ethics committee (IAEC) and were conducted in strict accordance with the guidelines of the CPCSEA, Government of India.
All animals were acclimatized for 14 d under standardized laboratory conditions: temperature maintained at 20±2 °C, relative humidity at 50±10%, and a 12 h light/dark cycle, with free access to standard pellet diet and water. Post-acclimatization, the animals were randomly assigned into three groups (n = 6 per group).
Group I (Normal Control): Animals in this group did not receive any pathological or therapeutic intervention and served as the baseline reference.
Group II (Standard AD Model): After an additional 7 d adaptation period post-acclimatization, rats were fed a high-fat diet (HFD) formulated with 70% standard pellet feed, 10% lard, 5% yolk powder, 0.5% cholesterol, and 10% sucrose ad libitum from day 7 to day 35. On day 35, a single intraperitoneal injection of STZ at a dose of 35 mg/kg (freshly prepared 0.1 mol/l sodium citrate buffer (pH 4.4) was administered to induce insulin resistance. Subsequently, on day 42, a stereotactic bilateral hippocampal infusion (10 µg per rat) of aggregated amyloid-β peptide fragment Aβ₍₂₅–₃₅₎ (amyloid-β peptide fragment containing amino acids 25 through 35) was performed under appropriate anaesthesia (ketamine, 80 mg/kg and xylazine, 5 mg/kg; intraperitoneally) to induce neuropathology resembling AD [24]. Biochemical assessments were conducted on day 58 to evaluate cognitive deficits and validate AD-like pathology [25].
Group III (Test Model or Hepatic Compromise AD Model): This group followed the same HFD and STZ induction protocol as described for Group II up to day 35. Thereafter, animals received repeated cycles of hepatotoxic and pro-inflammatory agents to model systemic metabolic stress and hepatic dysfunction, which are known to exacerbate neurodegeneration. The regimen included oral administration of D-galactosamine (10 mg/kg), 8% ethanol (v/v), and D-galactose (100 mg/kg). D-galactosamine was administered first, followed by ethanol after a 2 d interval, and D-galactose after an additional 3 d, constituting a complete 8 d cycle. These cycles were continuously repeated with a 2 d rest period between successive cycles until day 58 [19]. This approach was intended to mimic chronic systemic inflammation and hepatic stress combining with neurodegenerative triggers.
Following the model establishment, comprehensive biochemical and histopathological evaluations were conducted. Data from Group II served as the benchmark for standard AD pathology, against which the enhanced hepatic compromise model (Group III) was compared to assess the extent and progression of neurodegenerative outcomes. To validate the successful induction of the AD model, various biochemical and histological parameters were evaluated, including TNF-α, thiobarbituric acid reactive substances (TBARS), glutathione peroxidase (GPx), acetylcholinesterase (AChE), serum glutamate oxaloacetate transaminase (SGOT), serum glutamate pyruvate transaminase (SGPT) [26], blood glucose levels, and histological analysis of brain tissue.
Acute safety assessment of blank solid lipid nanoparticles
The acute safety profile of blank SLNs was evaluated in healthy adult Wistar rats (n = 6 per group, 200–220 g). Blank SLNs were prepared following the same formulation protocol as the MBSLNPs, omitting the active drugs. Animals were administered a single oral dose equivalent to the highest nanoparticle dose used in the efficacy study (400 mg/kg) after overnight fasting, with free access to water. A vehicle-treated group served as control. Clinical observations (fur condition, posture, respiration, activity level) were recorded twice daily. Body weight, food intake, and locomotor activity (infrared beam break assay) were monitored on Days 0, 7, and 14. Blood samples were collected via retro-orbital plexus under light isoflurane anaesthesia on Day 14 for serum biochemical evaluation [SGOT, SGPT, blood urea nitrogen (BUN), creatinine]. Behavioural testing (open field immobility time) was also conducted on Day 14. Animals were observed for mortality and overt signs of toxicity for 14 d post-dose. No mortality, behavioural alterations, or significant changes in biochemical or physiological parameters were observed compared to controls.
Evaluation of MBSLNPs in a hepatic compromised AD model
Experimental study was conducted using thirty-six male albino Wistar rats (weighing 125–150 g) to evaluate the therapeutic efficacy of MBSLNPs in a hepatically compromised AD model in diabetic animals. Following a 14 d acclimatization period under standardized environmental conditions (20±2 °C, 12-hour light/dark cycle), animals were randomly assigned into six groups (n = 6 per group). Group I (Normal Control) received 0.9% saline (10 ml/kg, p. o.) and served as the physiological baseline. Group II (Disease Control) was subjected to a HFD composed of 70% standard pellet feed, 10% lard, 5% yolk powder, 0.5% cholesterol, and 10% sucrose ad libitum from day 7 to day 35, following an additional 7 d dietary adaptation. On day 35, insulin resistance was induced via a single intraperitoneal injection of STZ (35 mg/kg, freshly prepared in 0.1 M sodium citrate buffer, pH 4.4). From day 36 onward, animals were administered a repeated cyclic regimen of hepatotoxic and pro-inflammatory agents to induce hepatic dysfunction and systemic metabolic stress, consisting of D-galactosamine (10 mg/kg, p. o.) on day 36, ethanol (8% v/v, p. o.) after a 2 d interval, and D-galactose (100 mg/kg, p. o.) 3 d thereafter, completing an 8 d cycle that was continuously repeated with 2 d inter-cycle intervals until day 58. Group III (Standard Treatment) underwent the same disease induction as Group II and received metformin (200 mg/kg, p. o.) from day 36 onward. Groups IV to VI received identical disease induction as Group II, followed by oral administration of MBSLNPs at escalating doses of 100, 200, and 400 mg/kg, respectively, once daily from day 36 to day 58 to evaluate dose-dependent therapeutic efficacy.
Behavioural and biochemical assessments
Cognitive function was assessed using the morris water maze (MWM) (4 trials/day for 4 d), Y-maze (spontaneous alternation), novel object recognition test (NORT; recognition index) and open field test (OFT). These tests evaluated the rats' spatial learning, memory, and recognition abilities. Locomotor activity and anxiety-like behaviour were evaluated via open field testing (5 min sessions), providing insights into the rats' general activity levels and anxiety. Rats were euthanized under high dose of anesthesia, and brain tissues were homogenized in PBS (pH 7.4). Oxidative stress markers including malondialdehyde (MDA), glutathione (GSH), superoxide dismutase(SOD), inflammatory cytokines (TNF-α, IL-6, nuclear factor kappa-light-chain-enhancer of activated B cells (NF-κB)), and neurochemicals (acetylcholinesterase (AChE), acetylcholine (Ach), Aβ40/42) were quantified via enzyme-linked immunosorbent assay (ELISA), providing a comprehensive biochemical profile of the treatment effects [19, 27–32]. Hepatic functioning was also measured by the assessment of alkaline phosphatase (ALP), alanine aminotransferase (ALT), aspartate aminotransferase (AST).
Behavioral testing timing
All behavioral assessments were conducted 24 h after the final dose administration to evaluate sustained therapeutic effects and minimize the influence of acute pharmacodynamic peaks.
Aβ-40 and Aβ-42 quantification
Brain homogenates were analyzed for Aβ-40 and Aβ-42 levels using commercially available sandwich ELISA kits according to the manufacturer’s protocol. Absorbance was measured at 450 nm using a microplate reader, and concentrations were calculated from standard curves generated with synthetic Aβ peptides.
Histopathology
Brain tissues were fixed in 4% paraformaldehyde, paraffin-embedded, sectioned (5 µm), and stained with hematoxylin-eosin (H and E). Neuronal degeneration and inflammation were assessed under light microscopy, allowing for detailed examination of the histological changes induced by the treatments [30]. Hippocampal and cortical sections stained with H and E were evaluated by two independent blind observers for neuronal loss and gliosis using a semi-quantitative scale: 0 = absent, 1 = mild, 2 = moderate, 3 = severe. Scores from both observers were averaged for statistical analysis, and representative micrographs for each severity grade.
Statistical analysis
All data were analysed using one-way analysis of variance (ANOVA) followed by Tukey’s multiple comparisons test as the post hoc analysis for all parametric datasets. Normality was confirmed using the Shapiro–Wilk test prior to ANOVA. Each group consisted of 6 animals (n=6), and all measurements were conducted in triplicate where values are expressed as mean±SD for biochemical assays to minimize technical variability. This statistical approach ensured that the differences observed between groups were robust and reliable.
RESULTS
Pre-formulation studies
The physicochemical evaluation of the pre-formulation revealed a pale yellowish white color and exhibited a crystalline nature. The physical blend emitted a mild herbal or amine-like odor due to berberine hydrochloride and metformin hydrochloride, along with a faint nutty scent from sesame oil. By maintaining high purity (>98%) owing to the use of pharmacopeial-grade components, the physical mixture demonstrated stability under stress conditions such as heat, humidity, and light exposure.
Solubility studies
The solubility of Berberine and Metformin Hydrochloride was quantitatively assessed in various solvents, including water, methanol, ethanol, acetone, chloroform, and benzene, using UV-Vis spectroscopy at specific wavelengths. Saturation solubility was determined by dissolving an excess amount of each drug, equilibrating for 24 h at room temperature, and filtering the supernatant before analysis (table 1). These solubility profiles indicate that Metformin is highly hydrophilic, favouring aqueous environments, while Berberine Hydrochloride is more lipophilic, favouring organic solvents. These findings are crucial for selecting appropriate solvents and excipients in formulation development to optimize drug solubility, stability, and bioavailability.
Partition coefficient (Log P) determination
The partition coefficients of Berberine and Metformin Hydrochloride were determined to assess their lipophilicity by equilibrating the drugs in a biphasic system of water and n-octanol, followed by measuring the concentration in each phase using UV-Vis spectroscopy. The Log P values were calculated as the ratio of drug concentration in the organic phase to the aqueous phase. The results indicated that Berberine Hydrochloride exhibited a Log P value of 0.477, suggesting moderate lipophilicity and better solubility in the organic phase. In contrast, Metformin Hydrochloride displayed a Log P value of-0.368, indicating a hydrophilic nature with preferential solubility in the aqueous phase (table 2).
Table 1: Solubility study of berberine hydrochloride and metformin hydrochloride in different solvents using a qualitative solubility scale
| Solvent | Berberine hydrochloride | Metformin hydrochloride |
| Water | --- | +++ |
| Methanol | +++ | ++ |
| Ethanol | ++ | ++ |
| Acetone | ++ | + |
| Chloroform | +++ | + |
| Benzene | --- | --- |
“---" represents least soluble. “++” represents moderately soluble, “+++” represents freely soluble
Table 2: The partition coefficient study
| Drug | Aqueousphase (mg/ml) | Organicphase (mg/ml) | Log P |
| Berberine hydrochloride | 2.5 | 7.5 | 0.477 |
| Metformin hydrochloride | 7.0 | 3.0 | -0.368 |
These Log P values are critical for understanding the absorption and permeability characteristics of the drugs, as lipophilicity influences their ability to permeate biological membranes and their overall bioavailability. The moderate lipophilicity of Berberine Hydrochloride suggests it may have better membrane permeability, while the hydrophilic nature of Metformin Hydrochloride indicates it may require specific formulation strategies to enhance its absorption and therapeutic efficacy.
pKa determination
The pKa values of Berberine and Metformin Hydrochloride were determined using UV-Vis spectroscopy in water to understand their ionization behaviour at physiological pH. The experimental pKa values, derived from absorbance changes at different pH levels using a pre-established calibration curve, were found to be 2.47 and 2.8, respectively. These values are critical for predicting the solubility, permeability, and absorption of the drugs, which in turn affect their pharmacokinetic and pharmacodynamic properties. A drug's pKa influences the proportion of ionized and non-ionized forms in different pH environments, directly impacting bioavailability, as the non-ionized form typically permeates biological membranes more effectively. Understanding the pKa is essential for optimizing solubility, ensuring stability, and predicting interactions with excipients. The acidic nature of these compounds suggests that they predominantly exist in their ionized forms at acidic pH, influencing their solubility and absorption profiles (table 3).
Table 3: The pKa determination study
| Drug | Solvent | ExperimentalpKa value | Method used |
| Berberine hydrochloride | Water | 2.47 | UV-Vis spectroscopy |
| Metformin hydrochloride | Water | 2.8 | UV-Vis spectroscopy |
This necessitates careful formulation techniques to enhance solubility and drug delivery. The findings support the selection of appropriate excipients that stabilize the drugs in their most bioavailable forms, ensuring optimal therapeutic outcomes. The relationship between pKa and solubility must be carefully evaluated to optimize drug dissolution in the gastrointestinal tract, thereby improving absorption and efficacy.
Drug-excipient compatibility studies
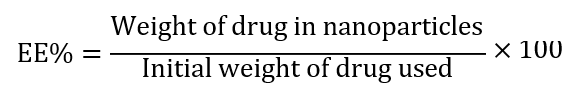
The FTIR analysis was meticulously conducted to evaluate potential interactions between Berberine Hydrochloride, Metformin Hydrochloride, Poloxamer, and Sesame Oil by comparing the spectral peaks of the API mixture, excipients mixture, and final formulation. The FTIR spectra of the API mixture, comprising Metformin and Berberine Hydrochloride, displayed characteristic peaks: O-H stretching vibrations in the 3300-3400 cm⁻¹ range, C=O stretching in the 1680-1750 cm⁻¹ region, and C=C stretching in the 1500-1600 cm⁻¹ range, confirming the structural integrity of the APIs (fig. 1).
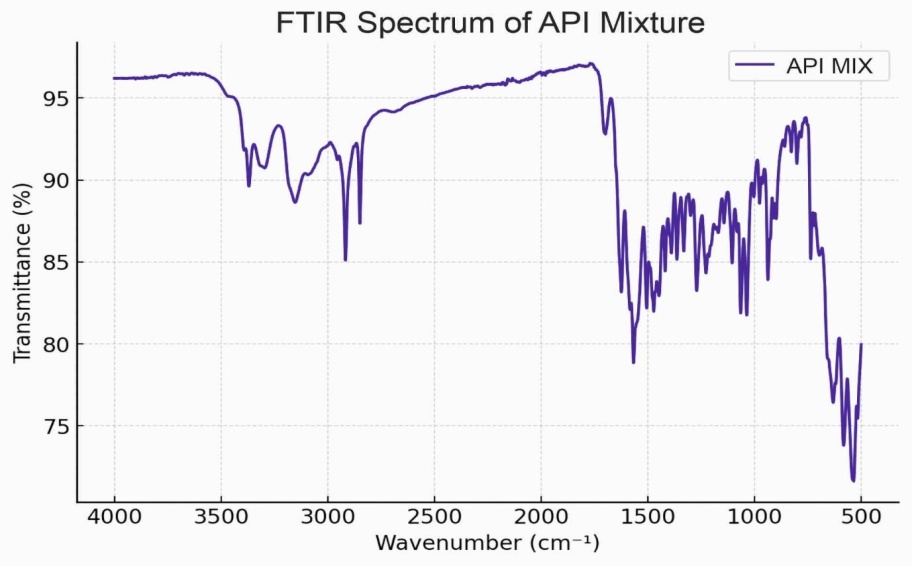
Fig. 1: Fourier-transform infrared spectroscopy spectra of active pharmaceutical ingredients mixture of metformin and berberine hydrochloride
The excipients mixture, containing Poloxamer and Sesame Oil, exhibited distinct O-H stretching peaks in the 3300-3400 cm⁻¹ region and C-O stretching vibrations in the 1000-1300 cm⁻¹ range, indicating the presence of functional groups associated with these excipients (fig. 2). The spectrum of the final formulation closely resembled that of the API mixture, with no significant spectral shifts or new peak formations, suggesting no strong molecular interactions or chemical incompatibilities between the APIs and excipients (fig. 3). The absence of additional peaks or major changes in the functional group regions indicates that the chemical structures of Metformin and Berberine Hydrochloride remained stable in the presence of Poloxamer and Sesame Oil, confirming that the excipients did not interfere with the integrity of the drugs. FTIR spectra of Metformin, Berberine, blank SLNs, and MBSLNPs showed no major evidence of chemical incompatibility. While slight peak shifts and broadenings were noted in the nanoparticle formulations, these are attributable to physical interactions such as hydrogen bonding rather than new chemical bond formation. These findings affirm the formulation's compatibility and suitability for further development, as the excipients do not alter the chemical stability of the active pharmaceutical ingredients.
Fig. 2: Fourier-transform infrared spectroscopy spectra of the excipients mixture
Surface morphology scanning electron microscopy analysis
The surface morphology of the MBSLNP sample was meticulously analysed using SEM at a magnification of 7.16 KX. The SEM image (fig. 4) revealed nanoparticles with a relatively uniform distribution across the surface, with measured particle sizes ranging from approximately 85.1 nm to 98.7 nm.
The nanoparticles exhibited a spherical morphology with some aggregation, and their surfaces appeared relatively smooth, indicating minimal surface roughness. The scale bar of 300 nm confirmed the nanoscale dimensions of the particles, validating their suitability for nanotechnology applications. The imaging conditions, including an accelerating voltage of 10.00 kV and a working distance of 9.0 mm facilitated a detailed examination of the surface features. The uniformity in particle size distribution suggests controlled synthesis conditions, while the absence of significant agglomeration indicates good dispersion, underscoring the formulation's potential for consistent and reliable application in biomedical fields.
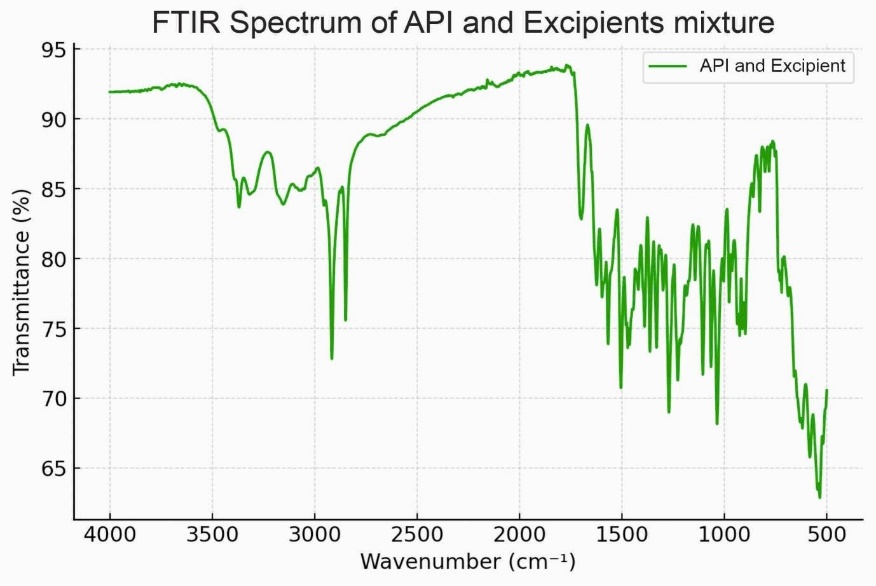
Fig. 3: Fourier-transform infrared spectroscopy spectra of mixture of active pharmaceutical ingredients and excipients
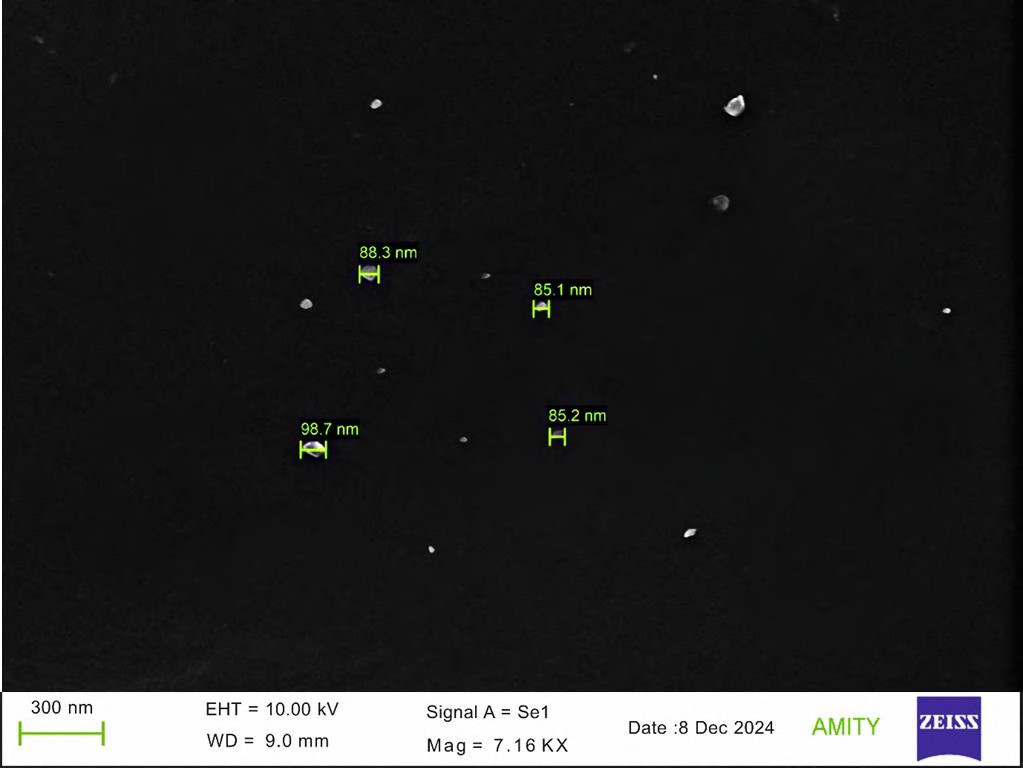
Fig. 4: Scanning electron microscopy image of the sample showing the surface morphology at a magnification of 7.16 KX. The nanoparticles exhibit a spherical morphology with minimal aggregation, and the scale bar represents 300 nm
Transmission electron microscopy (TEM)
The structural and morphological properties of the MBSLNP sample were meticulously examined using TEM at a magnification of 120,000x. The TEM image (fig. 5) confirmed the presence of nanoparticles with sizes ranging from 92.5 nm to 102.5 nm, as measured from the micrograph. These nanoparticles exhibited a uniform spherical shape with well-defined edges and minimal aggregation, indicative of a highly controlled synthesis process. The high magnification allowed for the visualization of individual particles, revealing fine structural details and confirming the nanoscale characteristics of the synthesized nanoparticles. The scale bar of 2000 nm provided a reference for the size distribution of the observed particles, further validating the uniformity and consistency in morphology. The imaging parameters and uniform particle size distribution underscore the precision of the synthesis approach, ensuring reproducibility and stability of the nanoparticles for potential biomedical applications.
PDI
The size distribution graph of the MBSLNPs formulation demonstrates a narrow peak, indicating a highly uniform particle size distribution with a Z-average (Z-avg) of 100 nm, a peak diameter of 100 nm, and an intensity contribution of 100%, signifying a monomodal size distribution. The distribution width of 60.45 nm reflects a well-defined and stable nanoparticle population. The recorded PDI value of 0.3 falls within the acceptable range for stable nano formulations, confirming the homogeneity of the nanoparticles. The particle size distribution analysis revealed an average particle size near 100 nm, which is optimal for enhanced cellular uptake and systemic circulation in drug delivery applications. A low PDI value below 0.3 indicates that the MBSLNP nanoparticles exhibit a homogeneous size distribution, essential for ensuring consistent drug delivery, stability, and reproducibility in biomedical applications.
This homogeneity is crucial for preventing aggregation, enhancing bioavailability, and improving the overall therapeutic efficacy of the formulation.
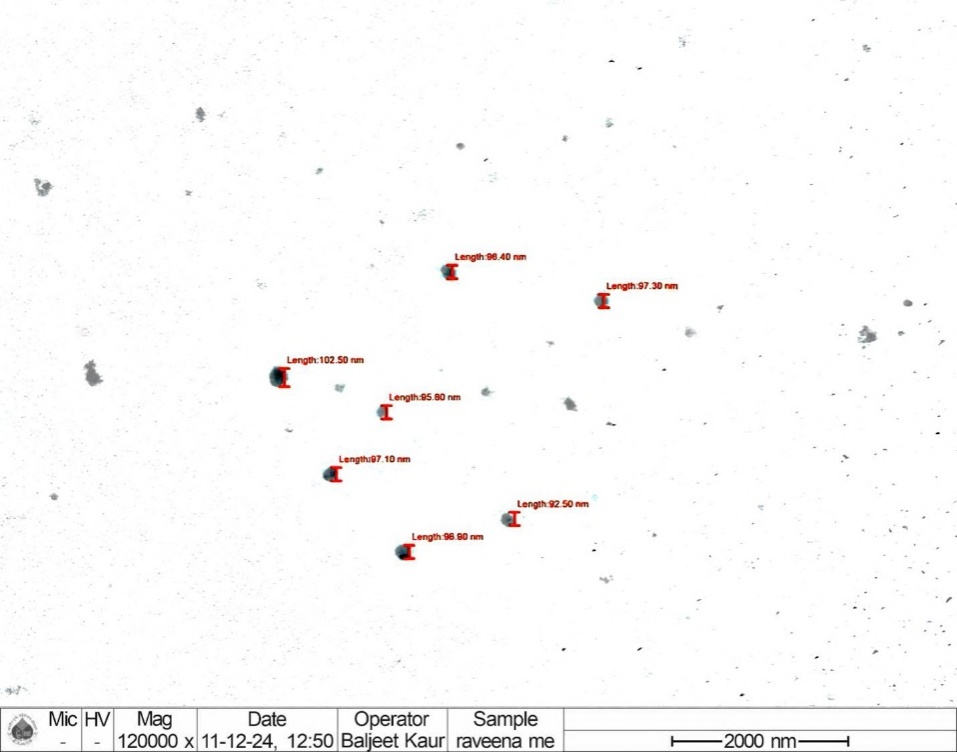
Fig. 5: Transmission electron microscopy image of the sample showing nanoparticles at a magnification of 120,000x. The particles exhibit a uniform spherical shape with sizes ranging between 92.5 nm and 102.5 nm. The scale bar represents 2000 nm
Zeta potential
Zeta potential is a critical parameter for assessing the stability and interaction behaviour of nanoparticles in suspension, as it provides insights into surface charge, which governs electrostatic repulsion forces and aggregation tendencies. The zeta potential distribution of the MBSLNP formulation exhibited a distinct and well-defined peak, indicative of a monodisperse system with uniform charge distribution. The recorded zeta potential of-29 mV, with a narrow peak distribution, signifies a consistent surface charge across the nanoparticles, ensuring adequate electrostatic repulsion to prevent aggregation and enhance dispersion stability. A high absolute zeta potential value (greater than±30 mV) is indicative of strong colloidal stability, minimizing particle aggregation over time, which is crucial for drug delivery applications where nanoparticle stability directly influences bioavailability and therapeutic efficacy (fig. 6). The zeta potential results confirm the formulation's suitability for biomedical applications, ensuring prolonged stability and enhanced circulation time in biological environments, thereby optimizing therapeutic outcomes.
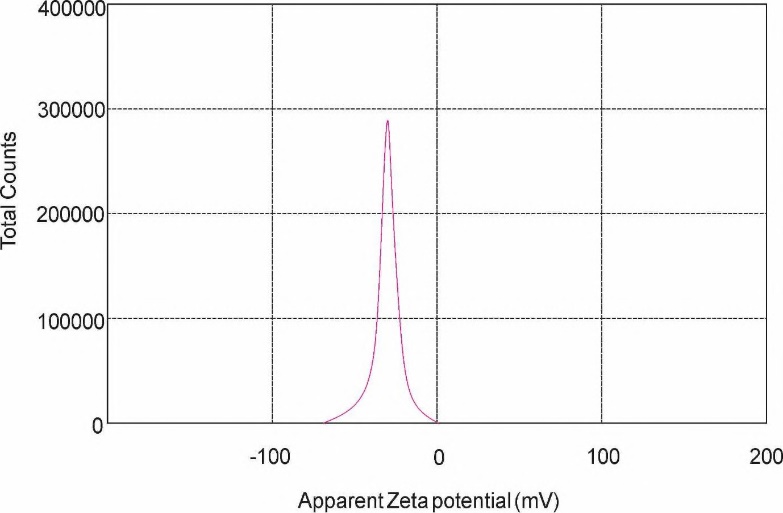
Fig. 6: Zeta potential distribution of MBSLNPs showing a peak at-29 mV, indicating adequate electrostatic repulsion and high colloidal stability
Release kinetics study
The release kinetics of the MBSLNP formulation were meticulously analysed to elucidate the drug release profile and underlying mechanism. The experimental data revealed a biphasic release pattern characterized by an initial burst release, attributed to the rapid dissolution of the drug adsorbed on the nanoparticle surface, followed by a sustained release phase, indicative of gradual drug diffusion from the nanoparticle matrix. To delineate the release mechanism, the data were fitted to various kinetic models, including Zero-Order, First-Order, Higuchi, and Korsmeyer-Peppas models (fig. 7).
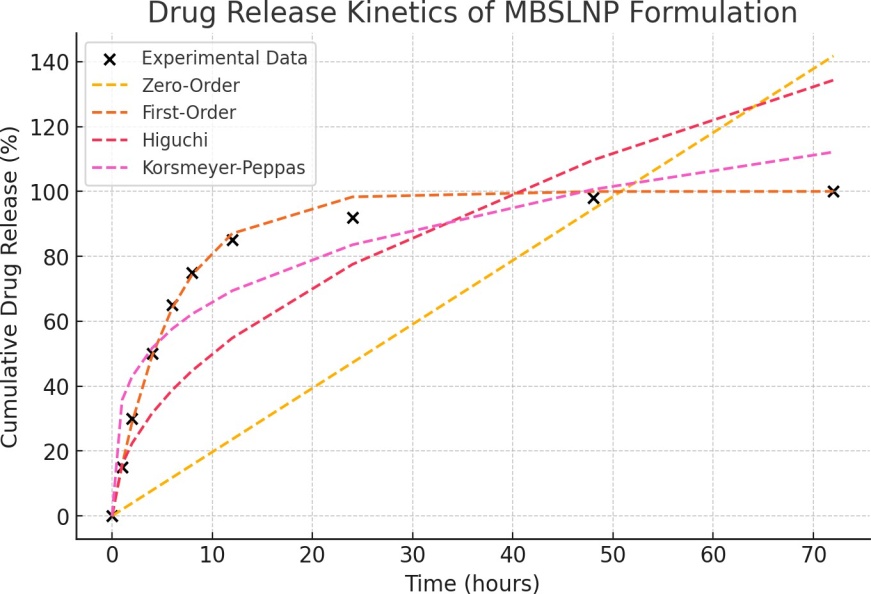
Fig. 7: Drug release kinetics of MBSLNPs formulation
The First-Order model demonstrated the highest correlation (R² = 0.9955), signifying a concentration-dependent release mechanism where the release rate diminishes as the drug concentration decreases. The Korsmeyer-Peppas model also exhibited a substantial fit (R² = 0.8889), suggesting a non-Fickian or anomalous diffusion mechanism, implicating both diffusion and polymer relaxation in the release process. Conversely, the Higuchi model displayed a lower R² value (0.6168), indicating that while diffusion is involved, it is not the predominant release mechanism (table 4).
Table 4: Coefficient of determination (R²) values for different kinetic models used to analyse the drug release profile of the MBSLNPs formulation. The First-Order model exhibited the highest R² value, indicating the best fit, while the Zero-Order model had the lowest correlation with the experimental data
| S. No. | Kinetic model | R² Value |
| 1 | Zero-Order | 0.426528917376541 |
| 2 | First-Order | 0.995547537721035 |
| 3 | Korsmeyer-Peppas | 0.888971946064501 |
| 4 | Higuchi | 0.616783963400728 |
The zero-order model, with a negative R² value, confirmed that the drug release does not proceed at a constant rate over time. Model fitting of the in vitro release profile revealed that the First-Order model (R² = 0.9955) provided the best description of the release kinetics, followed by the Korsmeyer-Peppas model (R² = 0.8889) and the Higuchi model (R² = 0.6168). The ‘n’ value from the Korsmeyer-Peppas model was 0.43, indicating Fickian diffusion as the primary release mechanism (Supplementary table ST1). This insight is pivotal for refining the formulation to achieve controlled and sustained drug delivery, enhancing therapeutic efficacy and patient compliance.
Supplementary table ST1: Summary of in vitro release kinetic model fitting for MBSLNPs (0–48 h dataset)
| Model | Linearized form used for fit | Parameters reported | R² | Interpretation |
| Zero-Order | Ct = C0+k0 t (or % release vs. t) | — | 0.4265 | Poor fit: release is not constant rate over time. |
| First-Order | ln Ct = ln C0 − k1 t (or ln(100−%R) vs. t) |
— | 0.9955 | Best fit; release is concentration-dependent with diminishing rate over time. |
| Higuchi | Mt/M∞ = kH t^(1/2) (or %R vs. t^(1/2)) | — | 0.6168 | Diffusion contributes but is not the predominant kinetic descriptor. |
| Korsmeyer– Peppas | log(Mt/M∞) = log kKP+n log t | n = 0.43 | 0.8889 | Secondary fit; Fickian diffusion (n≈0.43) consistent with diffusion-controlled release from SLNs. |
Notes: 1) Fitting performed on the full 0–48 h dataset (including the initial burst phase). 2) Mt/M∞ denotes fractional drug released at time t. 3) R² values correspond to linear regressions of the respective linearized expressions; First-Order provided the highest goodness-of-fit and is emphasized in the Results/Discussion.
DL%, EE%, and equivalent doses
HPLC analysis revealed high EE% and acceptable DL% for both drugs in MBSLNPs. Metformin exhibited a DL% of 8.12±0.34% and EE% of 92.46±1.28%, while Berberine showed a DL% of 7.54±0.41% and EE% of 90.37±1.16%. Based on these values, the equivalent active drug doses at each nanoparticle administration level were calculated (table 5). The results confirm that the effective doses of both drugs were within or below the known efficacious ranges for rodent models, supporting the hypothesis that the therapeutic benefit arises from combined nano-enabled delivery rather than excessive drug loading.
Table 5: Drug loading, encapsulation efficiency, and equivalent active drug doses for MBSLNPs
| S. No. | MBSLNPs dose (mg/kg) |
Metformin DL% | Metformin EE% | Metformin dose (mg/kg) |
Berberine DL% | Berberine EE% | Berberine Dose (mg/kg) |
| 1 | 100 | 8.12±0.34 | 92.46±1.28 | 8.12 | 7.54±0.41 | 90.37±1.16 | 7.54 |
| 2 | 200 | 8.12±0.34 | 92.46±1.28 | 16.24 | 7.54±0.41 | 90.37±1.16 | 15.08 |
| 3 | 400 | 8.12±0.34 | 92.46±1.28 | 32.48 | 7.54±0.41 | 90.37±1.16 | 30.16 |
All assays were performed in triplicate and values are expressed as mean±SD (n = 3).
Supplementary table ST2
| S. No. | Parameter | Control (Vehicle) | Blank SLNs (400 mg/kg) | p-value |
| 1 | Body weight change (%) | +3.2±0.8 | +3.0±0.9 | 0.72 |
| 2 | Food intake (g/day) | 22.5±1.1 | 22.3±1.0 | 0.68 |
| 3 | Locomotoractivity (beam breaks/min) | 85.4±6.2 | 83.9±5.8 | 0.64 |
| 4 | SGOT (U/l) | 72.1±5.4 | 74.0±5.7 | 0.58 |
| 5 | SGPT (U/l) | 35.8±3.1 | 36.5±3.2 | 0.61 |
| 6 | BUN (mg/dl) | 17.4±1.2 | 17.8±1.3 | 0.54 |
| 7 | Creatinine (mg/dl) | 0.62±0.04 | 0.64±0.05 | 0.49 |
| 8 | Open field immobility time (sec) | 42.8±4.1 | 43.5±4.3 | 0.73 |
| 9 | Mortality | 0/6 | 0/6 | — |
No mortality, behavioural changes, or signs of toxicity were observed in assessment of blank SLNs treatment as compared to normal control throughout the 14 d period. No significant differences were observed compared to untreated control (p>0.05, one-way ANOVA followed by Tukey’s post hoc test).
Acute safety profile of blank SLNs
Animals received a single oral dose of blank SLNs equivalent to the highest nanoparticle dose used in the efficacy study (400 mg/kg). Data are presented as mean±SD (n = 6) (Supplementary table ST2).
Validation of an alzheimer’s disease model
Significant elevations in fasting blood glucose levels were observed in both the standard (279.68±8.65 mg/dl) and test (244.08±8.45 mg/dl) AD groups compared to the normal control group (139.13±9.30 mg/dl), confirming successful induction of a diabetic-AD phenotype (F₅,₃₀ = 179.043, p<0.05). Notably, the levels of hepatic enzymes SGOT and SGPT were significantly elevated in the test group (114.47±3.77 and 89.5±4.69 IU/l, respectively), whereas the standard AD group showed no significant increase (82.45±4.69 and 63.37±3.10 IU/l) relative to the normal control group (81.34±4.16 and 63.67±4.16 IU/l) (F₅,₃₀ = 62.203, p<0.05) (fig. 8). These findings suggest that liver function remained largely unaffected in the standard AD model, indicating that the cognitive impairment was not mediated via hepatic dysfunction. In contrast, the significant hepatic enzyme elevation in the test group highlights the role of liver injury and systemic inflammation in contributing to the pathogenesis of hepatic-compromised AD, thus supporting a liver-brain axis mechanism.
While neuroinflammatory and oxidative stress markers displayed characteristic alterations in the cortex and hippocampus. TNF-α levels were markedly reduced in both regions of the test (cortex: 139.98±3.15; hippocampus: 168.74±4.69 pg/mg protein) and standard (cortex and hippocampus: 161.80±3.10 pg/mg protein) groups compared to the normal controls (cortex: 166.87±4.16; hippocampus: 195.63±4.16 pg/mg protein) (F₅,₃₀ = 116.403, p<0.05). Similarly, GPx activity significantly declined in the cortex (test: 19.92±0.92; standard: 16.85±1.23 U/mg protein) and hippocampus (test: 24.97±2.27; standard: 16.86±1.08 U/mg protein) relative to the control group (cortex: 33.27±1.80; hippocampus: 23.18±1.55 U/mg protein) (F₅,₃₀ = 37.727 and 125.510, p<0.05) (fig. 8).
Indicators of lipid peroxidation, measured via TBARS, were significantly elevated in the test (cortex: 1.30±0.22; hippocampus: 1.67±0.06 nmol/mg protein) and standard (cortex: 1.68±0.27; hippocampus: 1.84±0.09 nmol/mg protein) groups in comparison to the control (cortex: 0.52±0.20; hippocampus: 1.41±0.06 nmol/mg protein) (F₅,₃₀ = 38.136 and 53.114, p<0.05). Additionally, AChE activity was markedly increased in both cortical (test: 2.09±0.15; standard: 2.68±0.27 U/mg protein) and hippocampal (test: 3.03±0.09; standard: 3.84±0.09 U/mg protein) regions relative to the control group (cortex: 1.52±0.20; hippocampus: 2.41±0.06 U/mg protein), indicating progressive cholinergic dysfunction (F₅,₃₀ = 427.817 and 43.787, p<0.05) (fig. 8).
As we observed significant elevations of SGOT and SGPT in serum, increased TNF-α, altered redox status (GPx, elevated TBARS), and enhanced acetylcholinesterase activity in both cortex and hippocampus, indicating systemic hepatic injury alongside neurodegenerative features. Besides the assessments of these biochemical parameters, additional pro-inflammatory cytokine (IL6) and histopathological observations of both liver and brain, were performed, which strengthen the mechanistic link and provide morphological confirmation of hepatic and neuronal damage (Supplementary fig. SF1).
Evaluation of behavioural parameters for therapeutic potential of MBSLNPs MWM, Y-maze, NOR assessment and OFT
A battery of behavioural tests, including the MWM, Y-maze, NORT, and OFT, were conducted to assess the cognitive and neuro-behavioural effects of MBSLNPs in a hepatic-injury-mediated diabetic AD model. In the MWM test, rats in the disease control group exhibited marked spatial memory deficits, evidenced by a significant reduction in time spent in the target quadrant (TSTQ: 8.1±1.47 s) and an increase in latency time ((LT): 74.66±2.85 s) compared to normal controls (TSTQ: 17±1.09 s; LT: 55.16±2.85 s) (F₅,₃₀ = 45.136 and 46.242, p<0.05). MBSLNP treatment led to dose-dependent improvements: TSTQ increased to 10.1, 12.0, and15.16 s, and LT decreased to 64.1, 62.0, and 57.16 s for 100, 200, and 400 mg/kg doses, respectively (fig. 9). Metformin-treated rats also showed modest improvement (TSTQ: 10.5±1.51 s; LT: 65.66±2.5 s), though less effective than MBSLNPs. In the Y-maze test, the disease control group demonstrated impaired working memory, with reduced spontaneous alternation performance (SAP: 19.52±1.92%) and escape latency (EL: 13.13±1.78 s), compared to normal controls (SAP: 31.26±0.81%; EL: 19.01±1.01 s). MBSLNPs significantly enhanced SAP (21.87–28.42%) and EL (14.98–18.30 s) in a dose-dependent manner (F₅,₃₀ = 51.679 and 20.632, p<0.05). Metformin showed a modest effect (SAP: 19.52±1.92%; EL: 15.9±0.98 s) (fig. 9). In the NORT, the disease control group showed a drastic decline in novel object exploration (recognition index: 12.7±2.69%) compared to controls (39.77±2.12%), indicating short-term memory deficits. MBSLNPs improved recognition index to 17.64%, 22.79%, and 31.49% at increasing doses (F₅,₃₀ = 168.411, p<0.05). Metformin yielded a lower increase (16.02±1.62%). OFT analysis revealed diminished exploratory behaviour in the disease control group, with reduced centre time (4.5±1.04 s) and number of entries (3.1±0.75) versus controls (13.16±0.75 s; 7.0±0.63) (F₅,₃₀ = 77.774 and 15.471, p<0.05). MBSLNPs significantly enhanced both metrics in a dose-dependent manner.
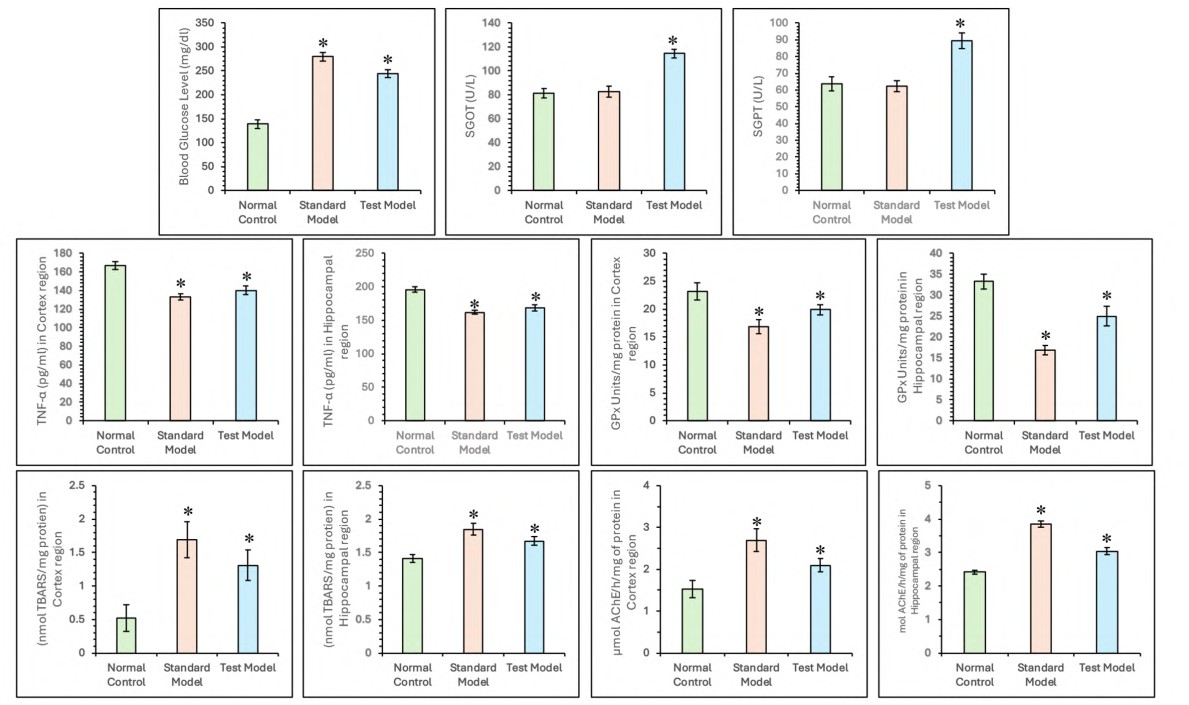
Fig. 8: Comparison of systemic, hepatic, and neurochemical alterations in control, standard and test AD groups. Bar graphs depict fasting blood glucose, SGOT, SGPT, TNF-α, GPx, TBARS, and AChE levels in cortex and hippocampus. All data were analysed using one-way ANOVA followed by Tukey’s multiple comparisons test and represented in mean±SD (n=6) where ‘*’ showed a significant difference (p<0.05) as compared with the normal control group
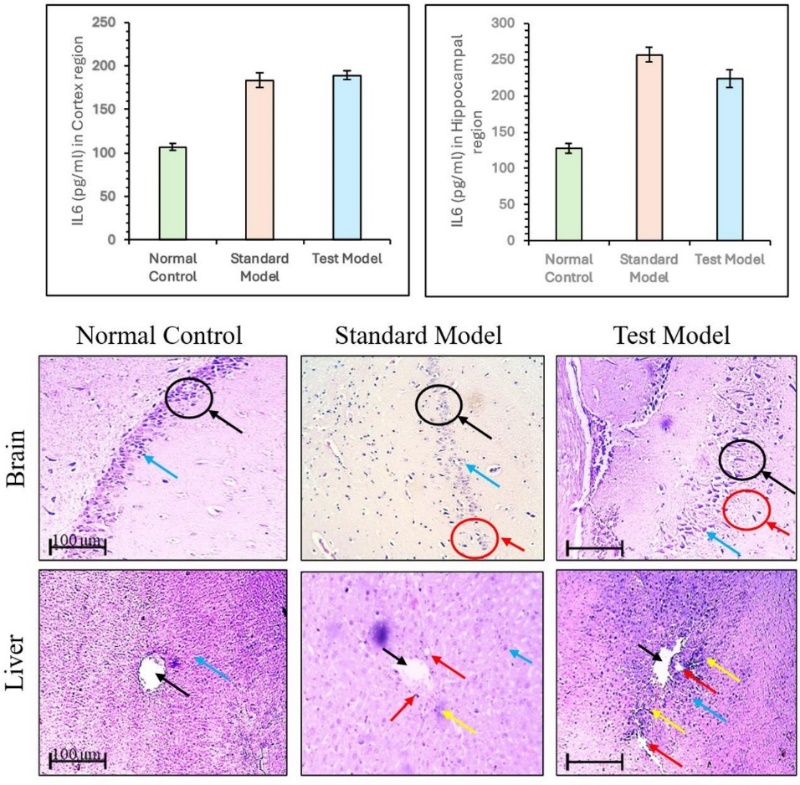
Supplementary fig. 1: Level of pro-inflammatory cytokine (IL6) levels in cortex and hippocampus and histological alterations in hepatic and brain tissue control, standard AD, and test AD groups. All data were analysed using one-way ANOVA followed by Tukey’s multiple comparisons test and represented in mean±SD (n=6) where ‘*’ showed a significant difference (p<0.05) as compared with the normal control group. Histopathological assessment of hepatic and brain tissues across experimental groups. Liver sections from normal control showed intact hepatic lobules with central vein (black arrow) and hepatic cords (blue arrow). Disease control revealed hepatocyte swelling (red arrow) and portal infiltration (yellow arrow), indicating hepatic damage. MBSLNP-treated groups exhibited restored hepatic architecture. Brain sections from normal control showed organized hippocampal layers with intact granule cells (black arrow)
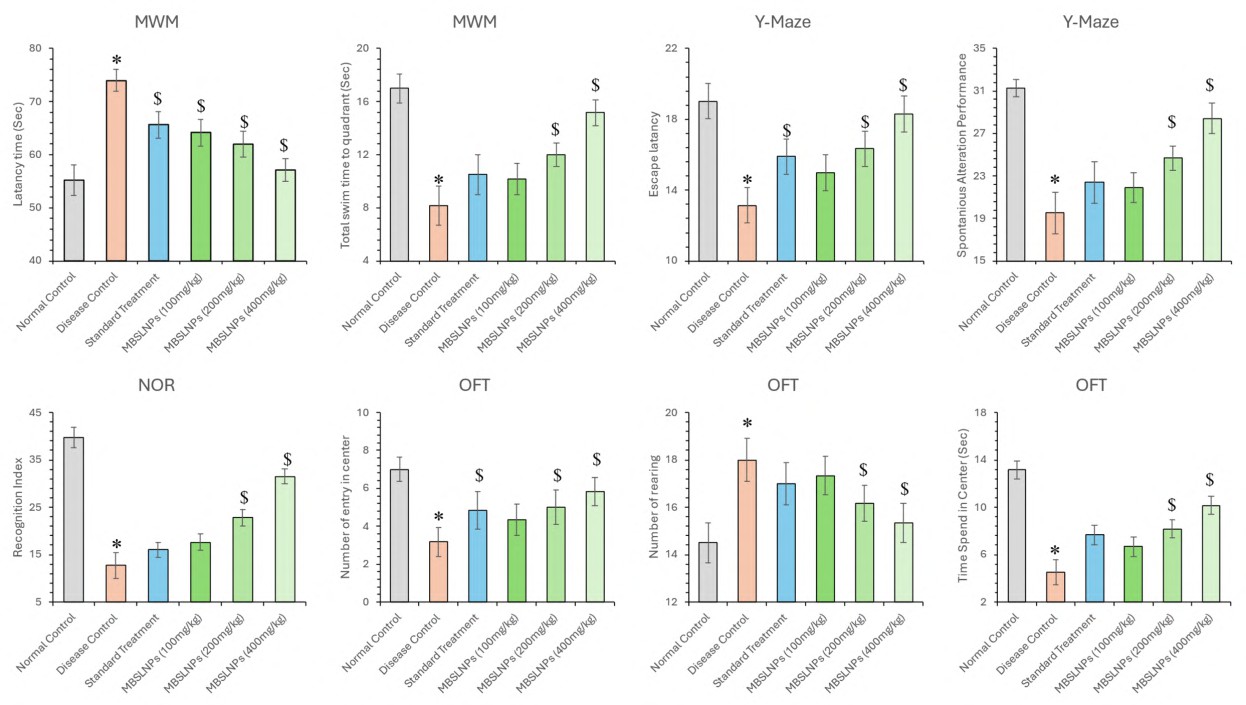
Fig. 9: Assessment of cognitive function in rats across multiple behavioural tests, including MWM, Y-Maze, NORT, and OFT All data were analysed using one-way ANOVA followed by Tukey’s multiple comparisons test and represented in mean±SD (n=6) where ‘*’ showed a significant difference (p<0.05) as compared with the normal control group and ‘$’ showed a significant difference (p<0.05) as compared with the disease control group
Metformin-treated rats showed partial improvements (centre time: 7.66±0.81 s; entries: 4.83±0.98). Additionally, rearing behaviour, an indicator of hyperactivity and neuronal dysfunction, was elevated in the disease control group (14.5±0.83; F₅,₃₀ = 14.730, p<0.05). MBSLNPs significantly reduced rearing counts across doses (17.33 to 15.33), with metformin showing a milder reduction (17.0±0.89) (fig. 9). Collectively, MBSLNPs exhibited robust, dose-dependent improvements in learning, memory, and exploratory behaviours, surpassing the effects of metformin, thereby demonstrating combined neuroprotective efficacy against hepatic-injury-induced diabetic AD.
Assessment of biochemical parameters
Estimation of glucose level, oxidative stress and inflammatory cytokines hyperglycaemia is a critical contributor to neurodegeneration through mechanisms such as brain insulin resistance, oxidative stress, and chronic inflammation. In this study, the AD model showed markedly elevated blood glucose levels (281.43±11.98 mg/dl) compared to normal controls (94.43±4.08 mg/dl) (F₅,₃₀ = 135.699, p<0.05). Whereas treatment with MBSLNPs at 100, 200, and 400 mg/kg significantly reduced glucose levels to 250.79±10.46, 164.42±8.60, and 134.48±10.85 mg/dl, respectively (fig. 10). Metformin treatment also showed a reduction (239.35±12.65 mg/dl), though less effective than MBSLNPs. Oxidative stress parameters, including SOD, GSH, Catalase (CAT) and MDA, were assessed. In diseased rats, levels of SOD (32.59±5.42 U/ml), GSH (2.22±0.47 U/ml), and CAT (16.78±2.22 U/ml) were significantly decreased compared to normal controls (83.12±7.49, 5.86±0.31, and 43.80±2.33 U/ml, respectively), whereas MDA levels were significantly elevated (5.98±0.26 vs. 2.04±0.15 nmol/ml) (F₅,₃₀ = 103.759–312.381, p<0.05). MBSLNPs treatment improved SOD (41.00±4.74 to 69.85±3.70 U/ml), GSH (2.73±0.37 to 4.01±0.30 U/ml), and CAT (20.23±1.68 to 37.09±1.08 U/ml), while significantly lowering MDA levels (4.07±0.16 to 2.16±0.24 nmol/ml), demonstrating enhanced antioxidant defence. Metformin also improved these markers but was less effective than the highest MBSLNP dose (fig. 10).
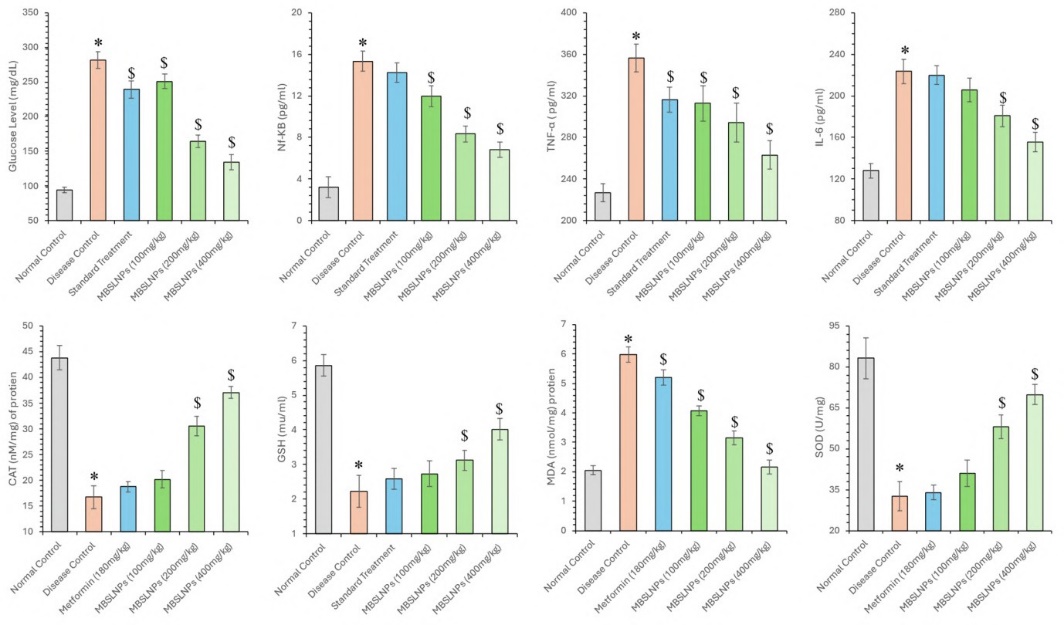
Fig. 10: A comprehensive biochemical assessment across different experimental groups, focusing on blood glucose levels, oxidative stress markers including SOD,GSH,CAT, MDA levels, and inflammatory cytokines including IL-6, TNF-α, and NF-κB. All data were analysed using one-way ANOVA followed by Tukey’s multiple comparisons test and represented in mean±SD (n=6) where ‘*’ showed a significant difference (p<0.05) as compared with the normal control group and ‘$’ showed a significant difference (p<0.05) as compared with the disease control group
Additionally, pro-inflammatory cytokines IL-6, TNF-α, and NF-κB were elevated in diseased control rats (223.5±11.92, 356.52±13.56, and 15.32±0.97 pg/ml, respectively) compared to normal controls (127.88±6.8, 226.68±8.58, and 3.2±0.98 pg/ml) (F₅,₃₀ = 59.986–160.464, p<0.05). MBSLNPs induced a dose-dependent reduction in IL-6 (205.58±11.21 to 155.51±9.5 pg/ml), TNF-α (312.81±17.12 to 263.03±13.58 pg/ml), and NF-κB (11.95±0.98 to 6.83±0.73 pg/ml). In contrast, metformin-treated rats showed less pronounced improvements (IL-6: 219.82±8.98, TNF-α: 316.13±12.03, NF-κB: 14.24±0.95 pg/ml) (fig. 10). These findings highlight the additive efficacy of MBSLNPs in regulating blood glucose, mitigating oxidative damage, and suppressing inflammatory responses in a diabetes-induced AD model, thereby supporting their neuroprotective and therapeutic potential.
Assessment of enzymatic level estimation of ALP, ALT, AST and AChE
The assessment of ALP, ALT, AST, and AChE serves as a critical indicator of liver-brain axis dysfunction, neuroinflammation, BBB compromise, and cholinergic disruption in AD. In the present study, the diseased control group exhibited significantly elevated levels of ALP (130.75±8.96 U/l), ALT (273.4±18.74 U/l), AST (215.97±10.45 U/l), and AChE (137.35±8.96 U/mg protein) compared to the normal control group (77.7±2.94, 162.49±6.15, 127.67±4.83, and 54±2.04, respectively), confirming pathological alterations associated with AD (F5,30 = 64.701, 91.454, 109.604, and 188.255; p<0.050). Treatment with MBSLNPs at escalating doses (100, 200, and 400 mg/kg) produced a dose-dependent and statistically significant reduction in these enzyme levels (fig. 11). ALP levels decreased to 119.12±4.96, 108.22±4.94, and 87.72±5.17; ALT to 261.3±7.4, 226.24±10.4, and 186.29±12.95; AST to 203.13±5.35, 187.8±8.13, and 146.13±10.39; and AChE to 130.65±4.07, 98.03±4.64, and 70.91±5.67 U/mg protein, respectively (p<0.050). The standard treatment group receiving metformin also showed significant improvement, though to a lesser extent, with ALP (121.34±8.6), ALT (254.31±7.66), AST (188.38±6.86), and AChE (128.22±8.71) levels reflecting partial recovery relative to disease metformin in restoring biochemical homeostasis control (fig. 11). The findings underscore the, reducing neuroinflammatory markers, and enhancing cholinergic function.
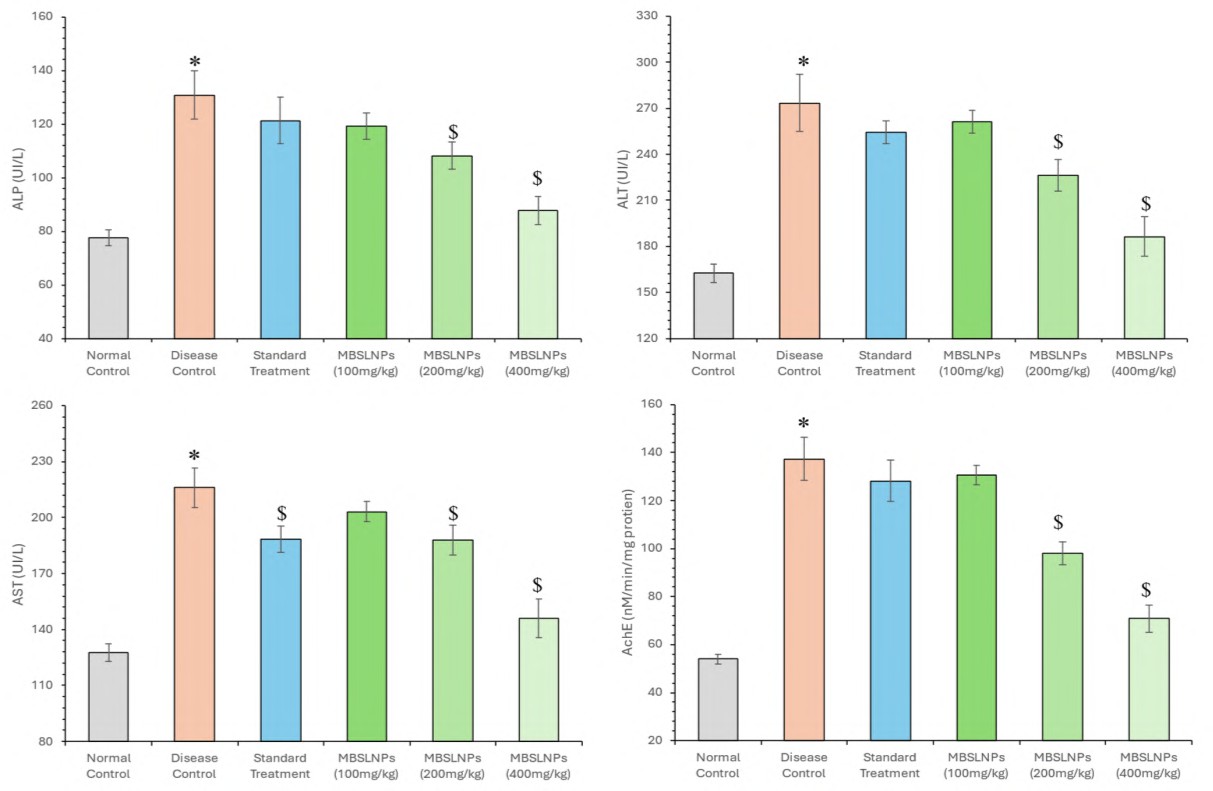
Fig. 11: Assessment of enzymatic levels including ALP, AST, ALT and AChE is shown in this figure. MBSLNPs treatment significantly reduces the elevated enzyme levels observed in the disease control group, indicating neuroprotective effects and improved metabolic function, data were analysed using one-way ANOVA followed by Tukey’s multiple comparisons test and represented in mean±SD (n=6) where ‘*’ showed a significant difference (p<0.05) as compared with the normal control group and ‘$’ showed a significant difference (p<0.05) as compared with the disease control group
Effect of MBSLNPs on amyloid burden and Ach levels in AD
Quantitative analysis of relative level of Aβ peptides and ACh levels revealed critical insights into cognitive impairment and the therapeutic efficacy of MBSLNPs. The disease control group showed a significant increase in Aβ-40 (1.42±0.06) and Aβ-42 (1.92±0.08) levels compared to the normal control (0.71±0.03 and 1.21±0.05, respectively), indicating enhanced amyloidogenic burden (F₅,₃₀ = 199.509 and 82.250; p<0.050). Treatment with MBSLNPs (100, 200, and 400 mg/kg) led to a dose-dependent reduction in relative level of Aβ-40 (1.15±0.05, 0.94±0.03, and 0.84±0.03) and relative level of Aβ-42 (1.47±0.04, 1.31±0.03, and 1.15±0.02), respectively (fig. 12). Metformin-treated animals exhibited a moderate decrease in relative level of Aβ-40 (1.3±0.06) and Aβ-42 (1.64±0.06), signifying less amyloid clearance. Furthermore, the disease control group demonstrated significantly reduced ACh levels (1.17±0.07), indicative of impaired cholinergic neurotransmission (F₅,₃₀ = 107.563; p<0.050). MBSLNP treatment significantly restored ACh in a dose-responsive manner (1.40±0.06, 1.75±0.07, and 1.93±0.05), while metformin produced a modest effect (1.61±0.10) (fig. 12). Collectively, the results highlight the combined neuroprotective potential of MBSLNPs compared to metformin, evidenced by attenuated amyloid deposition and enhanced cholinergic signalling.
Histopathological evaluation of hepatic and neural tissues
Histological analysis of liver tissue from the normal control group revealed well-preserved architecture, characterized by intact hepatic lobules, central veins, and organized hepatic cords. In contrast, the disease control group exhibited marked pathological changes, including hepatocyte swelling, portal infiltration with inflammatory cells, Kupffer cell activation, karyomegaly, bile duct dysplasia, and epithelial hyperplasia, which is an indicative of hepatic inflammation and damage. Remarkably, MBSLNP-treated groups demonstrated substantial restoration of liver histoarchitecture, with reduced cellular swelling and inflammatory infiltration (fig. 13). The normal control group displayed no abnormalities, confirming procedural neutrality.
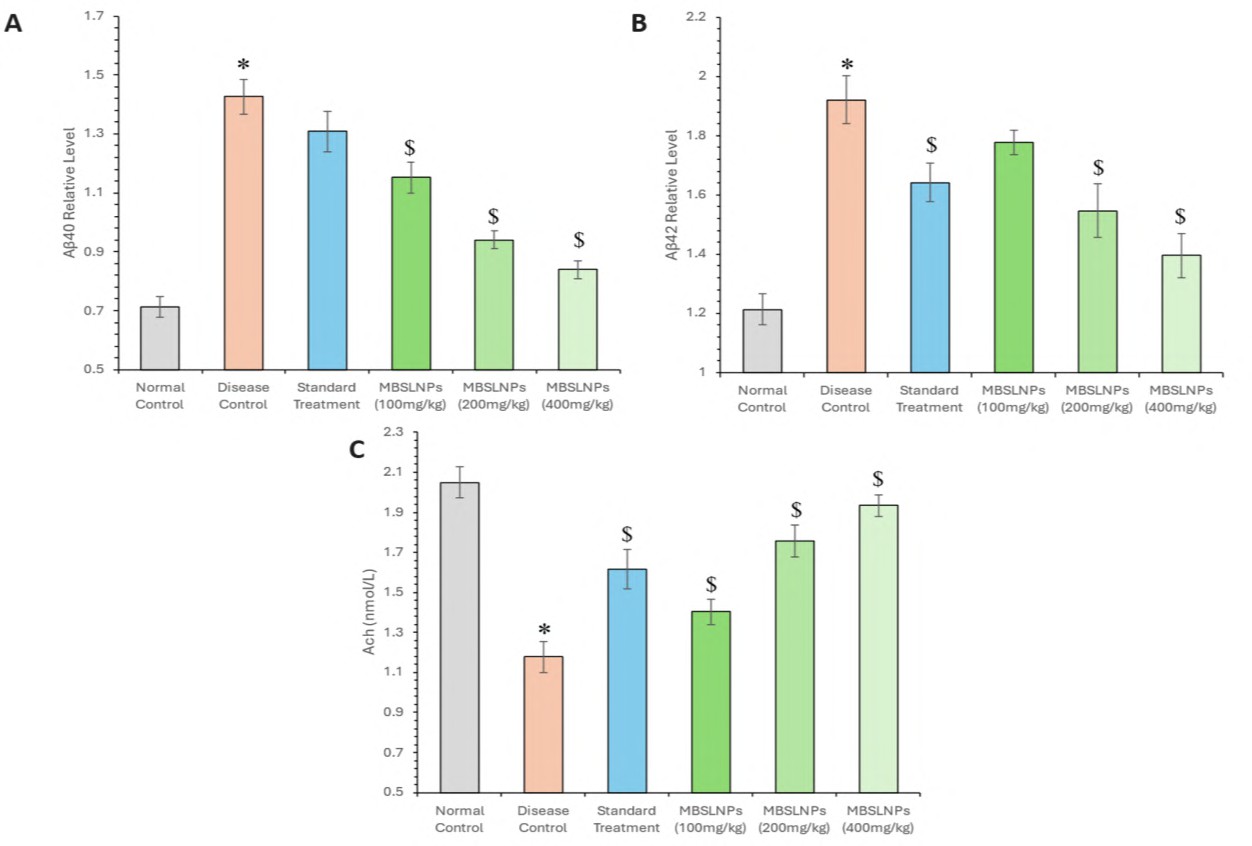
Fig. 12: Relative level of amyloid-beta (Aβ-40 and Aβ-42) levels alongside the assessment of acetylcholine (ACh) levels across different experimental groups and Metformin-Berberine Solid Lipid Nanoparticles (MBSLNPs) treatment. All data were analysed using one-way ANOVA followed by Tukey’s multiple comparisons test and represented in mean±SD (n=6) where ‘*’ showed a significant difference (p<0.05) as compared with the normal control group and ‘$’ showed a significant difference (p<0.05) as compared with the disease control group
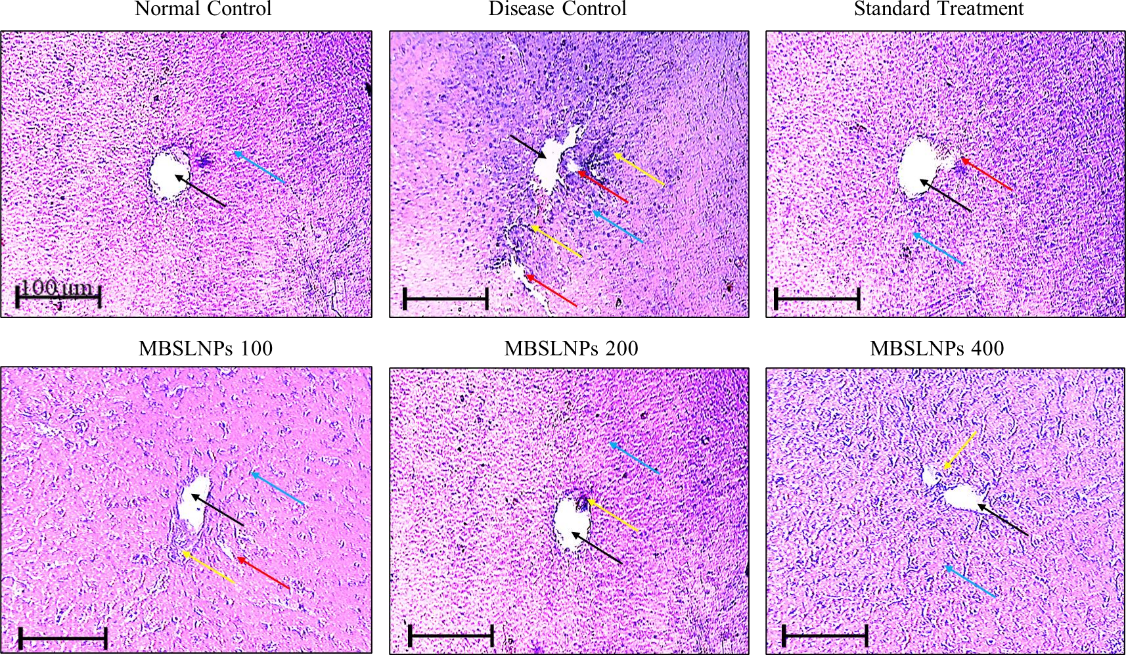
Fig. 13: Histopathological assessment of hepatic tissues across experimental groups. Liver sections from normal control showed intact hepatic lobules with central vein (black arrow) and hepatic cords (blue arrow). Disease control revealed hepatocyte swelling (red arrow) and portal infiltration (yellow arrow), indicating hepatic damage. MBSLNPs-treated groups exhibited restored hepatic architecture. Imaging was performed using Motic BA310 microscope at 100× magnification (scale bar = 100 µm). All assays were performed in triplicate and values are expressed as mean±SD (n=6)
Parallel analysis of brain sections showed similar trends. The normal control group displayed well-organized hippocampal CA1 layers with intact granule cells in the dentate gyrus, healthy neuronal morphology, and evenly distributed glial cells, devoid of amyloid plaques or neurofibrillary tangles. The disease control group exhibited severe cortical disorganization, neuronal shrinkage, apoptosis, extensive glial proliferation, and vacuolization, indicative of neurodegeneration (fig. 14).
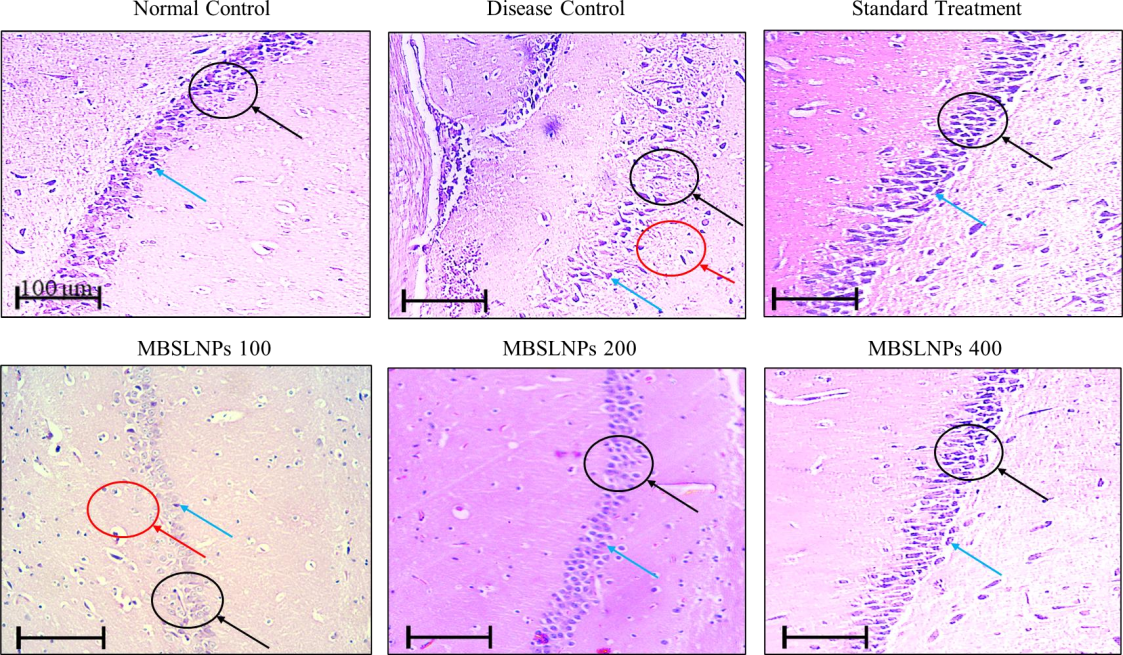
Fig. 14: Histopathological assessment of brain tissues across experimental groups. Brain sections from normal control showed organized hippocampal layers with intact granule cells (black arrow). Disease control exhibited vacuolization and neuronal death (red arrow) with glial proliferation (blue arrow). MBSLNP treatment markedly improved neuronal morphology and reduced degeneration. Imaging was performed using Motic BA310 microscope at 100× magnification (scale bar = 100 µm). All assays were performed in triplicate and values are expressed as mean±SD (n=6)
Treatment with MBSLNPs markedly improved neural histology that is evidenced by restored cortical architecture, decreased white matter vacuolations, fewer apoptotic cells, and reduced glial activation. Neurons retained structural integrity with visible nuclei, suggesting preserved cognitive function. Semi-quantitative histopathological scoring of neuronal loss and gliosis were performed to analyse the therapeutic impact of formulation (Supplementary table ST3).
Supplementary table ST3: Semi-quantitative histopathological scoring of neuronal loss and gliosis
| Group | Brain region | Neuronal loss (0–3) | Gliosis (0–3) | Representative severity grade |
| Normal control | Hippocampus | 0.0±0.0 | 0.0±0.0 | 0 |
| Disease control | Hippocampus | 2.8±0.2 | 2.6±0.3 | 3 |
| MBSLNPs (100 mg/kg) | Hippocampus | 1.8±0.4 | 1.6±0.5 | 2 |
| MBSLNPs (200 mg/kg) | Hippocampus | 1.2±0.3 | 1.0±0.4 | 1 |
| MBSLNPs (400 mg/kg) | Hippocampus | 0.6±0.2 | 0.5±0.3 | 1 |
| Normal control | Cortex | 0.0±0.0 | 0.0±0.0 | 0 |
| Disease control | Cortex | 2.5±0.3 | 2.4±0.4 | 3 |
| MBSLNPs (100 mg/kg) | Cortex | 1.6±0.5 | 1.4±0.4 | 2 |
| MBSLNPs (200 mg/kg) | Cortex | 1.0±0.4 | 0.8±0.3 | 1 |
| MBSLNPs (400 mg/kg) | Cortex | 0.4±0.2 | 0.3±0.2 | 0–1 |
Data are expressed as mean±SD (n = 6). Scores were assigned based on a 4-point scale: 0 = absent, 1 = mild, 2 = moderate, 3 = severe. Severity grade represents the predominant score observed in the group.
These findings collectively affirm the therapeutic efficacy of MBSLNPs in reversing disease-induced hepatic and neural damage. By preserving tissue integrity and attenuating inflammatory responses, MBSLNPs offer a promising strategy against systemic and neurodegenerative pathology in AD models.
DISCUSSION
The pre-formulation and characterization studies of the MBSLNPs yielded vital insights into the physicochemical and biopharmaceutical properties of the nano-formulation, setting a robust foundation for its therapeutic application. The crystalline nature, pale yellowish coloration, and herbal-amine odour of the blend were consistent with the intrinsic attributes of Metformin hydrochloride and Berberine hydrochloride, as previously reported [33, 34]. Their chemical resilience under thermal and photolytic stress conditions indicates preserved molecular integrity, a prerequisite for long-term stability and effective downstream processing. Solubility profiling distinctly revealed Metformin's hydrophilic nature and Berberine's lipophilic disposition, necessitating tailored solvent systems for effective co-encapsulation. These properties align with the biopharmaceutical classification system (BCS), categorizing Metformin as a Class III compound (high solubility, low permeability) and Berberine as a Class IV compound (low solubility, low permeability) [35, 36]. The experimentally determined Log P values (−0.368 for Metformin; 0.477 for Berberine) further substantiate their divergent polarity profiles, emphasizing the need for a dual-compartment delivery strategy to optimize absorption of both compounds [37, 38]. The acidic pKa values (2.8 for Metformin and 2.47 for Berberine) suggest both drugs predominantly exist in ionized forms at physiological pH, potentially limiting passive transcellular diffusion. Therefore, the nanoparticle-based delivery approach becomes critical, offering localized pH modulation and enhanced membrane permeability, which is validated in prior nanomedicine frameworks [39]. FTIR spectroscopic analysis confirmed the absence of significant physicochemical interactions between active pharmaceutical ingredients and excipients, suggesting excipient compatibility and preserving drug integrity which is an essential factor for formulation efficacy and stability [40] Morphological analyses using SEM and TEM revealed well-dispersed, spherical nanoparticles within a narrow size distribution (~85–102 nm), favouring mucosal adhesion and cellular uptake via endocytic pathways. A PDI of 0.3 indicates homogeneity in particle population, directly correlating with batch-to-batch reproducibility and predictable pharmacokinetic behavior [41, 42]. Moreover, the moderately high zeta potential (−29 mV) indicates substantial electrostatic repulsion among particles, minimizing aggregation and ensuring colloidal stability, a critical parameter for prolonged circulation time and sustained drug release. The superior fit of the First-Order model suggests that the release of Metformin and Berberine from MBSLNPs is concentration-dependent, aligning with typical diffusion-controlled release from lipid-based nanocarriers. The observed ‘n’ value of 0.43 in the Korsmeyer-Peppas model further supports Fickian diffusion as the dominant mechanism, consistent with the structural characteristics of SLNs. Collectively, these characterization findings rationalize the design of MBSLNPs as an efficient nanocarrier system, capable of overcoming solubility, permeability, and stability barriers associated with the co-delivery of hydrophilic and lipophilic agents, ultimately enhancing their bioavailability and therapeutic impact.
Additionally, the current investigation also validates a novel preclinical model of diabetic AD with hepatic injury, recapitulating key pathological features of the disease spectrum, including hyperglycaemia, neuroinflammation, oxidative stress, cognitive decline, and cholinergic dysfunction. The hepatotoxin–STZ–Aβ multi-hit paradigm is designed to reproduce overlapping systemic metabolic stressors, hepatic dysfunction, and amyloid burden within a constrained experimental timeframe. This multifactorial model effectively mimics the clinical phenotype of metabolic-associated cognitive impairment, thereby enhancing its translational relevance. Significantly elevated liver enzyme levels (ALT, AST) observed in the diseased cohort highlight hepatocellular injury and systemic inflammation, supporting the emerging liver–brain axis hypothesis in neurodegeneration. Hepatic dysfunction contributes to cognitive decline via proinflammatory cytokine spillover and disrupted glucose and lipid metabolism, a concept corroborated by accumulating clinical and experimental evidence linking non-alcoholic steatohepatitis, insulin resistance, and neurodegenerative outcomes [43]. This hepatic perturbation was absent in the standard AD group, suggesting added complexity in the model and reinforcing its utility in studying comorbid diabetes-associated neurodegeneration. Elevated levels of TNF-α and enhanced lipid peroxidation, along with decreased GPx activity, indicate a redox imbalance and a sustained proinflammatory state, especially in hippocampal and cortical tissues, which are the most vulnerable regions to neurodegeneration. These observations are consistent with the chronic inflammatory and oxidative stress-driven pathophysiology of AD [44]. Increased AChE activity further implies progressive cholinergic neuronal loss, one of the hallmarks of AD pathology [45]. Elevated systemic cytokines, impaired liver-mediated Aβ clearance, and altered metabolic signalling likely converge to exacerbate neurodegeneration. The inclusion of liver histology and cytokine data in this revision strengthens this mechanistic link.
Notably, MBSLNP treatment significantly ameliorated cognitive deficits, as evidenced by improved spatial and recognition memory in behavioural paradigms including the MWM, Y-maze, NORT, and OFT. These behavioural outcomes suggest restoration of synaptic plasticity and neurocognitive function, likely due to the formulation’s anti-inflammatory and antioxidative capacities. Mechanistically, MBSLNPs augmented endogenous antioxidant defenses, which can enhance the SOD, CAT, and GSH levels while mitigating lipid peroxidation. This dual effect is congruent with findings that nanoparticle-mediated delivery systems can potentiate antioxidant capacity and alleviate oxidative neurotoxicity in AD models [46, 47]. Concurrently, systemic hyperglycaemia and proinflammatory cytokines (IL-6, TNF-α, NF-κB) were markedly attenuated post-treatment, indicating potential insulin-sensitizing and immunomodulatory actions of the nano formulation. Although the improved cognitive and neurochemical outcomes in MBSLNP-treated groups strongly suggest enhanced brain delivery, this remains to be cautiously interpreted. The present data provides indirect evidence consistent with improved CNS availability, but definitive validation requires formal pharmacokinetic and biodistribution studies quantifying drug levels in plasma and discrete brain regions. This limitation has been explicitly acknowledged and prioritized for follow-up investigations. In the present study, MBSLNPs demonstrated significantly greater therapeutic efficacy compared to Metformin monotherapy in our neurodegeneration model. These improvements may reflect the additive pharmacological actions of Metformin and Berberine, as well as potential benefits of the SLN-based delivery system. These results extend previous reports, including those by Jakhmola Mani et al. (2023) [19], which showed that liver injury can aggravate neurodegeneration via systemic inflammation and impaired Aβ clearance. Our study adds to this body of evidence by demonstrating that dual drug-loaded SLNs can attenuate both hepatic and neural pathology, suggesting that peripheral metabolic modulation can confer central neuroprotective benefits. While the present dataset does not include a free Metformin+Berberine combination group, our findings provide an initial indication that nanoencapsulation could offer advantages in co-delivery and bioavailability. We recognize that the absence of this comparator limits definitive attribution of therapeutic benefit to the nanocarrier versus drug synergy alone. Dedicated comparative studies, including equivalent-dose free drug combinations, are currently underway and will be essential to disentangle these contributions. Our findings suggest potential for improved brain delivery, although dedicated pharmacokinetic and biodistribution studies are required to confirm BBB penetration and spatiotemporal drug distribution. Dedicated comparative studies, including equivalent-dose free drug combinations which are currently underway to confirm and extend these observations. Berberine’s reported AMPK activation and Metformin’s established anti-hyperglycaemic effects converge to provide a comprehensive neuroprotective effect [48]. Thus, our findings indicate an additive neuroprotective effect of Metformin and Berberine when co-delivered via SLNs, with improvements observed in behavioral outcomes, amyloid burden, and histopathological features. While formal synergy assessment (e. g., isobologram or combination index analysis) was not performed, the additive benefits observed are consistent with the complementary pharmacological profiles of the two agents. Future studies will systematically evaluate pharmacokinetics, biodistribution, free-drug comparators, and quantitative synergy analyses to strengthen translational claims.
CONCLUSION
In summary, the MBSLNP formulation exhibits favourable physicochemical, morphological, and pharmacological attributes that support its use as a robust nanocarrier for dual-drug delivery. The in vivo efficacy data further substantiate its therapeutic potential in a novel hepatic-injury-mediated diabetic AD model, underscoring its capacity to modulate metabolic, hepatic, and neurodegenerative pathways. While the present study provides indirect evidence of improved brain delivery, definitive pharmacokinetic and biodistribution studies remain necessary to confirm BBB targeting. Moreover, the lack of a free Metformin+Berberine comparator group is acknowledged as a limitation that will be addressed in ongoing work. These findings nevertheless advocate the translational promise of MBSLNPs as a next-generation, disease-modifying therapeutic platform for comorbid metabolic-neurodegenerative disorders.
ACKNOWLEDGEMENT
The authors also thank Dr. Ashok K Chauhan, Founder President, Ritanand Balved Educational Foundation, for the support. The guidance from Dr. Atul Chauhan, Chancellor, Amity
University Uttar Pradesh, Noida, India and Prof. (Dr.) Balvinder Shukla, Vice Chancellor, Amity University Uttar Pradesh, Noida, India is greatly appreciated.
AUTHORS CONTRIBUTIONS
Ravina Yadav: Conceptualization, Methodology, Writing – Original Draft. Ruchi Jakhmola Mani: Writing – Review and Editing. Arun K. Sharma: Investigation, Visualization. Ashish Kumar: Investigation, Visualization. Deepshikha Pande Katare: Conceptualization, Validation, Formal Analysis, Project administration.
CONFLICT OF INTERESTS
The author declared no conflict of interest
REFERENCES
Bacsu JD, Mah JC, Jamali AA, Conanan C, Lautrup S, Berger C. Stigma of dementia on social media during world Alzheimer’s awareness month: thematic analysis of posts. JMIR Form Res. 2025 Jun 2;9(1):e72775. doi: 10.2196/72775, PMID 40456118.
Kciuk M, Kruczkowska W, Galeziewska J, Wanke K, Kaluzinska Kolat Z, Aleksandrowicz M. Alzheimer’s disease as type 3 diabetes: understanding the link and implications. Int J Mol Sci. 2024 Nov 7;25(22):11955. doi: 10.3390/ijms252211955, PMID 39596023.
Meng X, Zhang H, Zhao Z, Li S, Zhang X, Guo R. Type 3 diabetes and metabolic reprogramming of brain neurons: causes and therapeutic strategies. Mol Med. 2025 Feb 18;31(1):61. doi: 10.1186/s10020-025-01101-z, PMID 39966707.
Li X, Song D, Leng SX. Link between type 2 diabetes and Alzheimer’s disease: from epidemiology to mechanism and treatment. Clin Interv Aging. 2015 Mar 10;10:549-60. doi: 10.2147/CIA.S74042, PMID 25792818.
Cheon SY, Song J. Novel insights into non-alcoholic fatty liver disease and dementia: insulin resistance hyperammonemia gut dysbiosis vascular impairment and inflammation. Cell Biosci. 2022 Jun 28;12(1):99. doi: 10.1186/s13578-022-00836-0, PMID 35765060.
Bosoi CR, Vandal M, Tournissac M, Leclerc M, Fanet H, Mitchell PL. High-fat diet modulates hepatic amyloid β and cerebrosterol metabolism in the triple transgenic mouse model of Alzheimer’s disease. Hepatol Commun. 2021 Mar;5(3):446-60. doi: 10.1002/hep4.1609, PMID 33681678.
Rani A, Zia Ul Sabah F, Tabassum F, Sharma AK. Molecular interplay between phytoconstituents of Ficus racemosa and neurodegenerative diseases. Eur J Neurosci. 2024 Apr;59(7):1833-47. doi: 10.1111/ejn.16250, PMID 38217338.
Nishida Y. Labile Iron controllng therapy to prevent cancers and Alzheimer’s disease. Int J Chem. 2025;17(2):77. doi: 10.5539/ijc.v17n2p77.
Onyango IG, Jauregui GV, Carna M, Bennett JR JP, Stokin GB. Neuroinflammation in Alzheimer’s disease. Biomedicines. 2021 May 7;9(5):524. doi: 10.3390/biomedicines9050524, PMID 34067173.
Adamu A, Li S, Gao F, Xue G. The role of neuroinflammation in neurodegenerative diseases: current understanding and future therapeutic targets. Front Aging Neurosci. 2024 Apr 12;16:1347987. doi: 10.3389/fnagi.2024.1347987, PMID 38681666.
Sharma AK, Taneja G, Khanna D, Rajput SK. Reactive oxygen species: friend or foe? RSC Adv. 2015;5(71):57267-76. doi: 10.1039/C5RA07927F.
Grossberg GT. Cholinesterase inhibitors for the treatment of Alzheimer’s disease: getting on and staying on. Curr Ther Res Clin Exp. 2003 Apr 1;64(4):216-35. doi: 10.1016/S0011-393X(03)00059-6, PMID 24944370.
Aderinto N, Olatunji G, Abdulbasit M, Ashinze P, Faturoti O, Ajagbe A. The impact of diabetes in cognitive impairment: a review of current evidence and prospects for future investigations. Medicine. 2023 Oct 27;102(43):e35557. doi: 10.1097/MD.0000000000035557, PMID 37904406.
Bian X, Guo Q, Yau LF, Yang L, Wang X, Zhao S. Berberine-inspired ionizable lipid for self-structure stabilization and brain targeting delivery of nucleic acid therapeutics. Nat Commun. 2025 Mar 10;16(1):2368. doi: 10.1038/s41467-025-57488-0, PMID 40064874.
Li Z, Geng YN, Jiang JD, Kong WJ. Antioxidant and anti‐inflammatory activities of berberine in the treatment of diabetes mellitus. Evid Based Complement Alternat Med. 2014;2014(1):289264. doi: 10.1155/2014/289264, PMID 24669227.
Li N, Zhou T, Fei E. Actions of metformin in the brain: a new perspective of metformin treatments in related neurological disorders. Int J Mol Sci. 2022 Jul 27;23(15):8281. doi: 10.3390/ijms23158281, PMID 35955427.
Satapathy MK, Yen TL, Jan JS, Tang RD, Wang JY, Taliyan R. Solid lipid nanoparticles (SLNs): an advanced drug delivery system targeting brain through BBB. Pharmaceutics. 2021 Jul 31;13(8):1183. doi: 10.3390/pharmaceutics13081183, PMID 34452143.
Fakhri S, Abdian S, Zarneshan SN, Moradi SZ, Farzaei MH, Abdollahi M. Nanoparticles in combating neuronal dysregulated signaling pathways: recent approaches to the nanoformulations of phytochemicals and synthetic drugs against neurodegenerative diseases. Int J Nanomedicine. 2022 Jan 1;17:299-331. doi: 10.2147/IJN.S347187, PMID 35095273.
Jakhmola Mani R, Dogra N, Katare DP. The connection between chronic liver damage and sporadic Alzheimer’s disease: evidence and insights from a rat model. Brain Sci. 2023 Sep 29;13(10):1391. doi: 10.3390/brainsci13101391, PMID 37891760.
Sharma AK, Kumar A, Kumar S, Mukherjee S, Nagpal D, Nagaich U. Preparation and therapeutic evolution of Ficus benjamina solid lipid nanoparticles against alcohol abuse/Antabuse induced hepatotoxicity and cardio-renal injury. RSC Adv. 2017;7(57):35938-49. doi: 10.1039/C7RA04866A.
Magdum SV, Shirote PJ. Formulation and evaluation of candesartan cilexetil nanosuspension for oral drug delivery system. Int J Pharm Sci Drug Res. 2025 Mar;17(2):159-68. doi: 10.25004/IJPSDR.2025.170206.
Bhatt F, Patel D. Fabrication and screening of solid lipid nanoparticles-loaded microneedle patch for polycystic ovary syndrome treatment. Asian J Pharm Clin Res. 2025 Jul;18(7):109–14. doi: 10.22159/ajpcr.2025v18i7.54740.
Deep A, Verma M, Marwaha RK, Sharma AK, Kumari B. Development characterization and anticancer evaluation of silver nanoparticles from Dalbergia sissoo leaf extracts. Curr Cancer Ther Rev. 2020 Jun 1;16(2):145-51. doi: 10.2174/1573394715666190820150651.
Shallie OF, Mabandla MV. Amyloid-beta (1-42) lesion of CA1 rat dorsal hippocampus reduces contextual fear memory and increases expression of microglial genes regulating neuroinflammation. Behav Brain Res. 2020 Sep 1;393:112795. doi: 10.1016/j.bbr.2020.112795, PMID 32619564.
Xuan WT, Wang H, Zhou P, Ye T, Gao HW, Ye S. Berberine ameliorates rats model of combined Alzheimer’s disease and type 2 diabetes mellitus via the suppression of endoplasmic reticulum stress. 3 Biotech. 2020 Aug;10(8):359. doi: 10.1007/s13205-020-02354-7, PMID 32832321.
Kokani H, Sawant P, Sonawane P, Kakade R. Herbal therapies for liver diseases: an overview. Int J Pharm Pharm Sci. 2025;7(1):140-4. doi: 10.33545/26647222.2025.v7.i1b.163.
Wang L, Liu W, Fan Y, Liu T, Yu C. Effect of rosiglitazone on amyloid precursor protein processing and Aβ clearance in streptozotocin-induced rat model of Alzheimer’s disease. Iran J Basic Med Sci. 2017 May;20(5):474-80. doi: 10.22038/IJBMS.2017.8669, PMID 28656081.
Hoffman JL, Faccidomo S, Kim M, Taylor SM, Agoglia AE, May AM. Alcohol drinking exacerbates neural and behavioral pathology in the 3xTg-AD mouse model of Alzheimer’s disease. Int Rev Neurobiol. 2019 Jan 1;148:169-230. doi: 10.1016/bs.irn.2019.10.017, PMID 31733664.
Cınar E, Mutluay SU, Baysal I, Gultekinoglu M, Ulubayram K, Ciftci SY. Donepezil-loaded PLGA-b-PEG nanoparticles enhance the learning and memory function of beta-amyloid rat model of Alzheimer’s disease. Noro Psikiyatr Ars. 2022;59(4):281-9. doi: 10.29399/npa.28275, PMID 36514517.
Kumari N, Mittal A, Rana A, Sharma AK. Callistemon viminalis extracts: dual action on anxiety and neuroprotection via neuroinflammatory and serotonergic pathways. Neurosci Behav Physiol. 2025 Jan;55(1):61-73. doi: 10.1007/s11055-024-01748-x.
Sharma V, Singh J, Kumar Y, Kumar A, Venkatesan K, Mukherjee M. Integrated insights into gene expression dynamics and transcription factor roles in diabetic and diabetic-infectious wound healing using rat model. Life Sci. 2025 May 1;368:123508. doi: 10.1016/j.lfs.2025.123508, PMID 40015667.
Lakshmi VV. Formulation and evaluation of polyherbal cream. Int J Pharm Pharm Sci. 2025 Aug 16;7(2):36-42. doi: 10.33545/26647222.2025.v7.i2a.191.
Corti G, Capasso G, Maestrelli F, Cirri M, Mura P. Physical–chemical characterization of binary systems of metformin hydrochloride with triacetyl-β-cyclodextrin. J Pharm Biomed Anal. 2007 Nov 5;45(3):480-6. doi: 10.1016/j.jpba.2007.07.018, PMID 17822867.
Battu SK, Repka MA, Maddineni S, Chittiboyina AG, Avery MA, Majumdar S. Physicochemical characterization of berberine chloride: a perspective in the development of a solution dosage form for oral delivery. AAPS PharmSciTech. 2010 Sep;11(3):1466-75. doi: 10.1208/s12249-010-9520-y, PMID 20842541.
Cheng CL, Yu LX, Lee HL, Yang CY, Lue CS, Chou CH. Biowaiver extension potential to BCS class III high solubility-low permeability drugs: bridging evidence for metformin immediate-release tablet. Eur J Pharm Sci. 2004 Jul 1;22(4):297-304. doi: 10.1016/j.ejps.2004.03.016, PMID 15196586.
Solnier J, Zhang Y, Kuo YC, Du M, Roh K, Gahler R. Characterization and pharmacokinetic assessment of a new berberine formulation with enhanced absorption in vitro and in human volunteers. Pharmaceutics. 2023 Nov 1;15(11):2567. doi: 10.3390/pharmaceutics15112567, PMID 38004546.
Metry M, Shu Y, Abrahamsson B, Cristofoletti R, Dressman JB, Groot DW. Biowaiver monographs for immediate release solid oral dosage forms: metformin hydrochloride. J Pharm Sci. 2021 Apr 1;110(4):1513-26. doi: 10.1016/j.xphs.2021.01.011, PMID 33450218.
Narade S, Pore Y. Optimization of ex vivo permeability characteristics of berberine in presence of quercetin using 32 full factorial design. J App Pharm Sci. 2019 Feb 4;9(1):73-82. doi: 10.7324/JAPS.2019.90111.
Kurul F, Turkmen H, Cetin AE, Topkaya SN. Nanomedicine: how nanomaterials are transforming drug delivery, bio-imaging and diagnosis. Next Nanotechnol. 2025 Jan 1;7:100129. doi: 10.1016/j.nxnano.2024.100129.
Rojek B, Wesolowski M. Fourier transform infrared spectroscopy supported by multivariate statistics in compatibility study of atenolol with excipients. Vib Spectrosc. 2016 Sep 1;86:190-7. doi: 10.1016/j.vibspec.2016.07.011.
Thuan ND, Cuong HM, Nam NH, Lan Huong NT, Hong HS. Morphological analysis of Pd/C nanoparticles using SEM imaging and advanced deep learning. RSC Adv. 2024;14(47):35172-83. doi: 10.1039/D4RA06113F, PMID 39502866.
George IE, Cherian T, Ragavendran C, Mohanraju R, Dailah HG, Hassani R. One-pot green synthesis of silver nanoparticles using brittle star Ophiocoma scolopendrina: assessing biological potentialities of antibacterial antioxidant anti-diabetic and catalytic degradation of organic dyes. Heliyon. 2023 Mar 1;9(3):e14538. doi: 10.1016/j.heliyon.2023.e14538, PMID 36967974.
De La Monte SM, Longato L, Tong M, Wands JR. Insulin resistance and neurodegeneration: roles of obesity type 2 diabetes mellitus and non-alcoholic steatohepatitis. Curr Opin Investig Drugs. 2009 Oct;10(10):1049-60. PMID 19777393.
Gomes BA, Santos SM, Gato LD, Espindola KM, Silva RK, Davis K. Alpha-lipoic acid reduces neuroinflammation and oxidative stress induced by dapsone in an animal model. Nutrients. 2025 Feb 25;17(5):791. doi: 10.3390/nu17050791, PMID 40077661.
Chen ZR, Huang JB, Yang SL, Hong FF. Role of cholinergic signaling in Alzheimer’s disease. Molecules. 2022 Mar 10;27(6):1816. doi: 10.3390/molecules27061816, PMID 35335180.
Abd Elmonem HA, Morsi RM, Mansour DS, El Sayed ER. Myco-fabricated ZnO nanoparticles ameliorate neurotoxicity in mice model of Alzheimer’s disease via acetylcholinesterase inhibition and oxidative stress reduction. Biometals. 2023 Dec;36(6):1391-404. doi: 10.1007/s10534-023-00525-6, PMID 37556014.
Singhal A, Morris VB, Labhasetwar V, Ghorpade A. Nanoparticle-mediated catalase delivery protects human neurons from oxidative stress. Cell Death Dis. 2013 Nov;4(11):e903. doi: 10.1038/cddis.2013.362, PMID 24201802.
Kodi T, Praveen S, Paka SK, Sankhe R, Gopinathan A, Krishnadas N. Neuroprotective effects of metformin and berberine in lipopolysaccharide-induced sickness-like behaviour in mice. Adv Pharmacol Pharm Sci. 2024;2024(1):8599268. doi: 10.1155/2024/8599268, PMID 39346967.