
Int J App Pharm, Vol 18, Issue 1, 2026, 479-492Original Article
ESTIMATION OF TRACE LEVEL OF N-NITROSO FLUOXETINE IMPURITY IN FLUOXETINE CAPSULES BY LC-MS/MS
BHUPINDER KUMAR, RAJU MUDHULKAR*, DAMA VENUGOPALA RAO, SATEESH SINGH LODHI
1,2Department of Chemistry, Koneru Lakshmaiah Education Foundation, Bowrampet, Hyderabad-500043, Telangana, India. 3,4Dr. Reddy’s Laboratories Ltd, IPDO, Hyderabad-500090, India
*Corresponding author: Raju Mudhulkar; *Email: m.raju@klh.edu.in
Received: 26 Jul 2025, Revised and Accepted: 04 Nov 2025
ABSTRACT
Objective: Nitrosamine impurities, particularly nitrosamine drug substance-related impurities (NDSRIs), have gained focus in recent past due to their carcinogenic potential. Due to the low sensitivity of conventional techniques like high-performance liquid chromatography (HPLC) and gas chromatography (GC), the exact levels of these impurities could not be determined. This study aims to develop and validate a sensitive liquid chromatography hyphenated with mass spectrometry (LC-MS/MS) method to estimate the trace levels of N-Nitroso fluoxetine (a fluoxetine-related NDSRI) in fluoxetine capsules (60 mg).
Methods: We developed a sensitive and selective LC-MS/MS method for the quantification of trace levels of N-Nitroso fluoxetine in fluoxetine capsules (60 mg) using the AB Sciex 5500+quadrupole ion trap (QTRAP) LC-MS/MS system. To achieve the maximum response at quantitation level for N-Nitroso fluoxetine impurity, chromatographic conditions optimized by selecting a specific combination of column, mobile phase, and diluent. Mobile Phase A and B consisted of 10 mmol ammonium acetate buffer and methanol, respectively. Waters X-Bridge C18 column (250 × 4.6 mm, 3.5 μm, Part No. 186003943) at temperature 40 °C and mobile phase flow rate to 0.5 ml/min has yielded consistent results by employing an optimized gradient elution program (Tmin/%B): 0/75, 2/75, 16/95, 28/98, 28.1/75, and 35/75 for the analysis. To further maximize the response of the N-Nitroso fluoxetine impurity, the multiple ion reaction monitoring (MRM) mass spectrometry method in positive electron spray ionization (ESI) mode is preferred over single ion monitoring (SIM) method.
Results: The newly developed method is validated by performing parameters such as specificity, method precision, intermediate precision, detection limit, quantitation limit, linearity, and accuracy in accordance with the international conference on harmonization (ICH Q2 (R1)) Guidelines. Limit of detection (LOD) and limit of quantitation (LOQ) are established as 0.06 ppm and 0.11 ppm, respectively. The method is found capable to demonstrate accuracy, precision, and linearity across the range of 0.11 to 1.68 ppm (10% to 150% of the specification), where linearity study shows the correlation coefficient (r²) greater than 0.99 for linearity plot between concentration and area. Recovery data at 10%, 50%, 100%, and 150% of the specification levels indicates that the recovered impurity content observed between 80% and 120%. Based on these results, we have successfully established the method for batch analysis of fluoxetine capsules (60 mg).
Conclusion: A new rapid and sensitive reverse-phase ultra-high-performance liquid chromatographic (UHPLC) method coupled with a mass spectrometry detector has been developed and validated for the estimation of N-Nitroso fluoxetine impurity in fluoxetine capsules. Method validation is accomplished according to the ICH Q2 (R1) guidelines, assessing parameters such as limit of detection, limit of quantitation, accuracy, precision, and linearity. We found the method suitable for its intended use and successfully applied it to test batches of the fluoxetine capsules drug product.
Keywords: Nitrosamine, NDSRI, Fluoxetine capsules, N-Nitroso fluoxetine, Liquid chromatography, Mass spectrometry, Multiple ion reaction monitoring
© 2026 The Authors. Published by Innovare Academic Sciences Pvt Ltd. This is an open access article under the CC BY license (https://creativecommons.org/licenses/by/4.0/)
DOI: https://dx.doi.org/10.22159/ijap.2026v18i1.56278 Journal homepage: https://innovareacademics.in/journals/index.php/ijap
INTRODUCTION
Fluoxetine is a United States food and drug administration (USFDA) approved medication due to its efficacy in treating a spectrum of psychological conditions like major depressive disorder, obsessive-compulsive disorder, panic disorder, bulimia, binge eating disorder, premenstrual dysphoric disorder, and bipolar depression, including cases of treatment-resistant depression when combined with olanzapine [1-3]. Chemical name of fluoxetine (fig. 1) is N-methyl-3-phenyl-3-(4-(trifluoromethyl)phenoxy)propan-1-amine.
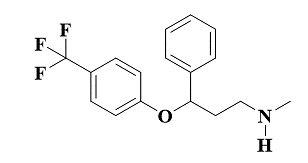
Fig. 1: Structure of fluoxetine
Regulatory authorities have identified nitrosamine impurity contamination in medicinal products as a critical safety concern, classifying it under the “Cohort of Concern” in the ICH M7 guidelines [4]. Since 2018, manufacturers have recalled several drug products including sartan, ranitidine, and metformin due to nitrosamine levels exceeding the acceptable intake limits [5–7]. The USFDA recently disclosed that nitrosamine impurities (NDSRIs) can form when nitrosating agents (such as nitrite impurities in excipients at parts-per-million levels) react with secondary or tertiary amines during manufacturing, storage, or through raw materials and intermediates containing residual nitrosamines [8–11]. Regulatory bodies, including the USFDA, ICH, and European Medicines Agency (EMA) have proposed limits for specific NDSRIs using the Carcinogenic Potency Categorization Approach (CPCA) [12-13], for active pharmaceutical ingredients (APIs) that hypothetically could be at risk of forming such NDSRIs. Fluoxetine has the potential to form a N-Nitroso fluoxetine (NDSRI). USFDA has published the acceptable intake (AI) of 100ng/day [14] and considering maximum daily dose (MDD) of 89.44 mg for fluoxetine HCl, the limit of N-Nitroso fluoxetine is calculated as 1.12 ppm (AI (ng/day)/MDD (mg) [15]. Fig. 2 illustrates the pathway for N-nitrosamine formation in both drug substances and drug products [16].
MATERIALS AND METHODS
Chemicals and reagents
High purity LCMS grade solvents and chemical were used in the analysis. Water (Grade – ULC/MS, Catalogue Number-002314104BS), procure from Biosolve chemicals, Acetonitrile (Grade – ULC/MS, Catalogue Number-0001204104BS) procured from Biosolve Chemicals, Methanol (Grade – ULC/MS, Catalogue Number-0013684104BS) procured from Biosolve chemicals, Formic acid (99%, LC-MS grade, Catalogue Number-0006914144BS) procured from Biosolve chemicals, Ammonium acetate (Grade – ULC/MS, Catalogue Number – 0001244156BS) and Isopropyl alcohol (Grade – HPLC, Catalogue Number – P0790) procured from Rankem.
We obtained the impurity standard of N-Nitroso fluoxetine from SynZeal Research Pvt Ltd, Ahmedabad, Gujarat (India). For the study, we have used the fluoxetine capsules (60 mg) drug product manufactured in-house by Dr. Reddy’s Laboratories.
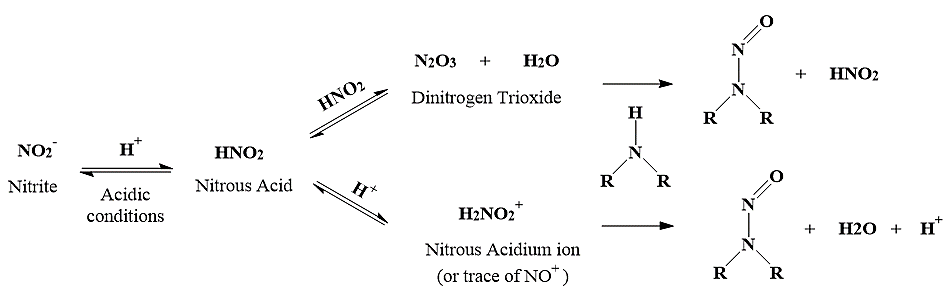
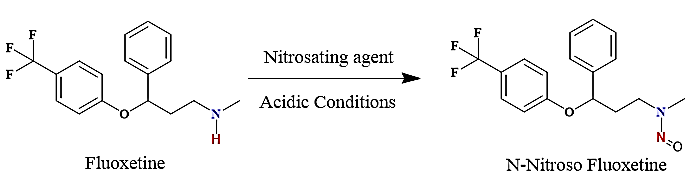
Fig. 2: The mechanism for the formation of N-Nitroso fluoxetine from fluoxetine
Instruments and equipment
Waters X-Bridge C18 column, 250*4.6 mm, 3.5μm (Part No. 186003943) column is used in the study. The liquid chromatographic system used in the study consist of Sciex Exion LC (USA) (Pump, Part No: 5036653, Degasser, Part no: 5036646, Auto sampler-Part no; 5036654, Column oven, Part no: 5036660 and PDA detector-5036657). AB Sciex 5500+QTRAP LC-MS/MS instrument in conjunction with Sciex Exion LC with was used for mass spectrometric analysis and data processing (Analyst software with version 1.7.3).
Mobile phase preparation
Mobile Phase A: Weighed 1.54 gm of Ammonium acetate and transferred to 2000 ml of water, mixed well and sonicated for 5 min to degas (10 mmol Ammonium acetate buffer).
Mobile phase B: 100% Methanol.
Diluent
Methanol used as a diluent.
Preparation of standard stock solution-1
Weighed 11.27 mg of N-Nitroso fluoxetine Impurity (Potency-99.41%) accurately and transferred to 50 ml volumetric flask containing 20 ml of methanol. Dissolved impurity in the solution by 2 min sonication and volume made up to 50 ml with methanol.
Preparation of standard stock solution-2
Transferred 1.0 ml of impurity standard stock solution-1 to 20 ml volumetric flask and volume made up to 20 ml with Methanol.
Preparation of final standard solution (1.12 ppm wrt sample concentration)
Transferred 1.0 ml of impurity standard stock solution-2 to 20 ml volumetric flask and volume made up to 20 ml with Methanol.
Preparation of LOQ standard solution (0.11 ppm wrt sample concentration)
Transferred 1.0 ml of impurity final standard solution to 10 ml volumetric flask and volume made up to 10 ml with Methanol.
Preparation of LOD standard solution (0.06 ppm wrt sample concentration)
Transferred 0.5 ml of impurity final standard solution to 10 ml volumetric flask and volume made up to 10 ml with Methanol.
Preparation of test sample Solution (0.5 mg/ml)
The average weight of one fluoxetine capsules (60 mg) was calculated as 440 mg by weighing the powder obtained from 20 capsules. To prepare a sample solution of 0.5 mg/ml of fluoxetine API, 183 mg of fluoxetine capsules powder (equivalent to 0.5 mg/ml of fluoxetine API) weighed and transferred to a 50 ml volumetric flask containing 15 ml of methanol. This sample solution vortexed for 2 min at 1000 rpm followed by 2 min sonication to dissolve fluoxetine API in the methanol and volume made up to 50 ml with diluent. After filtering through a 0.22 μm PVDF filter, the resulting sample solution transferred to HPLC vial and injected to LC-MS/MS system for the analysis.
Procedure
We injected the diluent once, followed by six injections of the standard solution and one injection of the test solution into the LC-MS/MS system, then recorded the peak responses to calculate the impurity content in the sample.
Liquid chromatographic conditions
We used a Waters X-Bridge C18 column (250 × 4.6 mm, 3.5 μm; Part No. 186003943) to achieve chromatographic separation of the N-Nitroso fluoxetine impurity from the fluoxetine peak. We maintained the column compartment temperature at 40 °C and fixed the sampler temperature at 5 °C. Mobile Phase A consisted of a 10 mmol ammonium acetate buffer, while Mobile Phase B was methanol. By setting the mobile phase flow rate to 0.5 ml/min and using an injection volume of 5 µl**, we observed improved peak shape for the N-Nitroso fluoxetine impurity. To enhance the impurity response and ensure effective separation, we applied an optimized gradient program: Tmin/%B – 0/75, 2/75, 16/95, 28/98, 28.1/75, and 35/75. We allowed the column to stabilize at the initial conditions for 6.9 min, from 28.1 to 35 min.
LC-MS/MS conditions
We used the AB Sciex 5500+QTRAP LC-MS/MS instrument with Analyst software version 1.7.3 to develop and validate the method. We preferred Electrospray Ionization (ESI) mode in positive polarity over atmospheric pressure chemical ionization (APCI) mode due to better ionization and response for the N-Nitroso fluoxetine impurity. The LC-MS/MS parameters were set as follows: dwell time 500 ms, curtain gas 40 psi, collision gas (CAD) 7 psi, ion spray voltage (IS) 5500 V, temperature 500 °C, and ion source gases GS1 and GS2 at 50 psi each. We used MRM mode with a parent ion of m/z 339.1 and a product ion of m/z 177.1 to quantify N-Nitroso fluoxetine in fluoxetine capsules. To achieve optimal response, we selected compound-specific MS parameters as follows: collision energy (CE) 13 V, collision cell exit potential (CXP) 10 V, declustering potential (DP) 75 V, and entrance potential (EP) 10 V.
Multiple ion reaction monitoring principle
In MRM experiments using tandem mass spectrometry with a triple quadrupole (QqQ) mass analyzer, the first mass analyzer (Q1) transmits ions with a specific mass-to-charge ratio (m/z), selecting intact ions of the target analyte known as precursor ions. These precursor ions enter the collision-induced dissociation (CID) cell (Q2), where they collide with neutral gas at a controlled pressure, producing fragment ions of the analyte. The third mass analyzer (Q3) then selectively transmits the high-intensity fragment ions. These transmitted ions reach the ion detector, which records their signals as an ion chromatogram corresponding to the precursor-fragment (Q1 → Q3) ion pair. The corresponding m/z pairs called gas-phase transitions in MRM mass experiments [17-19]. Fig. 3 illustrates the general MRM setup used in mass spectrometry.
System suitability
We established system suitability to confirm that the analytical instrument is fit for its intended use. To assess this, injected six replicates of a freshly prepared standard solution (at 100% level) from the same HPLC vial. Following formula is used to calculate the impurity content in ppm.
Impurity Content (ppm) = x
x x
x x
x x
x x106
x106
Where
| A spl. | = | Area of the analyte peak in the sample solution |
| A std. | = | Average area (n = 6) of the analyte peak from the six consecutive injections of the standard solution |
| Wt. std. | = | Weight of impurity taken for standard preparation. |
| Wt. spl | = | Weight of the sample |
| Spl Dil. | = | Sample dilution |
| Av. wt. | = | Average weight of capsules |
| L | = | Label Claim of fluoxetine capsules |
| P | = | Purity or Potency of the impurity |
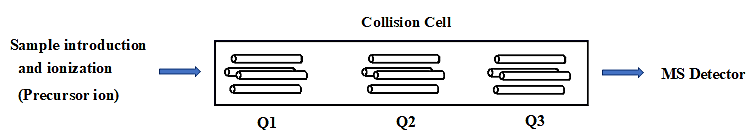
Fig. 3: Mass spectrometry general setup and MRM principle (Triple quadrupole MS), Q1: Selective transmission of ions for specific precursor ion (First mass analyzer), Q2: MSMS fragmentation of Precursor ion in collision cell in the presence of neutral gas, Q3: Selective transmission of fragment ion (Second mass analyzer)
Specificity
The ability of an analytical technique to reliably detect an analyte in the presence of other components, such as synthetic precursors, excipients, enantiomers, and known (or predicted) degradation products that may be anticipated to be present in the sample matrix. We established the specificity of the method by injecting a standard solution at a concentration of 1.12 ppm, a blank solution, a sample solution, and a sample spiked with the standard solution.
Precision
Method precision
We prepared six spiked test sample solutions at the 100% level and analyzed them according to the established procedure, where impurity content is calculated in each solution to evaluate the consistency of measurements obtained under identical analytical conditions.
Intermediate precision
To confirm the reproducibility of the method, we conducted an intermediate precision study on a different day, using a different column and a different analyst than in the initial method precision study. We prepared and analyzed six spiked test sample solutions, and then compared the impurity contents obtained from both the method precision and intermediate precision studies to evaluate the variability between measurements performed under different conditions.
Limit of detection
Limit of detection (LOD) is the lowest concentration of analyte that can be detected, but cannot be quantified. In this study, we have determined the LOD by using the signal-to-noise ratio approach.
Limit of quantification
The limit of quantification (LOQ) is the lowest concentration of the analyte that can be correctly detected and quantified with acceptable accuracy and precision. In this study, we have determined the LOQ by using the signal-to-noise ratio approach.
Linearity
Linearity of the method is established by injecting standard solutions ranging from the LOQ level (10% of the specification) to 200% of the specification. We prepared these solutions by diluting a single stock solution of N-Nitroso fluoxetine impurity with methanol as the diluent.
Accuracy
To assess accuracy, we added a known amount of impurity to the sample solution and calculated the recovered amount. Accuracy studies were conducted on fluoxetine capsules at four specification levels: 10%, 50%, 100%, and 150% using fluoxetine Capsules (60 mg). We prepared two unspiked sample solutions and three spiked sample solutions according to the procedure and injected each preparation once.
Range
Range of the method is derived from the linearity, precision, and accuracy studies. The method demonstrated linearity, precision, and accuracy across the range of 10% (LOQ level) to 150% of the specification for determining N-Nitroso fluoxetine impurity in fluoxetine Capsules.
Batch analysis
We prepared and analysed both the standard solution and the sample solutions according to the validated procedure.
RESULTS AND DISCUSSION
Method development
We conducted an online literature search and found no published method for determining N-Nitroso fluoxetine in specifically fluoxetine capsules (60 mg) dosage form. Although the European Directorate for the Quality of Medicines and Healthcare (EDQM) provided a brief communication regarding fluoxetine tablets, we did not referred it due to the differences in dosage form and excipient composition [20]. Therefore, a new method developed and validated for the determination of N-Nitroso fluoxetine in fluoxetine capsules (60 mg) dosage form.
As we know column selection is a critical factor in chromatographic methods, which influences both analyte peak shape and separation from other components. To achieve a sharp and symmetrical peak for N-Nitroso fluoxetine impurity, we screened various C18 columns, including X-Bridge C18, Luna C18, Kromasil C18, and Kinetex Polar C18. Among these, the X-Bridge C18 column (250 × 4.6 mm, 3.5 μm) provided superior peak shape and effective separation between N-Nitroso fluoxetine impurity and fluoxetine. Other columns were excluded due to relatively poor peak shape of the analyte and inadequate separation from matrix components.
During method development, we evaluated several buffers like; ammonium formate, ammonium acetate, Milli-Q water, and formic acid for Mobile Phase A, however we found 10 mmol ammonium acetate buffer combined with methanol as Mobile Phase B yielded the best peak shape and separation for N-Nitroso fluoxetine impurity, fluoxetine, and matrix components. Since Acetonitrile produced broad and non-symmetrical impurity peaks, therefore we did not consider it suitable for Mobile Phase B. Due to better solubility of N-Nitroso fluoxetine impurity and fluoxetine API in methanol, we selected it as the diluent. Furthermore, we have studied the extraction efficiency and extraction homogeneity of fluoxetine in fluoxetine capsules matrix during method development by comparing the UV responses at 226 nm of fluoxetine peak in fluoxetine API (fig. 4a) and equivalent concentration of fluoxetine (0.5 mg/ml) in fluoxetine capsules matrix. Since the UV responses (fig. 4b and 4c) of fluoxetine found similar in three different preparations for both fluoxetine API and fluoxetine drug product in methanol, therefore methanol was finalized as diluent for the analysis.
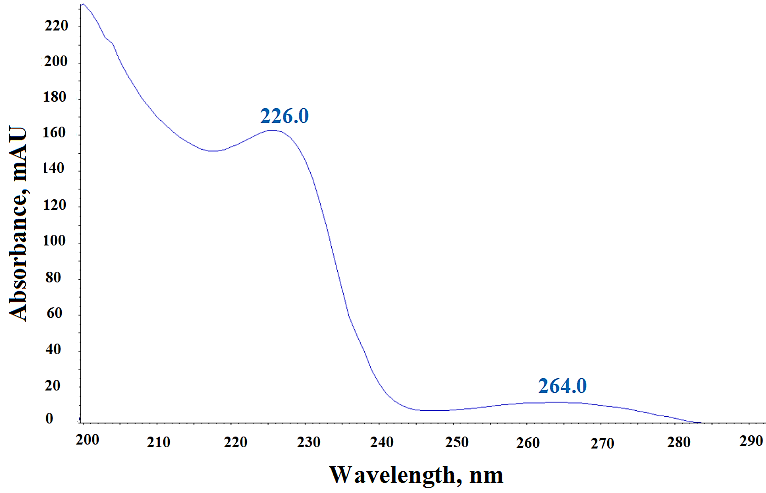
Fig. 4a: PDA Spectrum of fluoxetine API at concentration 0.5 mg/ml in methanol
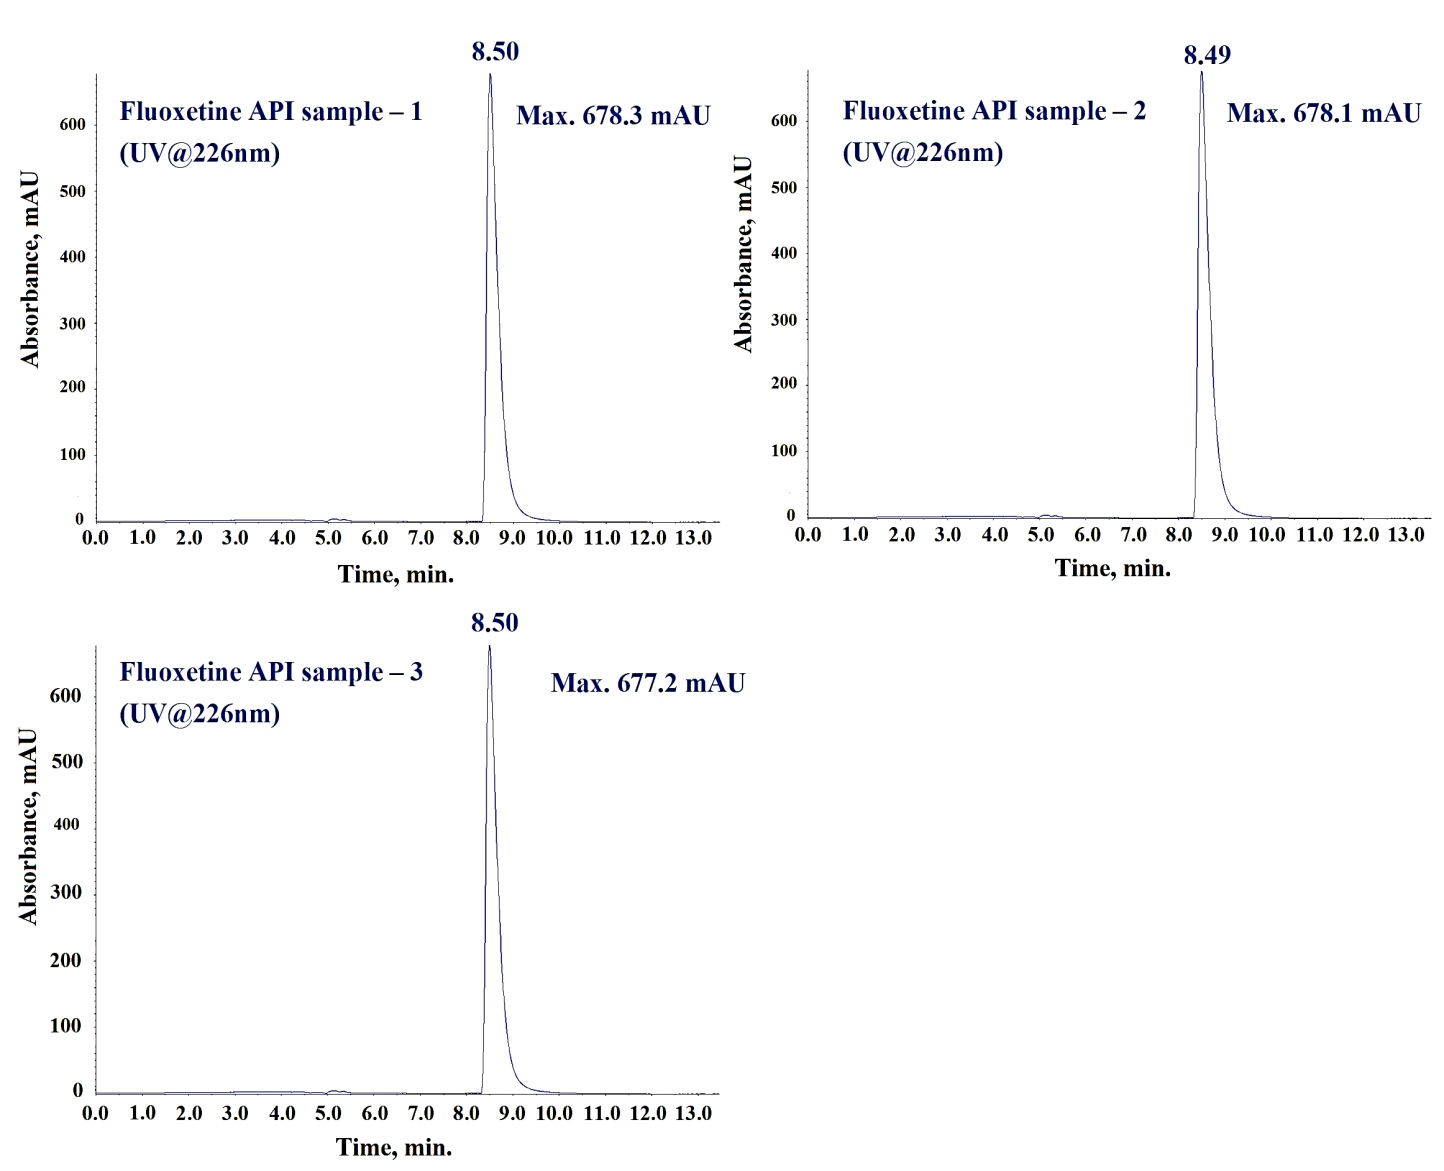
Fig. 4b: UV Chromatograms of fluoxetine API at concentration 0.5 mg/ml
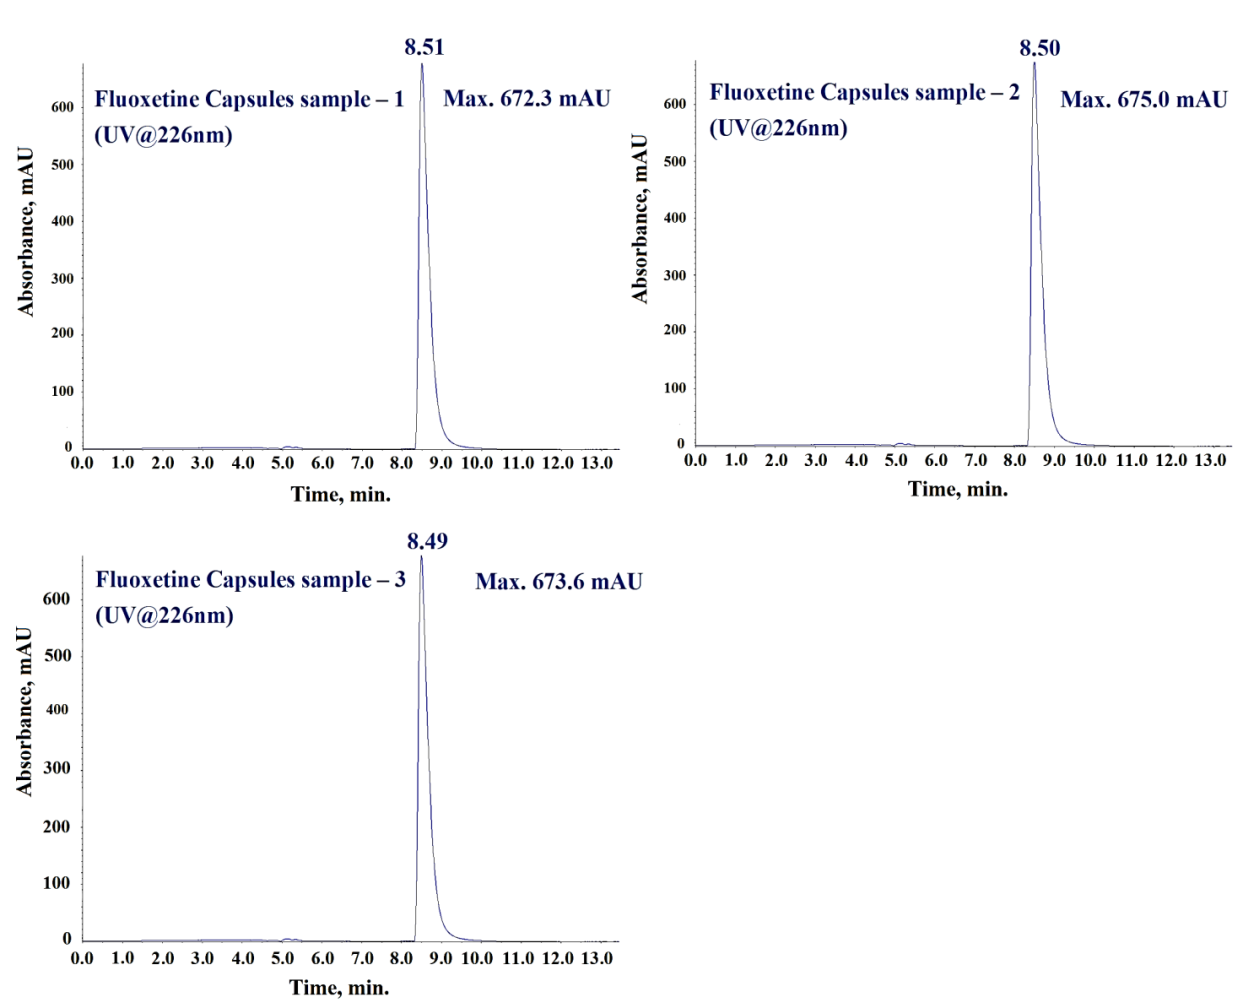
Fig. 4c: UV Chromatograms of fluoxetine drug product at equivalent concentration (0.5 mg/ml) of fluoxetine API
LC-MS/MS is known for its high sensitivity and specificity for detecting trace-level impurities. Organic compounds with polar functional groups that ionize readily in protic solvents are well suited for LC-MS/MS analysis. Based on the structural features of the analyte, we have evaluated both ESI and APCI in positive and negative modes, however we found better ionization of impurity in ESI positive mode and selected it for further optimization. Generally, polar compounds to mid polar compounds ionize easily in ESI mode and mid polar to less polar compounds ionize in APCI Mode. Ionization of any compound can be improved by optimizing instrument related mass parameters like Collision assisted dissociation (CAD), Curtain gas (CUR), Source Temperature (TEM), Ion spray voltage (IS), ion source gases (GS1 and GS2) and compound related mass parameters like Declustering potentials (DP), Entrance potential (EP), Collision energy (CE), Collision cell exist potential (CXP). These mass parameters play an important role to improve the ionization of any compound, which can impact the response of analyte during analysis. Initially, we focused to optimize Q1 mass spectrometry parameters in full scan mode under ESI positive polarity to achieve a strong response for the intact mass (precursor ion) of the impurity at concentration ~20 ppm (fig. 5). After optimizing precursor ion parameters, we conducted MS2 experiments to refine fragmentation by adjusting collision energy (CE), collision cell exit potential (CXP), declustering potential (DP), and entrance potential (EP) (fig. 6) then we optimized the instrument specific parameters such as-ion spray voltage (IS), source temperature, and ion source gases (GS1 and GS2) to maximize the response of the N-Nitroso fluoxetine impurity in MRM mode (fig. 7).
Finalized mass parameters are as follows:
Instrument-specific parameters; Dwell time-500ms; Curtain gas 40 psi; Collision gas (CAD) 7 psi; Ion spray Voltage (IS) 5500; Temperature 500 °C; Ion Source Gas (GS1) 50 psi and Ion Source Gas (GS2) 50 psi.
Compound-specific optimized parameters; Collision Energy (CE) 13V; Collision cell exit potential (CXP) 10V; Declustering potential (DP) 75V and Entrance Potential (EP) 10V. Optimized MRM parameters; parent ion m/z 339.1 (Q1) and product ion m/z of 177.1 (Q3).
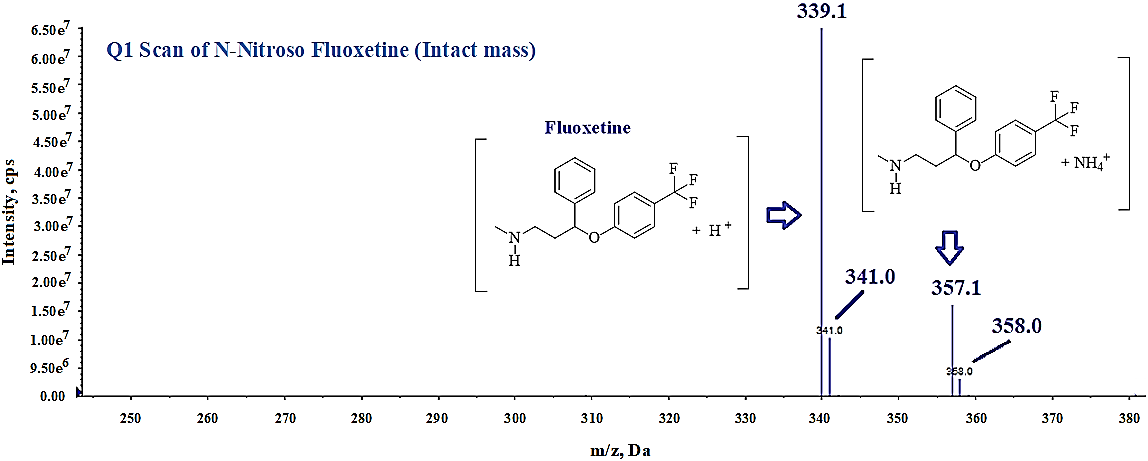
Fig. 5: Intact mass spectrum (Q1 MS) of N-Nitroso fluoxetine
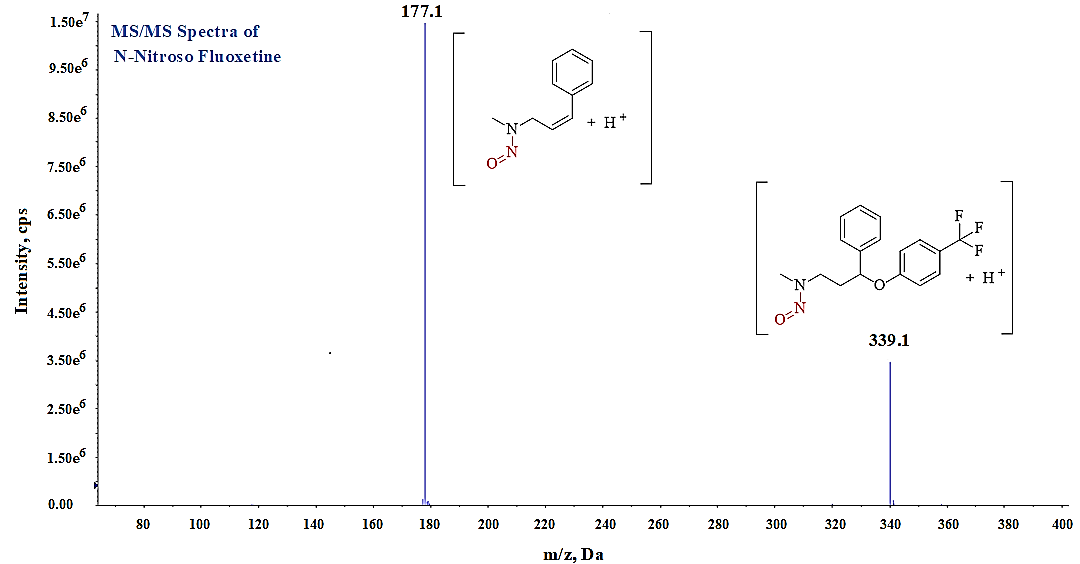
Fig. 6: MS/MS Spectra of N-Nitroso fluoxetine
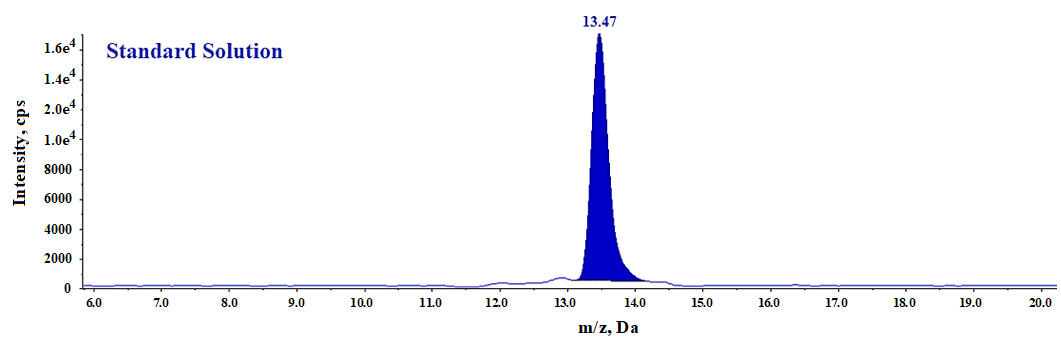
Fig. 7: LC-MS/MS MRM chromatogram of N-Nitroso fluoxetine standard solution
During method development, we observed an unknown impurity eluting close to the N-Nitroso fluoxetine peak in the fluoxetine API sample solution as shown in the LC-MS/MS-MRM chromatogram (fig. 8). Although the LC-MS/MS MRM transitions (339.1 → 177.1) are highly specific to N-Nitroso fluoxetine, we recognized that the same transitions could also correspond to the 13C satellite mass of N-Formyl fluoxetine. Because the low-resolution LC-MS/MS mass spectrometer used in this study could not differentiate between these isotopic features. Therefore, we optimized the chromatographic conditions, including mobile phase composition, gradient program, and column temperature to achieve effective separation between N-Formyl fluoxetine and N-Nitroso fluoxetine impurities.
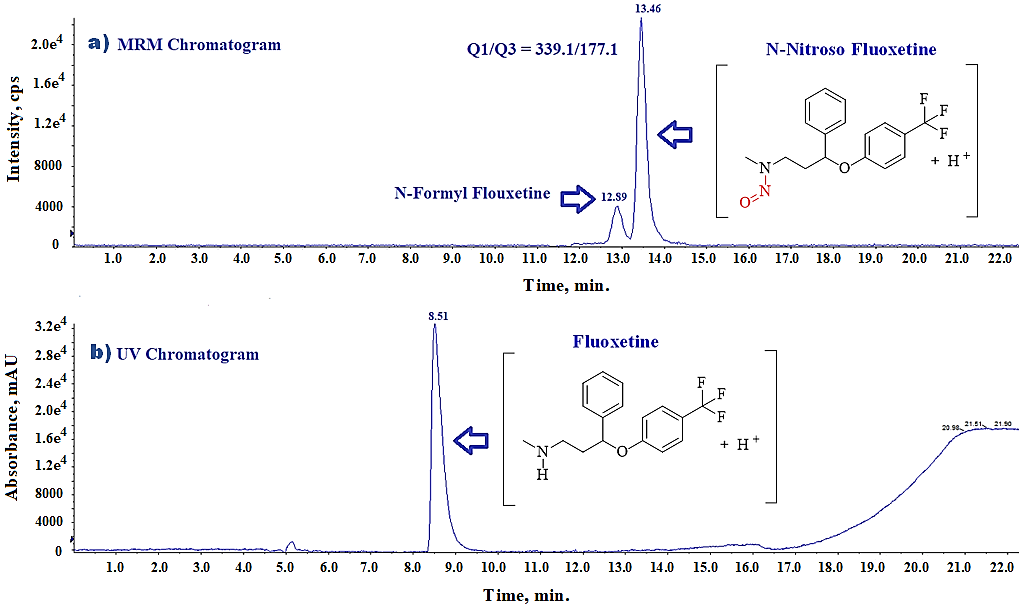
Fig. 8: (a) LC-MS/MS-MRM chromatogram of N-Nitroso fluoxetine impurity in spiked sample at 100%level, (b) UV Chromatogram of same fluoxetine sample
Furthermore, we performed liquid chromatography hyphenated with high-resolution mass spectrometry (LC-HRMS) studies using the Waters VION IMS Q-ToF mass spectrometer, coupled with the Waters Acquity UPLC H-Class Bio System, to predict the structure of the unknown impurity [21]. We used Waters Unifi software (Version 1.9.4) to acquire and process the data. We observed a single prominent peak at 12.90 min (fig. 9) of N-Nitroso fluoxetine (339.1315 [M+H]+) in the standard solution extracted ion chromatogram (XIC).
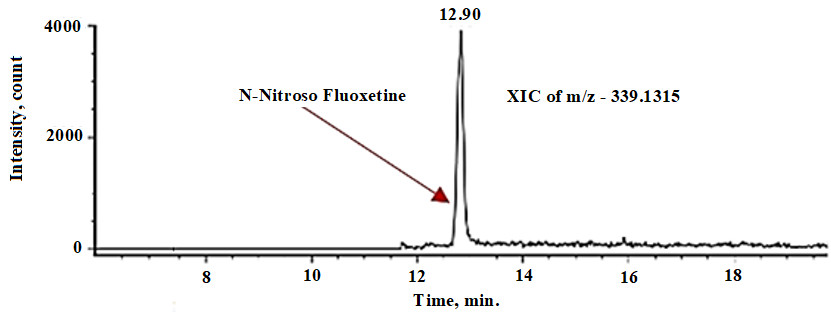
Fig. 9: XIC of N-Nitroso fluoxetine in standard solution
Whereas, Extracted-ion chromatogram of N-Nitroso fluoxetine (339.1315 [M+H]+) in fluoxetine API sample solution (Conc.-200 mg/ml) shows two distinct peaks at 12.25 min and 12.95 min (fig. 10).
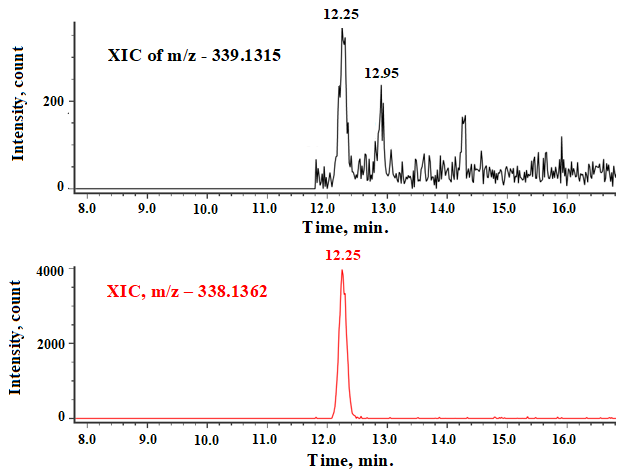
Fig. 10: XIC of N-nitroso fluoxetine in API sample
Peak at 12.25 min in API sample is observed due to the 13C Carbon satellite of N-Formyl fluoxetine peak (339.1396 [M+H]+), whereas the peak at 12.95 min is observed due to N-Nitroso fluoxetine peak (339.1315 [M+H]+). The protonated molecular ion of 13C carbon satellite of N-Formyl fluoxetine is having approximately same protonated molecular ion to N-Nitroso fluoxetine, hence cannot be differentiated by the MRM mode of Q-TRAP LC-MS/MS instruments due to its low mass accuracy. To eliminate the interference of N-Formyl fluoxetine from the N-Nitroso fluoxetine, we optimized the chromatographic conditions and successfully separated both peak.
Validation of method
Newly developed LC-MS/MS method has been validated according to ICH guidelines (ICH Q2 R2), assessing specificity, selectivity, linearity, detection limit, quantification limit, precision, and accuracy to confirm the method’s suitability for its intended use [21-23].
System suitability
System suitability is demonstrated by injecting six replicates of a freshly prepared standard solution at a concentration of 1.12 ppm. The %RSD of the peak areas and peak asymmetry for fluoxetine peak in six replicates of standard solution are presented in table 1.
Table 1: Results for system suitability
| Replicate | RT (min) | Area | Peak asymmetry |
| Injection-1 | 13.46 | 295477 | 1.0 |
| Injection-2 | 13.49 | 290308 | 1.0 |
| Injection-3 | 13.45 | 293662 | 1.0 |
| Injection-4 | 13.48 | 291692 | 1.0 |
| Injection-5 | 13.45 | 291772 | 1.0 |
| Injection-6 | 13.47 | 296086 | 1.0 |
| Mean±SD | 13.47±0.016 | 293166±2297.704 | |
| % RSD | 0.12 | 0.78 |
n=6 replicates, Data presented in (mean±SD); % Relative standard deviation, The % RSDs is observed less than less than 15.0% for the six replicates injections of standard slution and peak asymmetry is observed as 1.0.
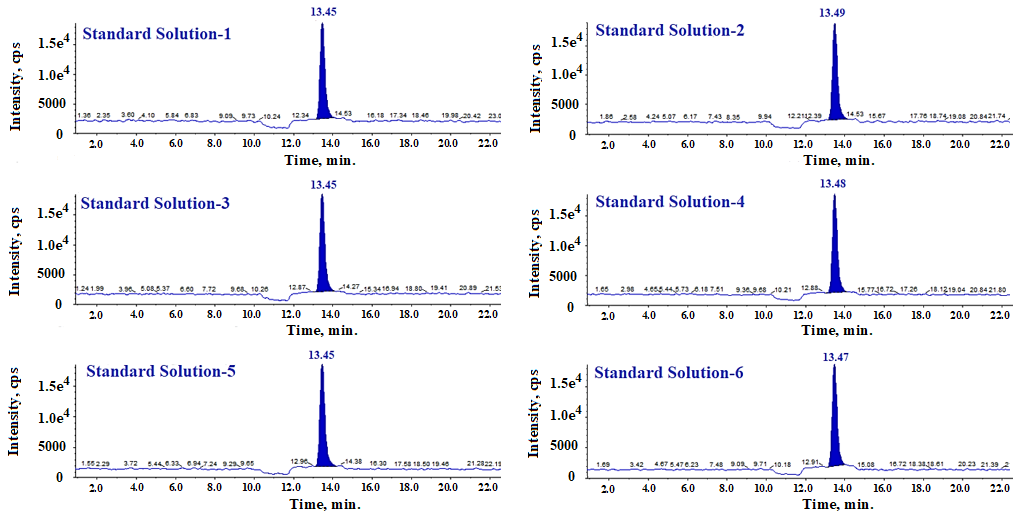
Fig. 11: LC-MS/MS MRM chromatograms of system suitability solution
Matrix effect on the system suitability
To demonstrate the effect of matrix on the response of N-Nitroso fluoxetine impurity peak, we have compared the areas of standard solution prepared in diluent as per method, and standard solution prepared in diluent with placebo (having equivalent concentration to drug product), where results show the slight decrease in area after placebo addition in diluent. Therefore, to mimic the same environment of standard solution and sample solution, placebo is introduced in the standard solution preparation. Table 2 summarizes the differences in response areas observed between the two standard solutions.
Table 2: Results for matrix effect on system suitability
| Replicate injections | Diluent solution+Placebo | Diluent solution |
| Concentration of standard solution – 1.12 ppm | ||
| Area of standard | Area of standard | |
| Injection-1 | 295477 | 310112 |
| Injection-2 | 290308 | 312231 |
| Injection-3 | 293662 | 309122 |
| Injection-4 | 291692 | 311233 |
| Injection-5 | 291772 | 308234 |
| Injection-6 | 296086 | 310112 |
| Mean±SD | 293166±2297.704 | 310174±1430.435 |
| % RSD | 0.78 | 0.46 |
n=6 replicates, Data presented in (mean±SD); % Relative standard deviation
Table 3: Results for method precision of N-nitroso fluoxetine impurity
| Sample name | LOQ | 100% | 150% | |||
| RT | *Content | RT | Content | RT | Content | |
| (min) | (ppm) | (min) | (ppm) | (min) | (ppm) | |
| Method Precison-1 | 13.48 | 0.25 | 13.46 | 1.27 | 13.46 | 1.83 |
| Method Precison-2 | 13.48 | 0.24 | 13.47 | 1.24 | 13.48 | 1.87 |
| Method Precison-3 | 13.47 | 0.25 | 13.49 | 1.25 | 13.47 | 1.80 |
| Method Precison-4 | 13.48 | 0.25 | 13.47 | 1.21 | 13.46 | 1.74 |
| Method Precison-5 | 13.45 | 0.25 | 13.46 | 1.26 | 13.46 | 1.90 |
| Method Precison-6 | 13.47 | 0.24 | 13.46 | 1.22 | 13.49 | 1.86 |
| Mean±Standard Deviation | 13.47±0.0117 | 0.25±0.0052 | 13.47±0.0117 | 1.24±0.0232 | 13.47±0.0126 | 1.83±0.0572 |
| % RSD | 0.09 | 2.09 | 0.09 | 1.87 | 0.09 | 3.12 |
n=6 replicates, Data presented in (mean±SD); % Relative standard deviation, *Content in unspiked sample is 0.14 ppm, The % RSDs of the impurity content in spiked samples at all levels were observed less than 15.0%.
Precision
Method precision
Method precision has been demonstrated at the LOQ, 100%, and 150% levels of the specification. At each level, we prepared six spiked sample solutions and injected each preparation once. Table 3 presents the %RSD values for impurity content determined from six spiked sample preparations at each concentration level.
Specificity
Specificity of the method is established by injecting a standard solution at a concentration of 1.12 ppm, along with blank, placebo, sample, and sample solution spiked at the specification level. To assess potential interference from the placebo, its excipient profile was intentionally formulated to match that of the fluoxetine capsules. Specificaty data shows no interference at the retention time of the N-Nitroso fluoxetine impurity in the chromatograms of the blank and placebo solutions, and the impurity peak appeared at the same retention time in the spiked sample solution as in the standard solution chromatogram. An aditional peak observed eluting at 12.90 min in both unspiked and spiked sample solutions is identified as N-Formyl fluoxetine and the quantitaiton of this impurity is out of scope this study. Table 4 presents the specificity results.
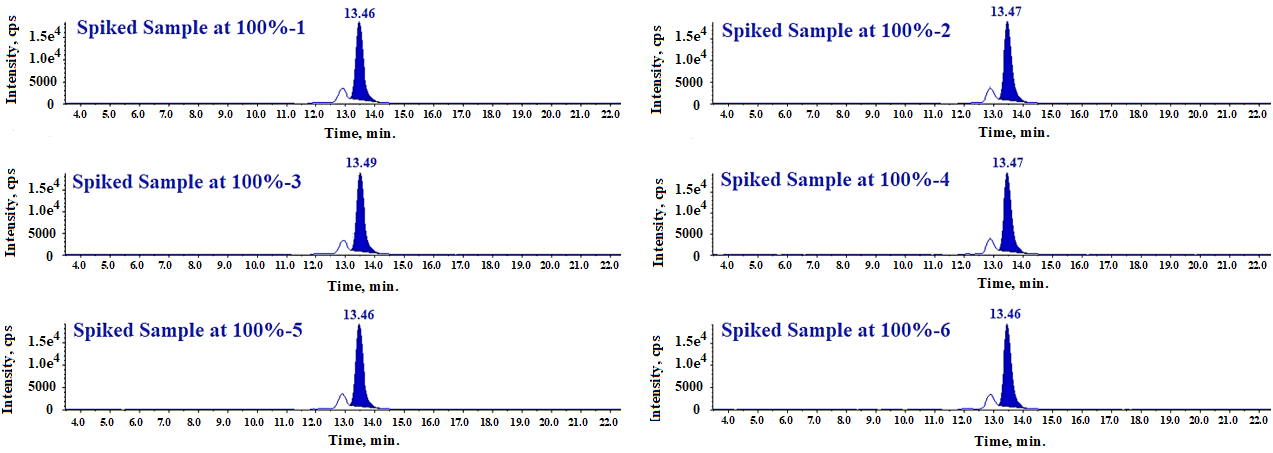
Fig. 12: LC-MS/MS-MRM chromatogram of method precision
Table 4: Results for blank, impurity interference and RT confirmation
| Name of solution | RT (min) of N-Nitroso fluoxetine | Interference observed at the RT of N-Nitroso fluoxetine |
| Blank | ND | No interference observed |
| Placebo Solution | ND | No interference observed |
| Standard Solution | 13.46 | No interference observed |
| Unspiked Sample | 13.48 | No interference observed |
| Spiked Sample | 13.48 | No interference observed |
ND: Not detected
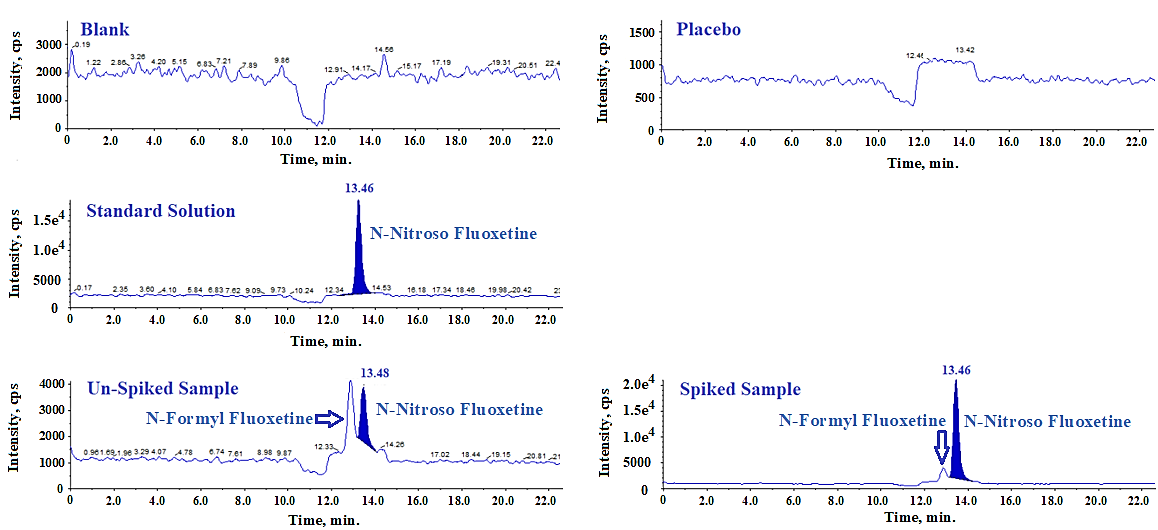
Fig. 13: LC-MS/MS-MRM chromatograms of specificity
Intermediate precision
To demonstrated intermediate precision, we conducted intermediate precision study on a different day, using a different column and a different analyst than in the original method precision study by preparing six spiked test sample solutions at specification. The data for intermediate precision performed under varied conditions, including different days, analysts, and column is presented in the table 5.
Table 5: Results for intermediate precision of N-nitroso fluoxetine impurity
| Parameters | RT (min) | Content (ppm) |
| Intermediate Precison-1 | 13.45 | 1.23 |
| Intermediate Precison-2 | 13.48 | 1.27 |
| Intermediate Precison-3 | 13.47 | 1.21 |
| Intermediate Precison-4 | 13.46 | 1.28 |
| Intermediate Precison-5 | 13.49 | 1.25 |
| Intermediate Precison-6 | 13.47 | 1.22 |
| Mean±Standard Deviation | 13.47±0.0141 | 1.24±0.0280 |
| % RSD | 0.10 | 2.26 |
n=6 replicates, Data presented in (mean±SD); % Relative standard deviation, % RSD of cumulative of method precisionand and intermediate precision for 12 spiked sample solutions is presneted in table 6.
Table 6: Results for cumulative precision of N-nitroso fluoxetine impurity
| Parameters | Cumulative precision | |
| RT (min) | Content (ppm) | |
| Method Precison-1 | 13.46 | 1.27 |
| Method Precison-2 | 13.47 | 1.24 |
| Method Precison-3 | 13.49 | 1.25 |
| Method Precison-4 | 13.47 | 1.21 |
| Method Precison-5 | 13.46 | 1.26 |
| Method Precison-6 | 13.46 | 1.22 |
| Intermediate Precison-1 | 13.45 | 1.23 |
| Intermediate Precison-2 | 13.48 | 1.27 |
| Intermediate Precison-3 | 13.47 | 1.21 |
| Intermediate Precison-4 | 13.46 | 1.28 |
| Intermediate Precison-5 | 13.49 | 1.25 |
| Intermediate Precison-6 | 13.47 | 1.22 |
| Mean±SD | 13.47±0.0124 | 1.24±0.0245 |
| % RSD | 0.09 | 1.98 |
The cumulative % RSDs of the impurity content from method precision and intermediate precision in all spiked samples are observed less than 15.0%, which shows that method is rugged and produces same results even when experimental conditions are varied slightly.
Detection limit
To establish the limit of detection for the N-Nitroso fluoxetine peak, a solution at 0.06 ppm concentration is injected. The signal-to-noise (S/N) ratio is calculated for the peak and presented in table 7.
Limit of quantitation
LOQ of the method is established by injecting six different preparations of the LOQ solution prepared in diluent as per procedure at concentration of 0.11 ppm. Signal-to-noise ratio is calculated for the N-Nitroso fluoxetine peak in each injection and data is presented in table 8.
Linearity
The linearity of method is established by injecting standard solutions ranging from 0.11 ppm to 2.24 ppm (representing 10% to 200% of the specification), prepared by diluting a 220 ppm stock solution of N-Nitroso fluoxetine impurity with diluent. A linearity plot is constructed by plotting impurity concentrations on the X-axis against their corresponding peak responses on the Y-axis. Linearity data is presented in table 9.
Table 7: Results for LOD S/N of N-nitroso fluoxetine
| Concentration (ppm) | Area | Signal to noise (S/N) |
| 0.06 | 13243 | 6.2 |
The S/N ratio for N-Nitroso fluoxetine impurity peak was obsereved 6.2 which meets the acceptance criteria of LOD (S/N>3).
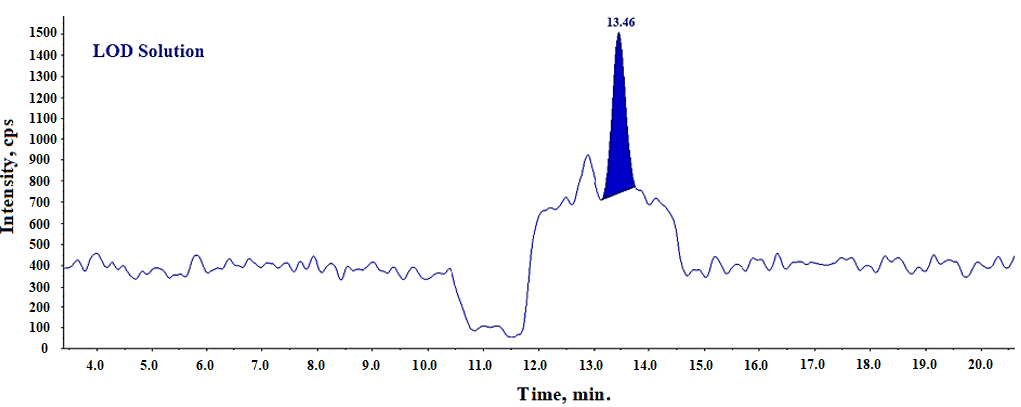
Fig. 14: LC-MS/MS-MRM chromatogram of LOD solution
Table 8: Results for LOQ S/N and LOQ precision of N-nitroso fluoxetine
| Parameters | Concentration (ppm) | Area | S/N ratio |
| LOQ injection-1 | 0.12 | 29111 | 11.2 |
| LOQ injection-2 | 0.11 | 26429 | 11.1 |
| LOQ injection-3 | 0.11 | 26992 | 11.4 |
| LOQ injection-4 | 0.12 | 28782 | 12.3 |
| LOQ injection-5 | 0.12 | 29674 | 12.5 |
| LOQ injection-6 | 0.12 | 28910 | 11.2 |
| Mean±Standard Deviation | 0.12±0.0052 | 28316±1293.053 | |
| % RSD | 4.43 | 4.57 |
n=6 replicates, Data presented in (mean±SD); % Relative standard deviation, The S/N ratio for N-Nitroso fluoxetine impurity peak in each LOQ standard solutin is obsereved more than 10 and LOQ %RSD of areas from six replicate of LOQ solution is found less than 15.0%.
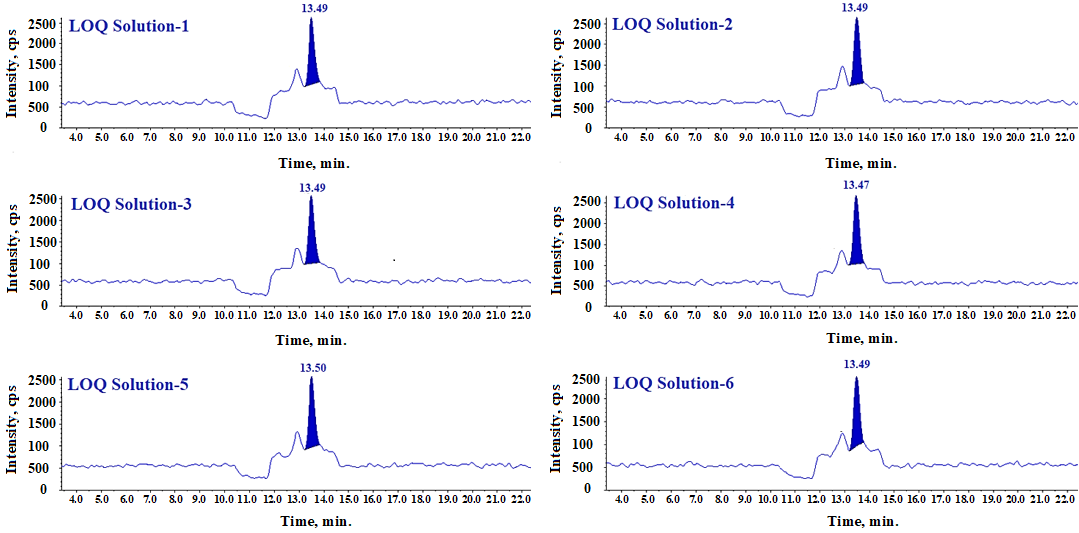
Fig. 15: LC-MS/MS-MRM chromatogram of LOQ solution
Table 9: Results for linearity of N-nitroso fluoxetine
| Linearity level | Concentration (ppm) | Area | Correlation coefficient (R2) |
| 10% | 0.11 | 29111 | 0.9913 |
| 25% | 0.28 | 66251 | |
| 50% | 0.56 | 158236 | |
| 75% | 0.84 | 207661 | |
| 100% | 1.12 | 303745 | |
| 125% | 1.40 | 330127 | |
| 150% | 1.68 | 452936 | |
| 200% | 2.24 | 611872 |
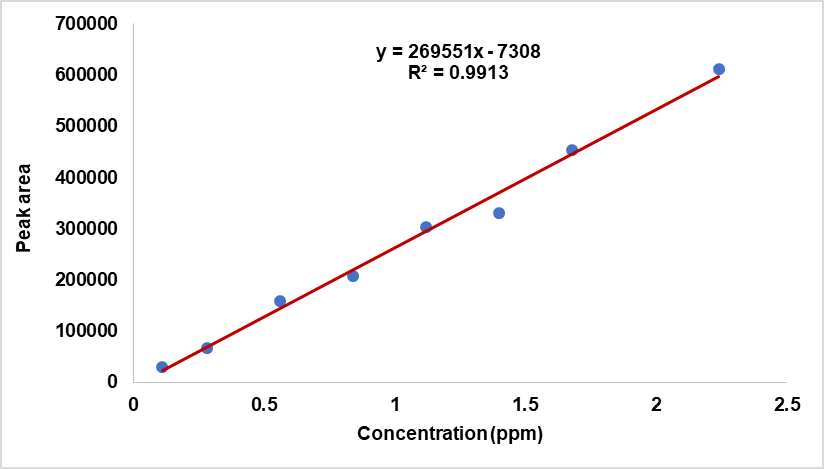
Fig. 16: Linearity plot of N-nitroso fluoxetine
From linearity plot y-intercept is predicted as-7308, which is slightly negative. This is the predicted value of Y, when X = 0. The R² (Coefficient of Determination) is observed as 0.9913, which indicates that the linearity plot explains over 99.1% of the variance in data. This shows that linearity data is almost fits on a straight line perfectly. Furthermore, the absence of obvious curvature shows that the correctness of linearity assumption. Since residuals are randomly scattered around zero and are consistently spread across predicted values, therefore homoscedasticity (constant variance) is also supported well. The linearity data shows that method is linear over the concentration range of 0.11 ppm (10% of specification) to 2.24 ppm (200% of specification).
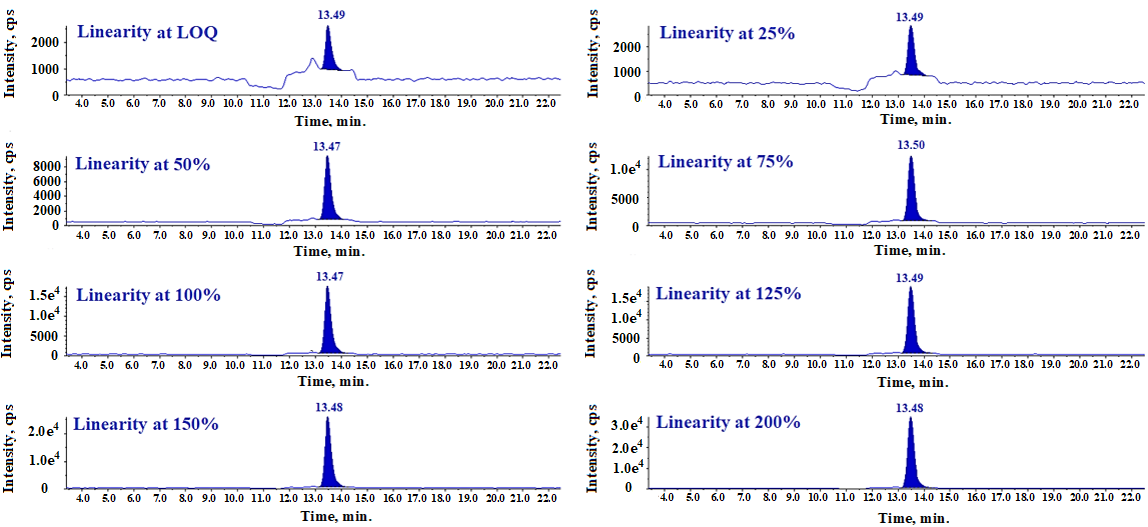
Fig. 17: LC-MS/MS-MRM chromatogram of linearity solution
Accuracy
To demonstrate the accuracy of the method, known amounts of N-Nitroso fluoxetine impurity is spiked into fluoxetine capsules (60 mg) samples at concentrations of 0.11 ppm, 0.56 ppm, 1.12 ppm, and 1.68 ppm, corresponding to 10%, 50%, 100%, and 150% of the specification, respectively. For each concentration level, three individual spiked sample solutions and two unspiked fluoxetine capsules (60 mg) sample solutions prepared and injected once. The following formula is used to calculate recovery.
Where;
A: Concentration of impurity in spiked sample
B: Concentration of impurity in unspiked sample
C: Level of spiking
To calculated N-Nitroso fluoxetine impurity content in unspiked and spiked sample solutions, we have considered the concentration and area of external N-Nitroso fluoxetine impurity standard (external standard) prepared at specification level 1.12 ppm. Accuracy data is presented in table 10 and 11.
Table 10: Results for N-nitroso fluoxetine content in unspiked sample
| Un-spiked sample | Area | Content (ppm) |
| Preparation-1 | 36082 | 0.14 |
| Preparation-2 | 37947 | 0.15 |
| Average content (ppm) | 0.14 |
Table 11: Results for accuracy of N-nitroso fluoxetine impurity
| % Recovery | LOQ | 50% | 100% | 150% |
| Preparation-1 | 87.2 | 87.5 | 100.9 | 100.4 |
| Preparation-2 | 81.5 | 84.8 | 98.1 | 102.6 |
| Preparation-3 | 85.5 | 85.8 | 98.8 | 98.8 |
| Average | 84.7 | 86.0 | 99.3 | 100.6 |
Average recoveries are calculated as 84.7%, 86.0%, 99.3%, and 100.6% in spiked fluoxetine capsules (60 mg) samples at LOQ, 50%, 100%, and 150% levels, respectively. These accuracy results fall well within the acceptable range of 80% to 120%. Therefore, the method found accurate for its intended use in determining N-Nitroso fluoxetine impurity in fluoxetine capsules.
Range
Range of the analytical method is the lowest and highest concentration of the analyte that can be determine precisely and accurately. The range is calculated based on linearity, precision, and accuracy studies to demonstrate the reliability of method across its intended use. For determining N-Nitroso fluoxetine content in fluoxetine capsules (60 mg), the rage of method is established from the LOQ (0.11 ppm) to 150% of the specification level (1.68 ppm).
Summary
A simple, rapid and sensitive reverse-phase LC-MS/MS method is developed and validated for the estimation of N-Nitroso fluoxetine (Nitrosamine impurity) in fluoxetine capsules (60 mg). Table 12, shows the summarized outcome of method validation as per the ICH Guideline.
Table 12: Summary of results for method verification
| Validation parameters | Typical acceptance criteria | Results |
| System suitability and Specificity | % RSD for N-Nitroso fluoxetine peak area response (n = 6) should be ≤ 15.0 % | 0.78 |
| RT of N-Nitroso fluoxetine impurity peak in all the solutions | 13.5 min | |
| Interference from blank | No interference | |
| LOD | LOD Concentration | 0.06 ppm |
| S/N ratio (should be ≥ 3) | >3 | |
| LOQ | LOD Concentration | 0.11 ppm |
| S/N ratio (should be ≥ 10) | >10 | |
| LOQ precision | %RSD for six replicate injections of LOQ solution should be ≤ 15.0 % | 4.57 |
| Linearity | Range | 0.11 to 1.68 ppm |
| Square of correlation coefficient (r2) ≥ 0.99 | 0.9913 | |
| Method Precision | % RSD for six preparations (n = 6) of spiked sample at LOQ level should be ≤15.0 | 2.09 |
| % RSD for six preparations (n = 6) of spiked sample at Specification level should be ≤15.0 | 1.87 | |
| % RSD for six preparations (n = 6) of spiked sample at 150% of specification level should be ≤15.0 | 3.12 | |
| Intermediate Precision | % RSD for six preparations (n = 12) of spiked sample at 100% of specification level should be ≤20.0 | 1.98 |
| Accuracy | Average recovery at LOQ (acceptance criteria 70 to 130%) | 84.7% |
| Average recovery at 50% (acceptance criteria 70 to 130%) | 86.0% | |
| Average recovery at 100% (acceptance criteria 70 to 130%) | 99.3% | |
| Average recovery at 150% (acceptance criteria 70 to 130%) | 100.6% |
CONCLUSON
A new LC-MS/MS method is developed for the estimating N-Nitroso fluoxetine in fluoxetine capsules (60 mg) and verified for sensitivity, selectivity, linearity, precision and accuracy across the range of 10% to 150% of the specification. This validation demonstrates the reliability of method to detect and quantify N-Nitroso fluoxetine impurity in concentrations ranging from 0.11 ppm to 1.68 ppm. The recoveries found within the acceptable limit (80% to 120%) at 10%, 50%, 100% and 150% levels, confirming the accuracy of method for its intended use. We have also evaluated method precision and intermediate precision, and both sets of data showed that the method consistently produces reliable results, even when experimental conditions vary slightly. Correlation coefficient (r²) is observed as 0.9913 for the linearity plot between analyte concentration and peak area, confirms that the method is linear over the concentration range of 0.11 ppm to 2.24 ppm. Based on the validation results, including specificity, detection and quantitation limit, linearity, precision and accuracy it is concluded that this method is suitable for regular analysis of N-Nitroso fluoxetine impurity in the finished product of fluoxetine capsules (60 mg).
Batch analysis
We analyzed several batches of fluoxetine capsules (60 mg) to estimate the N-Nitroso fluoxetine impurity content, and the method was found to be suitable for the analysis.
ACKNOWLEDGMENT
The authors would like to acknowledge the management of Dr. Reddy’s Laboratories Ltd, IPDO, Hyderabad, for providing fluoxetine capsules (60 mg), N-Nitroso fluoxetine impurity standard, and analytical laboratory instrumentation facilities.
ABBREVIATIONS
AI: Acceptable Intake, API: Active Pharmaceutical Ingredient, APCI: Atmospheric Pressure Chemical Ionization, CPCA: Carcinogenic Potency Categorization Approach, EMA: European Medicines Agency, ESI: Electro or Electron Spray Ionization, GC: Gas Chromatography, HPLC: High Performance Liquid Chromatography, ICH: International Conference on Harmonization, LC-HRMS: Liquid Chromatography Hyphenated with High Resolution Mass Spectrometry, LC-MS/MS: Liquid Chromatography Hyphenated with Mass Spectrometry, LOD: Limit of Detection, LOQ: Limit Of Quantification, MDD: Maximum Daily Dose, Min: Minutes, ml: Milli Litre, mmol: Milli Molar, MRM: Multiple ion Reaction Monitoring, ng: Nano Gram, NDSRI: Nitrosamine Drug Substance-Related Impurities, ppm: Parts Per Million, RPM: Revolutions Per Minute, RSD: Relative Standard Deviation, RT: Retention Time, S/N: Signal to Noise ratio, µg: Micro Gram, μm: Micrometer, UHPLC: Ultra-High Performance Liquid Chromatography, USFDA: United States Food and Drug Administration, USP: United State Pharmacopeia, XIC: Extracted-ion chromatogram.
FUNDING
Nil
AUTHORS CONTRIBUTIONS
All authors have approved the final version of the manuscript. BK (Bhupinder Kumar): Designing the study and Data collection; RM (Raju Mudhulkar): Data analysis, Writing-Original draft preparation, Writing-Revised and Editing, Supervision; DVR (Dama Venugopala Rao): Technical support, Formal analysis, LCMS facility and Resources; SSL (Sateesh Singh Lodhi) LC-MS/MS specialist.
CONFLICTS OF INTERESTS
All authors declare that there is no conflict of interest regarding the publication of this article. This study has no competing interests.
REFERNCES
Mikocka Walus A, Prady SL, Pollok J, Esterman AJ, Gordon AL, Knowles S, Andrews JM. Adjuvant therapy with antidepressants for the management of inflammatory bowel disease. Cochrane Database Syst Rev. 2019 Apr 12;2019(4):CD012680. doi: 10.1002/14651858.CD012680.pub2, PMID 30977111.
Dhenain T, Cote F, Coman T. Serotonin and orthodontic tooth movement. Biochimie. 2019 Jun;161:73-9. doi: 10.1016/j.biochi.2019.04.002, PMID 30953672.
Burch R. Antidepressants for preventive treatment of migraine. Curr Treat Options Neurol. 2019 Mar 21;21(4):18. doi: 10.1007/s11940-019-0557-2, PMID 30895388.
Teasdale A. Mutagenic impurities: strategies for identification and control. Chichester: John Wiley & Sons; 2021. doi: 10.1002/9781119551249.
Teasdale A. Mutagenic impurities: strategies for identification and control. Chichester: John Wiley & Sons; 2021. doi: 10.1002/9781119551249.
European Medicines Agency. Update on review of valsartan medicines following detection of impurity in active substance EMA/485921/2018. London: European Medicines Agency; 2018.
European Medicines Agency. EMA review of impurities in sartan medicines. EMA/643116/2018. London: European Medicines Agency; 2018.
U.S. Food and Drug Administration. Control of nitrosamine impurities in human drugs: guidance for industry. 2nd revision. Quality: Pharmaceutical Press/Manufacturing Standards (CGMP); 2024 Sep. Available from: https://www.fda.gov/regulatory-information/search-fda-guidance-documents/cder-nitrosamine-impurity-acceptable-intake-limits.
Ashworth IW, Dirat O, Teasdale A, Whiting MP. Potential for the formation of N-nitrosamines during the manufacture of active pharmaceutical ingredients: an assessment of the risk posed by trace nitrite in water. Org Process Res Dev. 2020;24(9):1629-46. doi: 10.1021/acs.oprd.0c00224.
Mirvish SS. Formation of N-nitroso compounds: chemistry kinetics and in vivo occurrence. Toxicol Appl Pharmacol. 1975;31(3):325-51. doi: 10.1016/0041-008X(75)90255-0, PMID 238307.
Schlingemann J, Burns MJ, Ponting DJ, Martins Avila CM, Romero NE, Jaywant MA. The landscape of potential small and drug substance-related nitrosamines in pharmaceuticals. J Pharm Sci. 2023;112(5):1287-304. doi: 10.1016/j.xphs.2022.11.013, PMID 36402198.
Kruhlak NL, Schmidt M, Froetschl R, Graber S, Haas B, Horne I. Determining recommended acceptable intake limits for N-nitrosamine impurities in pharmaceuticals: development and application of the carcinogenic potency categorization approach (CPCA). Regul Toxicol Pharmacol. 2024 Jun;150:105640. doi: 10.1016/j.yrtph.2024.105640, PMID 38754805.
Ponting DJ, Czich A, Felter SP, Glowienke S, Harvey JS, Nudelman R. Control of N-nitrosamine impurities in drug products: progressing the current CPCA framework and supporting the derivation of robust compound-specific acceptable intakes. Regul Toxicol Pharmacol. 2025 Feb;156:105762. doi: 10.1016/j.yrtph.2024.105762, PMID 39662665.
U.S. Food and Drug Administration. CDER nitrosamine impurity acceptable intake limits control of nitrosamine impurities in human drugs: guidance for industry. Rockville (MD): FDA. Available from: https://www.fda.gov/regulatory-information/search-fda-guidance-documents/cder-nitrosamine-impurity-acceptable-intake-limits.
Sohel AJ, Shutter MC, Patel P, Molla M. Fluoxetine. In: StatPearls. University of California, Los Angeles; 2025 Jan. PMID 29083803.
Boetzel R, Schlingemann J, Hickert S, Korn C, Kocks G, Luck B. A nitrite excipient database: a useful tool to support N-nitrosamine risk assessments for drug products. J Pharm Sci. 2023 Jun;112(6):1615-24. doi: 10.1016/j.xphs.2022.04.016, PMID 35500671.
Bruins AP. Mechanistic aspects of electrospray ionization. J Chromatogr A. 1998;794(1-2):345-57. doi: 10.1016/S0021-9673(97)01110-2.
Patidar A, Kamble P. A comprehensive review on liquid chromatography-mass spectrometry (LC-MS): a hyphenated technique: a review. Asian J Pharm Res Dev. 2025;13(1):95-103. doi: 10.22270/ajprd.v13i1.1509.
Famiglini G, Palma P, Termopoli V, Cappiello A. The history of electron ionization in LC-MS, from the early days to modern technologies: a review. Anal Chim Acta. 2021;1167:338350. doi: 10.1016/j.aca.2021.338350, PMID 34049632.
European Directorate for the Quality of Medicines & HealthCare. LC-MS/MS analytical procedure for the determination of N-nitroso-fluoxetine in fluoxetine tablets. Strasbourg: EDQM; 2023.
Bhavyasri K, Saileela S, Sumakanth M. High-resolution mass spectroscopy (HRMS)-a review. Int J Curr Pharm Sci. 2023 May-Jun;15(3):9-13. doi: 10.22159/ijcpr.2023v15i3.3008.
International Conference on Harmonisation of Technical Requirements for Registration of Pharmaceuticals for Human Use (ICH). Validation of analytical procedures: text and methodology, Q2(R1). Geneva: ICH; 2005.
Remidicherla SS, Chakravarthi G, Malothu N. A validated LC-MS/MS method for determination at trace level of nitrosamine impurities in doxofylline API. Ind J Pharm Edu Res. 2024;58(4s):s1262-70. doi: 10.5530/ijper.58.4s.121.
Baksam VK, Saritha N, Devineni SR, Jain M, Kumar P, Shandilya S. A critical n-nitrosamine impurity of anticoagulant drug rivaroxaban: synthesis, characterization, development of LC–MS/MS method for nanogram level quantification. Chromatographia. 2022;85(1):73-82. doi: 10.1007/s10337-021-04115-x.