
Int J App Pharm, Vol 18, Issue 1, 2026, 193-198Original Article
DEVELOPMENT AND VALIDATION OF AN LC-MS/MS METHOD FOR THE QUANTIFICATION OF REPOTRECTINIB IN HUMAN PLASMA
VASUDEVA RAO BOBBA1,2, MOGILI PADMA2*, VUNDAVILLI JAGADEESH KUMAR1
1Analytical Research Department, Apitoria Research Centre, Aurobindo Pharma Limited, Hyderabad-502329, Telangana, India. 2Department of Engineering Chemistry, A. U. College of Engineering (A), Andhra University, Visakhapatnam-530003, Andhra Pradesh, India
*Corresponding author: Mogili Padma; *Email: mpadma.aueng@gmail.com
Received: 28 Jul 2025, Revised and Accepted: 01 Dec 2025
ABSTRACT
Objective: The primary aim of this study is to develop and verify a linear, exact, and specific LC-ESI-MS/MS technique for the measurement of Repotrectinib.
Methods: Chromatographic resolution was attained using an ODS Zorbax C18 column (50 mm×4.6 mm, 2.1 µm) and a mobile phase comprising methanol, 0.1% formic acid, and acetonitrile in a ratio of 50:15:35, with a flow rate of 0.5 ml/min from the stationary phase. The procedure was conducted by observing the defined ionic transitions of m/z 356.15/318.13 for Repotrectinib and 478.09/451.08 for the Apalutamide internal standard in multiple reaction monitoring.
Results: The linear regression equation was y = 0.0001x+0.0012, with a coefficient of determination (r²) of 0.9997. The percentage coefficient of variation results for the matrix effect for Low-QC and High-QC levels were 2.90% and 3.41%, respectively. The average recovery percentages for Repotrectinib at High-QC (11.25 µg/ml), MQC (7.50 µg/ml), and Low-QC (1.05 µg/ml) were 103.27%, 97.26%, and 96.34%, respectively. The measured values ranged from 2.00% to 4.03% for the QC samples at concentrations of 0.375, 1.05, 7.50, and 11.25 µg/ml.
Conclusion: The created approach underwent validation in accordance with FDA guidelines and is applicable for the assessment of repotrectinib in biological samples for quality control, forensic analysis, and bioavailability investigations.
Keywords: Repotrectinib, Cancer, LC-MS/MS, Validation, Accuracy
© 2026 The Authors. Published by Innovare Academic Sciences Pvt Ltd. This is an open access article under the CC BY license (https://creativecommons.org/licenses/by/4.0/)
DOI: https://dx.doi.org/10.22159/ijap.2026v18i1.56285 Journal homepage: https://innovareacademics.in/journals/index.php/ijap
INTRODUCTION
Tyrosine kinase inhibitors (TKIs) represent a major class of targeted anticancer therapies used in the treatment of hematologic and solid tumors. Despite their clinical success, TKIs exhibit high interpatient variability in absorption, distribution, metabolism, and excretion, necessitating precise quantification in biological matrices for pharmacokinetic, therapeutic drug monitoring, and bioequivalence studies [1-3].
Liquid chromatography–tandem mass spectrometry (LC-MS/MS) has emerged as the preferred analytical platform for TKI measurement due to its superior sensitivity, selectivity, and reproducibility compared with conventional techniques. The chromatographic step enables effective separation of TKIs and their metabolites from endogenous interferences, while tandem mass spectrometry ensures specific detection through multiple reaction monitoring (MRM). This combination allows robust quantification across a broad dynamic range with minimal sample volume [2-4].
Repotrectinib is a novel TKI designed to combat resistance in the treatment of non-small cell lung cancer (NSCLC) associated with mutations in the ROS1 gene. Repotrectinib has a tight macrocyclic structure that minimizes detrimental interactions with resistance mutation hotspots while specifically targeting mutations in the solvent-front region. While resistance to certain TKIs, such as crizotinib, lorlatinib, taletrectinib, and entrectinib, has been documented, no instances of resistance to repotrectinib have been recorded. It is chemically classified as (3R, 11S).-6-fluoro-3,11-dimethyl-10-oxa-2,13,17,18,21-pentazatetracyclo[13.5.2.04,9.018,22] Docosa-1(21),4(9),5,7,15(22),16,19-heptaen-14-one, has the chemical formula C18H18FN5O2 and a molecular weight of 355.37 g/mol (fig. 1) [4-6].
Repotrectinib is an inhibitor of the proto-oncogene tyrosine-protein kinase ROS1 and the tropomyosin receptor tyrosine kinases TRKA, TRKB, and TRKC. Fusion proteins containing ROS1 domains may promote tumorigenesis by hyperactivating downstream signaling pathways, resulting in unchecked cell proliferation. Repotrectinib demonstrated anti-tumor efficacy in cultured cells with ROS1 fusions and mutations, including SDC4-ROS1, SDC4-ROS1G2032R, CD74-ROS1, CD74-ROS1G2032R, CD74-ROS1D2033N, and CD74-ROS1L2026M [6].
In the literature about Repotrectinib, only one analytical method has been established for its quantification using LC–MS/MS [7]. The reported approach was applied to mouse plasma and is validated in the range of 1-1000ng/ml. The precision values are also upto 8.7%. So, there is a requirement of an analytical tool for the human plasma analysis. The aim of the work is to develop and validate a sensitive, accurate, and reproducible LC-MS/MS method for the quantification of repotrectinibin biological matrices, enabling its application in pharmacokinetic, bioavailability, bioequivalence, and clinical research studies.
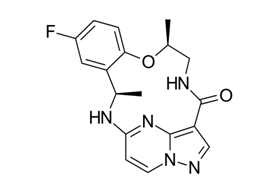
Fig. 1: Repotrectinib chemical structure
MATERIALS AND METHODS
Reagent chemicals
Glenmark, Mumbai, India, provided complimentary samples of Repotrectinib and Apalutamide (IS). LC grade acetonitrile and methanol were procured from J. T. Baker, Hyderabad. Water used for comprehensive research activities was sourced from Milli-Q purification systems. Analytical grade formic acid was procured from Merk Pvt. Ltd., Mumbai, India.
Equipment
The Applied Biosystems Sciex API 4000 tandem mass spectrometer was integrated with a Shimadzu LC20ADvp liquid chromatographic system, including an auto-sampler (Shimadzu, Japan). The solvent pump is a Shimadzu LC20AD module manufactured in Japan. Analyst software (version 1.4.2: Applied Biosystems) was used to consolidate all chromatographic findings.
Quality and calibration standard solution preparation
Stock solutions of repotrectinib and apalutamide internal standard (IS) at 100 µg/ml were prepared by dissolving in a determined volume of mobile phase. Standard and quality control protocols were executed using a blank plasma sample derived from the standard stock solution of Repotrectinib. Eight linear standard levels of varying concentrations were prepared by spiking blank plasma with Repotrectinib standard solution, resulting in calibration standards at concentrations of 0.375, 0.600, 1.050, 1.900, 4.000, 7.000, 11.000, and 15.000 µg/ml. Quality Control (QC) samples were prepared at low (Low-QC), middle (middle-QC), and high (High-QC) standards by spiking blank plasma with Repotrectinib to create solutions of 1.050, 7.500, and 11.250 µg/ml, respectively. The working solution was prepared from a 500 ng/ml apalutamide stock solution using 70% acetonitrile. Processed samples were stored at-20 °C until the evaluation of the samples.
Parameters of liquid chromatography
Chromatographic resolution was attained using an ODS Zorbax C18 column (50 mm × 4.6 mm, 2.1µ) with a mobile phase consisting of methanol, 0.1% formic acid, and acetonitrile at a ratio of 50:15:35, with a flow rate of 0.5 ml/min from the stationary column. The temperatures of the auto-sampler and column oven were set to 5 °C and 40 °C, respectively. A sample injection volume of 5 µl** was used. The total chromatographic run time was 2 min, ensuring rapid analysis and adequate peak separation.
Mass spectrometric parameters
The parameters of the mass system were enhanced as follows: 30 psi nebulizer gas (N2); 4500 °C source temperature; 30 psi curtain gas (N2); 25 psi heater gas (N2); CAD gas 8 (N2); 4500 V ionspray voltage; 12 V entrance potential; 65 V declustering potential; 0.6 ml/min source flow rate with no split; collision energy (CE) 18 V for both Repotrectinib and Apalutamide; collision cell exit potential-14 V and dwell time 200 ms for Repotrectinib; collision cell exit potential-15 V for IS. Detection of product and parent ions was performed in MRM mode, using transition pairs of m/z 356.15/318.13 for Repotrectinib and 478.09/451.08 for the Apalutamide internal standard.
Protocol for sample preparation
To 250 µl of plasma (fortified with Repotrectinib to the desired concentration), 100 µl of Apalutamide (1 µg/ml) were combined. To precipitate the proteins from the sample, 4 ml of methanol was added, followed by centrifugation at 5000 rpm for 15-20 min at 5 degrees Celsius. The lyophilizer was used to dehydrate the organic component. After adding 250µl of moveable solvent to the residue, enough amounts of samples were placed into labeled Autosampler vials and then injected into an LC-MSMS system [8-11].
Validation
The linearity, accuracy, lower limit of quantification (LLOQ), range, recovery, selectivity, precision, and matrix impact of the quantitative analysis of Repotrectinib in plasma were evaluated in accordance with the Guidelines for bioanalytical method validation in pharmaceutical development. This was conducted to confirm the measurable evaluation of Repotrectinib in plasma [12-14].
RESULTS AND DISCUSSION
The chromatograms generated during the validation process successfully met the evaluation criteria, and the blank, blank+IS, and LLOQ chromatograms are shown in fig. 2 and 3, respectively.
Specificity
A 375 ng/ml sample was introduced into the LC-MSMS system under ideal liquid chromatography settings to isolate Repotrectinib from plasma impurities and endogenous substances. The specificity of the approach was evaluated by measuring plasma noise [15, 16]. The area of the interference peak must be less than 20% of the LLOQ peak area and less than 5% of the mean IS peak size. The LLOQ concentration must not vary by more than 20% from the nominal concentration (NC).
Linear plot
The calibration plot of the analytical approach was generated by establishing a standard plot correlating concentration values with peak response fractions of Repotrectinib to the internal standard. Calibration standards vary from 0.375 to 15.0 µg/ml (fig. 4) [17, 18]. The linear regression equation is y = 0.0001x+0.0012, with a coefficient of determination (r²) of 0.9997. The linear curve results were shown in table 1.
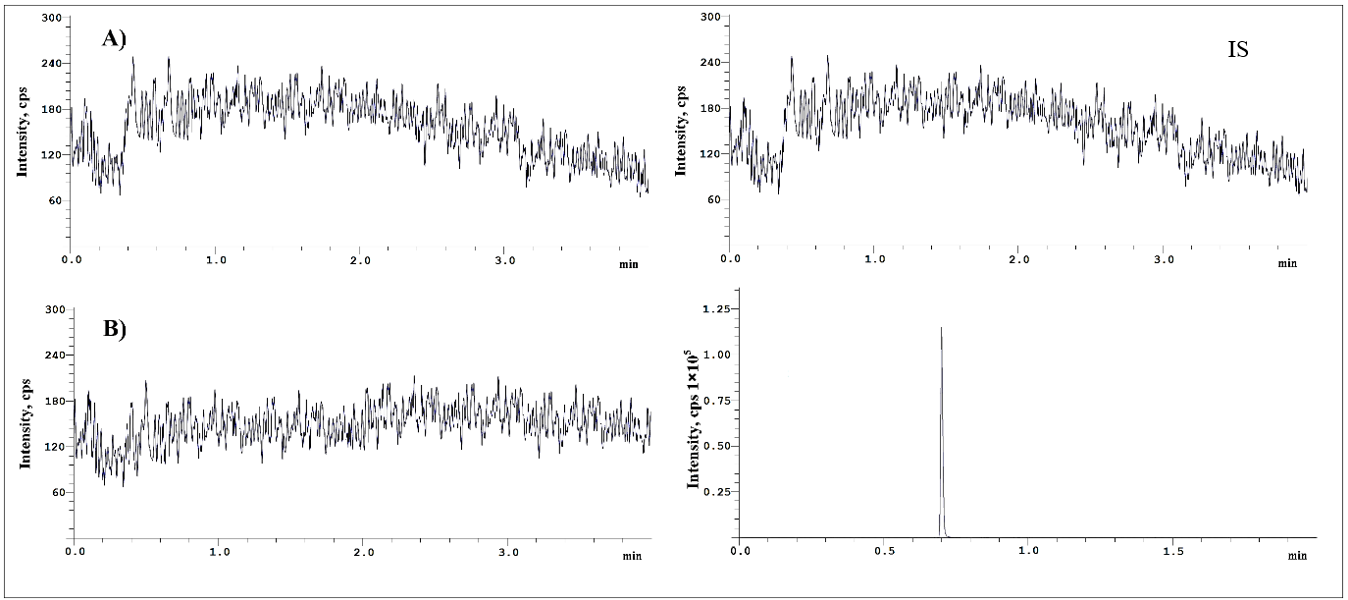
Fig. 2: Chromatograms of blank plasma(a), blank plasma with IS(b)
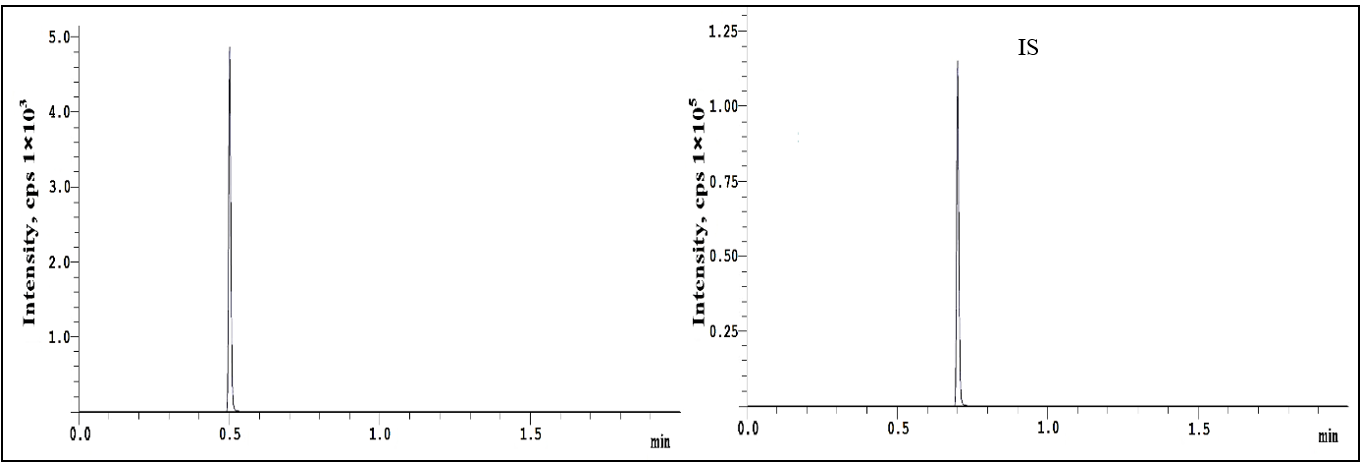
Fig. 3: Representative chromatograms of plasma spiked with repotrectinib at LLOQ and IS
Table 1: Repotrectinib linearity data
| LS-ID | Concentration (ng/ml) | Analyte responseN | IS response | Analyte/IS response |
| LS-1 | 375 | 4806 | 123853 | 0.038804 |
| LS-2 | 600 | 7761 | 124018 | 0.06258 |
| LS-3 | 1050 | 13045 | 122971 | 0.106082 |
| LS-4 | 1900 | 26832 | 123939 | 0.216494 |
| LS-5 | 4000 | 53873 | 123324 | 0.436841 |
| LS-6 | 7000 | 89943 | 123162 | 0.730282 |
| LS-7 | 11000 | 142649 | 123931 | 1.151036 |
| LS-8 | 15000 | 196981 | 123021 | 1.601198 |
| LS: Linearity standard; N=3 replicates |
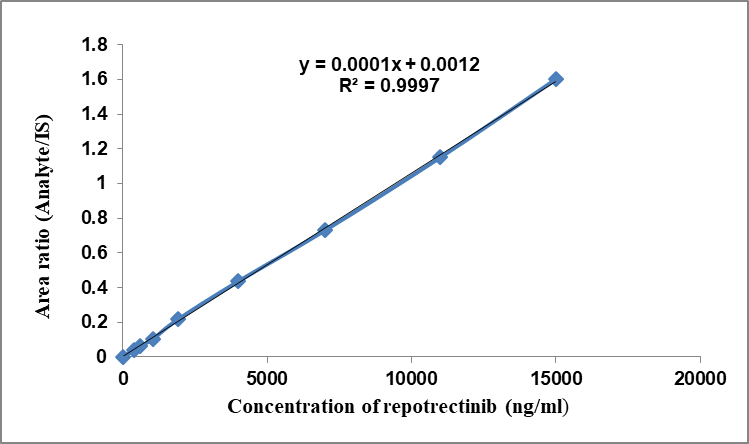
Fig. 4: Calibration curve of repotrectinib
Inter and intraday precisions
Accuracy and precision were assessed by interday and intraday evaluations. Five replicates daily were injected with the QC standards (1.05, 7.50, and 11.25 µg/ml) and LLOQC (375 ng/ml) to assess intraday precision and accuracy. Over the course of five distinct days, we evaluated our quality control standards (1.05, 7.50, and 11.25 µg/ml) and lower limit of quantification control (375 ng/ml) to ascertain our inter-day precision and accuracy. With the exception of LLOQ QC, which must not exceed 20%, the within-and between-batch %CV values for high, medium, and low concentrations should remain below 15%. The accuracy of the analytical procedure, both intraday and interday, was evaluated by examining the %CV values. The quality control samples ranged from 2.00% to 4.03%. No substantial variance was seen among any of the outcomes (15%). Table 2 presents the compiled results.
Extraction recoveries
The peak regions of extracted Repotrectinib samples were compared to those of Repotrectinib at a control concentration for recovery tests [19-22]. The average recovery percentages for Repotrectinib at High-QC (11.25 µg/ml), MQC (7.50 µg/ml), and Low-QC (1.05 µg/ml) were 103.27%, 97.26%, and 96.34%, respectively (table 3).
Effects of matrix constituents
Three copies of six blank plasma samples from six different groups were collected, spiked at Low-QC and High-QC levels, and then compared with equivalent quantities in the other treatments. Low-QC samples had a CV% of 2.90, whereas High-QC samples showed a CV% of 3.41, both conforming to the acceptance criteria of within 15%. Table 4 displays the matrix factors and their results.
Table 2: Repotrectinib Intra and interday precision data
| QC | Repotrectinib (µg/ml) | ||
| Intra batch | Average | SD | %CV |
| LLOQ | 367 | 14.82 | 4.04 |
| Low-QC | 1017 | 24.74 | 2.43 |
| Median-QC | 7721 | 298.31 | 3.86 |
| High-QC | 11364 | 395.74 | 3.48 |
| LLOQ | 384 | 13.52 | 3.52 |
| Low-QC | 1065 | 21.37 | 2.00 |
| Median-QC | 7745 | 285.94 | 3.69 |
| High-QC | 10914 | 401.84 | 3.68 |
| LLOQ | 361 | 12.85 | 3.56 |
| LLOQ | 1069 | 22.65 | 2.12 |
| Low-QC | 7621 | 278.91 | 3.66 |
| Median-QC | 11109 | 411.37 | 3.70 |
| Inter batch | Average | SD | %CV |
| LLOQ | 359 | 13.54 | 3.77 |
| Low-QC | 1085 | 26.82 | 2.47 |
| Median-QC | 7408 | 298.38 | 4.03 |
| High-QC | 11324 | 446.95 | 3.94 |
Average=6 replicates
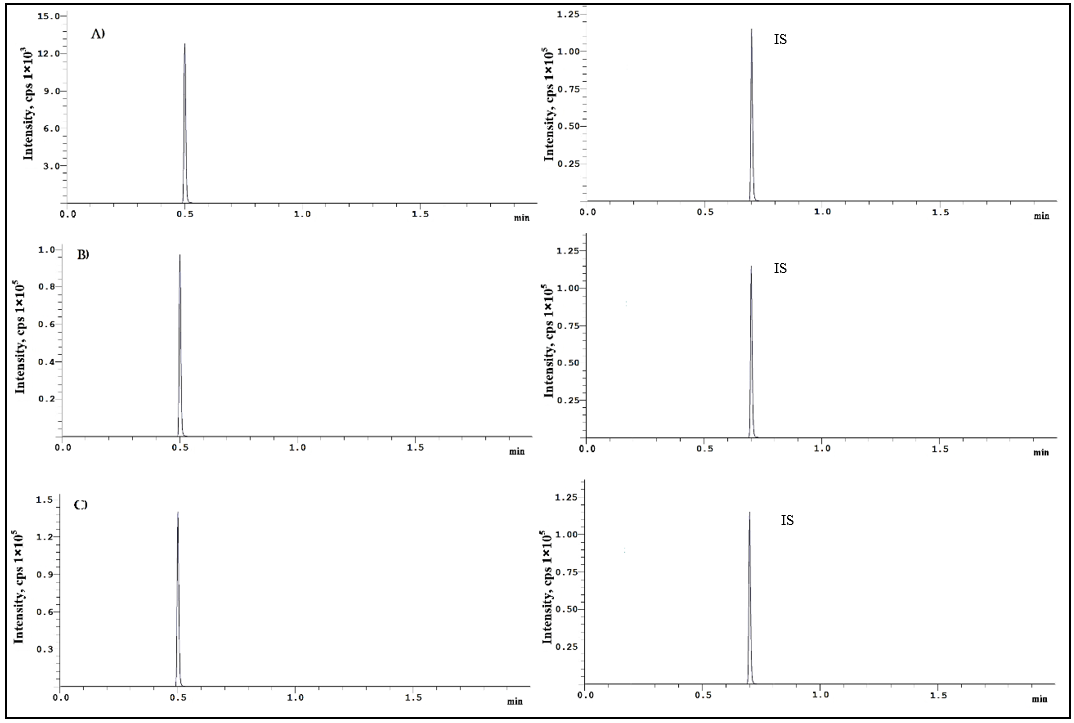
Fig. 5: Repotrectinib chromatograms at A) Low-QC B) Medium-QC and C) High-QC level
Table 3: Recovery of repotrectinib after extraction
| Concentrations level | X | Y | %Recovery | %mean recoveries | % RSD |
| LQC | 13872 | 13364 | 96.34 | 98.96 | 3.11 |
| MQC | 99081 | 96366 | 97.26 | ||
| HQC | 148569 | 153427 | 103.27 | ||
| IS | 123537 | 121486 | 98.34 | ||
| X, mean recoveries of unextracted samples; Y, mean recoveries of extracted samples; n=3 replicates; RSD: relative standard deviation. |
Application of stability studies
Stability tests were performed under various environmental settings in compliance with FDA requirements. Three freeze/thaw cycles were conducted, along with short-term (25 °C for 19 h), long-term (-70 °C for 36 days), post-preparative (10 °C for 24 h), and stock solution stability conditions [23]. Stability tests indicated that plasma samples of Repotrectinib were stable throughout the chromatographic process, extraction, and storage under various conditions. Table 5 presents stability statistics.
Table 4: Repotrectinib matrix effect outcomes
| S. No. | LQC | HQC | ||||
| Peak area in absence of matrix |
Peak area in presence of matrix |
Matrix factor | Peak area in absence of matrix |
Peak area in presence of matrix |
Matrix factor |
|
| 1 | 13754 | 13108 | 95.31 | 148364 | 141421 | 95.32 |
| 2 | 13692 | 13167 | 96.17 | 147590 | 151103 | 102.38 |
| 3 | 13703 | 13877 | 101.27 | 147952 | 142744 | 96.48 |
| 4 | 13792 | 14121 | 102.39 | 148035 | 150033 | 101.35 |
| 5 | 13688 | 13390 | 97.83 | 147894 | 152730 | 103.27 |
| 6 | 13781 | 13377 | 97.07 | 148954 | 144858 | 97.25 |
| Mean | 98.34 | 99.34167 | ||||
| ± SD | 2.85 | 3.39 | ||||
| % CV | 2.90 | 3.41 | ||||
LQC: l wqualityc ntr l; HQC: highqualityc ntr l; n=6 replicates
Table 5: The stability data of repotrectinib in human plasma under different storage conditions
| Storage condition | LQC | MQC | HQC | |||
| Accuracy (Mean%) | Precision (RSD%) |
Accuracy (Mean%) | Precision (RSD%) | Accuracy (Mean%) | Precision (RSD%) | |
| Post preparative (10℃ for 24 h) | 94.23 | 3.25 | 95.25 | 2.36 | 102.38 | 3.28 |
| Short-term (at 25 °C for 19 h) | 96.31 | 4.09 | 97.41 | 1.07 | 103.92 | 2.74 |
| Long-term (at-70 °C for 36 d) | 102.38 | 1.92 | 103.21 | 1.99 | 97.84 | 2.64 |
| Three freeze and thaw(3 cycles) | 102.64 | 1.87 | 101.11 | 3.67 | 95.43 | 3.75 |
| Stock solution (20h at 25 ℃) | 94.95 | 3.24 | 96.28 | 4.08 | 102.64 | 1.92 |
| Stock solution (17d at 2 ~ 8 ℃) | 98.26 | 3.04 | 102.84 | 3.22 | 95.37 | 2.63 |
LQC: l wqualityc ntr l; HQC: highqualityc ntr l; MQC: medianqualityc ntr l; n=3replicates
Carry over effects
A blank sample was analyzed using the highest concentration of the calibration standards in six repetitions to assess any possible carry-over. Subsequent to the HQC, the maximum reaction of the blank sample must not exceed 20% of the drug response at the LLOQ or surpass 5% of the response of Apalutamide. The carryover was deemed acceptable according to the validation standards.
DISCUSSION
Li W et al., developed a bioanalytical assay for quantification of repotrectinib [7] whish was applicable to mouse plasma. Present method was developed in the human plasma, which can be applicable to bioavailability and bioequivalence studies in the clinical research organizations. Present method calibration range was from 0.375 to 15.0 µg/ml, when compared to the reported method (1–1000 ng/ml). The linear regression equation is y = 0.0001x+0.0012, with a coefficient of determination (r²) of 0.9997. 2.00% to 4.03%. For the reported method the precisions (intra-and interday) were in the range of 1.3–8.7% which was high when compare with the present method (2.00% to 4.03%). Retention time of the present method was 0.5 min which was less when compared with the reported method (1.3 min).
CONCLUSION
A sensitive, accurate, and reproducible LC-MS/MS method was developed and validated for quantifying Repotrectinib in biological matrices. Separation was achieved on an ODS Zorbax C18 column (50 × 4.6 mm, 2.1 µm) with methanol, 0.1% formic acid, and acetonitrile (50:15:35) at 0.5 ml/min. MRM transitions were m/z 356.15→318.13 (Repotrectinib) and 478.09→451.08 (Apalutamide). Recoveries were 103.27% (HQC), 97.26% (MQC), and 96.34% (LQC). The method complies with FDA guidelines and is suitable for pharmacokinetic, bioavailability, bioequivalence, and clinical research studies.
FUNDING
Nil
AUTHORS CONTRIBUTIONS
Vasudeva Rao Bobba planned the study and developed the manuscript. Vundavilli Jagadeesh Kumar provided support for the study, while Mogili Padma supervised the study design, conduct and critically reviewed the manuscript.
CONFLICT OF INTERESTS
Declared none
REFERENCES
Yun MR, Kim DH, Kim SY, Joo HS, Lee YW, Choi HM. Repotrectinib exhibits potent antitumor activity in treatment-naive and solvent-front-mutant ROS1-rearranged non-small cell lung cancer. Clin Cancer Res. 2020 Jul 1;26(13):3287-95. doi: 10.1158/1078-0432.CCR-19-2777, PMID 32269053.
Murray BW, Rogers E, Zhai D, Deng W, Chen X, Sprengeler PA. Molecular characteristics of repotrectinib that enable potent inhibition of TRK fusion proteins and resistant mutations. Mol Cancer Ther. 2021 Dec;20(12):2446-56. doi: 10.1158/1535-7163.MCT-21-0632, PMID 34625502.
Keddy C, Shinde P, Jones K, Kaech S, Somwar R, Shinde U. Resistance profile and structural modeling of next-generation ROS1 tyrosine kinase inhibitors. Mol Cancer Ther. 2022 Feb;21(2):336-46. doi: 10.1158/1535-7163.MCT-21-0395, PMID 34907086.
Bristol Myers Squibb. AUGTYRO™ (repotrectinib) capsules for oral use: prescribing information. Princeton, NJ: Bristol Myers Squibb; 2023 Nov. Available from: https://packageinserts.bms.com/pi/pi_augtyro.pd. [Last accessed on 01 Sep 2025].
Bristol Myers Squibb. U.S. Food and Drug Administration approves augtyro™ (repotrectinib), a next-generation tyrosine kinase inhibitor (TKI), for the treatment of locally advanced or metastatic ros1-positive non-small cell lung cancer (NSCLC). Princeton, NJ: Bristol Myers Squibb; 2023 Nov 15. Available from: https://news.bms.com/news/corporate-financial/2023/US-Food-and-Drug-Administration-Approves-Augtyro/default.aspx. [Last accessed on 01 Sep 2025].
Li W, Perpinioti N, Schinkel AH, Beijnen JH, Sparidans RW. Bioanalytical assay for the new-generation ROS1/TRK/ALK inhibitor repotrectinib in mouse plasma and tissue homogenate using liquid chromatography–tandem mass spectrometry. J Chromatogr B Analyt Technol Biomed Life Sci. 2020;1144:122098. doi: 10.1016/j.jchromb.2020.122098, PMID 32278292.
Li W, Perpinioti N, Schinkel AH, Beijnen JH, Sparidans RW. Bioanalytical assay for the new-generation ROS1/TRK/ALK inhibitor repotrectinib in mouse plasma and tissue homogenate using liquid chromatography-tandem mass spectrometry. J Chromatogr B Analyt Technol Biomed Life Sci. 2020 May 1;1144:122098. doi: 10.1016/j.jchromb.2020.122098, PMID 32278292.
U.S. Food and Drug Administration. Guidance for industry: bioanalytical method validation. Rockville, MD: FDA; 2001 May.
European Medicines Agency. Guideline on bioanalytical method validation. London: EMA; 2011.
ICH Q2B: validation of analytical procedures-methodology International Conference on Harmonisation. Geneva: ICH; 1996.
Del Mar Ramirez Fernandez MM, Wille SM, Samyn N. Quantitative method validation for the analysis of 27 antidepressants and metabolites in plasma with ultraperformance liquid chromatography-tandem mass spectrometry. Ther Drug Monit. 2012;34(1):11-24. doi: 10.1097/FTD.0b013e31823bf0fd, PMID 22210095.
Wozniakiewicz M, Wietecha Posluszny R, Moos A, Wieczorek M, Knihnicki P, Koscielniak P. Development of microextraction by packed sorbent for toxicological analysis of tricyclic antidepressant drugs in human oral fluid. J Chromatogr A. 2014;1337:9-16. doi: 10.1016/j.chroma.2014.02.037, PMID 24636563.
Sellappan M, Devakumar D. Development and validation of RP-HPLC method for estimation of escitalopram oxalate and flupentixol dihydrochloride in combined dosage form and plasma. Int J Pharm Pharm Sci. 2021 Feb 1;13(2):61-6. doi: 10.22159/ijpps.2021v13i2.30158.
Gurav P, Damle M. Bioanalytical method for estimation of teriflunomide in human plasma. Int J Pharm Pharm Sci. 2022 Sep;14(9):19-23. doi: 10.22159/ijpps.2022v14i9.45151.
Krishnan VS, Bhikshapathi D, Cheruku S. Method development and validation for the quantification of abametapir in biological matrices by LC-ESI-MS/MS. Ind J Pharm Edu Res. 2024 Aug;58(3s):s1028-33. doi: 10.5530/ijper.58.3s.102.
Kiran GS, Cheruku S, Cheruku S, Bhikshapathi D, Palanati M. An LC–MS/MS quantification method development and validation for the dabrafenib in biological matrices. J App Pharm Sci. 2023 Jan;13(1):180-6. doi: 10.7324/JAPS.2023.130117.
Dadhaniya T, Chaudhary K, Mehta P. Development of LC-MS/MS method for determination of iloperidone in rabbit plasma: application to a pharmacokinetic study. Int J Pharm Pharm Sci. 2013 Feb;7(4):294-7.
Puttagunta SB, Shaik RP, Bannoth CK, Challa BS, Awen BZ. Bioanalytical method for quantification of solifenacin in rat plasma by LC-MS/MS and its application to pharmacokinetic study. J Anal Sci Technol. 2014 Jul;5(1):35. doi: 10.1186/s40543-014-0035-0.
Shankar CH, Bhikshapathi D. Method development and validation for the quantification of pexidartinib in biological samples by LC-MS/MS. Int J Pharmacol Res. 2021;13(1):6522-30.
Deepan T, Basaveswara Rao MV, Dhanaraju MD. Bioanalytical method development and validation of canagliflozin in human plasma by liquid chromatography–tandem mass spectrometry. Asian J Pharm Clin Res. 2019;12(8):46-51. doi: 10.22159/ajpcr.2019.v12i18.33228.
Gurav P, Damle M. Bioanalytical method for estimation of teriflunomide in human plasma. Int J Pharm Pharm Sci. 2022 Sep;14(9):19-23. doi: 10.22159/ijpps.2022v14i9.45151.
Lolla S, Gubbiyappa KS, Cheruku S, Bhikshapathi DV. Validation of an LC-MS/MS method for quantitation of fostemsavir in plasma. J Pharmacol Toxicol Methods. 2023;120:107254. doi: 10.1016/j.vascn.2023.107254, PMID 36863666.
Nimmakayala MR, Kolli D, Durga Bhavani PN. Bioanalytical method development and validation of maralixibat in rat plasma by LC-MS/MS detection and its application to a pharmacokinetic study. Int J App Pharm. 2023;15(4):166-72. doi: 10.22159/ijap.2023v15i4.47768.
Ravi Y, Bhikshapathi D, Cheruku S, Rajkamal B. Development of fast and simple LC-ESI-MS/MS technique for the quantification of regorafenib; application to pharmacokinetics in healthy rabbits. Curr Pharm Anal. 2021;17(4):554-63. doi: 10.2174/1573412916666191111144707.
Parmar I, Patel YA. Recent method development by analytical techniques of new FDA-approved drugs in 2021. Int J Curr Pharm Sci. 2022;14(3):17-21. doi: 10.22159/ijcpr.2022v14i3.1975.
Shankar CH, Bhikshapathi D, Medipalli V, Arjuna RN, Sadasivam RK. Bioanalytical method development and validation for the quantitation of larotrectinib in human plasma: application to pharmacokinetics in healthy rabbits. J Appl Pharm Sci. 2023 Nov;13(11):111-8. doi: 10.7324/JAPS.2023.127799.