
Int J App Pharm, Vol 18, Issue 1, 2026, 368-379Original Article
DEVELOPMENT AND VALIDATION OF A SENSITIVE LC-MS/MS METHOD FOR THE SIMULTANEOUS DETERMINATION OF NIVOLUMAB AND RELATLIMAB IN RAT PLASMA
P. VASU BABU1, D. AKILADEVI1*
Department of Pharmaceutics, Vels Institute of Science, Technology and Advanced Studies, Chennai-600117, Tamil Nadu, India
*Corresponding author: D. Akiladevi; *Email: vasubabu1987@gmail.com
Received: 31 Jul 2025, Revised and Accepted: 11 Nov 2025
ABSTRACT
Objective: This study aimed to develop and validate a sensitive, specific, and rapid LC-MS/MS method for the simultaneous quantification of nivolumab and relatlimab in rat plasma using daclizumab as internal standard (IS).
Methods: Chromatographic separation was achieved using a Luna C18 column (250 mm x 4.6 mm, 5µm) with an isocratic mobile phase consisting of ammonium formate of pH-2.5 adjusted with formic acid (A) and acetonitrile (B) in 40:60 (v/v) at a flow rate of 1.0 ml/min. Rat plasma samples were processed by liquid-liquid extraction with acetonitrile. Mass spectrometric detection was performed in positive electro spray ionization (ESI) mode using multiple reaction monitoring (MRM) for nivolumab and relatlimab. The method was validated per USFDA guidelines for selectivity, sensitivity, linearity, precision, accuracy, matrix effect, and stability.
Results: The method demonstrated excellent linearity over the concentration ranges of 12-480 ng/ml for nivolumab and 4-160 ng/ml for relatlimab, with a correlation coefficient (R²) of ≥0.999. The chromatographic separation was achieved with retention time of 3.35 min for nivolumab and 4.08 min for relatlimab. Accuracy, precision, recovery, matrix effect and stability results were found to be within the suitable limits. A MALDI-TOF mass spectrometry was used to study nivolumab, relatlimab at KDa 143.61→32.51, 145.27→21.76, and IS for m/z 144.04→ 35.61, which were ion pairs of mass analysis.
Conclusion: The developed LC-MS/MS method is highly sensitive, selective, and robust for the simultaneous estimation of nivolumab and relatlimab in rat plasma, making it suitable for preclinical and clinical pharmacokinetic investigations.
Keywords: LC-MS/MS, Rat plasma, Monoclonal antibodies, Immunotherapy, Simultaneous quantification
© 2026 The Authors. Published by Innovare Academic Sciences Pvt Ltd. This is an open access article under the CC BY license (https://creativecommons.org/licenses/by/4.0/)
DOI: https://dx.doi.org/10.22159/ijap.2026v18i1.56343 Journal homepage: https://innovareacademics.in/journals/index.php/ijap
INTRODUCTION
The growing clinical importance of Immune checkpoint inhibitors (ICIs) in cancer therapy has highlighted the need for robust bio analytical methods to characterize their pharmacokinetic profiles. Nivolumab, a fully human monoclonal antibody targeting the Programmed Death-1 (PD-1) receptor, and relatlimab, a monoclonal antibody (mAb) against Lymphocyte-Activation Gene-3 (LAG-3), have shown promising clinical outcomes, particularly when used in combination for the treatment of advanced malignancies such as metastatic melanoma [1, 2]. The fixed-dose combination of nivolumab and relatlimab (Opdualag™) was recently approved for metastatic melanoma, demonstrating superior progression-free survival over nivolumab monotherapy [3, 4]. However, the pharmacokinetic (PK) behavior of these mAbs in preclinical models remains underexplored, necessitating a robust bioanalytical method for their simultaneous quantification in biological matrices like rat plasma [5]. While ELISA is traditionally used for mAb quantification, it suffers from cross-reactivity, long assay times, and high costs [6]. Liquid chromatography–mass spectrometry (LC-MS) has become an indispensable technique in bioanalysis due to its high sensitivity, selectivity, and precision, especially for complex biological samples like plasma. In this study, we report the development and validation of a robust LC-MS method for the simultaneous estimation of nivolumab and relatlimab in rat plasma [7]. The method is designed to support preclinical PK studies by providing reliable quantification of both antibodies, ensuring accuracy even at low concentration levels. This study aims to develop and validate a novel LC-MS/MS method for the simultaneous estimation of nivolumab and relatlimab in rat plasma, addressing critical gaps in current bioanalytical approaches [8]. The method leverages MRM-based quantification of signature peptides unique to each mAb [9]. Validation adheres to ICH M-10 and FDA guidelines for sensitivity, selectivity, linearity, and matrix effects. The assay’s applicability was demonstrated in a rat PK study, supporting its utility for preclinical drug development and translational research. The developed assay represents a significant advancement in bioanalytical methodology for combination immunotherapies, enabling more efficient preclinical evaluation of these important cancer treatments. Its implementation supports critical PK assessments during drug development and facilitates translation of findings from animal models to clinical applications [10]. The aim of the study was to develop a new rapid and sensitive LC-MS/MS method for the simultaneous estimation of nivolumab and relatlimab in rat plasma using daclizumab as IS.
Very few articles were reported in the last few decades for determining the nivolumab and relatlimab by using LC-MS/MS. We encountered problems like long runtime, preparations of samples, and mobile phases, which were very costly in previous methods. But our developed method is validated as per USFDA guidelines [29] and has a shorter run time. It is more precise, less costly, and possesses good linear calibration curves, optimized MRM transitions, and an excellent recovery rate. The bioanalytical assay was applied successfully to the PK study of nivolumab and relatlimab. But to date, no novel method for the simultaneous determination of nivolumab and relatlimab was evolved. The current examination intended to explore a specific and sensitive LC-MS/MS technique towards the analysis of nivolumab and relatlimab in rat plasma and to assess the PK of these drugs after intravenous administration of test extracts into rat body.
MATERIALS AND METHODS
Instrumentation
Chromatographic analysis was conducted using a Waters 2695 HPLC system equipped with a high-speed auto sampler, column oven, and degasser. Detection was performed using a SCIEX QTRAP 5500 mass spectrometer [11], operated with Analyst software from AB SCIEX for data acquisition and processing. Working parameters of mass spectrometry after optimization as follows: Ion spray voltage 5500 V; Temperature source 550 °C; Drying gas temperature 120-250 °C; Collision gas-Nitrogen; Pressure 55 psi; Drying gas flow stream-5 ml/min; Declustering potential-40V; Entrance potential-45V; Exit potential-15V; Capillary voltage-5500 V and Dwell time 1 sec respectively.
Reagents and chemicals
Reference standards for nivolumab, relatlimab, and daclizumab were supplied by Glenmark Pharmaceuticals Ltd., Hyderabad. HPLC-grade solvents, including acetonitrile and methanol were obtained from Merck (Mumbai), and ultrapure water was generated using a Milli-Q water purification system. All remaining chemicals and reagents used were analytical reagents acquired from local vendor.
Preparation of stock solutions
Preparation of nivolumab parent stock solution (9600 ng/ml)
10 mg of nivolumab working standard was weighed and transferred into a 100 ml volumetric flask. The solution was diluted to volume with diluent. Further, 0.96 ml of this solution was diluted to 10 ml with diluent.
Preparation of relatlimab parent stock solution (3200 ng/ml)
10 mg of nivolumab working standard was weighed and transferred into a 100 ml volumetric flask. The solution was diluted to volume with diluent. Further 0.32 ml of this solution was diluted to 10 ml with diluent.
Preparation of nivolumab (960 ng/ml) and relatlimab (320 ng/ml) standard stock solution
1 ml each of nivolumab parent stock and relatlimab parent stock solutions was taken into 10 ml volumetric flask and diluted to volume with diluents.
Preparation of internal standard stock solution (800ng/ml)
10 mg of daclizumab working standard was transferred into a 100 ml volumetric flask. The solution was diluted to volume with diluent. Further, it was diluted 0.8 ml to 10 ml with diluent. Then 1 ml of above solution was taken into 10 ml volumetric flask and made up to the mark with diluents.
Preparation of nivolumab (240 ng/ml) and relatlimab (80 ng/ml) standard solution
500 µl** of the standard stock solution was transferred into a 2 ml centrifuge tube. To this, 200 µl** of plasma, 500 µl** of internal standard, 300 µl** of acetonitrile, and 500 µl** of diluent were added. The mixture was centrifuged for 20 min. The supernatant liquid was filtered and transferred into an HPLC vial.
Preparation of linearity standards
Linearity solutions [12] were prepared across a concentration range of 12 to 480 ng/ml for nivolumab and 4 to 160 ng/ml for relatlimab. The prepared samples were centrifuged at 4000 RCF for 20 min. The resulting supernatant was collected into LC vials and analyzed using the chromatographic system.
Pharmacokinetic studies
Sample preparation and analysis
Nivolumab and relatlimab were extracted from rat plasma using liquid-liquid extraction method. Briefly, 200 µl** of plasma was mixed with 300 µl** acetonitrile, 500 µl** each of standard stock and IS solutions and 500 µl** diluent vortexed for 10 min, and centrifuged at 4000 RCF (20 °C). Filter the solution into a vial and analyzed via chromatography.
Quality control levels
These were determined by replicate analysis of internal control samples at a Lower Limit of Quality Control (LLOQC), Low Quality Control (LQC), Medium Quality Control (MQC), High Quality Control (HQC) levels [13].
Study design and sample collection
Following a single-dose administration, blood samples were collected from six rats at 1, 2, 4, 6, 8, 10, 12, and 14 h post-dosing, along with a predose sample. Plasma was separated via centrifugation and stored at −70±10 °C. Quality Control (QC) samples at four concentrations were processed alongside study samples. PK parameters were calculated using WinNonlin (v5.2). Sample stability was confirmed through Incurred Sample Reanalysis (ISR), where repeat measurements of Cmax and elimination-phase samples showed ≤20% deviation from initial results.
RESULTS AND DISCUSSION
The developed LC-MS/MS method was successfully validated for the simultaneous quantification of nivolumab and relatlimab in rat plasma in accordance with regulatory guidelines. The results of the method validation demonstrated that the assay is accurate, precise, selective, and robust, making it suitable for application in PK and therapeutic monitoring studies. Optimized Chromatographic Condition and Mass Spectrometer condition was given in table 1 and 2.
Table 1: Chromatographic conditions
| Column | Luna C-18 Column (250 mm x 4.6 mm x 5µm) |
| Injection Volume | 10µl* |
| Column Temp | Ambient |
| Flow rate | 1.0 ml/min |
| Run Time | 5 min |
| Mobile Phase | Acetonitrile and 0.1M Ammonium Formate buffer in the ratio of (40:60)% v/v |
Table 2: Mass spectrometer conditions
| Collision energy | 14V |
| Ion spray voltage | 5500V |
| Source temperature | 550 °C |
| Drying gas temperature | 120-250 °C |
| Collision gas | Nitrogen |
| Drying gas flow stream | 5 ml/min |
System suitability
System suitability [14] was evaluated using six MQC replicates for nivolumab and relatlimab. All key parameters, including analyte retention time (RT) and area ratio, showed low variability as presented in table 3 and fig. 1. For nivolumab, %CV for RT and area ratio was 0.08% and 0.46%, respectively. Relatlimab showed %CV values of 0.07% for RT and 0.90% for area ratio. All results were within acceptance criteria (%CV ≤ 2.00% for RT, ≤ 5.00% for area ratio), confirming consistent instrument performance and method reliability.
Carryover
Carryover [15] testing revealed that the blank plasma samples injected immediately after the highest calibration standard showed analyte responses less than 5% of the LOQ for both nivolumab and relatlimab, indicating negligible carryover and validating the system’s suitability for high-throughput sample analysis.
Specificity
No interfering peaks were observed at the retention times of either nivolumab or relatlimab in any of the six lots of blank rat plasma tested, as depicted in table 4. The method also showed no significant interference from endogenous matrix components or commonly co-administered drugs, confirming its high specificity and suitability for clinical sample analysis and blank chromatogram was given in the fig. 2 [16].
Table 3: System suitability
| S. No. | Analyte | Concentration | Area ratio mean | SD | %CV |
| 1 | Nivolumab | 240ngm/ml | 1.2220 | 0.00558 | 0.46 |
| 2 | Relatlimab | 80 ngm/ml | 0.4070 | 0.00367 | 0.90 |
Area ratio – Analyte area/Internal Standard area
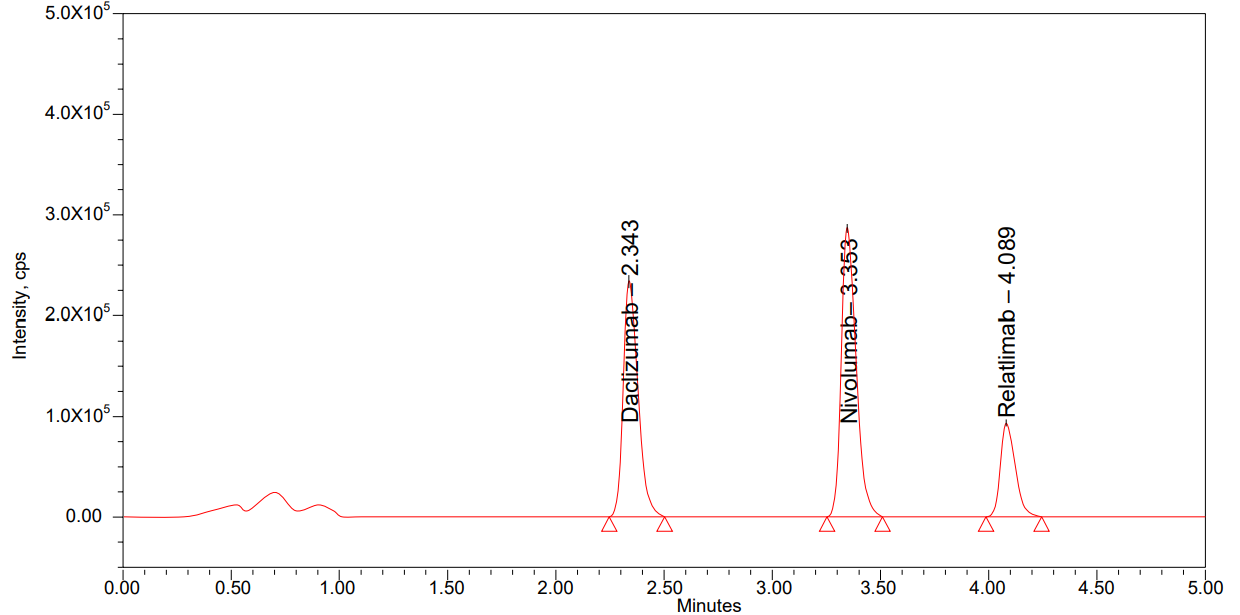
Fig. 1: Chromatogram of system suitability
Table 4: Specificity and screening of biological matrix
| Parameter | Nivolumab | Relatlimab |
| LLOQ Level | 12 ng/ml | 4 ng/ml |
| LLOQ Drug Intensity (cps) | Avg: 0.135x10⁵ | Avg: 0.044x10⁵ |
| ISTD Intensity (cps) | Avg: 2.315x10⁵ | Avg: 2.315x10⁵ |
| % Interference (Drug) | 0% | 0% |
| % Interference (ISTD) | 0% | 0% |
| Blanks (Drug and ISTD) | All Zero (No interference) | All Zero (No interference) |
| Pass/Fail | All Samples Passed | All Samples Passed |
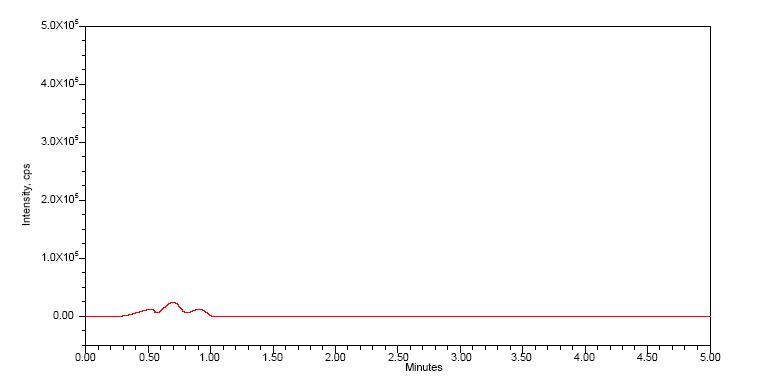
Fig. 2: Blank chromatogram
Table 5: Sensitivity results of nivolumab and relatlimab
| Replicate number | Nivolumab (LLQC) | Relatlimab (LLOQ) |
| Nominal concentration (12ng/ml) | Nominal concentration (4ng/ml) | |
| Analyte peak area | Analyte peak area | |
| 1 | 0.132x10⁵ | 0.044x10⁵ |
| 2 | 0.137x10⁵ | 0.045x10⁵ |
| 3 | 0.136x10⁵ | 0.044x10⁵ |
| 4 | 0.133x10⁵ | 0.043x10⁵ |
| 5 | 0.135x10⁵ | 0.045x10⁵ |
| 6 | 0.131x10⁵ | 0.046x10⁵ |
| n | 6 | 6 |
| Mean | 0.134x10⁵ | 0.045x10⁵ |
| SD | 0.00237 | 0.00105 |
| % CV | 1.77 | 2.36 |
| % mean Accuracy | 94.33% | 95.14% |
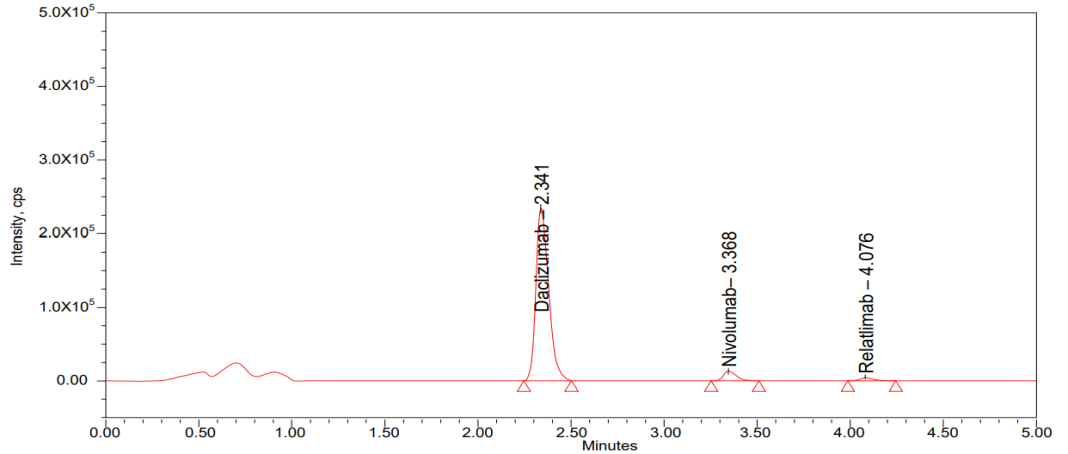
Fig. 3: Sensitivity chromatogram of LLOQ
Sensitivity
By analyzing the six different rat’s plasma samples and to check interference at the RT selectivity [17] was conducted. All parameters, like mean, Standard Deviation (SD), Coefficient of Variation (CV) and mean accuracy was presented in table 5 and chromatogram was given in the fig. 3.
Linearity
The method showed excellent linearity [18] over the calibration range of 12-480 ng/ml for nivolumab and 4-160 ngm/ml for relatlimab as mentioned in the fig. 6 and 7. Calibration curves constructed by plotting the peak area ratios of each analyte to their respective internal standards yielded correlation coefficients (r²) greater than 0.998 for both compounds across three validation batches as depicted in the table 6 and 7 The slopes and intercepts were consistent, confirming the reproducibility and proportionality of response to analyte concentration, was showed in the fig. 6 and 7.
Matrix effect
Matrix effect [19] was evaluated by comparing the peak areas of post-extraction spiked samples with neat standards. Recovery was calculated by comparing the peak areas of extracted samples with those of unextracted standards at equivalent concentrations. Percent Relative Standard Deviation (RSD) for within the signal, ion suppression/enhancement was observed as 1.0 per cent for nivolumab and relatlimab in LC-MS/MS, suggesting that under these circumstances the matrix effect on analyte ionization is within an acceptable range of ionization. The mean matrix effect ranged between 96.68% and 98.20% for nivolumab and 96.55% and 98.80% for relatlimab, with %CV values under 10% as summarized in table 8 and fig. 6, confirming the method’s robustness against variability in biological matrices.
Table 6: Linearity results of nivolumab
| Final concentration in ng/ml | Response | Area response ratio |
| 0 | 0 | 0.0 |
| 12.00 | 0.145 | 0.062 |
| 36.00 | 0.424 | 0.179 |
| 60.00 | 0.739 | 0.312 |
| 120.00 | 1.463 | 0.623 |
| 180.00 | 2.104 | 0.885 |
| 240.00 | 2.827 | 1.197 |
| 300.00 | 3.551 | 1.489 |
| 360.00 | 4.195 | 1.775 |
| 480.00 | 5.663 | 2.393 |
| Slope | 0.0050 | |
| Intercept | 0.00177 | |
| R2 Value | 0.99977 |
Table 7: Linearity results of relatlimab
| Final concentration in ng/ml | Response | Area response ratio |
| 0 | 0 | 0.0 |
| 4.00 | 0.051 | 0.022 |
| 12.00 | 0.145 | 0.061 |
| 20.00 | 0.239 | 0.101 |
| 40.00 | 0.475 | 0.202 |
| 60.00 | 0.711 | 0.299 |
| 80.00 | 0.948 | 0.402 |
| 100.00 | 1.192 | 0.500 |
| 120.00 | 1.431 | 0.605 |
| 160.00 | 1.912 | 0.808 |
Precision
Intra-day assay studies showed %CV values below 20% for both nivolumab and relatlimab at all tested concentrations as shown in table 9 and fig. 7 and 8, indicating excellent repeatability and reproducibility. These results confirm the robustness of the method under routine operating conditions.
Accuracy
The method demonstrated good accuracy [20] at three concentration levels (low, medium, and high), with mean recoveries ranging from 95.74% to 98.17% for nivolumab and 93.02% to 98.52% for relatlimab. All results were within the acceptable range of 85–115%, as recommended by regulatory guidelines, indicating that the method accurately reflects the true concentrations of the analytes in the matrix.
Ruggedness
Ruggedness [21] was assessed by evaluating intra-day and inter-day precision and accuracy across QC levels for nivolumab and relatlimab. For both analytes, %CV values for HQC, MQC, and LQC were below 1%, and LLQC values remained within acceptable limits (≤ 20%). Mean accuracies for all QC levels fell within the specified ranges (85–115% for LQC, MQC, HQC; 80–120% for LLQC) as reflected in table 10. These results confirm that the method is rugged, precise, and reproducible under varied analytical conditions.
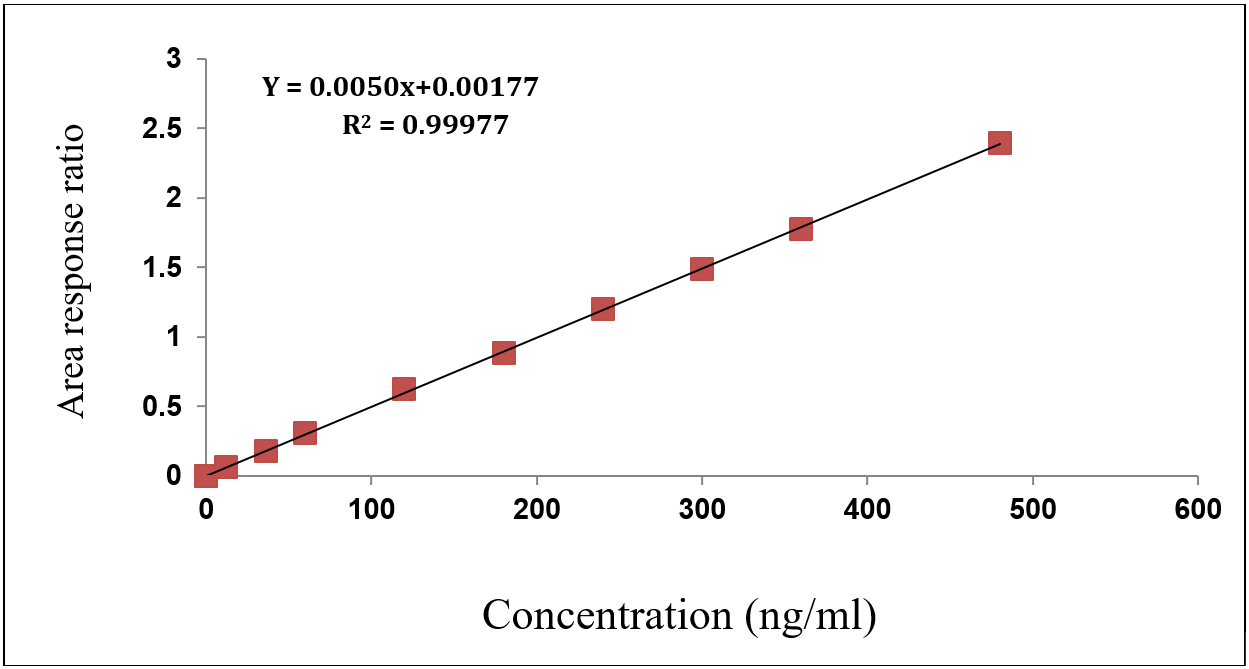
Fig. 4: Calibration plot for concentration v/s area ratio of nivolumab
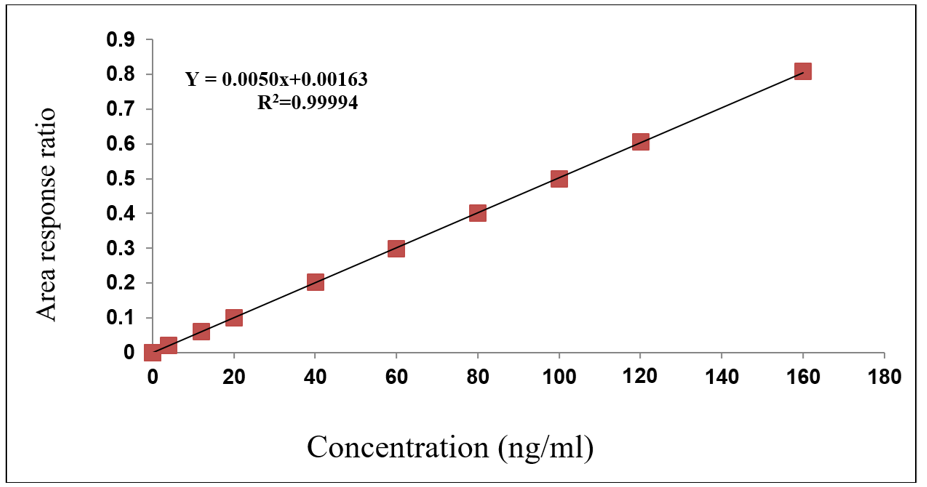
Fig. 5: Calibration plot for concentration v/s area ratio of relatlimab
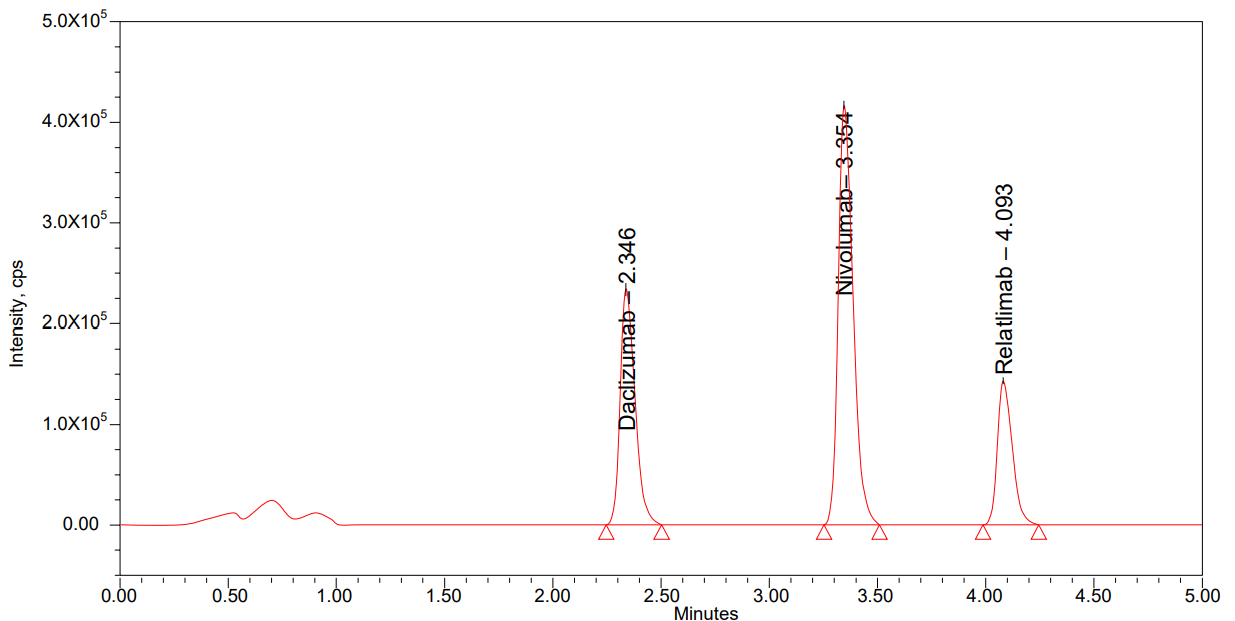
Fig. 6: Matrix effect chromatogram of LQC
Table 8: Matrix effect
| Parameter | Nivolumab HQC | Nivolumab LQC | Relatlimab HQC | Relatlimab LQC |
| Nominal Conc. (ng/ml) | 360 | 36 | 120 | 12 |
| mean Peak Area (×10⁵) | 4.185 | 0.412 | 1.402 | 0.137 |
| Standard Deviation (×10⁵) | 0.00759 | 0.00499 | 0.00439 | 0.00279 |
| %CV | 0.18% | 1.21% | 0.31% | 2.02% |
| % mean Accuracy | 98.20% | 96.68% | 98.80% | 96.55% |
n=18
Table 9: Precision and accuracy data
| Nivolumab | ||||
| LLQC | LQC | MQC | HQC | |
| Concentration | 12 | 36 | 240 | 360 |
| mean Area | 0.136x10⁵ | 0.411x10⁵ | 2.789x10⁵ | 4.177x10⁵ |
| SD | 0.00237 | 0.00539 | 0. 00539 | 0.00761 |
| %CV | 2.51 | 1.31 | 0.19 | 0.18 |
| % Accuracy | 95.74% | 96.44% | 98.17% | 98.02% |
| Relatlimab | ||||
| Concentration | 4 | 12 | 80 | 120 |
| mean Area | 0.044x10⁵ | 0.136x10⁵ | 0.922x10⁵ | 1.398x10⁵ |
| SD | 0.00117 | 0.00216 | 0.00443 | 0.00543 |
| %CV | 2.65 | 1.58 | 0.48 | 0.39 |
| % Accuracy | 93.02% | 95.84% | 97.46% | 98.52% |
n=6
Recovery of analyte
The recovery of nivolumab and relatlimab, along with the internal standard, was evaluated at low, medium, and high QC levels using mobile phase extraction to minimize matrix interference. Nivolumab showed excellent mean recoveries ranging from 95.98% to 97.68%, with precision (%CV) between 0.16% and 0.50%. Matrix factors (~0.99) and low %CVs indicated negligible matrix effects. Relatlimab demonstrated robust recoveries from 94.43% to 97.39%, with %CVs of 0.37% to 1.62%, and minimal matrix impact confirmed by matrix factors (~0.98). Both analytes metal acceptance criteria for recovery and precision (%CV ≤15%) as evidenced by table 11 and exhibited minimal ion suppression/enhancement, validating the method’s accuracy and reproducibility for biological sample analysis.
Table 11: Recovery of analyte
| Analyte | Concentration (ng/ml) | Recovery (%) | |||
| Extracted | Un Extracted | ||||
| Mean | STD Dev | Mean | STD Dev | ||
| Nivolumab | HQC (360 ng/ml) | 97.45% | 0.00674 | 97.85% | 0.00615 |
| MQC (240 ng/ml) | 97.68% | 0.01078 | 98.31% | 0.00319 | |
| LQC (36 ng/ml) | 95.98% | 0.00204 | 96.91% | 0.00207 | |
| Relatlimab | HQC (120 ng/ml) | 97.39% | 0.00596 | 98.52% | 0.00436 |
| MQC (80 ng/ml) | 97.36% | 0.00339 | 98.10% | 0.00432 | |
| LQC (12 ng/ml) | 94.43% | 0.00217 | 95.84% | 0.00216 | |
n=6
Stability
The perfectness of spiked rat plasma stored at room temperature was evaluated for twenty-four hours. The stability of spiked rat plasma stored at RT in auto sampler was evaluated for twenty-four hours [22]. The auto sampler stability (LQC,MQC and HQC) was evaluated by comparing the extract plasma samples that were injected immediately, with the samples that were re-injected after storing with wet extract stability at room temperature after 12 h and 18 h at 2-8 °C the reinjection reproducibility was evaluated by comparing the extracted plasma samples that were injected immediately, with the samples that were re injected after storing in the dry extract stability at room temperature after 12 h and 18 h at-20±3 °C the freeze thaw stability was conducted by comparing the steadiness samples that had been frozen at-31 °C and thawed 3 times, with freshly spiked internal control samples. The short-term stability was conducted 7 d at 7 °C. For long-term stability evaluation, the concentrations obtained after 24 h were compared with initial concentration [23].
Table 12: Bench top stability
| S. No. | Analyte | QC Level (Concentration ng/ml)) | %CV | % mean accuracy |
| 1 | Nivolumab | HQC | 360 | 0.19 |
| 2 | Nivolumab | MQC | 240 | 0.24 |
| 3 | Nivolumab | LQC | 36 | 0.64 |
| 4 | Relatlimab | HQC | 120 | 0.46 |
| 5 | Relatlimab | MQC | 80 | 0.25 |
| 6 | Relatlimab | LQC | 12 | 1.37 |
n=6
Table 13: Auto sampler stability
| S. No. | Analyte | QC level (Concentration ng/ml)) | % CV | % mean accuracy |
| 1 | Nivolumab | HQC | 360 | 0.28 |
| 2 | Nivolumab | MQC | 240 | 0.39 |
| 3 | Nivolumab | LQC | 36 | 1.01 |
| 4 | Relatlimab | HQC | 120 | 0.66 |
| 5 | Relatlimab | MQC | 80 | 0.74 |
| 6 | Relatlimab | LQC | 12 | 1.95 |
n=6
Table 14: Freeze thaw stability
| S. No. | Analyte | QC level (Concentration ng/ml)) | %CV | % mean accuracy |
| 1 | Nivolumab | HQC | 360 | 0.10 |
| 2 | Nivolumab | MQC | 240 | 0.25 |
| 3 | Nivolumab | LQC | 36 | 1.06 |
| 4 | Relatlimab | HQC | 120 | 0.35 |
| 5 | Relatlimab | MQC | 80 | 1.70 |
n=6
Table 15: Short-term stability
| S. No. | Analyte | QC level (Concentration ng/ml)) | %CV | % mean accuracy |
| 1 | Nivolumab | HQC | 360 | 0.13 |
| 2 | Nivolumab | MQC | 240 | 0.18 |
| 3 | Nivolumab | LQC | 36 | 1.14 |
| 4 | Relatlimab | HQC | 120 | 0.24 |
| 5 | Relatlimab | MQC | 80 | 0.21 |
| 6 | Relatlimab | LQC | 12 | 2.01 |
n=6
Mass spectrum analysis
Mass spectrometric analysis using MALDI-TOF was carried out to compare the molecular fragment profiles of two therapeutic monoclonal antibodies, nivolumab and relatlimab, using daclizumab as an IS. According to the data obtained from fig. 13, 14, 15 daclizumab displayed a consistent parent ion peak at m/z 144.04 and a corresponding fragment ion at m/z 60.08, serving as a benchmark for spectral calibration and comparative evaluation. Nivolumab exhibited a distinct fragmentation profile, with a major ion at m/z 143.61 and a prominent daughter peak at m/z 77.78, suggesting the generation of a stable, low-mass product, potentially arising from the cleavage of a structurally rigid region. Relatlimab presented a parent ion at m/z 145.27 and a corresponding fragment at m/z 86.59, indicative of a partial molecular dissociation with retention of a significant portion of the original mass. The differences in fragment ion masses among the antibodies reflect structural variability and potentially differential fragmentation behavior under laser desorption conditions. These data support the use of MALDI-TOF for qualitative comparison and characterization of monoclonal antibodies, with daclizumab providing a reliable internal control for peak alignment and intensity normalization.
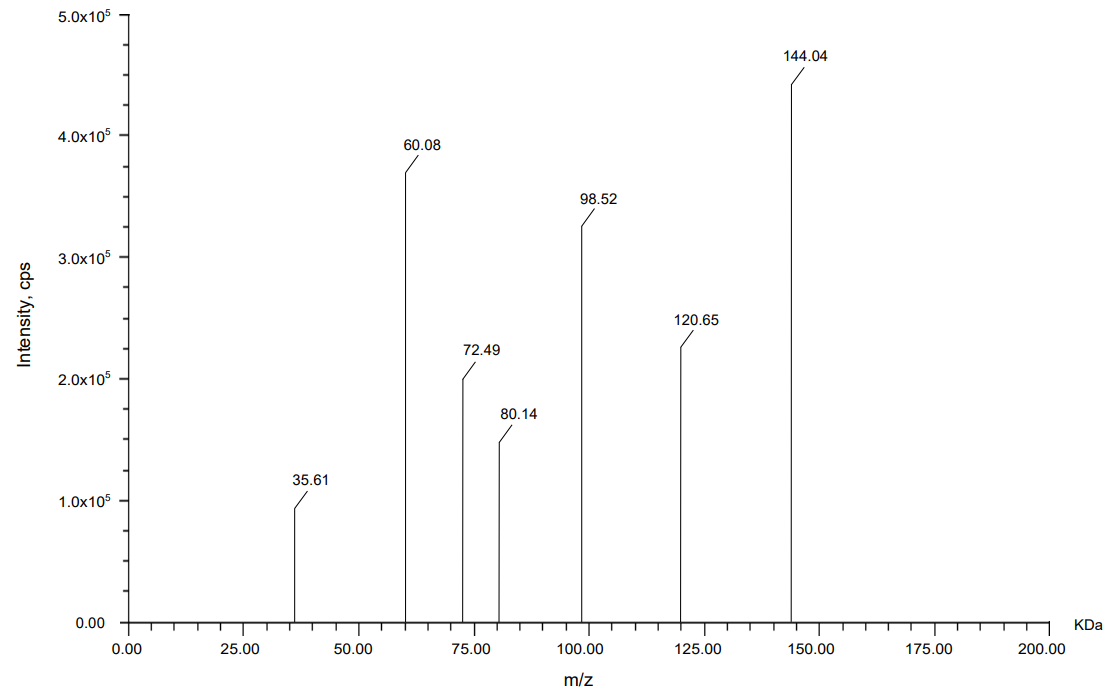
Fig. 9: Mass spectrum of internal standard daclizumab
Table 16: Precursor and daughter ion of daclizumab
| Analogue | Precursor ion (KDa) | Daughter ion with the highest intensity (KDa) |
| Daclizumab | 144.04 | 60.08 |
Table 17: Precursor and daughter ion of nivolumab
| Analogue | Precursor ion (KDa) | Daughter ion with the highest intensity (KDa) |
| Nivolumab | 143.61 | 77.78 |
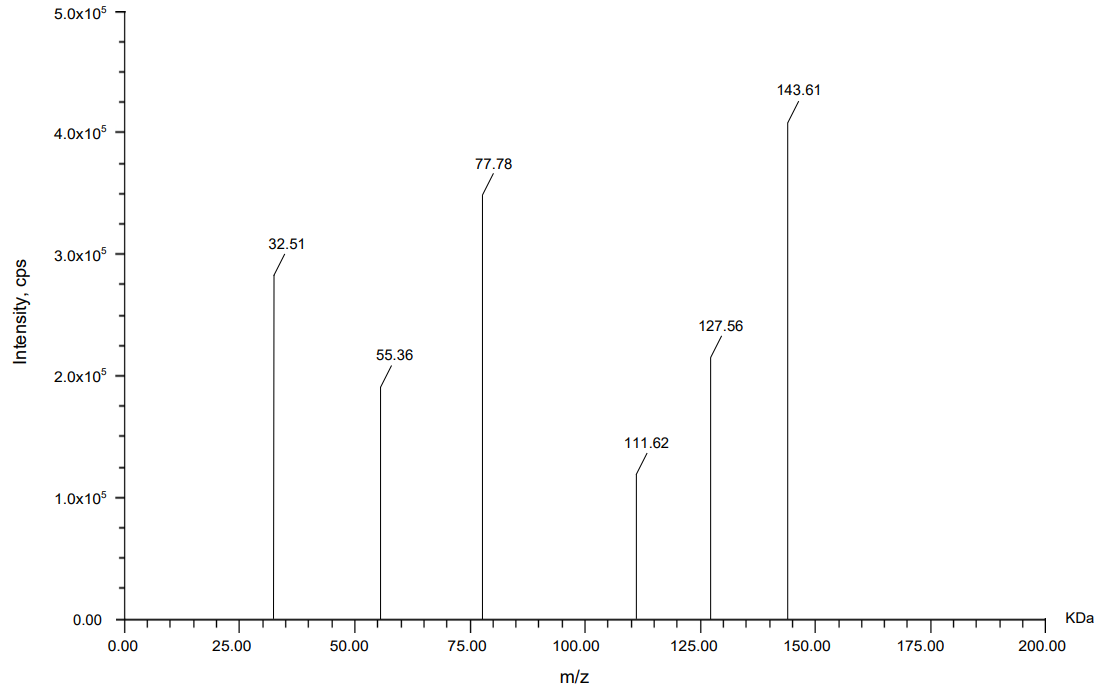
Fig. 10: Mass spectrum for nivolumab
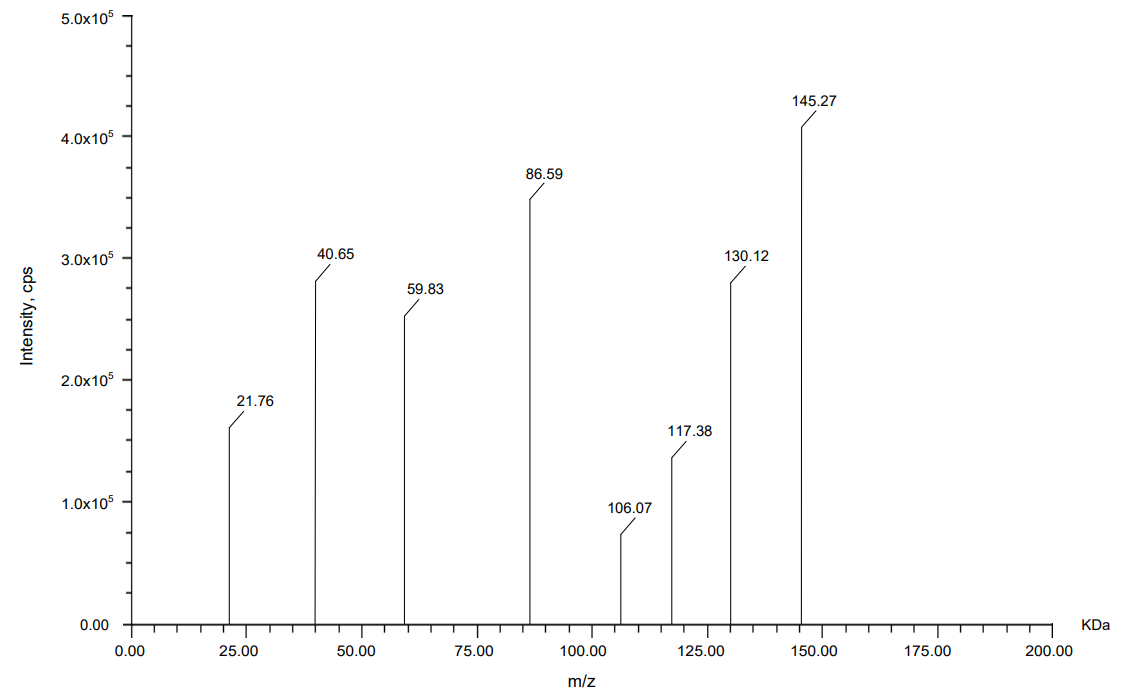
Fig. 11: Mass spectrum for relatlimab
Table 18: Precursor and daughter ion of relatlimab
| Analogue | Precursor ion (KDa) | Daughter ion with the highest intensity (KDa) |
| Relatlimab | 145.27 | 86.59 |
Pharmacokinetic assessment
The PK assessment of nivolumab and relatlimab in rats revealed comparable absorption and elimination patterns following single-dose administration. Both drugs reached Cmax at 6 h (Tmax), with nivolumab achieving a higher Cmax (232.48 ng/ml) compared to relatlimab (74.166 ng/ml). Plasma concentrations declined steadily, falling below detectable levels by 14 h. The area under the curve (AUC₀–t) was 1119 ng/hr/ml for nivolumab and 360 ng/hr/ml for relatlimab, with AUC₀–∞ values matching AUC₀–t, confirming complete exposure assessment within the sampling period mentioned in tables 19 and 20. Both drugs exhibited an identical elimination half-life (T½) of 12 h, indicating similar clearance mechanisms. These findings suggest synchronized PK, supporting potential combination therapy applications while highlighting differences in systemic exposure between the two agents. The data provide a foundation for further preclinical and clinical dose optimization studies [24].
Table 19: (A) Pharmacokinetic studies and (B) ISR results
A
Time intervals (H) |
Nivolumab (ng/ml) |
Relatlimab (ng/ml) |
1 |
226.763 |
40.162 |
2 |
171.322 |
78.675 |
4 |
90.407 |
48.843 |
6 |
49.470 |
31.510 |
8 |
24.531 |
18.348 |
10 |
11.421 |
9.498 |
12 |
0 |
4.862 |
14 |
0 |
0 |
B
Time intervals (H) |
Nivolumab (ng/ml) |
Relatlimab (ng/ml) |
1 |
215.356 |
29.649 |
2 |
156.719 |
71.080 |
4 |
80.577 |
40.190 |
6 |
38.275 |
26.239 |
8 |
17.983 |
16.037 |
10 |
7.844 |
7.849 |
12 |
0 |
2.889 |
14 |
0 |
0 |
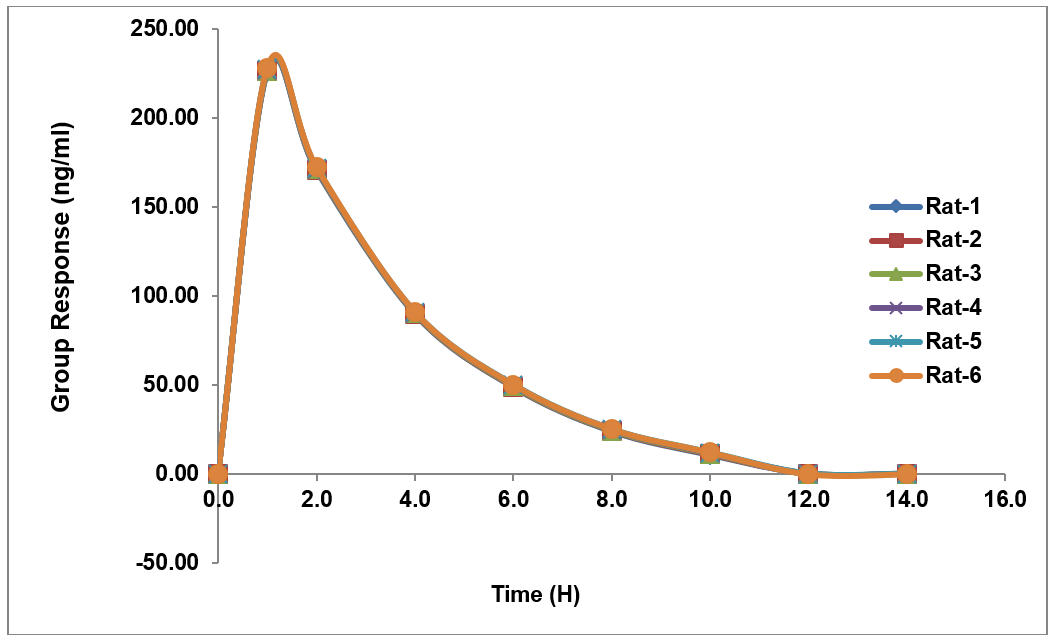
Fig. 12: Recovery plot for nivolumab in rat plasma
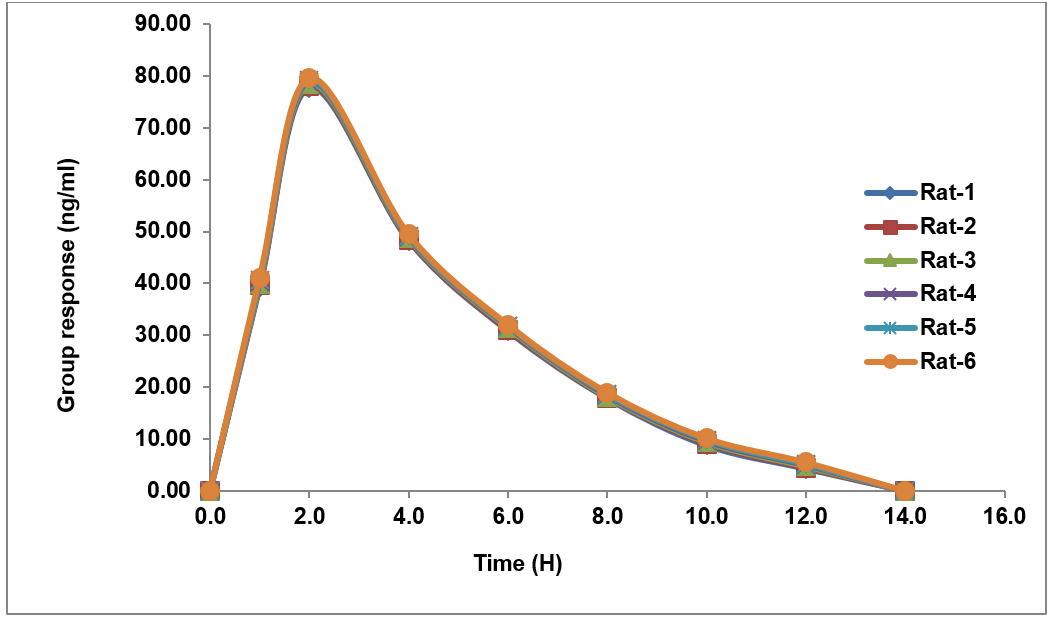
Fig. 13: Recovery plot for relatlimab in rat plasma
Table 20: Pharmacokinetic parameters of nivolumab and relatlimab
| Pharmacokinetic parameters | Nivolumab | Relatlimab |
| AUC0-t | 835 ng-h/ml | 323 ng-h/ml |
| Cmax | 226.8 ng/ml | 71.080 ng/ml |
| AUC0-∞ | 835 ng-h/ml | 323 ng-h/ml |
| tmax | 1 H | 2 H |
| T1/2 | 10 H | 12 H |
AUC0−∞: Area under the curve extrapolated to infinity, AUC0−𝑡: Area under the curve up to the last sampling time, Cmax: The maximum plasma concentration, Tmax: The time to reach peak concentration, T1/2: Time the drug concentration we took the time interval, which is present before zero concentration is taken as half-life of a drug.
CONCLUSION
The objective of this work was to develop a simple, cost-effective, rugged and sensitive method for determination of nivolumab and relatlimab in LC-MS by using daclizumab as internal standard. The work shows less run time while comparing with other work articles. The total chromatographic runtime is 5.00 min with RT for nivolumab at 3.35 and relatlimab at 4.08 min. The method is validated over a dynamic linear range of 12-480 ng/ml for nivolumab and 4-160 ng/ml for relatlimab with a correlation coefficient of r2 0.999. The intra-batch and inter-batch precision (%CV) across five levels (LLOQ, LQC, MQC, HQC, and ULOQ) is less than 15.00. This can be validated according to USFDA guidelines.
FUNDING
Nil
AUTHORS CONTRIBUTIONS
Vasu Babu has collected the literature, information about the drug and carried out the research samples and prepared the manuscript. Akila Devi check the data and reviewed the article.
CONFLICT OF INTERESTS
Declared none
REFERENCES
Tawbi HA, Schadendorf D, Lipson EJ, Ascierto PA, Matamala L, Castillo Gutierrez E. Relatlimab and nivolumab versus nivolumab in untreated advanced melanoma. N Engl J Med. 2022;386(1):24-34. doi: 10.1056/NEJMoa2109970, PMID 34986285.
Zhao Y, Hu Z, Bathena SP, Keidel S, Miller Moslin K, Statkevich P. Model-informed clinical pharmacology profile of a novel fixed-dose combination of nivolumab and relatlimab in adult and adolescent patients with solid tumors. Clin Cancer Res. 2024;30(14):3050-8. doi: 10.1158/1078-0432.CCR-23-2396, PMID 38295151.
Millet A, Khoudour N, Bros P, Lebert D, Picard G, Machon C. Quantification of nivolumab in human plasma by LC-MS/HRMS and LC-MS/MS, comparison with ELISA. Talanta. 2021;224:121889. doi: 10.1016/j.talanta.2020.121889, PMID 33379098.
Long GV, Lipson EJ, Hodi FS, Ascierto PA, Larkin J, Lao C, Grob JJ, Ejzykowicz F, Moshyk A, Garcia Horton V, Zhou ZY, Xin Y, Palaia J, McDonald L, Keidel S, Salvatore A, Patel D, Sakkal LA, Tawbi H, Schadendorf D. First-line nivolumab plus relatlimab versus nivolumab plus ipilimumab in advanced melanoma: an indirect treatment comparison using relativity-047 and CheckMate 067 trial data. J Clin Oncol. 2024 Aug 13;42(33):3926–34. doi: 10.1200/JCO.24.01125, PMID 39137386.
Colbert A, Umble Romero A, Prokop S, Chow VF, Wong T, DeSimone D. Bioanalytical strategy used in development of pharmacokinetic (PK) methods that support biosimilar programs. mAbs. 2014;6(5):1178-89. doi: 10.4161/mabs.32114, PMID 25517303, PMCID PMC4623269.
Xu L, Zhou J, Eremin S, Dias AC, Zhang X. Development of ELISA and chemiluminescence enzyme immunoassay for quantification of histamine in drug products and food samples. Anal Bioanal Chem. 2020;412(19):4739-47. doi: 10.1007/s00216-020-02730-5, PMID 32488385.
Pandey S, Pandey P, Tiwari G, Tiwari R. Bioanalysis in drug discovery and development. Pharm Methods. 2010 Oct;1(1):14-24. doi: 10.4103/2229-4708.72223, PMID 23781412, PMCID PMC3658019.
Irie K, Okada A, Yamasaki Y, Kokan C, Hata A, Kaji R. An LC-MS/MS method for absolute quantification of nivolumab in human plasma: application to clinical therapeutic drug monitoring. Ther Drug Monit. 2018 Dec;40(6):716-24. doi: 10.1097/FTD.0000000000000558, PMID 30048380.
Kuzyk MA, Parker CE, Domanski D, Borchers CH. Development of MRM-based assays for the absolute quantitation of plasma proteins. Methods Mol Biol. 2013;1023:53-82. doi: 10.1007/978-1-4614-7209-4_4, PMID 23765619.
Alwadi M, Howaidi J, Alrajhi AM, Alnakhli A, Marei MA, Tailor IK. Safety and efficacy of azacitidine with venetoclax for newly diagnosed intensive chemotherapy ineligible and relapsed or refractory acute myeloid leukemia in Arab population: a single-center retrospective study. Blood. 2021;138(Suppl 1):4423. doi: 10.1182/blood-2021-153335.
Manoranjani M. LC-MS/MS method for simultaneous estimation of ethinyl estradiol and etonogestrel in rat plasma and its application to pharmacokinetic study. High Technol Lett. 2023;29:543-56.
Talari S, Vejendla A, Shetty RK. Development and validation of a UPLC-MS/MS method for the simultaneous determination of verapamil and trandolapril in rat plasma: application to a pharmacokinetic study. Curr Pharm Anal. 2022;18(3):291-304. doi: 10.2174/1573412917666210302145711.
Naveen VM, Veeraswami B, Srinivasa Rao G. High response bio-analytical validation approach of nadolol and Bendroϑlumethiazide by LC-MS/MS on Rat plasma. IJRPS. 2020;11(SPL4):2272-9. doi: 10.26452/ijrps.v11iSPL4.4454.
Malak Y, Al Bathish A, Gazy AA, El Jamal MK. RP-HPLC and chemometric methods for the determination of two anti-diabetic mixtures; metformin hydrochloride-canagliflozin and metformin hydrochloride-gliclazide in their pharmaceutical formulation. Int J Pharm Pharm Sci. 2020;12(2):83-94. doi: 10.22159/ijpps.2020v12i2.35415.
Priyadarshini I, Akila Devi D. Development and validation of an LC-MS/MS method for the determination of tenofovir and emtricitabine. Int J App Pharm. 2024;16(2):116-23. doi: 10.22159/ijap.2024v16i2.49667.
Harsha K, Ravisankar P, Kumar Konidala S, Srinivasa Babu P. Application of newly developed and validated LC-MS/MS method for pharmacokinetic study of adagrasib and pembrolizumab simultaneously in rat plasma. J Chromatogr B. 2024;1241:124171. doi: 10.1016/j.jchromb.2024.124171.
Kamma Harsha Sri, Panchumarthy Ravisankar, Sathish Kumar Konidala, Srinivasa Babu Puttagunta. Quantification of Belzutifan in biological samples: LC-MS/MS method validation and pharmacokinetic study in rats. Biomed Chromatogr. 2025;39(9):e70168. doi: 10.1002/bmc.70168.
Raju GE, Pottendla S, Yaparthi S. Bioanalytical approach to Ensitrelvir estimation using Liquid chromatography tandem mass spectrometry and its application to pharmaceutical research. Asian J Pharm Clin Res. 2025;18(3):25-9. doi: 10.22159/ajpcr.2025v18i3.53760.
Rathore MK, Mohan Reddy TR. Tandem mass spectrometric method for the trace level determination of 2-aminopyridine: a potential genotoxic impurity in tenoxicam API. Int J Pharm Pharm Sci. 2024;16(4):50-6. doi: 10.22159/ijpps.2024v16i4.49902.
Thomas A, Varkey J. Development and validation of a new RP-HPLC analytical method for the determination of etodolac succinic acid co-crystals in spiked rabbit plasma. Int J Curr Pharm Sci. 2023;15(2):59-63. doi: 10.22159/ijcpr.2023v15i2.2098.
Raju GE, Pottendla S, Yaparthi S. Establishment and validation of LC-MS/MS technique for Lenacapavir quantification in rat plasma with application to pharmacokinetic assessment. J Appl Pharm Sci. 2025;15(5):112-20. doi: 10.7324/JAPS.2025.229006.
Raju GE, Pottendla S, Yaparthi S. Novel ultraperformance liquid chromatography method for concurrent estimation and pharmacokinetic analysis of favipiravir and molnupiravir in rat plasma. Asian J Pharm Clin Res. 2025;18(2):90-5. doi: 10.22159/ajpcr.2025v18i2.53662.
Sentat T, Lucida H, Widyati W, Nasif H. Development and validation of a bioanalytical method for the therapeutic drug monitoring of amikacin in human plasma using ultraperformance liquid chromatography tandem mass spectrometry. Int J Appl Pharm. 2024;16(1):140-4. doi: 10.22159/ijap.2024.v16s1.30.
Prabhakara Rao K, Namburi LA Amara babu, Kalyani Koganti, Babji Palakeeti, Koduri SV, Srinivas. Related substances method development and validation of an LC-MS/MS method for the quantification of Selexipag and its related impurities in rat plasma and its application to pharmacokinetic studies. SN Appl Sci. 2021;3:321. doi: 10.1007/s42452-021-04219-x.