
Int J App Pharm, Vol 18, Issue 1, 2026, 263-271Original Article
PROFILING AND GROUPING OF FLAVONOID COUMPOUND USING LCMS FROM A COMBINATION OF WHITE TURMERIC EXTRACT AND HONEY AND ITS BIOACTIVITY TEST IN OBESE RATS
NI WAYAN BOGORIANI1*, I. GUSTI AYU PUTU EKA PRATIWI2, NI MADE SUANITI3, KOMANG TRIA NOVIANA DEWI4
1Department of Chemistry, Faculty of Mathematic and Natural Science, University of Udayana, Bali-80361, Indonesia. 2Study Program of Doctor Education, Faculty of Medicine, Udayana University, Bali-80232, Indonesia. 3Megister of Chemistry, Faculty of Mathematic and Natural Science, Udayana University, Bali-80232, Indonesia. 4Department of Pharmacy, Faculty of Mathematic and Natural Science, University of Udayana, Bali-80361, Indonesia
*Corresponding author: Ni Wayan Bogoriani; *Email: *bogi_wayan@yahoo.com
Received: 05 Aug 2025, Revised and Accepted: 14 Oct 2025
ABSTRACT
Objective: The aim of this study was to identify and classify flavonoid compounds from a combination of white turmeric (Curcuma zedoaria) extract and honey, which have the potential as anti-obesity and anti-diabetic type 2 agents in obese Wistar rats.
Methods: This study used 25 rats divided into 5 groups, namely the normal, the obese, the obese group plus 100 mg/kg bw white turmeric extract, the obese group plus 100 mg/kg bw honey, and the obese group plus the combination of white turmeric and honey. The treatment was carried out for 4 w and the parameters measured were body weight, free fatty acid, glucose, and serum triglycerides levels of rats. Identification of flavonoid compounds using Liquid Chromatography-Mass Spectrometry (LC-MS).
Results: The results showed that the combination of white turmeric extract and honey was able to reduce the weight of rats (Lee's obesity index), free fatty acid (FFA), glucose and triglycerides (TG) levels with significant differences (p<0.05) from the obese rats. The average decrease in glucose, triglyceride, free fatty acid, and Lee's obesity index levels was 66.12%, 74.31%, 42.57%, and 20.59%, respectively. The results of LC-MS analysis identified 33 flavonoid compounds from white turmeric and 15 flavonoids from honey, which are thought to play an active role in reducing weight, free fatty acids, glucose and triglycerides.
Conclusion: The results of this study stated that there were 48 flavonoid compounds identified from the combination of white turmeric extract (Curcuma zedoaria) and honey which have the potential as anti-obesity and anti-diabetic type 2 in obese wistar rats.
Keywords: White turmeric (Curcuma zedoaria), Honey, Glucose, Obesity, Triglycerides, Free fatty acids
© 2026 The Authors. Published by Innovare Academic Sciences Pvt Ltd. This is an open access article under the CC BY license (https://creativecommons.org/licenses/by/4.0/)
DOI: https://dx.doi.org/10.22159/ijap.2026v18i1.56374 Journal homepage: https://innovareacademics.in/journals/index.php/ijap
INTRODUCTION
Obesity and type 2 diabetes mellitus are two metabolic conditions that are interrelated and are a global health challenge with increasing prevalence. Obesity contributes greatly to insulin resistance, which is the main trigger for the development of type 2 diabetes. According to the World Health Organization (WHO), more than 890 million adults are obese, and it is estimated that the number of people with type 2 diabetes will continue to increase significantly in the future. Efforts to control these two diseases generally involve pharmacological treatment, but long-term use is often accompanied by adverse side effects and limited effectiveness [1-4].
As awareness of the importance of natural and safe approaches in the management of chronic diseases increases, the use of natural ingredients such as medicinal plants and bee products has begun to gain widespread attention. The use of natural ingredients as an alternative or complement to conventional therapy continues to receive attention, especially because of the long-term side effects of some synthetic drugs. One group of bioactive compounds that has been shown to have various pharmacological benefits is flavonoids. Flavonoids are known to have antioxidant and anti-inflammatory activities and play a role in modulating glucose lipid metabolism [5-8].
One of the plants known to have pharmacological properties is white turmeric (Curcuma zedoaria). White turmeric contains bioactive compounds, including flavonoids, curcuminoids, and sesquiterpenes, which have been shown to have anti-inflammatory, antioxidant, hepatoprotective activities and potential as anti-obesity and anti-diabetic agents. These mechanisms include inhibition of the lipase enzyme, reduced fat accumulation, and increased insulin sensitivity [9-14].
Meanwhile, bee honey is known as a natural product rich in phenolic and flavonoid compounds such as quercetin, kaempferol, and apigenin. Honey also has antioxidant and antidiabetic properties through the mechanism of reducing oxidative stress, lowering blood glucose, and increasing glucose tolerance. The combination of white turmeric herbal extract and honey is believed to provide a synergistic effect in managing metabolic disorders, including obesity and type 2 diabetes [15-18].
Although the therapeutic potential of white turmeric and honey has been known separately, scientific studies on the combination of both are still limited, especially in the context of identifying flavonoids that play a role in anti-obesity and antidiabetic effects. Therefore, this study aims to identify flavonoid compounds using LC-MS from a combination of white turmeric extract and honey and evaluate its potential in reducing body weight, glucose, triglycerides, and free fatty acids levels in obese wistar rat animal models. By using obese wistar rat models as a representation of metabolic syndrome in humans, the results of this study are expected to provide a scientific basis for the development of effective and safe natural phytopharmaceutical candidates for the prevention and management of obesity and type 2 diabetes.
MATERIALS AND METHODS
Materials of research
The materials used in this study were white turmeric rhizome (Curcuma zedoaria Rosc.) taken from Batubulan Gianyar, Bali, 96% methanol, distilled water, 25 female Wistar rats were taken from the animal laboratory of the Faculty of Veterinary Medicine, Udayana University, with the approval of the organization of Animal Ethics Commitees with Number: B/203/UN14.2.9/PT.01.04/2024, high-fat feed [3], bee honey from Kupang, standard feed CP 550, pp indicator.
Methods
Preparation of white turmeric rhizomes
White turmeric plants were taken from Batubulan, Gianyar, Bali, in May-June and determined by Eka Karya Bali LIPI. Preparation of white turmeric rhizome was carried out using the method [11].
White turmeric rhizome extraction
One kg of fine powder (100 mesh) was placed in a 3-liter beaker, then 2.5 l of methanol solvent was added (1: 2.5) and left to soak for 24 h at 25 °C. The maceration process was repeated 3 x 24 h, then filtered. The filtrate was combined, concentrated with an Evaporator and continued with LCMS identification and then in vivo biological activity tests were carried out using Wistar rats, according to the method [11, 19].
Combination treatment of white turmeric extract and honey on obese rats
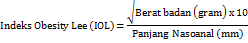
The minimum number of rats used in this study was 25 rats that were adapted for one week so that they could adjust to the new environment. During the adaptation stage, body weight was measured and standard feed was given uniformly. Twenty five of rats were divided into 5 groups and placed in cages with room temperature according to the treatment group. A total of 5 rats as a normal control group were given standard feed, while the other 20 rats were given high-fat feed until obese (IOL>0.3). All the experimental works with the animal were carried out after obtaining approval from the organization of Animal Ethics Commitees with Number: B/203/UN14.2.9/PT.01.04/2024.
The division of groups based on treatment is as follows according to the method of [6]:
Group I (normal control)
Female Wistar rats in this group were given standard feed. Every week the weight and nasoanal length of the rats were measured for 4 w.
Group II (control obese rats with high-fat diet)
Female Wistar rats in this group were fed high-fat diet and drinking water ad libitum. Every week the weight and nasoanal length of the rats were measured for 4 w.
Group III (obese rat group with 100 mg/kg bw white turmeric extract)
Obese female Wistar rats in this group were fed high-fat feed and ad libitum drinking water and were given white turmeric extract at a dose of 100 mg/kg by means of a probe. Every week the weight and nasoanal length of the rats were measured for 4 w.
Group IV (obese rat group with 100 mg/kg bw honey)
Female obese Wistar rats in this group were fed high-fat feed and adlibitum drinking water and given honey at a dose of 100 mg/kg by means of a probe. Every week the weight and nasoanal length of the rats were measured for 4 w.
Group V (Group of obese rats with a combination of white turmeric and honey) 100 mg/kg bw.
Female obese Wistar rats in this group were given high-fat feed and adlibitum drinking water and were given a combination of white turmeric extract and honey at a dose of 100 mg/kg by means of a probe. Every week the weight and nasoanal length of the rats were measured for 4 w.
After 4 w of treatment, the rats blood was taken from the eye orbital, then centrifuged at 1000 rpm. The serum obtained is then used in determining glucose, free fatty acids, and triglyceride levels. In accordance with the method of [20].
Determining blood glucose in rat
Glucose levels were assessed using a glucometer, where a drop of blood was applied to the test strip and allowed to process until the value appeared on the device. In mice, fasting blood glucose typically ranges between 50–125 mg/dl, and values exceeding 125 mg/dl indicate a diabetic state.
Determining serum triglyceride in rat
Serum triglycerides were quantified using the ERBA XL-100 chemistry analyzer with Sekisui Medical Triglyceride Kit reagents (Lot No. R1: 105R10; R2: 105R10). For the control assay, 260 µl** of Reagent R1 and 130 µl** of Reagent R2 were dispensed into the analyzer according to the designated reagent tray sequence. A 3.0 µl** aliquot of control and test sample was then introduced, with initial absorbance monitored between 600–700 nm. Subsequent sample analysis was carried out by adding 3.0 µl** of serum, and the absorbance was recorded at 546 nm to determine triglyceride concentrations.
Analysis of serum free fatty acid in rat
Free fatty acids were quantified through alkalimetric titration following lipid extraction by the Folch method. In this procedure, 200 µl** of serum was mixed with 10 ml of a methanol–chloroform solution (1:2, v/v) to extract lipids, after which water was added to induce phase separation. The chloroform fraction, containing the lipid components, was isolated, and phenolphthalein indicator (2–3 drops) was introduced. The sample was then titrated with 0.01 N NaOH until a pale pink endpoint was reached. The NaOH volume consumed was recorded and used to calculate the free fatty acid concentration in mmol/l.
Analysis of white turmeric rhizome extract and honey with LCMS method
Analysis of white turmeric and honey extracts was performed using Liquid Chromatography-Mass Spectrometry (LC-MS) using a Shimadzu LCMS-8040 lC-MS instrument. 1 µl** of the solution was transferred into a 2 ml vial and injected into the LC-MS-8040 system. The mobile phase was methanol, acetonitrile, and water in a ratio of 40:15:45 (v/v/v), respectively. The mobile phase flow rate was 0.5 ml/min, with an analysis time of 60 min, a capillary temperature of 350 °C, and a gas atomizer of 60 ml/h, and a voltage source of 5.0 V. The stationary phase used was a Shimadzu Shim Pack FC-ODS column (2 mm x 150 mm, 3 µm) with positive ionization mode. The full scan m/z range was 10-1000 [21].
Data analysis
The research data were analyzed statistically using the Analysis of Variance (ANOVA) method with the SPSS software (version 30 for Windows), applying a 95% confidence level. The statistical analysis was conducted in the following stages:
a) The Shapiro-Wilk test was used to assess the normality of the data (n = 30). A p-value greater than 0.05 indicated that the data were normally distributed.
b) Levene’s Test was used to evaluate the homogeneity of variances between groups. Homogeneity was confirmed when the p-value exceeded 0.05
C) Continued with Post Hoc tests, namely the Tukey test if homogeneous and the Tamhan test if not homogeneous [6].
RESULTS
The effect of combination of white turmeric rhizome extract (Curcuma zedoaria Rosc.) and honey on body weight of rats
The treatment on the test animals was given for 4 w. The development of rat body weight during the treatment is presented in table 1 and fig. 1.
Table 1: Average weight development of rats
Group |
Normal (g) | Obese (g) | WT100 (g) | H100 (g) | WT+H (g) |
Start |
159.99±0.83b,c,d,e | 294.72±1.17a | 296.59±1.21a | 295.71±1.77a | 296.50±0.65a |
W1 |
159.99±0.37b,c,d,e | 301.63±0.51a,c,d,e | 290.20±0.50a,b | 293.01±1.13a,b | 295.52±0.65a,b |
W2 |
169. 07±0.92b,c,d,e | 305.21±0.52a,c,d,e | 289.06±0.55a,b | 291.78±1.37a,b | 292.86±0.64a,b |
W3 |
175.99±1.43b,c,d,e | 308.89±0.41a,c,d,e | 284.60±0.47a,b | 284.27±0.56a,b | 285.00±0.31a,b |
W4 |
183.88±1.46b,c,d,e | 311.60±0.24a,c,d,e | 274.79±0.38a,b | 274.70±0.87a,b | 273.48±0.61a,b |
Mean±SD (n = 5) followed by different letters (superscript notations) in the same row indicates significant difference p<0.05 between group, obese = high-fat diet, WT 100 = white turmeric 100 mg/kg, H100 = honey 100 mg/kg, WT+H = combination of white turmeric and honey, W = week, a = normal, b = obese, c = WT 100, d = H 100, e = WT+H
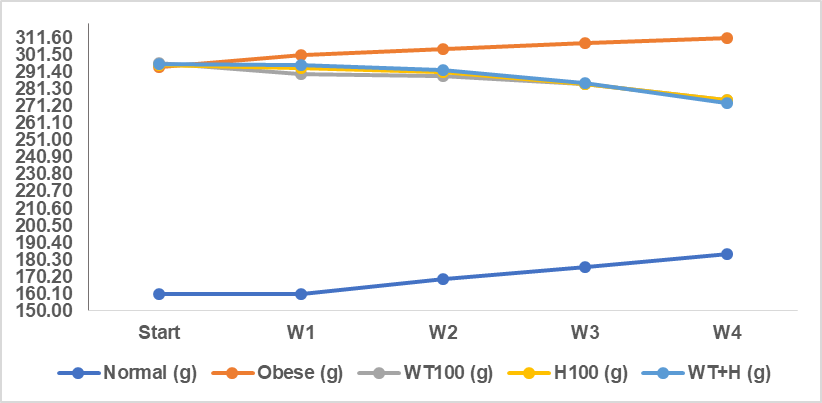
Fig. 1: Average weight development of rats
The data in table 1 and fig. 1 show that the weight development of rats during 4 w of treatment increased in the normal and obese groups every week, while in the treatment group with white turmeric extract, honey and a combination of white turmeric extract and honey, there was a decrease in weight every week, with a significantly different (p<0.05).
Effect of combination of white turmeric extract and honey on in vivo test parameters of rat blood serum
The average levels of glucose, triglycerides, free fatty acids and index obesity Lee ratio during 4 w of treatment in rats can be seen in table 2 and fig. 2.
Table 2: Average levels of in vivo test results of rat blood serum
| Group | Normal | Obese | WT100 | H100 | WT+H |
| TG (mg/dl) | 56.80±1.92b,c,d,e | 327.00±1.58a,c,d,e | 120.40±1.14a,b,d,e | 100.80±1.30a,b,c,e | 84.00±2.91a,b,c,d |
| Glucose (mg/dl) | 84.56±1.36b,c,d | 247.71±2.05a,c,d,e | 91.59±2.85a,b,d,e | 98.52±1.23a,b,c,e | 83.93±0.77b,c,d |
| Free fatty acids (mmol/l) | 17.58±0.42b | 22.24±05.8a,c,d,e | 17.38±0.56b | 18.01±0.41b | 17.03±0.25b |
| IOL | 0.26±0.01b | 0.34±0.03a,c,d,e | 0.27±0.02b | 0.27±0.02b | 0.27±0.02b |
Mean±SD (n = 5) followed by different letters (superscript notations) in the same row indicates significantly different p<0.05; Obese = high-fat diet, WT100 = white turmeric extract 100 mg/kg, H100 = honey 100 mg/kg, and WT+H = combination of white turmeric extract and honey. IOL = Index Obesity Lee. TG = Triglyceride, a = normal, b = obese, c = WT100, d = H100, e = WT+H.
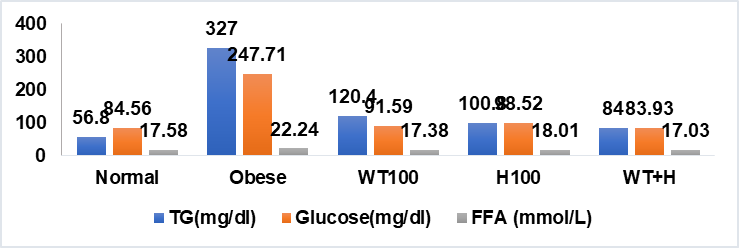
Fig. 2: Average levels of glucose, free fatty acids, TG in rat blood serum
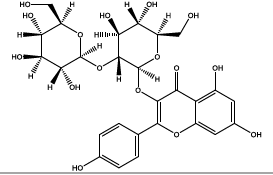
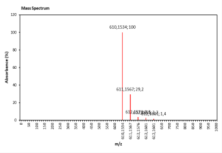
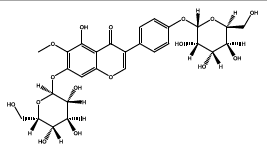
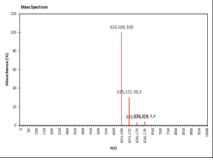
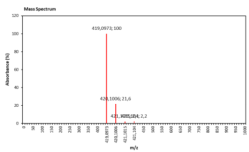
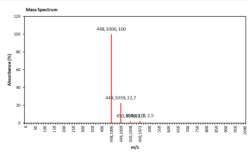
Identification and analysis of flavonoids from a combination of white turmeric extract and honey using LC-MS
The results of the identification and analysis of flavonoids from the combination of white turmeric extract and honey using LC-MS can be seen in table 3 and 4.
Based on the chromatograms in table 3 and 4, it shows that the combination of white turmeric extract and honey identified 48 compounds and 6 classes of flavonoid (flavonol, flavanone, isoflavone, flavone, flavanol, and anthocyanin) with different retention times. Chemical formula, Molecular weight, compound name, class, the structures, and mass spectrum of flavonoids can be seen in table 3 and 4.
Table 3: LC-MS chromatogram of white turmeric extract
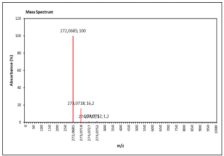
| RT(min) | Chemical formula and molecular weight (g/mol) | Name and classes of flavonoid compound | Structure of flavonoid compound | Mass spectrum |
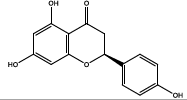
| 9.732 | Chemical formula: C15H12O5 Molecular weight: 272 |
Naringenin (Flavanone) |
 |
 |
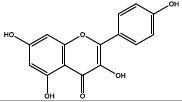
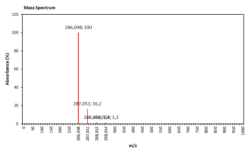
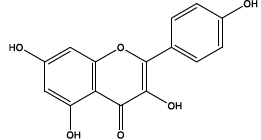
| 10.322 | Chemical formula: C15H10O6 Molecular weight: 286 |
Kaempferol (Flavonol) |
 |
 |
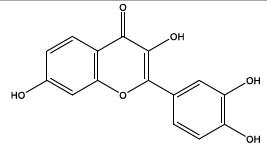
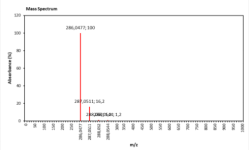
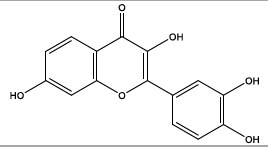
| 10.325 | Chemical formula: C15H10O6 Molecular weight: 286 |
Fisetin (Flavonol) |
 |
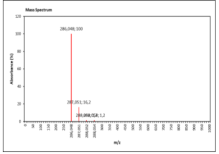 |
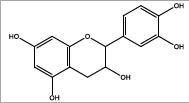
| 10.502 | Chemical formula: C15H14O6 Molecular weight: 290 |
Catechin (Flavanol) |
 |
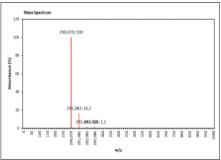 |
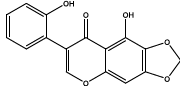
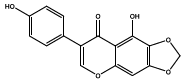
| 10.523 | Chemical formula: C16H10O6 Molecular weight: 298 |
2',5-dihydroxy-6,7-methylenedioxyisoflavone (Isoflavone) |
 |
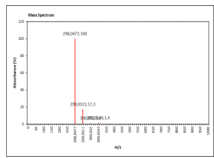 |
| 10.526 | Chemical formula: C16H10O6 Molecular weight: 298 |
5,4'-dihydroxy-6,7-methylenedioxyisoflavone (Isoflavone) |
 |
 |
| 11.040 | Chemical formula: C16H12O6 Molecular weight: 300 |
5,2'-dihydroxy-6,7-methylenedioxyflavanone (Isoflavone) |
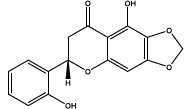 |
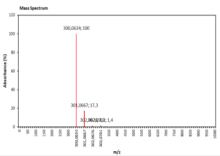 |
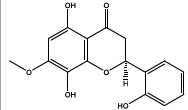
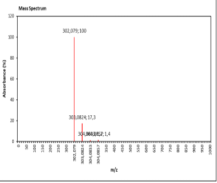
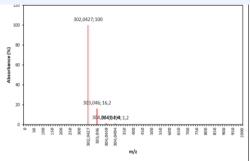
| 11.407 | Chemical formula: C16H14O6 Molecular weight: 302 |
5,8,2'-trihydroxy-7-methoxyflavanone (Flavanone) |
 |
 |
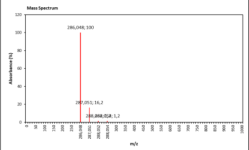
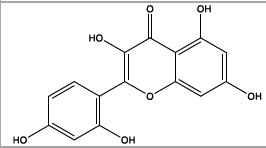
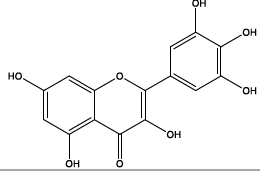
| 11.427 | Chemical formula: C15H10O7 Molecular weight: 302 |
Quercetin (Flavonol) |
 |
 |
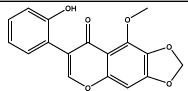
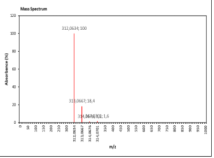
| 11.561 | Chemical formula: C17H12O6 Molecular weight: 312 |
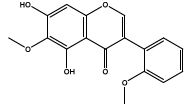
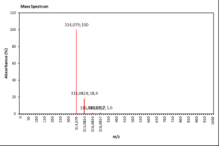
2'-hydroxy-5-methoxy-6,7-methylenedioxyisoflavone (Isoflavone) |
 |
 |
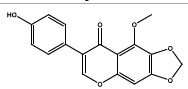
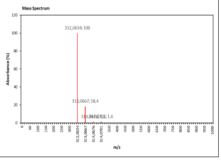
| 11.564 | Chemical formula: C17H12O6 Molecular weight: 312 |
5-methoxy-4'-hydroxy-6,7-methylenedioxyisoflavone (Isoflavone) |
 |
 |
| 11.606 | Chemical formula: C17H14O6 Molecular weight: 314 |
5,7-dihydroxy-2',6-dimethoxyisoflavone (Isoflavone) |
 |
 |
| 11.61 | Chemical formula: C16H12O7 Molecular weight: 316 |
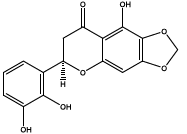
5,2',3'-trihydroxy-6,7-methylenedioxyflavanone (Flavanone) |
 |
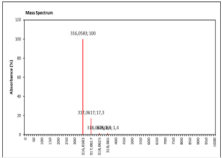 |
| 11.615 | Chemical formula: C16H12O7 Molecular weight: 316 |
5,6,7,4'-tetrahydroxy-3'-methoxyisoflavone (Isoflavone) |
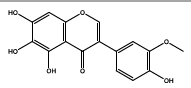 |
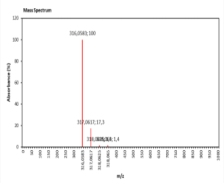 |
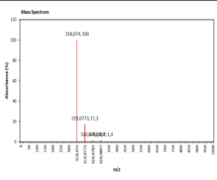
| 11.82 | Chemical formula: C16H14O7 Molecular weight: 318 |
3,5,2',3'-tetrahydroxy-7-methoxyflavanone (Flavanone) |
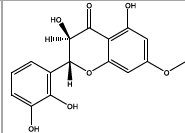 |
 |
| 012.645 | Chemical formula: C16H12O7 Molecular weight: 316 |
5,3'-dihydroxy-4',5'-dimethoxy-6,7-methylenedioxyisoflavone (Isoflavone) |
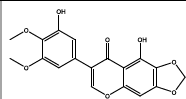 |
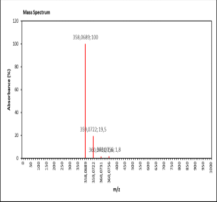 |
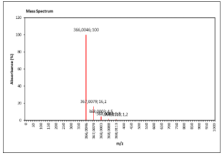
| 12.991 | Chemical formula: C20H18O8 Molecular weight: 386 |
5,3',4',5'-tetramethoxy-6,7-methylenedioxyisoflavone (Isoflavone) |
 |
 |
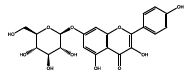
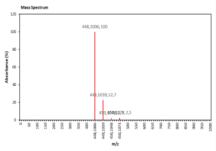
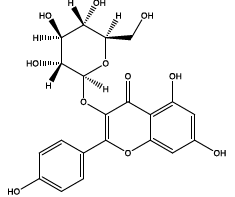
| 22.624 | Chemical formula: C21H20O11 Molecular weight: 448 |
Kaempferol-7-O-glucoside (Flavonol) |
 |
 |
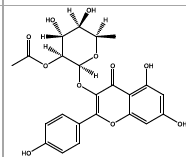
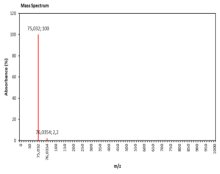
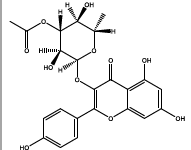
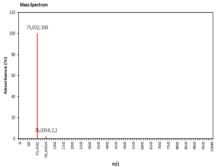
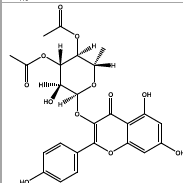
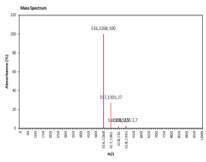
| 24.768 | Chemical formula: C23H22O11 Molecular weight: 474 |
Kaempferol 3-(2''-acetylrhamnoside) (Flavonol) |
 |
 |
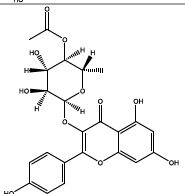
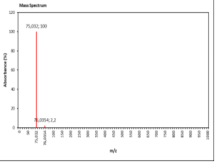
| 24.77 | Chemical formula: C23H22O11 Molecular weight: 474 |
Kaempferol 3-(3''-acetylrhamnoside) (Flavonol) |
 |
 |
| 24.773 | Chemical formula: C23H22O11 Molecular weight: 474 |
Kaempferol 3-(4''-acetylrhamnoside) (Flavonol) |
 |
 |
| 26.304 | Chemical formula: C23H24O13 Molecular weight: 508 |
8,3',5'-trihydroxy-7,4'-dimethoxyisoflavone 6-O-glucoside (Isoflavone) |
 |
 |
| 28.206 | Chemical formula: C25H24O12 Molecular weight: 517 |
Kaempferol 3-(2'',4''-diacetylrhamnoside) (Flavonol) |
 |
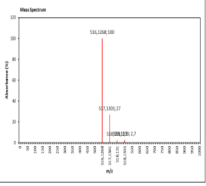 |
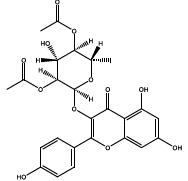
| 28.208 | Chemical formula: C25H24O12 Molecular weight: 517 |
Kaempferol 3-(3'',4''-diacetylrhamnoside) (Flavonol) |
 |
 |
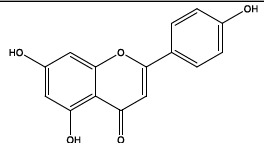
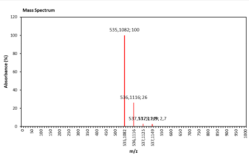
| 33.618 | Chemical formula: C27H30O15 Molecular weight: 595 |
Apigenin 7-sophoroside (Flavone) |
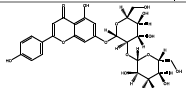 |
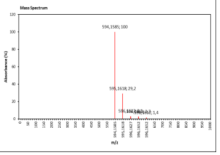 |
| 35.513 | Chemical formula: C27H30O16 Molecular weight: 611 |
6-hydroxyluteolin 7-rutinoside (Flavone) |
 |
 |
| 35.517 | Chemical formula: C27H30O16 Molecular weight: 611 |
Rutin (Flavonol) |
 |
 |
| 35.518 | Chemical formula: C27H30O16 Molecular weight: 611 |
Kaempferol 3-O-sophoroside (Flavonol) |
 |
 |
| 36.831 | Chemical formula: C28H32O16 Molecular weight: 625 |
5,7,4'-trihydroxy-6-methoxyisoflavone 7-O-glucoside-4'-O-glucoside (Isoflavone) |
 |
 |
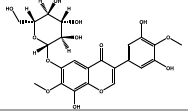
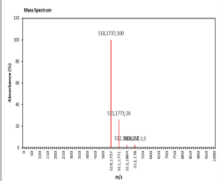
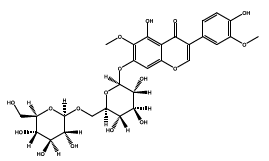
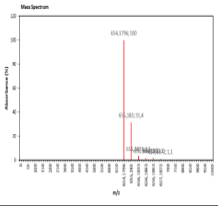
| 36.833 | Chemical formula: C29H34O17 Molecular weight: 655 |
5,7,4'-trihydroxy-6,3'-dimethoxyisoflavone 7-O-(6''-glucosylglucoside) (Isoflavone) |
 |
 |
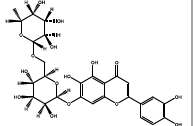
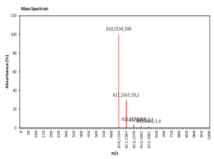
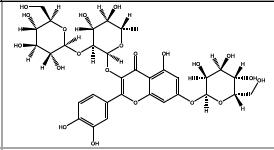
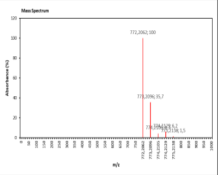
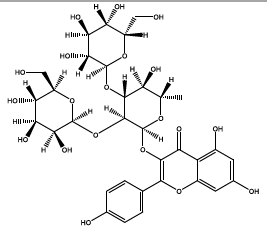
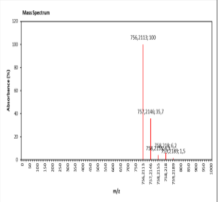
| 46.014 | Chemical formula: C33H40O21 Molecular weight: 773 |
Quercetin 3-glucosyl-(1→2)-rhamnoside-7-glucoside/ (Flavonol) |
 |
 |
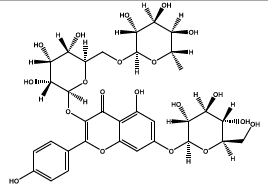
| 46.565 | Chemical formula: C33H40O20 Molecular weight: 757 |
Kaempferol 3-glucosyl-(1→2)-[glucosyl-(1→3)-rhamnoside] (Flavonol) |
 |
 |
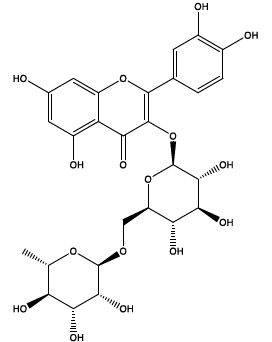
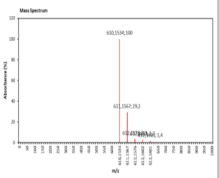
| 46.567 | Chemical formula: C33H40O20 Molecular weight: 757 |
Kaempferol 3-rutinoside-7-glucoside (Flavonol) |
 |
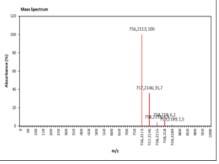 |
Table 4: LCMS chromatogram of honey
| RT(min) | Chemical formula and molecular weight (g/mol) | Name of the compound resulting from analysis | Structure and classes of flavonoid compound | Mass spectrum |
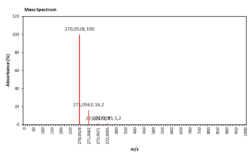
| 9.365 | Chemical formula: C15H10O5 Molecular weight: 270 |
Apigenin (Flavone) |
 |
 |
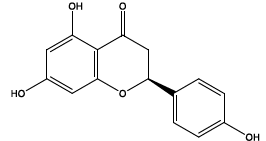
| 9.732 | Chemical formula: C15H12O5 Molecular weight: 272 |
Naringenin (Flavanone) |
 |
 |
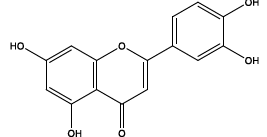
| 10.266 | Chemical formula: C15H10O6 Molecular weight: 286 |
Luteolin (Flavone) |
 |
 |
| 10.322 | Chemical formula: C15H10O6 Molecular weight: 286 |
Kaempferol (Flavonol) |
 |
 |
| 10.325 | Chemical formula: C15H10O6 Molecular weight: 286 |
Fisetin (Flavonol) |
 |
 |
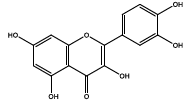
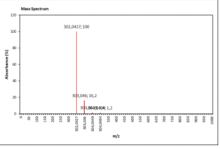
| 11.405 | Chemical formula: C15H10O7 Molecular weight: 302 |
Morin (Flavonol) |
 |
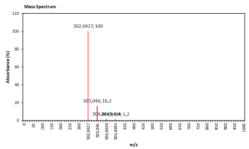 |
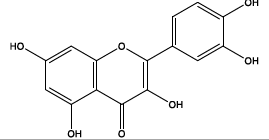
| 11.427 | Chemical formula: C15H10O7 Molecular weight: 302 |
Quercetin (Flavonol) |
 |
 |
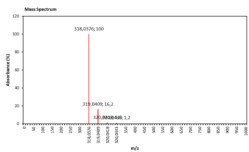
| 11.514 | Chemical formula: C15H10O8 Molecular weight: 318 |
Myricetin (Flavonol) |
 |
 |
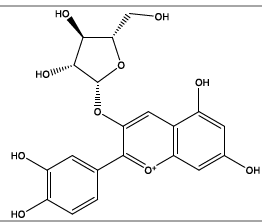
| 14.466 | Chemical formula: C20H19O10 Molecular weight: 419 |
Cyanidin-3-arabinoside (Anthocyanin) |
 |
 |
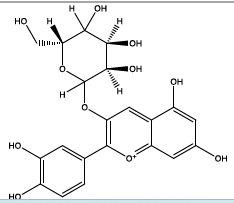
| 22.173 | Chemical formula: C21H20O11 Molecular weight: 448 |
Astragalin (Flavonol) |
 |
 |
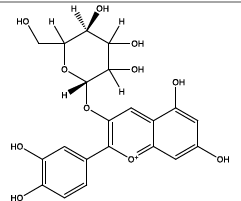
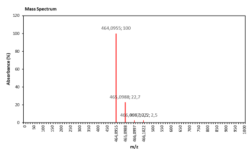
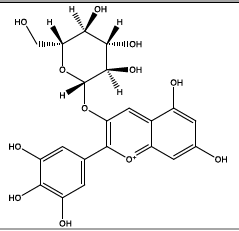
| 22.747 | Chemical formula: C21H21O11 Molecular weight: 449 |
Cyanidin-3-O-glucoside (Anthocyanin) |
 |
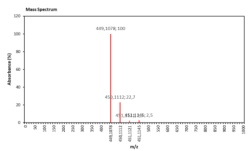 |
| 22.754 | Chemical formula: C21H21O11 Molecular weight: 449 |
Chrysanthemin (Anthocyanin) |
 |
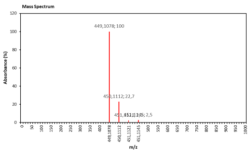 |
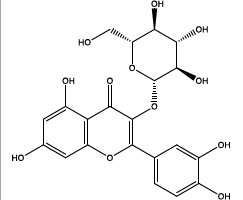
| 24.018 | Chemical formula: C21H20O12 Molecular weight: 464 |
Isoquercitrin (Flavonol) |
 |
 |
| 24.121 | Chemical formula: C21H21O12 Molecular weight: 465 |
Delphinidin-3-glucoside (Anthocyanin) |
 |
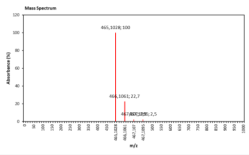 |
| 31.012 | Chemical formula: C24H23O14 Molecular weight: 535 |
Cyanidin-3-(6'-malonylglucoside) (Anthocyanin) |
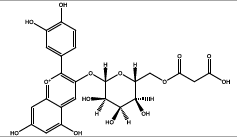 |
 |
DISCUSSION
The statistical analysis data in table 1 and fig. 1 show that the weight development of rats in the normal and obese groups experienced weight gain every week, while in the treatment group of the combination of white turmeric extract and 100 mg/kg honey, experienced weight loss every week. This indicates that intake of a combination of white turmeric extract and honey are able to suppress weight gain in rats and also the IOL decreased with a significant difference (p<0.05) from obese rats group.
The weight loss in obese rats was caused by the presence of flavonoid compounds contained in the combination of white turmeric extract and honey, which were able to suppress weight gain in obese rats. Flavonoids can inhibit the activity of pancreatic lipase, an enzyme responsible for fat digestion. Inhibition of fat can reduce absorption from food, resulting in weight loss. Flavonoids can also increase fat metabolism by stimulating the activity of enzymes involved in fat oxidation process, such as adenosine monophosphate-activated protein kinase (AMPK), which helps burn fat. Several flavonoids have been reported to reduce the activity of enzymes in the formation of new fat, such as the acetyl CoA Carboxylase (ACC) which plays a role in body fat [2, 22-24]. The results of the analysis of the combination of white turmeric and honey with LC-MS showed that there were 33 flavonoid compounds identified from the white turmeric rhizome extract (table 3) and 15 flavonoid compounds from honey (table 4). Flavonoids found in the combination of white turmeric rhizome extract and honey are bioactive compounds that can play a role in reduce weight in obese rats.
The data in table 2 and fig. 2 show that the obese group has higher levels of glucose, free fatty acids, and TG with a significant difference (p<0.05) than the normal group. This is due to the impact of obesity given a high-fat diet. In obesity, there will be an increase in free fatty acids in the blood, which will be followed by an increase in the uptake of free fatty acids by muscle tissue. Muscles in normal conditions will use glucose to produce energy. Thus, fatty acid oxidation in muscles increases, this will inhibit glucose uptake by muscles so that hyperglycemia occurs. The same condition occurs in the liver, where the liver will accommodate most of the free fatty acids and become material for gluconeogenesis, with increased gluconeogenesis, fasting blood glucose will increase and hyperglycemia occurs. This hyperglycemic condition will result in insulin resistance in the liver [5]. The data in table 2 and fig. 2 show that there is an effect of intake of combination of white turmeric and honey, which is able to reduce the average IOL, glucose, free fatty acids, and TG in the blood serum of obese rats with a significantly different (p<0.05) from the obese group. The average decrease in glucose, triglyceride, free fatty acid, and Lee's obesity index levels was 66.12%, 74.31%, 42.57%, and 20.59%, respectively.
The decrease in blood glucose, triglyceride, and free fatty acid levels in Wistar rats is thought to be due to the presence of active flavonoid compounds and have hypoglycemic and antioxidant properties. Hyperglycemia will cause increased oxidative stress and decreased endogenous antioxidants. Intake of natural antioxidants is one of the protections against diabetes progression by inhibiting peroxide reactions that damage pancreatic beta cells [13-17]. One of the secondary metabolites from the combination of white turmeric extract and honey, which plays an active role as an antiobesity and antidiabetic type 2 in obese rats is a flavonoid compounds. There are 33 flavonoid compounds from white turmeric rhizome extract and 15 flavonoid compounds from bee honey which are suspected to play an active role as anti-obesity and anti-diabetes type 2. The results of this study are supported by several researchers who reported that flavonoids have activity as antiobesity and antidiabetes [25-28].
Dzomba, 2014 reported that Flavonoids in the saphoricoside compound which is an antioxidant compound are thought to act as pancreatic lipase inhibitors and reduce appetite [23]. The results of this study are also supported by research by [29] reported that dragon fruit extract (Hylocereus costarioensis) containing flavonoids has antiobesity activity.
Quercetin and kaempferol are a class of flavonoids (Flavonol) that show antidiabetic effects in obese animal models through multi-target mechanisms, namely as antioxidants (Nrf2/HO-1), anti-inflammatory (↓NF-κB, ↓NLRP3/STING), AMPK activation, increased insulin signaling (PI3K/Akt → GLUT4), inhibition of gluconeogenesis (PEPCK/G6Pase), β-cell protection and modulation of microbiota and lipid metabolism [30-32]. Flavonoids (quercetin, kaempferol and its derivatives, apigenin, rutin, Naringenin, luteolin, catechins) in addition to increasing the activity of antioxidant in the body and also able to regenerate damaged pancreatic beta cells so that insulin deficiency can be prevented [30-43].
CONCLUSION
There are 48 flavonoid compounds identified from the combination of white turmeric rhizome extract and honey, namely 33 from white turmeric rhizome and 15 from bee honey, which are thought to play an active role as antiobesity and antidiabetes type 2 in obese rats.
ACKNOWLEDGEMENT
The author is very grateful to the students and members of researchers who have helped in the research. The author also thanks the Directorate of Research, Technology, and Community Service in 2024 through Udayana University for funding this research.
FUNDING
Nil
CONTRIBUTION OF AUTHORS
The contribution of each author to the preparation of the manuscript is as follows: Ni Wayan Bogoriani: Conceptualization, Methodology, Writing – Original Draft.
I Gusti Ayu Putu Eka Pratiwi: Data Collection, Analysis, Writing – Review and Editing.
Ni Made Suaniti: Data collection from LCMS analysis.
Komang Tria Noviana Dewi: Data collection from glucose, triglyceride, free faty acid analysis, writing
CONFLICT OF INTERESTS
The authors do not have any conflict of interest
REFERENCES
Kawser Hossain M, Abdal Dayem A, Han J, Yin Y, Kim K, Kumar Saha S. Molecular mechanisms of the anti-obesity and anti-diabetic properties of flavonoids. Int J Mol Sci. 2016;17(4):569. doi: 10.3390/ijms17040569, PMID 27092490.
Bogoriani NW, Suaniti NM, Bawa Putra AA, Lestari KD. The activity of Cordyline terminalis’s leaf extract as antidiabetic in obese Wistar rats. Int J Pharm Res Allied Sci. 2019;8(2):206-13.
Varadhan S, Simon SA. Ratio of triglycerides to high-density lipoprotein cholesterol and markers of liver injury in diabetes mellitus. Asian J Pharm Clin Res. 2019;8(6):199-201.
Murray RK, Granner DK, Rodwell VW, Biokimia H. Edisi 29. Jakarta: Buku Kedokteran EGC; 2014.
Bogoriani NW, Laksmiwati AA, Putra AA, Heltyani WE, Lestari KD, Mahayani PA. Saponins role of Bali Andong leaf as antiobesity in rats. Int J Pharm Res. 2019;11(2):382-9. doi: 10.31838/ijpr/2019.11.02.052.
Mutiara EV, Wildan A. Ekstraksi flavonoid dari daun PARE (Momordica charantia L.) berbantu gelombang mikro sebagai penurun Kadar glukosa secara in vitro. Metana. 2014;10(1):1-11. doi: 10.14710/metana.v10i01.9771.
Sarian MN, Ahmed QU, Mat So’ad SZ, Alhassan AM, Murugesu S, Perumal V. Antioxidant and antidiabetic effects of flavonoids: a structure activity relationship based study. BioMed Res Int. 2017;2017:8386065. doi: 10.1155/2017/8386065, PMID 29318154.
Marella S. Flavonoids the most potent polyphenols as antidiabetic agents: an overview. MADD. 2017;1(3):1-5. doi: 10.31031/MADD.2017.01.000513.
Tariq S, Imran M, Mushtaq Z, Asghar N. Phytopreventive antihypercholesterolmic and antilipidemic perspectives of zedoary (Curcuma zedoaria Roscoe.) herbal tea. Lipids Health Dis. 2016;15(1):39. doi: 10.1186/s12944-016-0210-y, PMID 26920896.
Saridewi I, Bogoriani NW, Suarya P. Activity of methanol extract of white turmeric rhizome (Curcuma zedoaria Rosc.) as a hypolipidemic agent in obese white Wistar rats on a high cholesterol diet. J Kimia. 2018;12(2):140-6. doi: 10.24843/JCHEM.2018.
Wardhani FM, Chiuman L, Ginting CN, Ginting SF, Nasution AN. Effects of white turmeric extract (Curcuma zedoaria) as nephroprotector in male white Wistar rats induced by copper. J Indonesian Med Assoc. 2019;69(8):258-66. doi: 10.47830/jinma-vol.69.8-2019-186.
Erny T, Veronica L, Stephanie T, Nasution CR, Ongko NX. Uji toksisitas akut ekstrak kunyit putih (Curcuma zedoaria) terhadap gambaran hstopatologi pankreas. J Kedokteran Kesehatan. 2022;9(3):351-7. doi: 10.32539/JKK.V9I3.19107.
Lee TK, Lee D, Lee SR, Ko YJ, Sung Kang K, Chung SJ. Sesquiterpenes from Curcuma zedoaria rhizomes and their cytotoxicity against human gastric cancer AGS cells. Bioorg Chem. 2019;87:117-22. doi: 10.1016/j.bioorg.2019.03.015, PMID 30884305.
Lee TK, Trinh TA, Lee SR, Kim S, So HM, Moon E. Bioactivity-based analysis and chemical characterization of anti-inflammatory compounds from Curcuma zedoaria rhizomes using LPS-stimulated RAW264.7 cells. Bioorg Chem. 2019;82:26-32. doi: 10.1016/j.bioorg.2018.09.027, PMID 30267971.
Pauliuc D, Dranca F, Oroian M. Antioxidant activity total phenolic content individual phenolics and physicochemical parameters suitability for Romanian honey authentication. Foods. 2020;9(3):306. doi: 10.3390/foods9030306, PMID 32182719.
Cianciosi D, Forbes Hernandez TY, Afrin S, Gasparrini M, Reboredo Rodriguez P, Manna PP. Phenolic compounds in honey and their associated health benefits: a review. Molecules. 2018;23(9):2322. doi: 10.3390/molecules23092322, PMID 30208664.
Nolan VC, Harrison J, Cox JA. Dissecting the antimicrobial composition of honey. Antibiotics. 2019;8(4):251. doi: 10.3390/antibiotics8040251, PMID 31817375.
Bogoriani NW, Suaniti NM, Bawa Putra AA, Pradnya Lestari KD, Heltyani WE. The effect of Cordyline terminalis’s leaf extract on lipid profile, obesity and liver function in obesity-induced rats. Syst Rev Pharm. 2020;11(11):1080-6. doi: 10.31838/srp.2020.11.154.
Sukadana IM, Bogoriani NW, Ariani M. Compounds in the stem of Etlingera elatior can reduce the levels of free fatty acid and blood glucose in obesity Wistar rats. Res J Pharm Technol. 2023;16(10):4530-6. doi: 10.52711/0974-360X.2023.00738.
Shimadzu. LC solution LC getting started Guide. Shimadzu Corporation Japan; 2014.
Vinayagam R, Xu B. Antidiabetic properties of dietary flavonoids: a cellular mechanism review. Nutr Metab (Lond). 2015;12(60):60. doi: 10.1186/s12986-015-0057-7, PMID 26705405.
Dzomba P, Musekiwa. Anti-obesity and antioxidant activity of dietary flavonoids from Dioscorea steriscus tubers. J Coast Life Med. 2014;2(6):465-70. doi: 10.12980/JCLM.2.201414B8.
Hussein SA, El Senosi Y, EL Sharkawy GH. Antiobesity activity and hypolipidemic effect of Proanthocyanidins in rats fed a high-fat diet. Benha Vet Med J. 2018;35(2):364-79. doi: 10.21608/bvmj.2018.96442.
Gogoi A, Gogoi N, Neog B. Dubious anti-obesity agent HCA from garcinia: a systematic review. Int J Pharm Sci. 2015;7(7):1-8.
You JS, Lee YJ, Kim KS, Kim SH, Chang KJ. Anti-obesity and hypolipidaemic effects of Nelumbo nucifera seed ethanol extract in human pre-adipocytes and rats fed a high-fat diet. J Sci Food Agric. 2014;94(3):568-75. doi: 10.1002/jsfa.6297, PMID 23824592.
Ardalani H, Hejazi Amiri F, Hadipanah A, Kongstad KT. Potential antidiabetic phytochemicals in plant roots: a review of in vivo studies. J Diabetes Metab Disord. 2021;20(2):1837-54. doi: 10.1007/s40200-021-00853-9, PMID 34900828.
Abdullah, Angelina, Yumna M, Arbianti R, Utami TS, Hermansyah H. Flavonoid isolation and identification of mother-in-law’s tongue leaves (Sansevieria trifasciata) and the inhibitory activities to xanthine oxidase enzyme. E3S Web Conf. 2018;67:03011. doi: 10.1051/e3sconf/20186703011.
Suastuti NG MDA, Bogoriani, NW, Bawa Putra, AA. Activity of hylocereus costarioensis’s extract as antiobesity and hypolipidemic of obese rats. Int J Pharm Res Allied Sci. 2018;7(1):201-8.
Yi H, Peng H, Wu X, Xu X, Kuang T, Zhang J. The therapeutic effects and mechanisms of quercetin on metabolic diseases: pharmacological data and clinical evidence. Oxid Med Cell Longev. 2021;2021:6678662. doi: 10.1155/2021/6678662, PMID 34257817.
Aghababaei F, Hadidi M. Recent advances in potential health benefits of quercetin. Pharmaceuticals (Basel). 2023;16(7):1020. doi: 10.3390/ph16071020, PMID 37513932.
Yumna M, Angelina, Abdullah AR, Arbianti R, Utami TS, Hermansyah H. Effect of mother-in-law’s tongue leaves (Sansevieria trifasciata) extract’s solvent polarity on anti-diabetic activity through in vitro α-glucosidase enzyme inhibition test. E3S Web Conf. 2018;67:03003. doi: 10.1051/e3sconf/20186703003.
Moore WT, Luo J, Liu D. Kaempferol improves glucose uptake in skeletal muscle via an AMPK-dependent mechanism. Food Sci Hum Wellness. 2023;12(6):2087-94. doi: 10.1016/j.fshw.2023.03.028.
Chen S, Jiang H, Wu X, Fang J. Therapeutic effects of quercetin on inflammation, obesity and type 2 diabetes. Mediators Inflamm. 2016;2016(1):9340637. doi: 10.1155/2016/9340637, PMID 28003714.
Dhanya R. Quercetin for managing type 2 diabetes and its complications an insight into multitarget therapy. Biomed Pharmacother. 2022;146:112560. doi: 10.1016/j.biopha.2021.112560, PMID 34953390.
Parveen S, Bhat IU, Bhat R. Kaempferol and its derivatives: biological activities and therapeutic potential. Asian Pac J Trop Biomed. 2023;13(10):411-20. doi: 10.4103/2221-1691.387747.
Siddiquee R, Mahmood T, Ansari VA, Ahsan F, Bano S, Ahmad S. Apigenin unveiled: an encyclopedic review of its preclinical and clinical insights. Discov Plants. 2025;2(1):1-24. doi: 10.1007/s44372-024-00039-6.
Tobar Delgado E, Mejia Espana D, Osorio Mora O, Serna Cock L. Rutin: family farming products extraction sources industrial applications and current trends in biological activity protection. Molecules. 2023;28(15):5864. doi: 10.3390/molecules28155864, PMID 37570834.
Rajappa R, Sireesh D, Salai MB, Ramkumar KM, Sarvajayakesavulu S, Madhunapantula SV. Treatment with narigenin evatetes the activity of transcription Nrf2 to protect pancreatic β-cells from streptozotocin-induced diabetes in vitro and in vivo. Front Pharmacol. 2019;9(1562):1-20. doi: 10.3389/fphar.2018.0156.
Huang L, Kim MY, Cho JY. Immunopharmacological activities of luteolin in chronic diseases. Int J Mol Sci. 2023;24(3):2136. doi: 10.3390/ijms24032136, PMID 36768462.
Sheng Y, Sun Y, Tang Y, Yu Y, Wang J, Zheng F. Catechins: protective mechanism of antioxidant stress in atherosclerosis. Front Pharmacol. 2023;14:1144878. doi: 10.3389/fphar.2023.1144878, PMID 37033663.
Bogoriani NW, Pratiwi IG, Bawa IG, Dewi KTN, Fudholi A. Effect of intake of lidah mertua (Sansevieria trifasciata laurentii) leaf extract on free fatty acid, glucose and triglyceride levels in obese Wistar rats and compound identification by LC-MS/MS [Sansevieria trifasciata Laurentii]. Int J Des Nat Ecodyn. 2025;20(7):1533-40. doi: 10.18280/ijdne.200710.
Bogoriani NW, Eka Pratiwi IG, Mirawati NW, Astiti Asih IA, Dewi KT. Therapeutic potential of red ginger (Zingiber officinale var. Rubrum) bioactive compounds in obesity associated metabolic parameters of Wistar rats. Biomed Pharmacol J. 2025;18(3):2239-48. doi: 10.13005/bpj/3250.