
Int J App Pharm, Vol 18, Issue 1, 2026, 514-525Original Article
OPTIMIZATION, FORMULATION, AND EVALUATION OF A TOPICAL ANTI-AGING CREAM INCORPORATING CARROT (DAUCUS CAROTA L.) EXTRACT FOR ENHANCED SKIN REJUVENATION
BENNI ISKANDAR1,2,3*, HAZRINA NISA SORAYA1,2, NOFRIYANTI1,2, CHING PENG-WEI4,5
1Department of Pharmaceutical Technology, Riau College of Pharmaceutical Sciences (STIFAR), Pekanbaru-28292, Riau, Indonesia. 2Riau College of Pharmaceutical Sciences (STIFAR), Pekanbaru-28292, Riau, Indonesia. 3MD Research ltd, 25 Indescon Square London, London-110301, United Kingdom. 4BioMed Laboratories ltd, Cardif, Wales MTWRA-2109, United Kingdom. 5School of Pharmacy, College of Pharmacy, Taipei Medical University, Taipei, Taiwan-11031, East Asia
*Corresponding author: Benni Iskandar; *Email: benniiskandar@stifar-riau.ac.id
Received: 04 Aug 2025, Revised and Accepted: 28 Oct 2025
ABSTRACT
Objective: The study aimed to optimize the formulation of an anti-aging cream incorporating carrot extract (Daucus carota L.) and assess its physicochemical stability and preliminary anti-aging effects. The antioxidant properties of carrot extract are recognized but considered mild, and the study sought to explore its potential benefits in topical cosmetic formulations.
Methods: The cream formulations were prepared with varying concentrations of Stearic Acid (8–12%) and Triethanolamine (TEA) (0.5–1%), utilizing the Box–Behnken Design (BBD) methodology for optimization. The formulations were analyzed for physicochemical properties such as pH, adhesion, and spreadability. Optimization was carried out using Design Expert software (Version 13). Clinical testing on two volunteers was conducted over a four-week period to assess the effects on skin hydration, pore reduction, spot reduction, and wrinkle reduction.
Results: The optimized formulation contained 10.04% Stearic Acid and 0.63% TEA, showing favorable physicochemical properties (pH 5.53±0.25, adhesion 7.13±0.12 min, spreadability 5.06±0.14 cm). The formulation remained stable without phase separation. Clinical results demonstrated improvements in skin hydration (76.74%), pore reduction (63.15%), spot reduction (62.22%), and wrinkle reduction (63.63%). However, these effects were not statistically significant when compared to the cream base (p>0.05).
Conclusion: The optimized carrot extract cream showed good physicochemical stability and safety for topical use. Despite promising results in terms of skin benefits, the relatively mild antioxidant activity of carrot extract and the lack of statistically significant clinical effects suggest that further controlled trials, including placebo groups, are needed to confirm the cream’s efficacy.
Keywords: Daucus carota L., Anti-aging cream, Antioxidant activity, Box–behnken design, Optimization
© 2026 The Authors. Published by Innovare Academic Sciences Pvt Ltd. This is an open access article under the CC BY license (https://creativecommons.org/licenses/by/4.0/)
DOI: https://dx.doi.org/10.22159/ijap.2026v18i1.56387 Journal homepage: https://innovareacademics.in/journals/index.php/ijap
INTRODUCTION
Premature skin aging is a prevalent condition marked by the early onset of wrinkles, dryness, enlarged pores, and pigmentation changes. These manifestations are primarily driven by oxidative stress resulting from excessive free radical activity, which damages skin cells and accelerates the aging process. Additionally, external factors such as ultraviolet radiation, pollution, smoking, and inadequate nutrition further exacerbate the development of premature aging [1].
Free radicals are unstable molecules that possess unpaired electrons, making them highly reactive toward biological structures such as DNA, proteins, and lipids. To counteract this, the body requires antioxidants compounds that neutralize free radicals by donating electrons, thereby preventing oxidative damage. As a result, antioxidants are widely utilized in topical formulations aimed at preventing premature skin aging [2].
Daucus carota L. (carrot) is abundant in bioactive compounds such as beta-carotene, flavonoids, phenolics, alkaloids, and vitamins A, B, and C, all of which exhibit antioxidant and antibacterial properties. While carrot extract has been investigated as a potential anti-aging agent and is reported to be safe for topical application without causing irritation, its antioxidant activity, as indicated by IC₅₀ values, is relatively weak (IC₅₀>300 µg/ml). This suggests that carrot extract alone may not offer robust radical scavenging effects [3, 4]. However, carrot was chosen for this study due to its potential non-antioxidant mechanisms, including the stimulation of collagen synthesis, enhancement of skin elasticity, and modulation of pigmentation. Additionally, when combined with moisturizing excipients such as glycerin and propylene glycol, synergistic effects on skin hydration and rejuvenation are anticipated [5, 6].
Cream formulations are widely favored for topical applications due to their light texture, ease of application, moisturizing properties, and good spreadability. Oil-in-water (O/W) creams are typically stabilized through the combination of stearic acid and triethanolamine, which react to form triethanolamine stearate, an emulsifier that ensures the stability of the formulation. Optimizing the formulation is essential to achieve effective and stable products by carefully selecting and combining ingredients. Traditional trial-and-error methods are often inefficient; thus, experimental design techniques, such as the Design of Experiments (DoE) using software like Design Expert, are increasingly preferred for their precision and efficiency in formulation development [7].
This study aims to optimize the concentrations of stearic acid and triethanolamine in a cream formulation containing Daucus carota L. extract, to develop a safe, stable, and effective anti-aging topical preparation by evaluating pH, adhesion, spreadability, and skin condition parameters such as moisture, pore size, spots, and wrinkles using a skin analyzer [8].
MATERIALS AND METHODS
Study preparation
The research was carried out at the Pharmaceutics Laboratory, Chemistry Laboratory of Sekolah Tinggi Ilmu Farmasi (STIFAR) Riau, and the Cosmetology Laboratory of North Sumatera University (USU), Indonesia.
Materials
The materials utilized in this research included carrot extract (Daucus carotaL.) with specimen number 250233198B obtained from PT. Lansida Group, Yogyakarta, stearic acid (Catalog number, Matangi®, Indonesia), triethanolamine (Otsu®, Indonesia), cetyl alcohol (Lux chemicals®, Indonesia), propylene glycol (Merck®, Indonesia), glycerin (Lux chemicals®, Indonesia), benzoic acid (CSPC®, China), sodium metabisulfite (Otsu®, Indonesia), and distilled water (aquadest), methanol, DPPH (2,2-diphenyl-1-picrylhydrazyl), vitamin C (ascorbic acid), concentrated hydrochloric acid (HCl), concentrated sulfuric acid (H₂SO₄), 2N HCl, 10% NaOH (sodium hydroxide)(Merck®, Indonesia), 1% FeCl₃ (ferric chloride), Mayer’s reagent (Lux chemicals®, Indonesia), Wagner’s reagent (Emsure®, Indonesia), Dragendorff’s reagent, acetic anhydride (Lux chemicals®, Indonesia), magnesium powder (Emsure®, Indonesia), chloroform, Liebermann-Burchard reagent (Emsure®, Indonesia).
Phytochemical screening of carrot (Daucus carota L.) extract
0.5 g of concentrated extract was dissolved in 5 ml of ethanol. Then, 5 ml each of distilled water and chloroform (1:1) are added. The mixture was shaken vigorously and left to settle until two layers form. The aqueous layer (top layer) was used for testing flavonoids, phenolics, and saponins. The chloroform layer (bottom layer) was used for testing terpenoids and steroids. The procedure for testing alkaloids was separate. Phytochemical screening includes testing for alkaloids, flavonoids, saponins, tannins, and terpenoids [9, 10].
Alkaloids
For alkaloid testing, a few grams of extract are added to 10 ml of chloroform, then another 10 ml of 0.05 M chloroform-ammonia solution is added, stirred and filtered, then 1 ml of 2 N sulfuric acid is added to a test tube, the test tube is shaken for 2 min, left to form two layers, and then separated. The acidic layer (top) is taken and 1-2 drops of Mayer's reagent are added; a positive result is indicated by the formation of a white precipitate [11].
Flavonoids
The Shinoda test was performed to qualitatively identify the presence of flavonoids in the sample. A small amount of extract was placed in a test tube, to which a few drops of distilled water and concentrated hydrochloric acid were carefully added. Subsequently, approximately 0.2 mg of metallic magnesium was introduced into the mixture, and the solution was gently mixed. The reaction was allowed to proceed at room temperature, and the appearance of an orange, pink, or red coloration within three minutes was considered a positive indication of flavonoid compounds [11, 12].
Saponin
A few drops of water are added to a test tube, then shaken vigorously until foam forms that persists for 5 min, indicating a positive result for saponin compounds [12].
Phenolic
A few drops of the water layer on the drop plate are added with 1-2 drops of 1% FeCl₃ solution. A positive result is indicated by the formation of a blue-green to black color [12].
Terpenoids and steroids
The chloroform layer is filtered through a dropper containing cotton and activated carbon at the tip. The filtrate is then pipetted 2-3 drops and allowed to dry on the drop plate. After drying, Liebermann-Burchard reagent (2 drops of anhydrous acetic acid and 1 drop of concentrated sulfuric acid) is added. If a red color forms, it indicates the presence of terpenoid compounds, and if a green or blue color forms, it indicates the presence of steroid compounds [13].
Antioxidant activity test
Preparation of DPPH reagent
10 mg of DPPH is dissolved in 10 ml of methanol solution, shaken until homogeneous, and stored in a dark bottle to obtain a solution with a concentration of 100 µg/ml. It is diluted to 40 µg/ml by pipetting 400 µg/ml and adding methanol to 10 ml in a measuring flask [14].
Preparation of sample solution
10 mg of extract and dissolve in 10 ml of methanol to obtain a stock solution with a concentration of 1000 µg/ml. The test was conducted in 6 concentration series: 1000; 500; 250; 125; 62.5; 31.25 µg/ml. The test was repeated 3 times [15].
Preparation of vitamin C standard solution
Vitamin C was weighed at 10 mg and dissolved in 10 ml of methanol to obtain a stock solution with a concentration of 1000 µg/ml. A dilution with a concentration of 100 µg/ml was then prepared by pipetting 1 ml of the stock solution into a 10 ml volumetric flask and adding methanol to the mark. The testing was conducted with six concentration series: 100, 50, 25, 12.5, 6.25, and 3.125 µg/ml. Each concentration test was repeated three times. The dilutions were performed on a 96-well microplate [16].
Antioxidant activity using the DPPH method
A total of 100 µl** of sample solution with a concentration of 1000 µg/ml was added to the wells in row A. A total of 50 µl** of methanol was pipetted into wells B-H. Then, 50 µl** of the extract solution in row A was pipetted using a micro multichannel pipette and added to row B, the solution in row B was pipetted 50 µl** and added to row C, and so on until row F. Next, 50 µl** of the solution in row F was pipetted and discarded, resulting in test solutions with concentrations of 1000 µg/ml (row A), 500 µg/ml (row B), 250 µg/ml (row C), 125 µg/ml (row D), 62.5 µg/ml (row E), and 31.25 µg/ml (row F). Rows A–G were added with 80 µg of DPPH solution at 40 µg/ml. Row H contained only methanol as a blank. The test solutions were incubated for 30 min at room temperature and in the dark by covering the 96-well microplate with aluminum foil. After 30 min, the absorbance of the test solutions was measured at a wavelength of 517 nm using a microplate reader. The antioxidant activity is determined using the DPPH method. The extract and Vitamin C (standard) are prepared in serial dilutions and incubated with DPPH solution in methanol. Absorbance is read at 517 nm using a microplate reader, and IC₅₀ values are calculated [16, 17].
Optimized design of carrot extract cream formulation
An optimization study was performed using a box–behnken statistical design with 2 independent factors and 17 experimental runs, generated through Design Expert version 13 software. The formulation variables were adapted from previous studies, involving the concentration of stearic acid and triethanolamine (TEA), which act as key components in emulsion and cream base formation. The dependent variables (responses) evaluated were pH, viscosity, spreadability, and adhesion of the carrot extract cream formulation [18, 19].
Response testing
Several stages in the evaluation test of cream preparations used as dependent or response variables are as follows.
pH test
pH measurement using a pH meter calibrated with pH buffer solutions of 4, 7, and 10. The electrode was rinsed with distilled water and dried with tissue paper. The measurement was performed by dipping the electrode into 1 g of cream preparation diluted with 10 ml of distilled water. Allow the needle to move to a constant position. The number displayed by the pH meter represents the pH value of the sample. The pH measurement results are expected to align with skin pH, which ranges from 4.5 to 6.5. pH measurements were replicated three times [20].
Adhesion test
The adhesion test was performed by placing 0.5 g of cream onto a microscope glass slide, which was then covered with another slide. A 1 kg load was applied on top of the slides for 3 min. Adhesion was measured as the time required for the two slides to separate. A preparation is considered to have acceptable adhesion if the separation time exceeds 4 sec. The test was repeated three times for consistency [21].
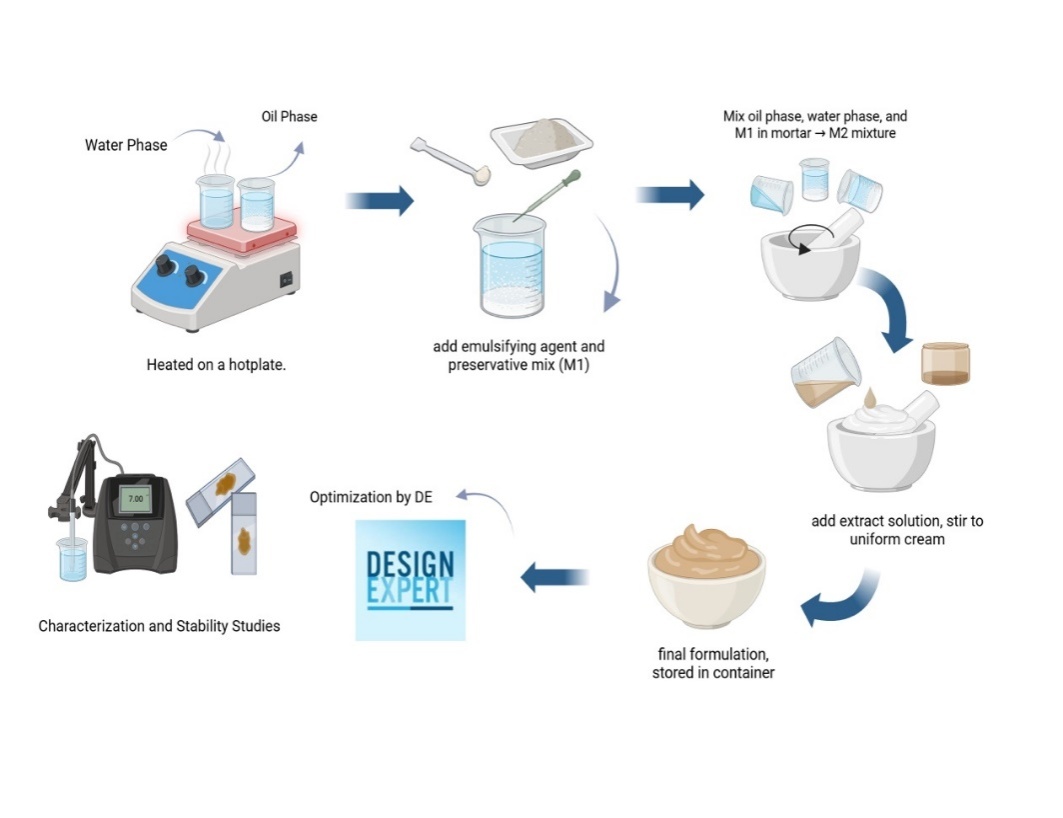
Fig. 1: Design study of carrot extract cream formulation
Spreadability test
Spreadability was assessed by placing 0.5 g of cream on a scaled glass plate, covering it with another glass plate of the same size, and applying a 150 g weight for 1–2 min. The spread diameter was measured after equilibrium, with an acceptable range of 5–7 cm. Each test was conducted in triplicate [21, 22].
Validation of the optimum model of carrot (Daucus carota L.) extract cream
The parameters for producing carrot extract cream were optimized using Design Expert software by setting selection criteria for the optimal concentrations of stearic acid and triethanolamine (TEA). The output responses evaluated were pH, adhesion, and spreadability. Desirability is a function value that indicates the software’s ability to meet the desired outcome based on the optimization criteria set for the final product. A desirability value close to 0.9/1.0 indicates a high probability of achieving the targeted product characteristics, while a value of 1.0 signifies that the optimization goal has been fully met [23].
Evaluation of optimum cream preparation
Several stages in the evaluation test of gel preparations are as follows:
Organoleptic test
The cream’s formulation color, odor, and consistency were observed weekly during four weeks of storage at room temperature.
Homogeneity test
The preparation was observed subjectively by applying 0.1 g of cream on a glass slide and observing the arrangement of particles formed or the inhomogeneity of dispersed particles in the cream visible on the glass slide. The homogeneity test can be replicated 3 times. The examination was carried out every week for 4 w of storage at room temperature [22, 24].
pH test
The pH was measured using a calibrated digital pH meter with buffer solutions of 4, 7, and 10. One g of cream was diluted in 10 ml of distilled water, and the electrode was immersed until a constant reading was obtained. The expected pH range was 4.5–6.5, in accordance with normal skin pH. Measurements were performed in triplicates [24, 25].
Viscosity test
Viscosity was determined using a Brookfield viscometer with spindle No. 4 at 30 rpm. The expected viscosity range was 2,000–50,000 cps. Measurements were conducted in triplicate during week 1 and week 4 of storage.
Adhesion test
The adhesion test was performed by placing 0.5 g of cream onto a microscope glass slide, which was then covered with another slide. A 1 kg load was applied on top of the slides for 3 min. Adhesion was measured as the time required for the two slides to separate. A preparation is considered to have acceptable adhesion if the separation time exceeds 4 sec. The test was repeated three times for consistency [26].
Spreadability test
Spreadability was assessed by placing 0.5 g of cream on a scaled glass plate, covering it with another glass plate of the same size, and applying a 150 g weight for 1–2 min. The spread diameter was measured after equilibrium, with an acceptable range of 5–7 cm. Each test was conducted in triplicate [27].
Skin irritation test
The skin irritation and anti-aging test was approved by the ethics committee under approval number 507/KEP-UNIVRAB/III/2025 from the College of Medicine, Abdurrab University, Indonesia. Volunteers who are to test the new cosmetic product will undergo a closed patch test, where the cream is applied to the inner upper arm, covered with gauze, and sealed with waterproof plaster. After 24 h of application, the skin will be examined for any signs of irritation, such as redness or spots [23, 28].
Freeze and thaw stability test
Freeze and Thaw is performed by weighing 5 g of cream preparation, placing it in a vial, and storing it in a refrigerator at 4 °C for 48 h, followed by storing the preparation at 45 °C for 48 h (1 cycle). The test is performed for 6 cycles. In each cycle, the presence or absence of phase separation is observed [28].
Cream type test
Cream type test was conducted by placing a small amount of cream on a glass slide and adding one drop of methylene blue. If the methylene blue disperses evenly, the cream is of type O/W; if blue particles form on the glass slide, the cream is of type W/O. The examination was conducted weekly over a 4-week storage period at room temperature [29].
Anti-aging effectiveness testing
The skin irritation and anti-aging test was approved by the ethics committee under approval number 507/KEP-UNIVRAB/III/2025 from the College of Medicine, Abdurrab University, Indonesia. The effectiveness of the anti-aging treatment was evaluated through a trial involving four volunteers. Prior to participation, the volunteers provided informed consent by completing a consent form. Inclusion criteria for the volunteers were the absence of other topical treatments, normal skin type, engagement in similar daily activities, and an age range of 25-30 years. The initial skin condition was assessed on the back of the palm of each volunteer, measuring parameters such as moisture content, pore size, spot count, and wrinkle depth using a Skin Analyzer. Following baseline measurements, the cream was applied evenly to both the right and left hands, twice daily (morning and evening) for a duration of 4 w. Skin condition changes were documented at week 0 (baseline), week 1, week 2, week 3, and week 4 using the Skin Analyzer [30].
Data analysis
The experimental data were analyzed using Design Expert version 13 software with Response Surface Methodology (RSM) to determine the optimum formulation based on pH, spreadability, and adhesion responses. Results were presented in tables and graphs to evaluate the effects of stearic acid and triethanolamine (TEA) concentrations on the properties of carrot extract cream (Daucus carota L.). The optimized formulation was subsequently compared with the base cream for anti-aging activity and evaluated statistically using analysis of variance (ANOVA) [31].
RESULTS AND DISCUSSION
Phytochemical screening of carrot extract
The results of the phytochemical screening are presented in table 1. The screening of carrot extract revealed the presence of alkaloids, flavonoids, phenolics, and terpenoids, while steroids and saponins.
Antioxidant activity test of carrot extract
The table presents the IC₅₀ values for both Vitamin C and carrot extract (table 2), illustrating a significant difference in their antioxidant activities. Vitamin C demonstrates very strong antioxidant activity, with an IC₅₀ value of 5.29 µg/ml, indicating its high potency in scavenging free radicals. This low IC₅₀ value suggests that Vitamin C is highly effective at lower concentrations in neutralizing oxidative stress. On the other hand, carrot extract exhibited relatively weak antioxidant activity, with an IC₅₀ value of 356.72 µg/ml. This higher IC₅₀ value indicates that carrot extract requires a much higher concentration to achieve similar radical scavenging effects compared to Vitamin C. While carrot extract still possesses antioxidant properties, its efficacy in this regard is considerably lower, suggesting that it may offer additional benefits through other mechanisms, such as promoting collagen synthesis and enhancing skin elasticity [32, 33].
Although antioxidant activity is often closely associated with anti-aging effects, the weak IC₅₀ values of carrot extract highlight that its primary anti-aging effects may not be solely due to antioxidant activity. Carrot extract contains carotenoids, particularly beta-carotene, which have been shown to have pro-collagen effects and may help promote collagen synthesis. Collagen is a critical protein responsible for maintaining skin structure and elasticity, and its synthesis tends to decrease with age, contributing to signs of aging such as wrinkles and sagging. Carotenoids in carrot extract may help counteract this process by stimulating collagen production, thereby potentially improving skin firmness and reducing the appearance of fine lines [33, 34].
Moreover, the synergy between carrot extract's moisturizing properties and its other bioactive compounds may further enhance its anti-aging effects. When combined with hydrating excipients such as glycerin and propylene glycol, carrot extract can improve skin hydration, a crucial factor in maintaining youthful skin. Proper hydration helps maintain the skin’s barrier function, reduces the appearance of wrinkles, and enhances the overall texture and smoothness of the skin. Thus, while the antioxidant activity of carrot extract may not be as potent as that of Vitamin C, its ability to support collagen synthesis and improve skin hydration could contribute significantly to its anti-aging effects. Further research focusing on these non-antioxidant mechanisms, particularly in combination with moisturizing agents, is necessary to fully understand the potential of carrot extract in topical anti-aging formulations [35].
Table 1: Phytochemical screening of ethanol extract of carrot (Daucus carota L
| S. No. | Secondary metabolite compounds | Reagents | Result |
| 1. | Alkaloids | Dragendorff | + |
| 2. | Flavonoids | Mg powder+HCl (p) | + |
| 3. | Tannins | FeCl3 | + |
| 4. | Saponins | Aquadest+HCl 1% | - |
5. 6. |
Steroids triterpenoids |
Libermann-Burchard Libermann-Burchard |
- + |
Notes: (+): Positive, (-): Negative
Table 2: The IC₅₀ values for both vitamin C and carrot extract
| Sample | IC₅₀ value (+SD) |
| Vitamin C | 5.29 µg/ml+0.12 |
| Carrot Extract | 356.72 µg/ml+0.32 |
Note: the results were presented as mean ±SD (n=3)
Optimization of carrot extract cream formulation
Formula optimization was performed by entering the variable data to be optimized into Design Expert software version 13. The variables in this study were the concentrations of stearic acid (10-20%) and TEA (0.5-1%). The data for each variable is entered into Design Expert software version 13, which generates 17 formulas with varying variable concentrations. These formulas are then evaluated for their response, namely pH, adhesion, and spreadability. The formula predictions by Design Expert 13 software are shown in table 3.
Response testing
The verification stage aims to validate the predicted response values from the optimization results generated by the Design Expert program. The actual response values obtained from the verification process are compared to the predicted responses generated by the Design Expert software [23]. The verification results of the optimum cream formula containing carrot extract (Daucus carota L.) showed a % error of 8.30% for pH, 4.27% for adhesion, and 6.97% for spreadability. These results indicate that there is no significant difference, as the error values are all less than 10%.
Table 3: Experimental design and response results using box-behnken method
| Run | Factor 1 A: Stearid acid |
Factor 2 B: TEA |
Response 1 pH 1.1.1 |
Response 2 adhesion test |
Response 3 spreadability test |
| 1 | 20 | 1 | 5.85 | 10.33 | 4.2 |
| 2 | 15 | 1 | 5.02 | 8.44 | 5.1 |
| 3 | 20 | 0.75 | 5.18 | 10.25 | 4.3 |
| 4 | 15 | 0.50 | 4.53 | 8.22 | 5.2 |
| 5 | 20 | 0.75 | 5.18 | 10.25 | 4.3 |
| 6 | 15 | 0.50 | 4.53 | 8.22 | 5.2 |
| 7 | 10 | 0,75 | 5.03 | 7.55 | 5.3 |
| 8 | 15 | 0.75 | 5.71 | 8.32 | 5.5 |
| 9 | 15 | 0.75 | 5.71 | 8.32 | 5.5 |
| 10 | 10 | 0.50 | 4.83 | 7.33 | 5.4 |
| 11 | 15 | 1 | 5.02 | 8.44 | 5.1 |
| 12 | 10 | 1 | 5.43 | 7.58 | 5.7 |
| 13 | 15 | 0.75 | 5.71 | 8.32 | 5.5 |
| 14 | 20 | 0.50 | 5.03 | 10.17 | 4.3 |
| 15 | 10 | 0.75 | 5.03 | 7.55 | 5.3 |
| 16 | 15 | 0.75 | 5.71 | 8.32 | 5.5 |
| 17 | 15 | 0.75 | 5.71 | 8.32 | 5.5 |
Note: Experimental runs (n=17) were generated by box-behnken design using Design Expert version 13.
Table 4: Optimum formula verification results
| Preparation evaluation | Prediction design expert 13 | Mean ±SD observation | % error |
| pH | 5.08 | 5.53±0.25 | 8.30% |
| Adhesion Test | 7.44 | 7.13±0.12 | 4.27% |
| Spreadability test | 5.42 | 5.06±0.11 | 6.97% |
Note: the results were presented as mean ±SD (n=3)
Contour plot analysis showed that increasing stearic acid tends to decrease pH and spreadability, whereas triethanolamine increases pH and stabilizes the formulation. In the pH contour plot, a color gradient from blue to red represents increasing pH as the concentrations of stearic acid and triethanolamine change. Blue areas indicate lower pH values, while red areas indicate higher pH values. The predicted optimal pH value was 5.451, marked on the graph, demonstrating the effect of the synergistic interaction between both components.
In the spreadability contour plot, the gradient from blue to red indicates that spreadability improves as the concentration of stearic acid decreases. The predicted spreadability value of 6.747 cm is found in the light blue region, suggesting that lower concentrations of stearic acid contribute to better spreadability. Conversely, the adhesion strength contour plot displays a blue-to-red gradient, signifying an increase in adhesion strength as the concentration of stearic acid rises. The predicted adhesion strength value of 1.746 sec is located within the green-colored area, indicating that higher concentrations of stearic acid lead to stronger adhesion. These contour plots provide valuable insights into the relationship between stearic acid concentration and the key properties of spreadability and adhesion strength in the cream formulation [7, 28].
The interaction between factors, namely the concentrations of stearic acid and triethanolamine on pH and spreadability, can be analyzed using Design Expert software version 13. The interaction plot indicates that increasing the concentration of stearic acid tends to reduce the pH, both at low (black line) and high (red line) concentrations of triethanolamine. From these findings, it is evident that stearic acid contributes to pH reduction, while triethanolamine plays a role in increasing the pH of the formulation [36, 37].
The interaction between the two components significantly influences pH stability. An increase in stearic acid without being balanced by triethanolamine causes a notable decrease in pH. Conversely, at higher concentrations of triethanolamine, the pH-lowering effect of stearic acid can be mitigated, resulting in a more stable pH formulation within the acceptable range for topical use [38, 39].
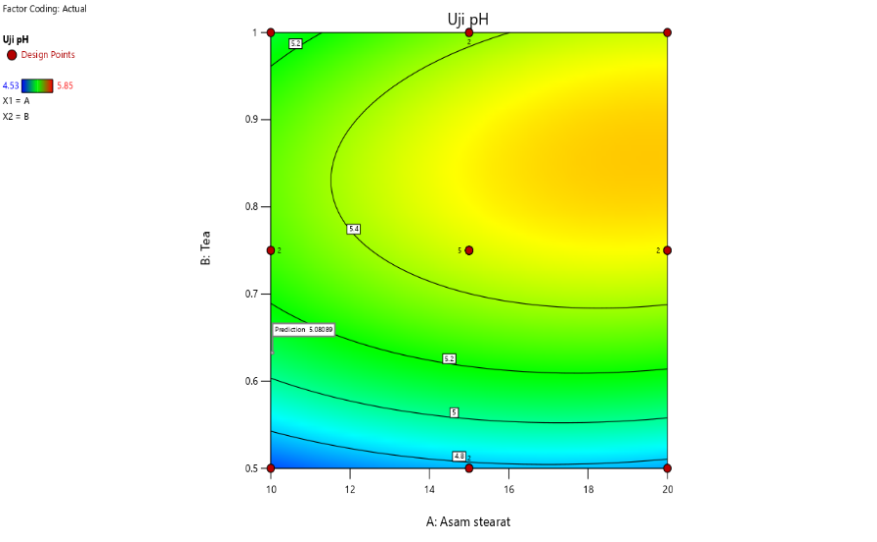
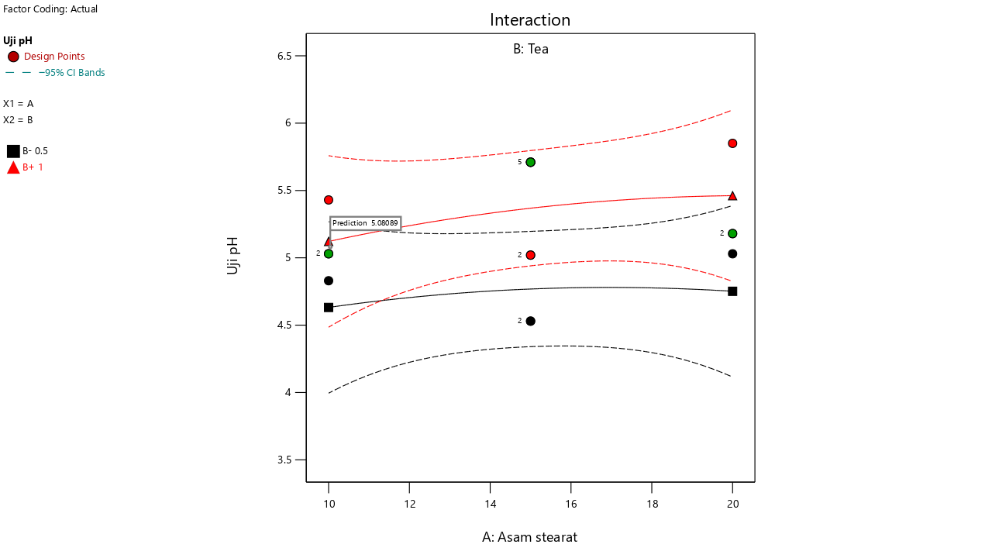
Fig. 2: Contour plot result and interaction curve of stearic acid and TEA against pH
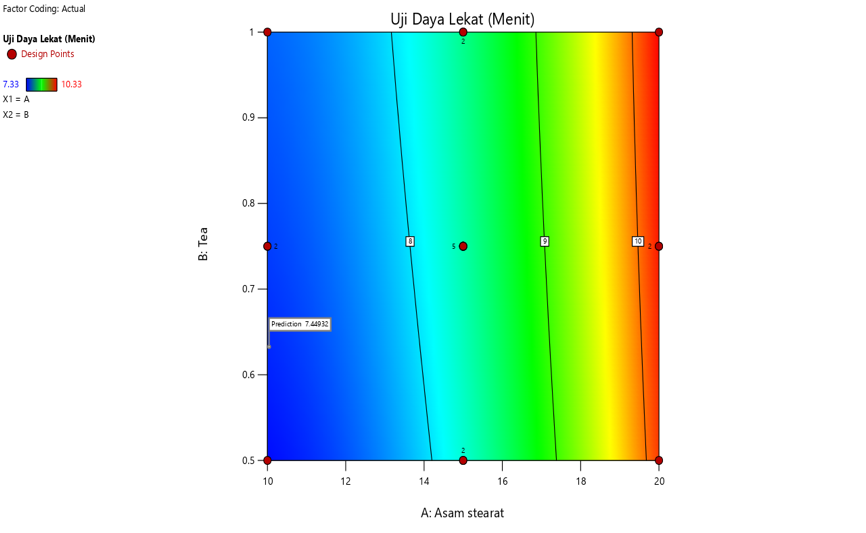
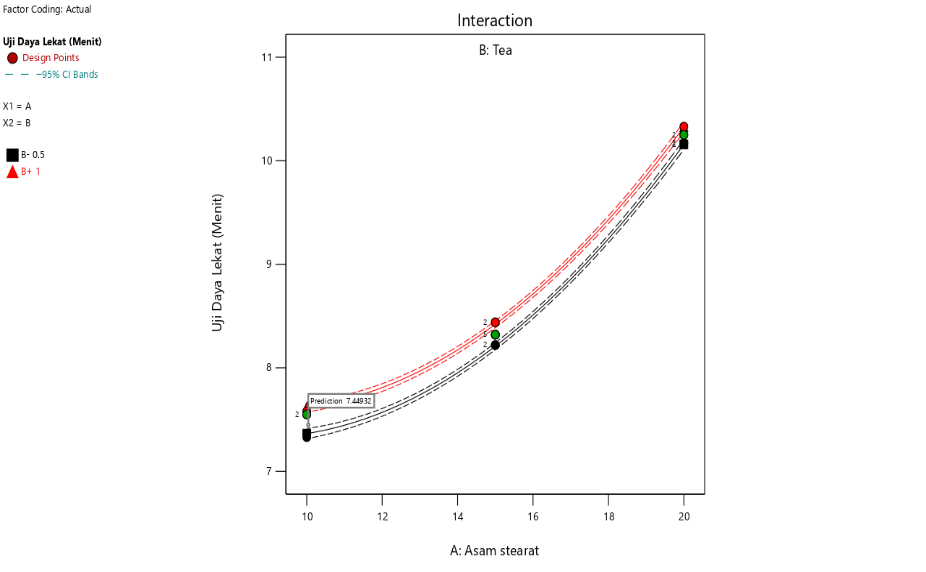
Fig. 3: Contour plot results and interaction curve of stearic acid and TEA on adhesion
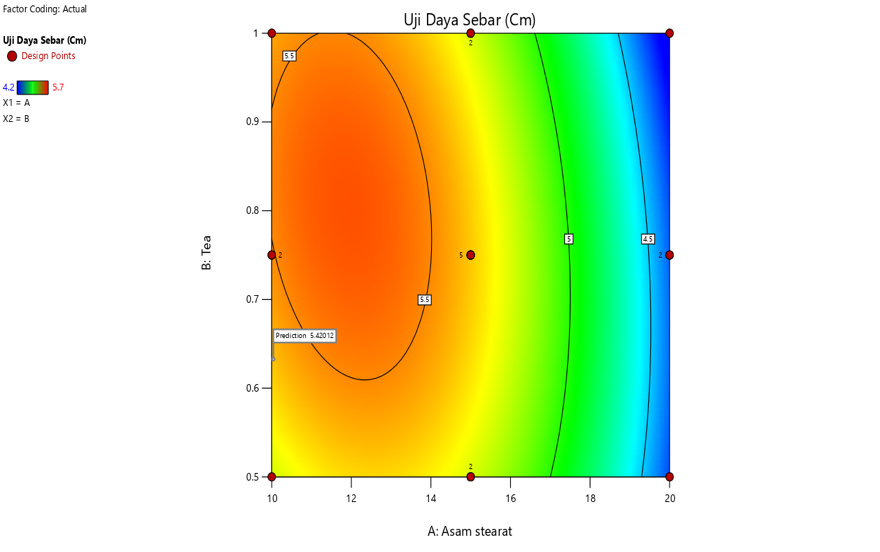
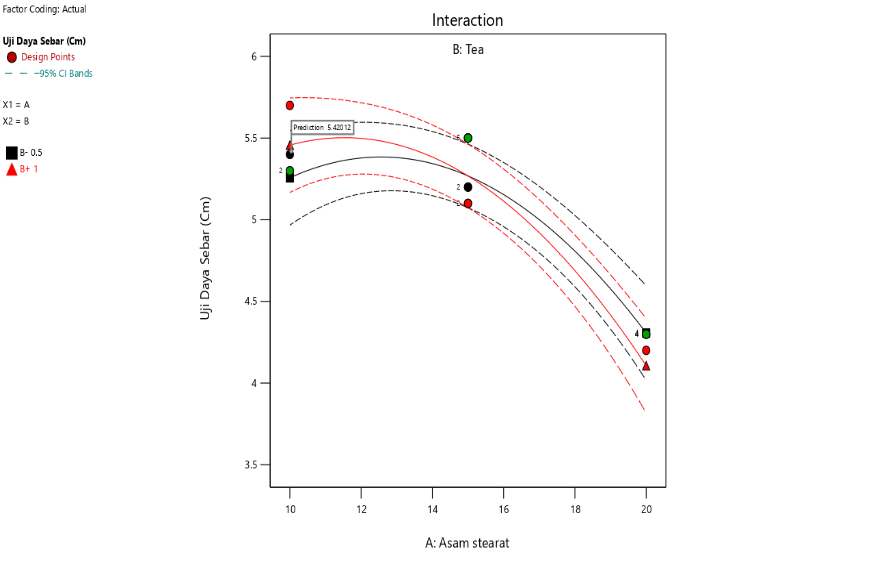
Fig. 4: Contour plot results and interaction curve of steraic acid and TEA on spreadability
The interaction also shows that increasing stearic acid concentration tends to reduce spreadability, both at low and high concentrations of triethanolamine. This is in line with the properties of stearic acid as an emulsifying and thickening agent, which increases the viscosity of the formulation and limits its spread across the skin surface. In addition, the interaction between stearic acid and TEA demonstrates that an increase in stearic acid concentration also tends to increase the adhesion strength, regardless of whether triethanolamine is present in low or high concentrations [40, 41].
Evaluation of optimum cream preparation
Organoleptic test
The results of organoleptic testing on the shape, color, and odor of the optimal formulation are shown in (table 5). Based on observations conducted over 4 w, it was found that the cream formulation did not undergo changes and remained stable during 4 w of storage.
Table 5: Organoleptic evaluation of optimum cream formula
| Formula | Test | Week | |||
| 1 | 2 | 3 | 4 | ||
| Optimum cream formula | Texture | Semi-solid | Semi-solid | Semi-solid | Semi-solid |
| Color | Browns | Browns | Browns | Browns | |
| Odor | with a distinctive carrot extract smell. | with a distinctive carrot extract smell. | with a distinctive carrot extract smell. | with a distinctive carrot extract smell. | |
Note: Organoleptic properties remained stable during 4 w of storage at room temperature.
Table 6: Homogeneity evaluation of optimum cream formula
| Formulation | Homogeneity observation | |||
| Week 1 | Week 2 | Week 3 | Week 4 | |
| Optimum cream formula | + | + | + | + |
| + | + | + | + | |
| + | + | + | + | |
Note: “+” indicates homogeneous preparation without clumped particles or coarse granules
Homogeneity test
The homogeneity test of the cream preparation showed that no particles were found in the optimal cream formula of carrot extract (table 6). A homogeneous preparation is characterized by the absence of clumped particles or coarse granules in the preparation.
Cream type test
The cream type test of the optimum carrot extract cream formula during 4 w of storage showed that all cream formulations were of the oil-in-water (O/W) type.
pH test
The desired pH level in the serum formulation falls within the skin's natural pH range of 4.5–6.5 [25]. The pH should not be too acidic, as it may cause skin irritation, nor should it be too alkaline, as it can lead to dry, sensitive skin that is prone to infection. The pH was measured weekly over a 4-week storage period using a pH meter [42].
The pH values of the cream remained within the acceptable range for skin (4.5–6.5), although a slight decrease in pH was observed over the course of 4 w of storage. This minor change suggests that the formulation maintained its skin compatibility, despite the slight variation in pH over time [43].
Adhesion test
The evaluation of the adhesion strength of the carrot extract cream during 4 w of storage at room temperature showed.
The cream adhesion test was conducted to determine the ability of the cream to adhere to the site of application. The adhesion of the formulation is related to the duration of contact between the preparation and the skin, as well as the comfort of use. A stable formulation ensures effective contact time with the skin to achieve the intended therapeutic effect. The adhesion test results showed a decrease from week 2 to week 4.
Table 7: Cream type test of optimum cream formula
| Formula | Cream type test | |||
| Week 1 | Week 2 | Week 3 | Week 4 | |
| Optimum cream formula | O/W | O/W | O/W | O/W |
| O/W | O/W | O/W | O/W | |
| O/W | O/W | O/W | O/W | |
Note: The optimum cream was consistently classified as an oil-in-water (O/W) type.
Table 8: pH test evaluation of optimum cream formula
| Optimum cream formula | pH value | ||||
| Week 1 | Week 2 | Week 3 | Week 4 | ||
| 5.53 | 5.18 | 5.10 | 5.04 | ||
| 5.52 | 5.33 | 5.15 | 5.09 | ||
| 5.57 | 5.38 | 5.15 | 5.14 | ||
| Mean (+SD) | 5.54+0.02 | 5.29+0.01 | 5.13+0.02 | 5.09+0.05 | |
Note: the results were presented as mean ±SD (n=3)
Table 9: Adhesion test results of optimum cream formula
| Optimum cream formula | Adhesion test (Second) | |||
| Week 1 | Week 2 | Week 3 | Week 4 | |
| 7.11 | 7.08 | 7.07 | 7.06 | |
| 7.17 | 7.15 | 7.17 | 7.05 | |
| 7.29 | 7.25 | 7.22 | 7.22 | |
| mean (+SD) | 7.19+0.09 | 7.16+0.08 | 7.15+0.07 | 7.11+0.05 |
Note: the results were presented as mean ±SD (n=3)
Table 10: Spreadability test results of optimum cream formula
| Optimum cream formula | Spreadability test (cm) | |||
| Week 1 | Week 2 | Week 3 | Week 4 | |
| 5.7 | 5.1 | 5.4 | 7.1 | |
| 5.5 | 5.3 | 5.3 | 6.2 | |
| 5.3 | 5.4 | 5.3 | 5.6 | |
| mean (+SD) | 5.5+0.20 | 5.2+0.15 | 5.3+0.05 | 6.3+0.75 |
Note: the results were presented as mean ±SD (n=3)
The spreadability test was conducted to determine the ability of the formulation to spread on the skin surface when applied. Good spreadability facilitates ease of application on the skin surface. In addition, better spreadability allows the active ingredient to be distributed more evenly across the skin, thereby enhancing the effectiveness of the active substance.
Viscosity test
The viscosity test seeks to ascertain the cream formulation's thickness. A cream that is just the right thickness is considered nice. A Brookfield spindle 4 viscometer was used to perform the viscosity test at 30 rpm.
The viscosity test of the carrot extract cream was conducted to determine the resistance generated by the cream. An ideal viscosity value ranges from 2,000 to 50,000 cPs. In this study, the viscosity of the sample was measured using a Brookfield viscometer with spindle number 4 at a speed of 30 rpm. A decrease in viscosity values from the first to the fourth measurement may indicate thixotropic behavior, which is a reduction in viscosity due to continuous shear stress [30]. In addition, this variation may also be caused by differences in ambient temperature during measurement, as viscosity is highly influenced by temperature [44].
Skin irritation test
Skin irritation testing of carrot extract serum was conducted on three panelists for the optimal formula using the closed patch test method. Positive irritation reactions were indicated by redness, itching, or swelling on the inner arm skin that was treated. After observing both formulas, no allergic reactions were observed in the panelists, as there were no signs of redness, itching, or a burning sensation on the panelists, indicating that the formulation used is safe.
Stability test using the freeze and thaw method
The freeze and thaw stability test aims to determine whether phase separation occurs in the cream formulation under extreme temperature conditions. After each cycle, observations were made to assess whether any phase separation occurred, along with evaluations of organoleptic properties and pH. The organoleptic examination showed that from cycle 1 to cycle 6, the formulation remained stable with no phase separation. The physical appearance, form, odor, and color remained unchanged, and the formulation maintained a homogeneous composition [23].
Table 11: Viscosity test of optimum cream formula
| Optimum cream formula | Viscosity test (cPs) | |||
| Week 1 | Week 2 | Week 3 | Week 4 | |
| 16.800 | 10.200 | 10.980 | 9.140 | |
| 14.980 | 12.120 | 10.120 | 9.280 | |
| 12.880 | 10.440 | 11.420 | 10.200 | |
| Mean (+SD) | 14.887+1.96 | 10.920+1.04 | 10.840+0.66 | 9.54+0.57 |
Note: the results were presented as mean ±SD (n=3)
Table 12: Skin irritation test
| Formula | Volunteers | ||
| 1 | 2 | 3 | |
| Base | - | - | - |
| Formula Cream Optimum | - | - | - |
No irritation reactions (redness, itching, or swelling) were observed in any volunteer.
Table 13: Freeze–thaw stability test of optimum cream formula
| Formula | Test | Cycles | ||||
| 1 | 2 | 3 | 4 | 5 | ||
| Optimum cream formula | Texture | Semi-solid | Semi-solid | Semi-solid | Semi-solid | Semi-solid |
| Color | Browns | Browns | Browns | Browns | Browns | |
| Odor | with a distinctive carrot extract smell | with a distinctive carrot extract smell | with a distinctive carrot extract smell | with a distinctive carrot extract smell | with a distinctive carrot extract smell | |
No phase separation or organoleptic changes observed during 6 freeze–thaw cycles.
Table 14: pH stability test of optimum cream formula
| Optimum cream formula | pH value | ||||
| Cycle 1 | Cycle 2 | Cycle 3 | Cycle 4 | Cycle 5 | |
| 5.32 | 5.08 | 4.99 | 5,10 | 5.13 | |
| 5.37 | 5.08 | 5,10 | 5.08 | 5.17 | |
| 5.41 | 5.10 | 5.04 | 5.03 | 5.18 | |
| mean (+SD) | 5.37+0.04 | 5.08+0.01 | 5.01+0.03 | 5.05+0.3 | 5.16+0.26 |
Note: the results were presented as mean ±SD (n=3), Note: pH fluctuations were observed, but values remained within the acceptable skin range (4.5–6.5).
The pH measurement of the carrot extract cream during the Freeze and Thaw test over 6 cycles showed fluctuations, with an increase and a decrease observed in cycle 3. This may have occurred due to the influence of temperature. However, the results still met the pH standard range of 4.5–6.5 [45].
Anti-aging effectiveness testing
The anti-aging activity test of the carrot extract cream showed that all formulations demonstrated improvements in moisture content, pore size, spots, and wrinkles. The results indicated that the optimum formula had higher anti-aging activity compared to the base formulation, as the base did not contain any active ingredients [46].
Based on the measurement results, both the cream base and the optimum formula were able to increase skin moisture from the initial condition. The moisture content of the base cream in the first week was 25.92%, and the base was 27.02%. After using the cream for 30 d, the results in the fourth week showed that the cream base reached 76.74%, while the Optimum Cream Formulareached 60.86%. The optimum formula demonstrated a better ability to maintain skin hydration. Skin moisture is influenced by external factors such as temperature, environmental humidity, and lifestyle. Therefore, a cream with an active formulation is necessary to maintain skin hydration sustainably [28, 47].
Table 15: Moisture measurement results
| Formula | Volunteers | Moisture | Increase in moisture (%) | ||||
| Initial conditions | Length of use | ||||||
| 1 | 2 | 3 | 4 | ||||
| Cream Base | 1 | 12 | 15 | 17 | 23 | 28 | 57.17 |
| 2 | 15 | 22 | 31 | 39 | 41 | 63.41 | |
| Mean+SD | 13.5+2.12 | 18.5+4.94 | 24+9.89 | 31+11.31 | 34.5+9.19 | 60.86 | |
| Optimum Cream Formula | 1 | 12 | 15 | 19 | 22 | 40 | 70 |
| 2 | 8 | 12 | 15 | 23 | 46 | 83 | |
| Mean+SD | 10+2.82 | 13.5+2.12 | 17+2.82 | 25.5+0.7 | 43+4.24 | 76.74 | |
Note: the results were presented as mean±SD (n=3)
Table 16: Percentage increase in moisture each week
| Formula | Week 0 (%) | Week 1 (%) | Week 2 (%) | Week 3 (%) | Week 4 (%) |
| Cream Base | 0 | 27.02 | 43.75 | 56.45 | 60.86 |
| Optimum Cream Formula | 0 | 25.92 | 41.17 | 55.55 | 76.74 |
For the moisture parameter, the ANOVA results showed a significance value of 0.550. This indicates that the increase in skin moisture in users of the optimum formula was not significantly different from that of the cream base. Although the descriptive results showed a higher average moisture level in the optimum formula, the difference was not large enough to be statistically significant. The hydrating effect is usually associated with the presence of humectants and emollients in the formulation; however, to demonstrate a significant difference, a longer duration of use or a higher concentration of active ingredients may be required [28].
The results of the pore (Pore) parameter measurements showed that both the cream base and the optimum formula were able to gradually reduce facial pore size over a 4 w period. The average pore size in the optimum cream formula group decreased from 16 to 6.5, with a recovery percentage of 59.37%, while the cream base showed a reduction from 19 to 7, with a higher recovery percentage of 63.15%. This reduction in pore size indicates an improvement in skin structure, such as increased elasticity and cleaner pores free from accumulated dirt and sebum. Enlarged pores are generally caused by sun exposure, excessive oil production, and decreased collagen levels, which lead to the widening of pore walls [48].
Table 17: Pore measurement results
| Formula | Volunteers | Pore | Increase in pore (%) | ||||
| Initial conditions | Length of use | ||||||
| 1 | 2 | 3 | 4 | ||||
| Cream Base | 1 | 8 | 7 | 6 | 4 | 4 | 50 |
| 2 | 24 | 21 | 18 | 17 | 9 | 62.5 | |
| Mean+SD | 16+2.82 | 14+2.82 | 12+2.82 | 10.5+2.82 | 6.5+2.82 | 59.37 | |
| Optimum Cream Formula | 1 | 13 | 9 | 9 | 8 | 5 | 61.53 |
| 2 | 25 | 21 | 17 | 13 | 9 | 64 | |
| Mean+SD | 19+2.82 | 15+2.82 | 13+2.82 | 10.5+2.82 | 7+2.82 | 63.15 | |
Note: the results were presented as mean ±SD (n=3)
Table 18: Percentage pore size reduction every week
| Formula | Week 0 (%) | Week 1 (%) | Week 2 (%) | Week 3 (%) | Week 4 (%) |
| Cream Base | 0 | 12.5 | 25 | 34.37 | 59.37 |
| Optimum Cream Formula | 0 | 21.05 | 31.57 | 44.72 | 63.15 |
For the pore parameter, the significance value of 0.726 indicates that there was no statistically significant difference between the two formulas. However, based on descriptive observations, the optimal formula appeared to result in better improvement in the appearance of facial pores. Pore minimization typically involves mechanisms such as regulating sebum production, enhancing skin elasticity, and facilitating the removal of dead skin cells that can clog pores. Despite the general trend observed, the response to the formula can vary significantly among individuals due to factors such as skin type, lifestyle, and environmental exposure. As a result, the differences between the groups were not statistically strong enough to draw definitive conclusions, highlighting the need for further studies with larger sample sizes to better understand the effects of the formulation on pore appearance [18, 27].
The spot (Spot) measurement results showed that both the cream base and the optimum formula were able to gradually reduce the number of facial spots over a 4-week period. The average number of spots in the optimum cream formula group decreased from 22 to 8.5, with a recovery percentage of 61.36%, while the cream base decreased from 22.5 to 8.5, with a slightly higher recovery percentage of 62.22%. This indicates that the optimum formula works in a stable and progressive manner in reducing facial spots. The effectiveness of this formula is likely due to the presence of active ingredients that help inhibit melanin production, accelerate cell regeneration, and enhance skin metabolism. The reduction in facial spots may also be influenced by UV protection and antioxidant activity, which reduce inflammation and hyperpigmentation. The use of the optimum formula shows potential as an effective skin brightening agent, although the results are gradual and require continuous use for optimal outcomes [20, 35].
The facial spot parameter also showed similar results, with a significance value of 0.868. This means that although the optimum formula showed a slightly higher spot recovery percentage, the result was not statistically significant compared to the cream base. The reduction of facial spots is closely related to the activity of active ingredients in inhibiting melanin production, enhancing cell regeneration, and protecting the skin from UV exposure.
The wrinkle measurement results showed that both the cream base and the optimum formula were able to gradually reduce the number of facial wrinkles over a 4 w period. The average number of wrinkles in the optimum cream formula group decreased from 25 to 11, with a recovery percentage of 56%, while the cream base decreased from 16.5 to 6, with a higher recovery percentage of 63.63%. This effectiveness is most likely due to the presence of active ingredients such as antioxidants, peptides, or retinoids, which can stimulate collagen synthesis, improve skin elasticity, and accelerate skin cell regeneration [49].
Table 19: Spot measurement results
| Formula | Volunteers | Spot | Increase in spot (%) | ||||
| Initial conditions | Length of use | ||||||
| 1 | 2 | 3 | 4 | ||||
| Cream base | 1 | 14 | 11 | 10 | 6 | 3 | 78,57 |
| 2 | 30 | 20 | 19 | 18 | 14 | 53.33 | |
| Mean+SD | 22+11.31 | 15.5+6.36 | 14.5+6.37 | 12+8.48 | 8.5+7.77 | 61.36 | |
| Optimum cream formula | 1 | 30 | 27 | 24 | 22 | 15 | 62,5 |
| 2 | 23 | 16 | 14 | 13 | 11 | 50 | |
| Mean+SD | 26.5+4.94 | 21.5+7.78 | 19+7.07 | 17.5+6.36 | 13+2.82 | 62.22 | |
Note: the results were presented as mean ±SD (n=3)
Table 20: Weekly spot decrease percentage
| Formula | Week 0 (%) | Week 1 (%) | Week 2 (%) | Week 3 (%) | Week 4 (%) |
| Cream Base | 0 | 29.54 | 34.09 | 45.45 | 61.36 |
| Optimum Cream Formula | 0 | 20.00 | 37.77 | 46.66 | 62.22 |
Table 21: Wrinkle measurement results
| Formula | Volunteers | Wrinkle | Increase in wrinkle (%) | ||||
| Initial conditions | Length of use | ||||||
| 1 | 2 | 3 | 4 | ||||
| Cream base | 1 | 29 | 25 | 21 | 19 | 12 | 58.62 |
| 2 | 21 | 18 | 16 | 14 | 10 | 52.38 | |
| Mean+SD | 25+5.65 | 21.5+4.94 | 18.5+3.53 | 16.5+3.54 | 11+1.41 | 56.00 | |
| Optimum cream formula | 1 | 21 | 20 | 17 | 8 | 7 | 66.66 |
| 2 | 12 | 9 | 8 | 7 | 5 | 58.33 | |
| Mean+SD | 16.5+6.36 | 14.5+7.77 | 12.5+6.36 | 7.5+0.70 | 6+1.41 | 63.63 | |
Note: the results were presented as mean ±SD (n=3)
Table 22: Weekly wrinkle decrease percentage
| Formula | Week 0 (%) | Week 1 (%) | Week 2 (%) | Week 3 (%) | Week 4 (%) |
| Cream Base | 0 | 14 | 26 | 34 | 56 |
| Optimum Cream Formula | 0 | 12.12 | 24.24 | 54.54 | 63.63 |
There was no statistically significant difference between the cream base and the optimum cream formula according to the wrinkle parameter's significance value of 0.868. Descriptive analysis, however, showed that the ideal formula showed a greater average decrease in wrinkles. Because this process includes collagen stimulation, dermal structure restoration, and protection against free radical-induced protein degradation, it is crucial to highlight that improvements in facial wrinkles usually take longer to produce noticeable results. As a result, prolonged usage of the improved formulation may intensify the observed trend in wrinkle reduction [24, 32, 49].
CONCLUSION
Based on Box–Behnken design optimization using Design Expert software, the optimum carrot (Daucus carota L.) extract cream contained 10.043% stearic acid and 0.633% triethanolamine (TEA). The formulation exhibited an average pH of 5.53±0.25, adhesion time of 7.13±0.12 s, and spread ability of 5.06±0.11 cm, meeting standard criteria for topical creams. While improvements in skin parameters were observed, statistical analysis showed no significant differences compared to the cream base (p>0.7), suggesting limited contribution from the carrot extract. Antioxidant activity was weak (IC₅₀ = 356.72 μg/ml). Overall, the cream demonstrated good stability and acceptable topical properties, though further clinical studies are required to confirm any anti-aging effects.
FUNDING
Nil
AUTHORS CONTRIBUTIONS
B. I. was responsible for the conceptualization, methodology, and supervision of the study. H. N. S. contributed to data curation, investigation, and the writing of the original draft. N. handled formal analysis, validation, and the writing of the review and editing. C. P. W. provided resources, visualizations, and critical revision of the manuscript.
CONFLICT OF INTERESTS
The author declare that there are no conflicts of interest regarding the publication of this article.
REFERENCES
Liu H, Shang B, Yao Y, Yang S, Fan X, Lin X. Time from waking to first cigarette accelerated biological aging and risk of premature mortality. Drug Alcohol Depend. 2025;275:112825. doi: 10.1016/j.drugalcdep.2025.112825, PMID 40812161.
Elwan AH, El Masry SM, Habib DA, Zewail M. Ascorbyl palmitate/hyaluronan-modified poloxamer 407 nanoparticles for the topical delivery of fisetin to counteract UVB-induced skin photoaging: a novel anti-aging formulation. Int J Pharm. 2025;682:125988. doi: 10.1016/j.ijpharm.2025.125988, PMID 40701358.
Sarkar N, Venkategowda Kodihally AK, Shamnewadi A. Exploring the anticonvulsant potential of Daucus carota L.: a combined in silico and in vivo study for epilepsy therapy development. Pharmacological Research Modern Chinese Medicine. 2025;15:100610. doi: 10.1016/j.prmcm.2025.100610.
Khan AU, Shahzad M, Mushtaq A, Naseer MM. Green and sustainable synthesis of chiral alcohols: the role of Daucus carota as a biocatalyst in organic chemistry. RSC Adv. 2025;15(15):11863-80. doi: 10.1039/D5RA00901D, PMID 40236574.
Iskandar B, Ginting PA, Sitorus ES, Widodo AF, Wei CP, Leny. Hair tonic of broccoli (Brassica oleracea Var. Italica) extract: formulation physical characteristic, stability and hair growth activity test. Int J Appl Pharm. 2024;16(3):1-8. doi: 10.22159/ijap.2024.v16s3.01.
Reddy BH, Hussain SM, Hussain MS, Kumar RN, Gupta J. Essential oils in cosmetics: antioxidant properties and advancements through nanoformulations. Pharmacol Res Nat Prod. 2025;6:100192. doi: 10.1016/j.prenap.2025.100192.
Beyaz MO, Yetiman AE, Dogan M, Horzum M. Examining the possibility of producing natural microbicides and antioxidant agents for food and cosmetic uses from the essential oils of Laurus nobilis (laurel) Syzygium aromaticum (clove), and Cinnamomum verum (cinnamon). Food Biosci. 2025;69:106840. doi: 10.1016/j.fbio.2025.106840.
Fan X, Yang Y, Gong Y, Zhan Y, Zhang X, Zhou S. Design of nonanoic acid composite vesicles as cosmetics carrier: stability skin permeability, antioxidant and antibacterial activity. J Mol Liq. 2025;419:126772. doi: 10.1016/j.molliq.2024.126772.
Soni H, Bhattu M, Verma M, Kaur M, Al Kahtani AA, Hussain Lone I. From kitchen to cosmetics: study on the physicochemical and antioxidant properties of waste cooking oil-derived soap. J King Saud Univ Sci. 2024;36(10):103483. doi: 10.1016/j.jksus.2024.103483.
Lotos ED, Danila A, Vasiliu AL, Rosca I, Stroian DV, Simionescu BC. The potential emulsions of xanthan gum and Daucus carota macerated oil in functional textiles for skincare applications: formulation characterization and performance evaluation. Colloids Surf A Physicochem Eng Aspects. 2024;682:132960. doi: 10.1016/j.colsurfa.2023.132960.
Assouguem A, Annemer S, Kara M, Lazraq A. Innovative approaches in the extraction, identification and application of secondary metabolites from plants. Phyton. 2025;94(6):1631-68. doi: 10.32604/phyton.2025.065750.
Khojah H, Mostafa EM, Aljounaidi AA, Saleh AM, El Nablaway M, Ismail A. Comprehensive analysis of malabar tamarind fruit rind total extract: HPTLC fingerprinting in silico exploration of its metabolites for SARS-cov-2 omicron spike protein antibacterial and antidiabetic potentials with in vitro evaluation of antidiabetic and antioxidant activities. Heliyon. 2024;10(15):e35839. doi: 10.1016/j.heliyon.2024.e35839, PMID 39170184.
Singh H, Singh M, Nag S, Mohanto S, Jain K, Shrivastav A. Isolation and characterization of secondary metabolites from Bryophylum pinnatum (Lam.) oken and assessment of wound healing efficacy using animal model. S Afr J Bot. 2024;169:531-42. doi: 10.1016/j.sajb.2024.05.008.
Sim YY, Tan CP, Cheong LZ, Nyam KL. Hibiscus cannabinus L. leaf and seed in cosmetic formulation: an integrated approach as antioxidant and melanogenesis inhibitor. Sustain Mater Technol. 2022;33:e00457. doi: 10.1016/j.susmat.2022.e00457.
Rizzi V, Gubitosa J, Fini P, Nuzzo S, Agostiano A, Cosma P. Snail slime-based gold nanoparticles: an interesting potential ingredient in cosmetics as an antioxidant sunscreen and tyrosinase inhibitor. J Photochem Photobiol B. 2021;224:112309. doi: 10.1016/j.jphotobiol.2021.112309, PMID 34563935.
Muhammad N, Sulong MS, Bakar MF, Latif Abu Bakar MA, Mayzan MZ, Rahim NF. Electronic nose investigation and antioxidant assessment of CHARMS™ skincare cosmetics toward skin tone improvement. J Dermatol Sci Cosmet Technol. 2025;2(1):100060. doi: 10.1016/j.jdsct.2024.100060.
Wang H, Cheng N, Wu Q, Fang D, Rahman FU, Hao H. Antioxidant activities of sea buckthorn polysaccharides and their potential application in cosmetic industry. J Dermatol Sci Cosmet Technol. 2024;1(3):100023. doi: 10.1016/j.jdsct.2024.100023.
Asuquo EO, Ukam EE, Edet EE, Ufala VO. Formulation and evaluation of banana peel-based herbal cream for antibacterial and antifungal applications in cosmetic products. J Dermatol Sci Cosmet Technol. 2025;2(3):100106. doi: 10.1016/j.jdsct.2025.100106.
Cerci NA, Aydın B, Naz M, Sayın S, Aytar EC, Akkucuk S. Development and evaluation of an alginate-based cream formulation from Sargassum vulgare: antimicrobial antioxidant and safety assessments. Algal Res. 2025;90:104110. doi: 10.1016/j.algal.2025.104110.
Iskandar B, Putri RS, Novita G, Surboyo MD, Leny, Lee CK. Formulation and activity test of sunflower oil (Helianthus annuus L.) liquid soap as anti acne. Int J Appl Pharm. 2022;14(3):55-9. doi: 10.22159/ijap.2022.v14s3.11.
Russo Spena S, Poli L, Grizzuti N. The art of confectionery creams: rheological insight across formulations. Int J Gastronomy Food Sci. 2025;41:101217. doi: 10.1016/j.ijgfs.2025.101217.
Guidara M, Yaich H, Petrut R, Richel A, Blecker C, Attia H. Manufacturing bioprocess of novel cream formulations based on polysaccharides ‘ulvans’ from green seaweed Ulva Lactuca: effect of extraction procedures and concentrations on the optical and rheological properties of ulvan creams. Sustain Chem Pharm. 2024;42:101852. doi: 10.1016/j.scp.2024.101852.
Iskandar B, Mei HC, Liu TW, Lin HM, Lee CK. Evaluating the effects of surfactant types on the properties and stability of oil-in-water Rhodiola rosea nanoemulsion. Colloids Surf B Biointerfaces. 2024;234:113692. doi: 10.1016/j.colsurfb.2023.113692, PMID 38104466.
Lotfi Shirazi S, Koocheki A. Investigating the rheological properties and structure of grass pea protein isolate sesame oil bigels for effective fat substitution in low-fat cream formulation. Food Res Int. 2025;217:116820. doi: 10.1016/j.foodres.2025.116820, PMID 40597530.
Balasubramanian S, Selvaraj S. Formulation and evaluation of spirulina red algae and jack fruit seed powders infused anti-aging cream: in silico analysis and physiochemical characteristics. Food Chem Adv. 2025;7:100968. doi: 10.1016/j.focha.2025.100968.
Radmard A, Kumar Srivastava R, Shrestha N, Khan J, Muzaffar S, Athar M. Enhancing topical delivery of ISRIB: optimizing cream formulations with chemical enhancers and pH adjustment. Int J Pharm. 2024;665:124661. doi: 10.1016/j.ijpharm.2024.124661, PMID 39244069.
Hrichi S, Chaabane Banaoues R, Hrichi H, Belgacem S, Babba O, Flamini G. Chemical composition and antifungal efficacy of Tunisian Prunus armeniaca L. kernels with formulation of an antidermatophyte cream based on kernel powder. Fitoterapia. 2024;179:106223. doi: 10.1016/j.fitote.2024.106223, PMID 39341348.
Leny, Sari M, Ginting M, Melisa, Iskandar B. Evaluation of an anti-dandruff shampoo incorporating ethanol extract from corn silk (Zea mays L.) against Candida albicans fungus: formulation and activity assessment. Int J Appl Pharm. 2024;16(6):48-56. doi: 10.22159/ijap.2024v16i6.51807.
Anjum H, Sofi G, Shahwan M, Khan MS, Shamsi A, Shamsi S. In vitro and in vivo study targeting the development of unani antidermatophytic cream: implication of herbal formulations in treatment of dermatophytosis. Heliyon. 2023;9(5):e16154. doi: 10.1016/j.heliyon.2023.e16154, PMID 37234648.
Velotto S, Parafati L, Ariano A, Palmeri R, Pesce F, Planeta D. Use of stevia and chia seeds for the formulation of traditional and vegan artisanal ice cream. Int J Gastronomy Food Sci. 2021;26:100441. doi: 10.1016/j.ijgfs.2021.100441.
Abdollahi M, Axelsson J, Carlsson NG, Nylund GM, Albers E, Undeland I. Effect of stabilization method and freeze/thaw-aided precipitation on structural and functional properties of proteins recovered from brown seaweed (Saccharina latissima). Food Hydrocoll. 2019;96:140-50. doi: 10.1016/j.foodhyd.2019.05.007.
Peng Y, Yang M, Wen J, Chen H, Shen W, Jiang L. Advancements in the application of natural extracts for atopic dermatitis treatment. J Dermatol Sci Cosmet Technol. 2024;1(2):100022. doi: 10.1016/j.jdsct.2024.100022.
Zhou X, Zhu M, Zhang W, Huang J, Zhang B, Zhang F. Gellan gum-quercetin covalent complex prepared by the free radical grafting: characterization, bioaccessibility and intracellular antioxidant activity. Food Chem X. 2025;30:102965. doi: 10.1016/j.fochx.2025.102965, PMID 40989097.
Alsayadi MM, Gazaem MA, Syed Mohamad SA, Ismail NH, Alshoaiby MA, Agha HM. Nutritional composition, phytochemical profile HPLC analysis and antioxidant activity of leaf and flower extracts of Rumex nervosus from Yemen. Biocatal Agric Biotechnol. 2025;69:103749. doi: 10.1016/j.bcab.2025.103749.
Hossain MB, Akhy AA, Habib MA, Hossain MA, Hossain MS, Syduzzaman M. Proximate composition, phytochemical properties, antioxidant activity and effect of refrigeration for long time storage of two different taste and maturity stage of Tamarindus indica pulp. Food Chem Adv. 2025;8:101094. doi: 10.1016/j.focha.2025.101094.
Novaryatiin S, Nuramanah R, Isnawati I, Susanti S, Ryba Kanahuang DS, Ardhany SD. Formulation physical characterization and antibacterial activity of modifications of bawang dayak Eleutherine bulbosa (Mill.) Urb. Anti-acne cream. J Herb Med. 2024;45:100869. doi: 10.1016/j.hermed.2024.100869.
Grabauskaite R, Juriene L, Pukalskiene M, Sipailiene A, Skurkiene R, Venskutonis PR. Isolation of valuable substances from berry seeds and pomace by the green high-pressure methods, their evaluation and application in cosmetic creams. Ind Crops Prod. 2024;222:119729. doi: 10.1016/j.indcrop.2024.119729.
Drakalska Sersemova E, Arev M, Apostolova P, Karpicarov D, Maksimova V, Miceva D. Preparation and characterization of amphiphilic cream formulations with meloxicam. Pharmacia. 2024;71:1-7. doi: 10.3897/pharmacia.71.e139355.
Adekenov SM, Savchenko DL, Kenzhebekov AO, Zhabaeva AN, Adekenova AS, Polyakov VV. Development of therapeutic and cosmetic cream based on flavonoids. Fitoterapia. 2025;180:106283. doi: 10.1016/j.fitote.2024.106283, PMID 39489353.
Hari N, Vinod B L, Solomon V, Dev AS, Gangaprasad A, Nair AJ. Synthesis and characterization of β-carotene nano-formulation and its application in physiochemical properties of ice cream. Food Hum. 2023;1:1379-87. doi: 10.1016/j.foohum.2023.10.004.
Ning R, Feng C, Zhang F, Zong S, Jiang J. Synthesis and characterization of superhigh moisturizing carboxymethyl tamarind xyloglucan and its potential application in cosmetics. Biomacromolecules. 2025;26(3):1647-58. doi: 10.1021/acs.biomac.4c01453, PMID 39909484.
Arputhanantham SS, Al Thani GS, Al Amri RM, Hossain MA. Comparative analysis of heavy metal content of unregulated facial whitening creams and branded facial whitening creams. Toxicol Rep. 2024;12:326-30. doi: 10.1016/j.toxrep.2023.10.011, PMID 38516207.
LV Y, Gao D, Di Zhang, Liu M, Liu H, Liu M. A portable front-face fluorescence-sensing platform based on thiourea-schiff-base for rapid on-site detection of hazardous mercury contamination in whitening cosmetics. J Hazard Mater. 2025;495:138928. doi: 10.1016/j.jhazmat.2025.138928, PMID 40517466.
Mahulkar KC, Patil A, Bhalerao PP, Dabade A, Hundare S, Bhushette P. Optimization of formulation millets flours for waffle ice cream cone using simplex lattice design: characterization and shelf life study. Food Chem Adv. 2024;4:100600. doi: 10.1016/j.focha.2023.100600.
Jiang L, Wang Q, Rao Z, Lei X, Zhao J, Lei L. Formulation and characterization of bigels utilizing whey protein and polysaccharides: potential applications as cream analogues. Food Hydrocoll. 2024;152:109884. doi: 10.1016/j.foodhyd.2024.109884.
Biro T, Van Lessen M, Mardaryev A, Broadley D, Mauri C, Bertolini M. 581 spontaneous intrinsic aging in organ-cultured human skin as novel ex vivo assay to test candidate anti-aging actives. J Invest Dermatol. 2022;142(12):S281. doi: 10.1016/j.jid.2022.09.597.
Shim M, Choi S, Kim H, Beak S, Jeon N. LB1668 anti-aging effects of autophagy analyzed within a 3D microfluidic skin-on-a-chip for skin cosmetics testing. J Invest Dermatol. 2023;143(9):B9. doi: 10.1016/j.jid.2023.06.040.
Chuang FJ, Wang YW, Chang LR, Chang CY, Cheng HY, Kuo SM. Enhanced skin neocollagenesis through the transdermal delivery of poly-l-lactic acid microparticles by using a needle-free supersonic atomizer. Biomater Adv. 2023;154:213619. doi: 10.1016/j.bioadv.2023.213619, PMID 37703788.
Savikin K, Alimpic Aradski A, Jovanovic A, Pirkovic A, Radan M, Cujic Nikolic N. From food waste to anti-aging solution: harnessing the bioactive potential of pomegranate peel microparticles in skincare. Bioorg Chem. 2025;164:108818. doi: 10.1016/j.bioorg.2025.108818, PMID 40749268.