
Int J App Pharm, Vol 18, Issue 1, 2026, 389-400Original Article
QBD-DRIVEN DESIGN AND PHARMACOKINETIC PROFILING OF REMOGLIFLOZIN ETABONATE SUSTAINED-RELEASE MATRIX TABLETS FOR DIABETES MANAGEMENT
MUSKAN A. KHAN1,2, SACHIN B. SOMWANSHI1*, KAVERI T. VADITAKE3, KIRAN B. KOTADE4
1Department of Pharmaceutics, Pravara Rural Education Society’s, College of Pharmacy (For Women), Chincholi-422102, Nashik, Maharashtra, India. 2Department of Pharmaceutics, JMCT Institute of Pharmacy, Nashik-422214, Maharashtra, India. 3Department of Pharmaceutical Chemistry, Pravara Rural Education Society’s, College of Pharmacy (For Women), Chincholi-422102, Nashik, Maharashtra, India. 4Department of Pharmacology, Pravara Rural Education Society’s, College of Pharmacy (For Women), Chincholi-422102, Nashik, Maharashtra, India
*Corresponding author: Sachin B. Somwanshi; *Email: sachinsomwanshi27@gmail.com
Received: 07 Jul 2025, Revised and Accepted: 28 Oct 2025
ABSTRACT
Objective: With an emphasis on type 2 diabetes treatment, this work applied a QbD-based framework to design and optimize sustained-release Remogliflozin etabonate tablets, intending to enhance therapeutic effectiveness and patient adherence for type 2 diabetes management.
Methods: The study implemented a full factorial design to explore how Eudragit L100 and microcrystalline cellulose influence drug release and tablet hardness. The formulations were developed via direct compression and subjected to comprehensive evaluation, including pre-and post-compression properties, dissolution kinetics, compatibility, stability, and in vivo pharmacokinetic behavior in Wistar rats. Statistical analysis and formulation optimization were executed using Design Expert® software.
Results: All formulations met pharmacopoeial quality standards. The optimized formulation (F5) demonstrated 99.26±0.65 % cumulative drug release within 10 h, with release kinetics best fitting the Korsmeyer-Peppas model with a correlation coefficient of R² = 0.9976, indicating anomalous diffusion. Pharmacokinetic studies revealed significantly lower Cmax (94.62±4.3 ng/ml vs. 127.51±6.1 ng/ml, p<0.01), prolonged Tmax (5.84±1.28 h vs. 1.99±0.34 h, p<0.001), and enhanced systemic exposure (AUC₀–t: 2176.39±48.13 vs. 1987.96±37.24 ng h/ml, p<0.05; AUC₀–∞: 2598.81±73.42 vs. 2263.35±56.62 ng h/ml, p<0.05). The half-life of the optimized SR-matrix tablets (7.64±0.17 h) was significantly extended compared to the marketed reference tablet (5.93±0.28 h, p<0.05). Accelerated stability testing confirmed consistent physical and chemical attributes over 6 mo.
Conclusion: The QbD-driven approach successfully optimized RE SR-matrix tablets with robust sustained release behavior, improved pharmacokinetic performance, and satisfactory stability. These findings suggest the formulation as a promising strategy for sustained glycemic control and improved patient compliance in type 2 diabetes therapy.
Keywords: Remogliflozin etabonate, Sustained-release matrix tablet, Quality by design, Pharmacokinetics, Eudragit L100, MCC
© 2026 The Authors. Published by Innovare Academic Sciences Pvt Ltd. This is an open access article under the CC BY license (https://creativecommons.org/licenses/by/4.0/)
DOI: https://dx.doi.org/10.22159/ijap.2026v18i1.56445 Journal homepage: https://innovareacademics.in/journals/index.php/ijap
INTRODUCTION
The formulation of oral pharmaceutical products, whether intended for immediate, sustained, or controlled release, necessitates careful alignment of the physiological characteristics within the gastrointestinal system. In addition to biopharmaceutical considerations such as pharmacokinetics and pharmacodynamics, the formulation-specific characteristics of a drug play a pivotal role in achieving effective systemic delivery. Understanding these complex interdependencies is essential for designing robust and efficacious oral dosage forms [1, 2].
In recent decades, modified-release formulations have attracted prominence for their effectiveness, primarily due to their ability to maintain prolonged therapeutic drug levels and reduce dosing frequency [3]. The origin of such dosage forms dates back to the early 20th century, marking the early efforts in extending drug release to enhance therapeutic outcomes and patient adherence [4].
Among all delivery routes, the oral route is favoured for its convenience, minimal invasiveness, and cost-effectiveness [5]. However, conventional oral dosage forms often necessitate frequent dosing, resulting in fluctuating plasma drug levels, reduced therapeutic efficacy, and increased risk of side effects, particularly when dealing with drugs characterized by short biological half-lives or narrow therapeutic indices [6, 7]. These limitations have driven the advancement of sustained release (SR) formulations, offering prolonged drug action and improved consistency in plasma levels, which in turn supports better adherence and treatment outcomes [8, 9].
Among various SR strategies, matrix-based systems have emerged as one of the most reliable strategies for modulating drug release, with the advantage of simple manufacturing and scalability [10]. Synthetic polymers such as Eudragit L100 and MCC are commonly employed due to their favourable physicochemical properties, compatibility, and ability to tailor drug release profiles. These excipients facilitate controlled drug diffusion and provide structural integrity to the tablet matrix [11, 12].
Remogliflozin etabonate (RE), used in the treatment of type 2 diabetes as an SGLT2 inhibitor, has a short elimination half-life (~5–6 h), necessitating twice-daily dosing [10, 11]. Designing an SR matrix formulation for RE has the potential to extend systemic exposure, maintain steady-state plasma concentrations, and reduce dosing frequency, thereby improving patient adherence and therapeutic efficacy [13, 14].
While in vitro dissolution studies provide insight into release kinetics, pharmacokinetic (PK) evaluation is essential to confirm the in vivo performance of SR formulations. By assessing parameters such as Cmax, Tmax, AUC, and half-life, PK studies can validate whether the optimized formulation achieves the desired sustained plasma levels.
The QbD principle provides a scientific foundation for systematic formulation development by examining how material properties and processing factors influence the final product quality [15]. Through the identification of critical material attributes (CMAs) and critical process parameters (CPPs), QbD enables a comprehensive understanding of the formulation space [16, 17].
Employing a QbD strategy, this study aimed to design and optimize SR matrix tablets of RE, employing Eudragit L100 and MCC as key formulation variables. A full factorial design facilitated the systematic analysis of their effects on tablet hardness and dissolution behavior, followed by pharmacokinetic profiling in Wistar rats to confirm the in vivo performance of the optimized formulation. This approach is expected to yield a robust, patient-friendly dosage form with improved bioavailability and clinical outcomes.
MATERIALS AND METHODS
Materials
RE was kindly provided by Glenmark Pharmaceuticals, Nashik. All other excipients of pharmaceutical grade, including Eudragit L100, lactose, magnesium stearate, MCC, CMC, and talc, were sourced from S. D. Fine Chem Ltd., Mumbai and a RP precoated C-18 TLC plate from E. Merck Chemical, Mumbai. Analytical HPLC-grade methanol was purchased from Merck Specialties Pvt. Ltd., Mumbai, India. Orthophosphoric acid was procured from Qualigens (Thermo Fisher Scientific). Triethylamine (TEA) was acquired from Merck. Ultra-pure HPLC-grade water was obtained from Siddhi Lab, India.
Methods
Determination of λmax and linearity assessment
The UV spectrum of RE was recorded using a Jasco V-550 Spectrophotometer (Jasco Corporation, Japan) equipped with Spectra manager software. To prepare the sample, 0.4 ml of the stock solution was accurately measured and diluted with 0.1 N hydrochloric acid to a final volume of 10 ml, yielding a concentration of 40 µg/ml. The resultant solution was subjected to UV scanning in the wavelength range of 200–400 nm to determine the maximum absorbance wavelength λmax. The same procedure was repeated using a phosphate buffer with a pH of 6.8 as the diluent. The λmax obtained under both conditions was used to construct the calibration curve for quantitative analysis [18].
Compatibility profiling
Compatibility studies were conducted by preparing 1:1 physical mixtures of RE with each formulation excipient. The samples were stored at 40±2 °C and 75±5% relative humidity in sealed containers. FTIR analysis was performed using the KBr disc technique with an FTIR-8400S instrument (Shimadzu, Japan) across the range of 4000–400 cm⁻¹ to detect any potential chemical interactions [19].
Development and evaluation of SR-matrix tablet
The matrix tablets were prepared by direct compression method due to its efficiency as detailed in table 1 [20, 21]. RE 100 mg per tablet was achieved by adjusting the tablet's weight. All ingredients were screened using a 60-micron sieve to ensure consistent particle size distribution. RE, Eudragit L100 and MCC were blended in a mortar, followed by addition of lactose as a diluent and then homogenized in a rapid mixer granulator (RMG) at 150 rpm for 30 min. Finally, magnesium stearate and talc (2.5% w/w) were incorporated as lubricant and glidant, respectively, and blended for an additional 5 min. The final blend was compressed using a 10-station ‘B’ tooling rotary tablet press (Karnavati) fitted with an 8 mm punch at a compaction pressure of 15.7 MPa. The tablets now measure in at a more manageable 340 mg.
Experimental design
A full factorial design was implemented to investigate the influence of Eudragit L100 (factor A) and MCC (factor B) on tablet hardness and drug release. The independent variables were set at two levels: Eudragit L100 and MCC. The design matrix and coded values are summarized in table 1. The levels of two factors were selected based on studies carried out before implementing the experimental design using Design expert software Version 7 [22].
Table 1: Optimization design strategy
| Independent variables | ||||
| Label | Factors | Unit | Level | |
| Low level -1 | High level +1 | |||
| A | Eudragit L100 | % | 20 | 25 |
| B | Microcrystalline cellulose (MCC) | % | 10 | 15 |
| Dependent variables | ||||
| Responses | Goal | |||
| Y1 | Dissolution Rate (% CDR) | |||
| Y2 | Hardness (kg/cm2) | |||
Pre-and post-compression characterization
The powder mixture was assessed for flowability [23], whereas post-compression evaluation of the formulated SR matrix tablets comprised tests for physical attributes, diameter, thickness, and friability [24, 25].
Dissolution profiling
The dissolution profiling was conducted employing a USP Type II (paddle) apparatus at 37±0.5 °C. Paddle sinkers were used in dissolution to avoid floating of tablets. The speed of paddle was 100 rpm. The dissolution study used 900 ml of release medium, following USP standards for tablets. The release medium was 0.1 N HCl for the first 2 h, followed by a phosphate buffer (6.8 pH) for the remaining 8 h. At specified time points (every 1 h), 10 ml samples were taken out, filtered, and assessed at 226 nm. The same concentration of fresh dissolution medium was immediately added to maintain sink conditions by considering sink index [21]. The cumulative percentage of drug release was calculated and plotted against time to assess the release profile [26, 27]. The release kinetics was evaluated by fitting the data to various mathematical models (zero-order, first-order, Higuchi, and Korsmeyer-Peppas). Each experiment was performed in triplicate (n=3), and results are expressed as mean±SD. The release rate and mechanism were determined using the following equations:
Zero-order kinetics:
First-order kinetics:
Higuchi model:
Korsmeyer-Peppas model:
where; Qt is the amount of drug released at time (t), Q₀ is the initial amount of drug, Q∞ is the amount of drug released at time (∞), K₀, K₁, KH, and KKP are the release rate constants, and n is the release exponent indicating the drug release mechanism [28].
Surface morphology
The surface morphology was assessed by scanning electron microscope (SEM) (DSM 950, Zeiss, Germany) followed by in vitro dissolution profiling at 1 h in 0.1 N HCl and 10 h in phosphate buffer (pH 6.8). Following withdrawal from the dissolution medium, tablets were lightly dried with tissue paper, positioned on copper stubs using double-sided adhesive tape, and coated with platinum to enhance conductivity for SEM observation. SEM imaging parameters, including working distance and detector settings, were optimized to obtain high-resolution micrographs [29].
Stability study
Following the ICH stability testing protocol, the optimized formulation of matrix tablet underwent accelerated conditions of 40±2 °C/75±5 % RH for six mo. The evaluation parameters, including hardness, thickness, friability, and dissolution profile, were monitored at 0, 3 and 6 mo. Triplicate measurements were obtained for each parameter, followed by statistical assessment using one-way ANOVA, taking p<0.05 as the threshold for statistical significance. Stability under accelerated conditions was assessed by comparing results over time with initial values [30].
In vivo experimental methods
Animal selection and approval
Male wistar rats (200 to 250 g, 7 to 8 w’ age) were taken from the college animal house for the experiments. The animals were confined and quarantined in cages for 8-10 days. The animals were kept under typical laboratory settings, including a temperature of 25±1 °C, humidity of 50-65%, and a 12h light and dark cycle. The experimental protocol was authorized by the IAE Committee of PRES's College of Pharmacy (For Women), Nashik, under registration number 1345/PO/Re/S/10/CPCSEA.
Optimization of chromatographic conditions
A reverse-phase HPLC protocol was developed for the quantification of RE in rat plasma using a 1260 Infinity II module (pump G7111A, degasser, UV detector SPD-10A VP, and auto injector G7129A). The separation was achieved on a C18 column (Inertsil ODS-3V, 150 × 4.6 mm, 5 μm), selected based on the physicochemical properties of RE and desired analytical performance. The mobile phase, consisting of methanol and 0.2% triethylamine (80:20, v/v; pH adjusted to 3.0 with 0.1% orthophosphoric acid), was optimized considering prior reports [31]. The mobile phase was filtered through a 0.45 μm membrane and degassed before and during use. Flow rates ranging from 0.8 to 1.2 ml/min were evaluated with a fixed injection volume of 20 μL, and optimal resolution with symmetrical peaks was obtained at 1.0 ml/min and exhibited distinct retention times (Rt) of 8.20 min for RE and detected at 226 nm.
Pharmacokinetic profiling
Pharmacokinetic profiling was performed in twelve healthy male wistar rats to compare the systemic disposition of the optimized SR-matrix tablets with a marketed reference formulation of RE. Both formulations, equivalent to dose of rat (10 mg/kg), were triturated and suspended in 1% w/v CMC to ensure complete oral administration. A drug suspension was administered orally using a feeding tube. Animals in Group A were dosed with the optimized formulation, whereas Group B received the marketed reference formulation at a body-weight adjusted equivalent dose [32]. Rats were allowed water and food. After fasting for at least 12 h with free access to water, all the rats were given with RE dose, respectively. Blood samples (~0.2 ml) were collected from the tail vein puncture at 0, 0.5, 1, 2, 4, 6, 8, 12, and 24 h post-dose. Plasma was separated by centrifugation (3,000 rpm, 10 min) after collection into sodium citrate–containing tubes. Protein precipitation was achieved by mixing plasma with 10% perchloric acid (1:1 v/v), followed by vortexing and re-centrifugation. The clear supernatant was stored at −70 °C until analysis. Plasma drug concentrations were determined using a validated bioanalytical method, and pharmacokinetic parameters (Cmax, tmax, AUCo-t, AUCo-∞, and t1/2) were calculated using Phoenix WinNonlin® software [28, 33].
RESULTS AND DISCUSSION
UV Analysis and calibration curve
The maximum absorption wavelength (λmax) of RE was observed at 226 nm in both 0.1 N HCl and phosphate buffer (pH 6.8) (fig. 1).
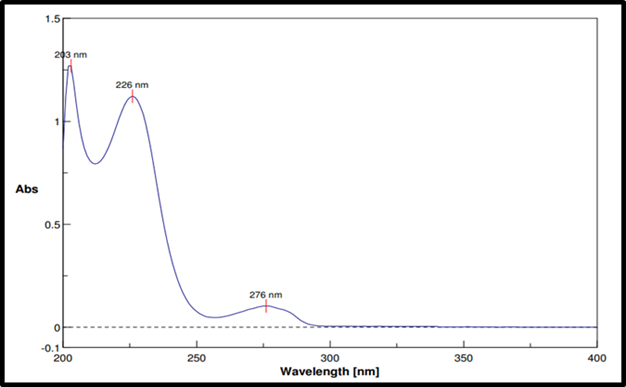
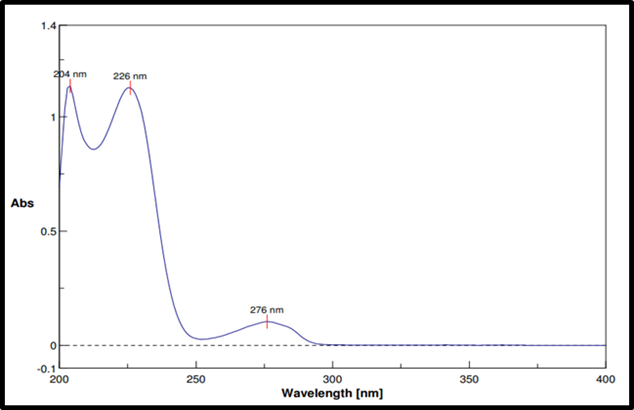
Fig. 1: UV spectra of Remogliflozin etabonate in 0.1N HCL and phosphate buffer pH 6.8
The calibration curves demonstrated linearity across the tested concentration range with high R² value (fig. 2), indicating a reliable quantification method, consistent with previous studies on similar reagents and supporting the use of UV-Vis spectrophotometry for RE quantification.
Compatibility assessment
FTIR spectroscopy was used to test the compatibility of drug excipients. RE, peaks were observed at 3517.98 cm-1 for O–H stretching, 2978.27 and 2926.73 cm-1 for aliphatic C–H stretching, 1744.42 cm-1 for ester C=O stretching, 1609.86 cm-1 for aromatic ring C=C stretching, 1465.07 cm-1 for C-H bending, 1245.49 cm-1 for asymmetric stretching of C–O–C, 1059.71 cm-1 for C–O stretching. FTIR spectra revealed no significant shift or disappearance of major functional group peaks in the physical mixtures of RE with excipients (fig. 3a to 3f). This indicates no interaction between RE and formulation components, supporting their compatibility and chemical stability during tablet processing [34].
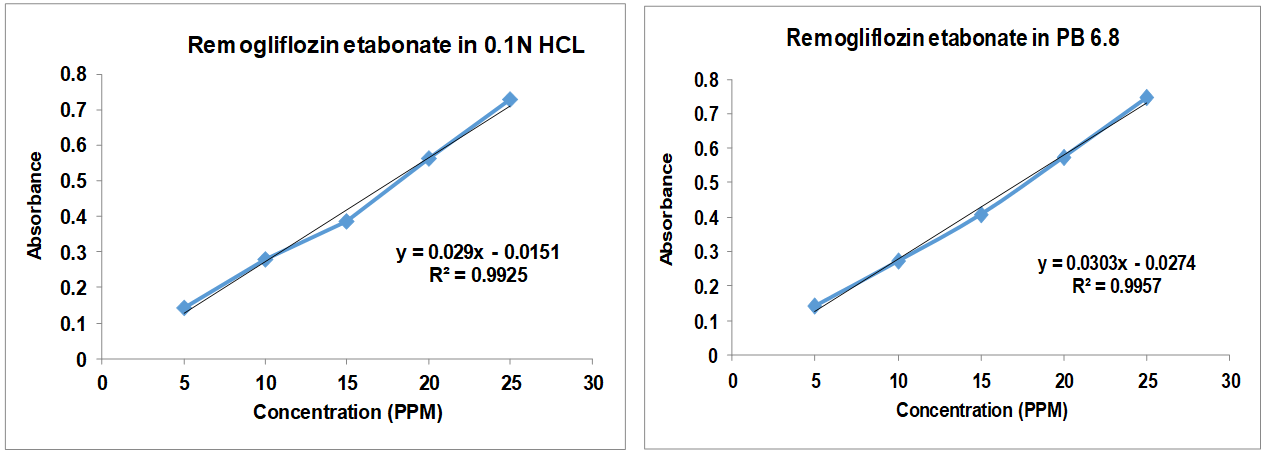
Fig. 2: Linearity assessment for remogliflozin etabonate
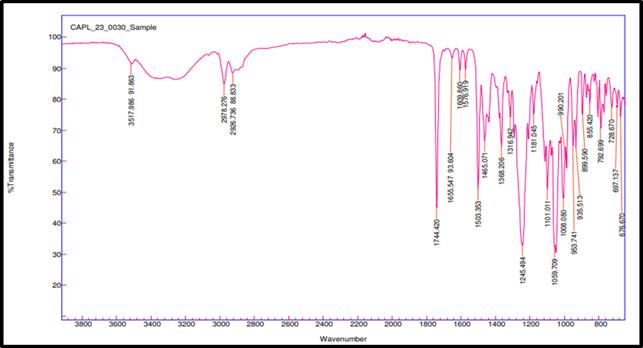
Fig. 3a: FTIR of pure drug remogliflozin etabonate
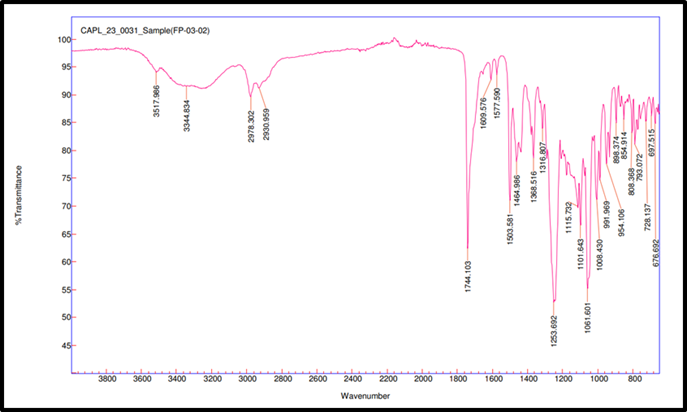
Fig. 3b: Compatibility IR for remogliflozin etabonate: EudragitL100
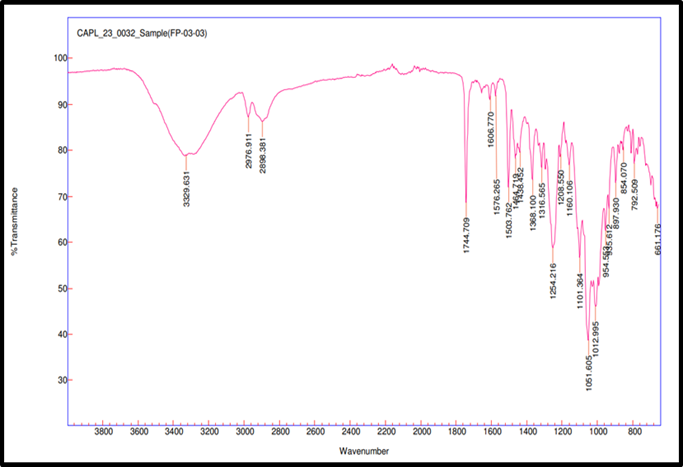
Fig. 3c: Compatibility IR for Remogliflozin etabonate: MCC
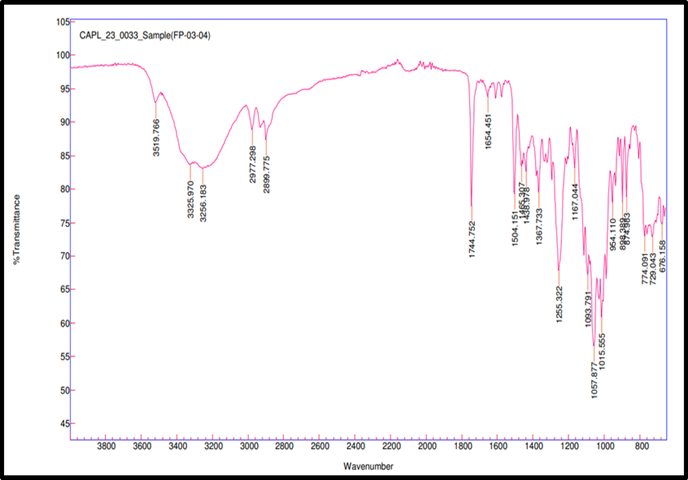
Fig. 3d: Compatibility IR for remogliflozin etabonate: lactose
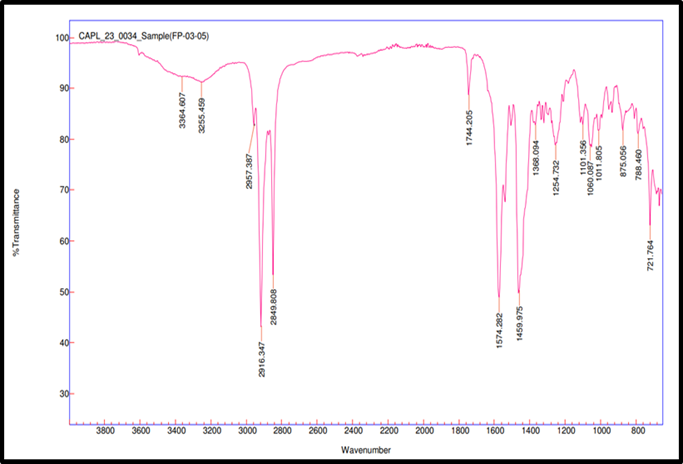
Fig. 3e: Compatibility IR for remogliflozin etabonate: magnesium stearate
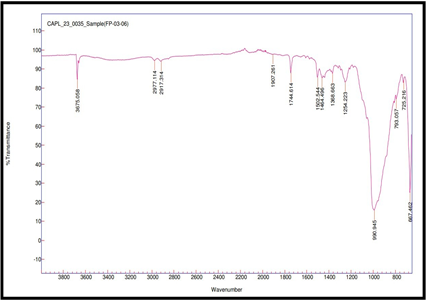
Fig. 3f: Compatibility IR for remogliflozin etabonate: Talc
Moreover, there was no evidence of drug degradation or incompatibility upon visual inspection, suggesting that RE maintained its stability with the selected excipients under stress conditions. These findings confirm the suitability of the excipients for use in the formulation.
Development and evaluation of SR-matrix tablet
The SR-matrix tablets were prepared by direct compression due to its simplicity and efficiency. Although Eudragit L100 possesses a high glass transition temperature and is generally processed by granulation, its direct compression feasibility has been demonstrated in combination with MCC, which enhances compressibility and flow [35-37]. Lactose, used only as a diluent, was not considered a release-modifying excipient, as its rapid solubility limits influence on sustained release. Pre-screening (FTIR and trial blends) confirmed no interaction with drug or polymers, while flow indices (Carr’s Index ~12%, Hausner ratio<1.25, angle of repose<30°) and dissolution at 6–8 h showed no significant differences (p>0.05) between lactose-containing and lactose-free blends. Thus, lactose was kept constant, and the factorial design was restricted to Eudragit L100 and MCC as the critical formulation variables [38, 39].
Pre-compression parameters
The powder blend from all the batches were evaluated for density and flow property parameters, which includes bulk density, tapped density, Carr’s index, Hausner’s ratio and angle of repose. The results were expressed as follows in table 2.
Table 2: Assessment of flow property
| Batches | Bulk density | Tapped density | Carr’s index | Hausner’s ratio | Angle of repose |
| F1 | 0.4384±0.0041 | 0.4996±0.0029 | 12.25±0.38 | 1.14±0.01 | 26.20±0.45 |
| F2 | 0.4485±0.0025 | 0.4982±0.0033 | 9.96±0.22 | 1.11±0.01 | 25.34±0.38 |
| F3 | 0.4271±0.0032 | 0.4830±0.0040 | 11.56±0.31 | 1.13±0.02 | 27.36±0.42 |
| F4 | 0.4373±0.0029 | 0.5007±0.0035 | 12.67±0.44 | 1.15±0.01 | 26.74±0.46 |
| F5 | 0.4250±0.0030 | 0.4928±0.0041 | 13.75±0.37 | 1.16±0.02 | 26.98±0.40 |
| F6 | 0.4159±0.0042 | 0.4696±0.0038 | 11.44±0.35 | 1.13±0.01 | 24.45±0.39 |
| F7 | 0.4465±0.0028 | 0.5037±0.0031 | 11.36±0.26 | 1.13±0.01 | 25.15±0.36 |
| F8 | 0.4239±0.0031 | 0.4782±0.0029 | 11.35±0.29 | 1.13±0.01 | 25.34±0.35 |
| F9 | 0.4342±0.0027 | 0.4868±0.0032 | 10.79±0.33 | 1.12±0.01 | 28.24±0.41 |
*Results reported as mean±SD, using triplicate observations.
The pre-compression parameters of all formulation batches (F1–F9) were evaluated in triplicate and expressed as mean±standard deviation. Flow indices were acceptable (Carr’s Index 10–13%, Hausner’s ratio<1.11, angle of repose<30°) as per monographic standards [40]. Statistical analysis using one-way ANOVA revealed significant differences among the batches for all measured parameters, including bulk density (F = 12.63, p<0.0001), tapped density (F = 9.74, p<0.0001), Carr’s index (F = 10.89, p<0.0001), Hausner’s ratio (F = 5.37, p = 0.0012), and angle of repose (F = 8.42, p<0.0001). These findings indicate considerable variation in the flow and packing characteristics of the powder blends, likely attributable to differences in excipient composition or processing parameters across batches. The statistically significant variation in flow indices underscores the importance of optimizing formulation variables to ensure uniform powder behavior during tablet compression. The low standard deviations observed across all measurements further affirm the reliability and reproducibility of the data.
Post compression parameters
Post-compression evaluations showed all nine batches (F1–F9) complied with pharmacopoeial standards (table 3).
Table 3: Assessment of tablet quality attributes
| Batches | Thickness (mm) | Diameter (mm) | Friability (%) |
| F1 | 4.7±0.1 | 9.5±0.1 | 0.58±0.14 |
| F2 | 4.5±0.2 | 9.3±0.2 | 0.59±0.18 |
| F3 | 4.5±0.2 | 9.4±0.1 | 0.29±0.12 |
| F4 | 4.8±0.3 | 9.5±0.1 | 0.59±0.16 |
| F5 | 4.4±0.2 | 9.5±0.2 | 0.30±0.12 |
| F6 | 4.5±0.2 | 9.3±0.2 | 0.29±0.17 |
| F7 | 4.5±0.1 | 9.3±0.2 | 0.58±0.11 |
| F8 | 4.6±0.3 | 9.4±0.2 | 0.57±0.14 |
| F9 | 4.7±0.2 | 9.5±0.2 | 0.57±0.12 |
*Results reported as mean±SD, using triplicate observations.
Tablet thickness was consistent across all formulations, ranging from 4.5±0.1 to 4.8±0.3 mm. The tablets exhibited consistent hardness around 7.5±0.5 to 9.0±0.5 kg/cm², indicating uniform compression. Friability values (0.29±0.12% to 0.59±0.18%) were within the acceptable limit of 1%, indicating suitable quality for SR tablets.
The physical evaluation of the compressed tablets revealed consistent thickness across all formulations, indicating uniform die fill during compression. The moisture retained within the porous structure of MCC acts as an internal lubricant, facilitating slippage and flow among individual microcrystals. This promotes efficient particle rearrangement and further reinforces hydrogen bonding, ultimately contributing to the excellent mechanical strength of the tablets [41].
Low friability further confirmed good mechanical resistance, suggesting that the tablets are sufficiently durable to withstand handling, packaging, and transportation without crumbling. The combined use of MCC PH 102 and Eudragit L100 was found to significantly reduce friability by enhancing matrix integrity, as supported by previous studies on polymer-based sustained-release systems [42].
Statistical evaluation using one-way ANOVA indicated significant differences (p<0.05) in thickness, and friability values, indicating variability in mechanical properties likely arising from formulation or processing differences. In contrast, the tablet diameter did not show significant inter-batch variability (p>0.05), suggesting consistency in die fill and punch-die assembly. The observed variation in hardness and friability emphasizes the need for precise control over compression force and excipient ratios to ensure tablet robustness and compliance with pharmacopoeial standards.
Optimization of SR-matrix tablet formulations
Constraints (goals) were placed on both the dependent (response) and independent (factors) variables to arrive at the optimum formulation. To study the effect of independent variables on responses Design Expert 7.0 software was used. Experimental design layout developed for 9 possible batches of RE SR-matrix tablet as shown in table 4.
Effect of formulation variables on dissolution rate
The experimental data were analyzed by multiple regression analysis and the coefficients of the model were used for the significance levels (table 5). The drug dissolution rate (Y1) across the 9 runs ranged from 87.47±1.18 to 99.26±0.65 %. When the design formulation findings were fitted into many models, a Quadratic model was significant for dissolution rate (F = 19.8537, p = 0.0186). The comparative values of R2 of 0.9517 and the Adjusted R2 of 0.9228 are reasonably in agreement with % CV values 1.28. The ratio of signal to noise is measured by Adequate Precision. A ratio of at least 4 is preferred. Our ratio of 13.54 suggests that the signal is adequate. Thus, this model can be used to navigate the design space. The ANOVA confirmed significance for factors A, B, and A². The F-value for the model obtained through regression analysis was 32.86, which implies the model was significant (table 6). Percentage of Eudragit L100 and MCC in formulation having curvature impact on dissolution rate of drug. As % Eudragit L100 increases, the dissolution rate decreases. As % MCC increases in formulation, the dissolution rate also decreases. Eudragit L100 is having a high impact on dissolution rate as compared to MCC as its P value is very low as compared to MCC.
Table 4: The layout of the actual design of DOE
| F. Code | Factor | Response | ||
| A: % Eudragit L100 | B: % MCC | Dissolution rate (% CDR) | Hardness (kg/cm2) | |
| F1 | 20 | 10 | 98.55±0.82 | 7.5±0.5 |
| F2 | 20 | 12.5 | 98.25±0.76 | 8±0.5 |
| F3 | 20 | 15 | 97.52±0.91 | 8±0.5 |
| F4 | 22.5 | 10 | 98.44±0.88 | 7.5±0.5 |
| F5 | 22.5 | 12.5 | 99.26±0.65 | 8.5±0.5 |
| F6 | 22.5 | 15 | 96.45±0.93 | 8.5±0.5 |
| F7 | 25 | 10 | 92.72±1.12 | 8±0.5 |
| F8 | 25 | 12.5 | 89.45±1.05 | 8.5±0.5 |
| F9 | 25 | 15 | 87.47±1.18 | 9±0.5 |
*Results reported as mean±SD, using triplicate observations.
Table 5: Model fit summary for response variables
| Response variable | Model | F value | Sequential p-value | R² | Adjusted R² | % CV | SD |
| Dissolution Rate (Y1) | Quadratic | 19.8537 | 0.0186 | 0.9517 | 0.9228 | 1.28 | 1.22 |
| Hardness (Y2) | Linear | 17.57143 | 0.0031 | 0.8542 | 0.8056 | 2.70 | 0.22 |
Effect of formulation variables on tablet hardness
Hardness (Y2) values were observed in the range of 7.5±0.5 to 9±0.5 kg/cm2. The Linear model was significant (F = 17.57143, p = 0.0031) as shown in table 5. The comparative values R2 of 0.8542 and the Adjusted R2 of 0.8056 are reasonably in agreement with % CV values as 2.70. Adequate precision, which measures the signal-to-noise ratio, requires a minimum value of 4 for model acceptability; the obtained ratio of 11.784 confirms the model’s adequacy. This model can be used to navigate the design space. ANOVA revealed that both A and B significantly affected hardness. The Model F-value of 17.57 implies the model is significant (table 6). Percentage of Eudragit L100 and MCC in formulation having impact on hardness. As % Eudragit L100 increases hardness increases. As % MCC increases in formulation, hardness also increases. MCC is having a high impact on hardness as compared to Eudragit L100 as its P value is very low as compared to Eudragit L100.
Table 6: ANOVA results of response surface model
| Source | Sum of squares | df | Mean square | F-value | p-value prob>F | Significance |
| Dissolution rate | ||||||
| Model | 145.828972 | 3 | 48.60966 | 32.85657 | 0.0010 | Significant |
| A-Eudragit L100 | 101.517067 | 1 | 101.5171 | 68.61811 | 0.0004 | |
| B-MCC | 11.3988167 | 1 | 11.39882 | 7.704766 | 0.0391 | |
| A2 | 32.9130889 | 1 | 32.91309 | 22.24684 | 0.0053 | |
| Residual | 7.39725 | 5 | 1.47945 | |||
| Corrected total | 153.226222 | 8 | ||||
| Hardness | ||||||
| Model | 1.70833333 | 2 | 0.854167 | 17.57143 | 0.0031 | Significant |
| A-Eudragit L100 | 0.66666667 | 1 | 0.666667 | 13.71429 | 0.0100 | |
| B-MCC | 1.04166667 | 1 | 1.041667 | 21.42857 | 0.0036 | |
| Residual | 0.29166667 | 6 | 0.048611 | |||
| Corrected total | 2 | 8 |
The relationship between the dependent and independent variables was further elucidated using contour and response surface plots (fig. 4).
Based on the combined evaluation of pre-compression, post-compression and factorial design model data, the optimized formulation was identified. This batch composed of 22.50% Eudragit L100 and 12.50% MCC, demonstrated desirable physical properties and a sustained drug release profile, making it the suggested optimized batch for further kinetic and in vitro release studies.
Dissolution profiling
The in vitro evaluation of all the formulated batches were carried out for 10 h by using 0.1N hydrochloric acid (0-2 h) and phosphate buffer 6.8 pH (3-10 h) as dissolution medium and % CDR was determined by using its respective equation of line. The physical mixture of Eudragit L100 and MCC showed good sustained effect. The dissolution study revealed that formulations F1-F3 released nearly 98% of drugs within 7-8 h, indicating inadequate polymer content to sustain release. Batches F4-F6 demonstrated controlled release up to 10 h with complete drug release, suggesting an optimal polymer concentration for sustained delivery. In contrast, F7-F9 exhibited slower release (87-93% at 10 h), likely due to higher matrix density that restricted complete drug diffusion. A statistically significant difference (P<0.05) was observed in the release behavior of tablets containing different polymer ratios. Fig. 5 illustrates that higher polymer concentration slowed drug release, which may result from increased matrix density and extended diffusion distance.
The release kinetics of the optimized SR-matrix tablet (F5) was evaluated using various mathematical models. The formulation exhibited best fit with Korsmeyer-Peppas model (R² = 0.9976) with the critical value of n=0.8997, followed by Higuchi model (R² = 0.9966), Zero order (R² = 0.9824), and First order (R² = 0.7545). To elucidate the diffusional exponent, the experimental data were applied to the Korsmeyer–Peppas equation. An n value within 0.5–1 reflects anomalous diffusion behavior, n<0.5 suggests Fickian transport, while n>1 is indicative of super case II relaxation-controlled release [43]. The diffusional exponent (n = 0.8997) obtained from the Korsmeyer–Peppas equation indicates anomalous transport, suggesting that drug release is initially governed by Fickian diffusion with subsequent contribution from polymer relaxation. The high Higuchi R² value further supports diffusion as the predominant mechanism, consistent with hydrophilic matrix systems. These findings confirm that the proportions of Eudragit L100 and MCC act as critical formulation variables in achieving controlled release behavior of RE SR-matrix tablets.
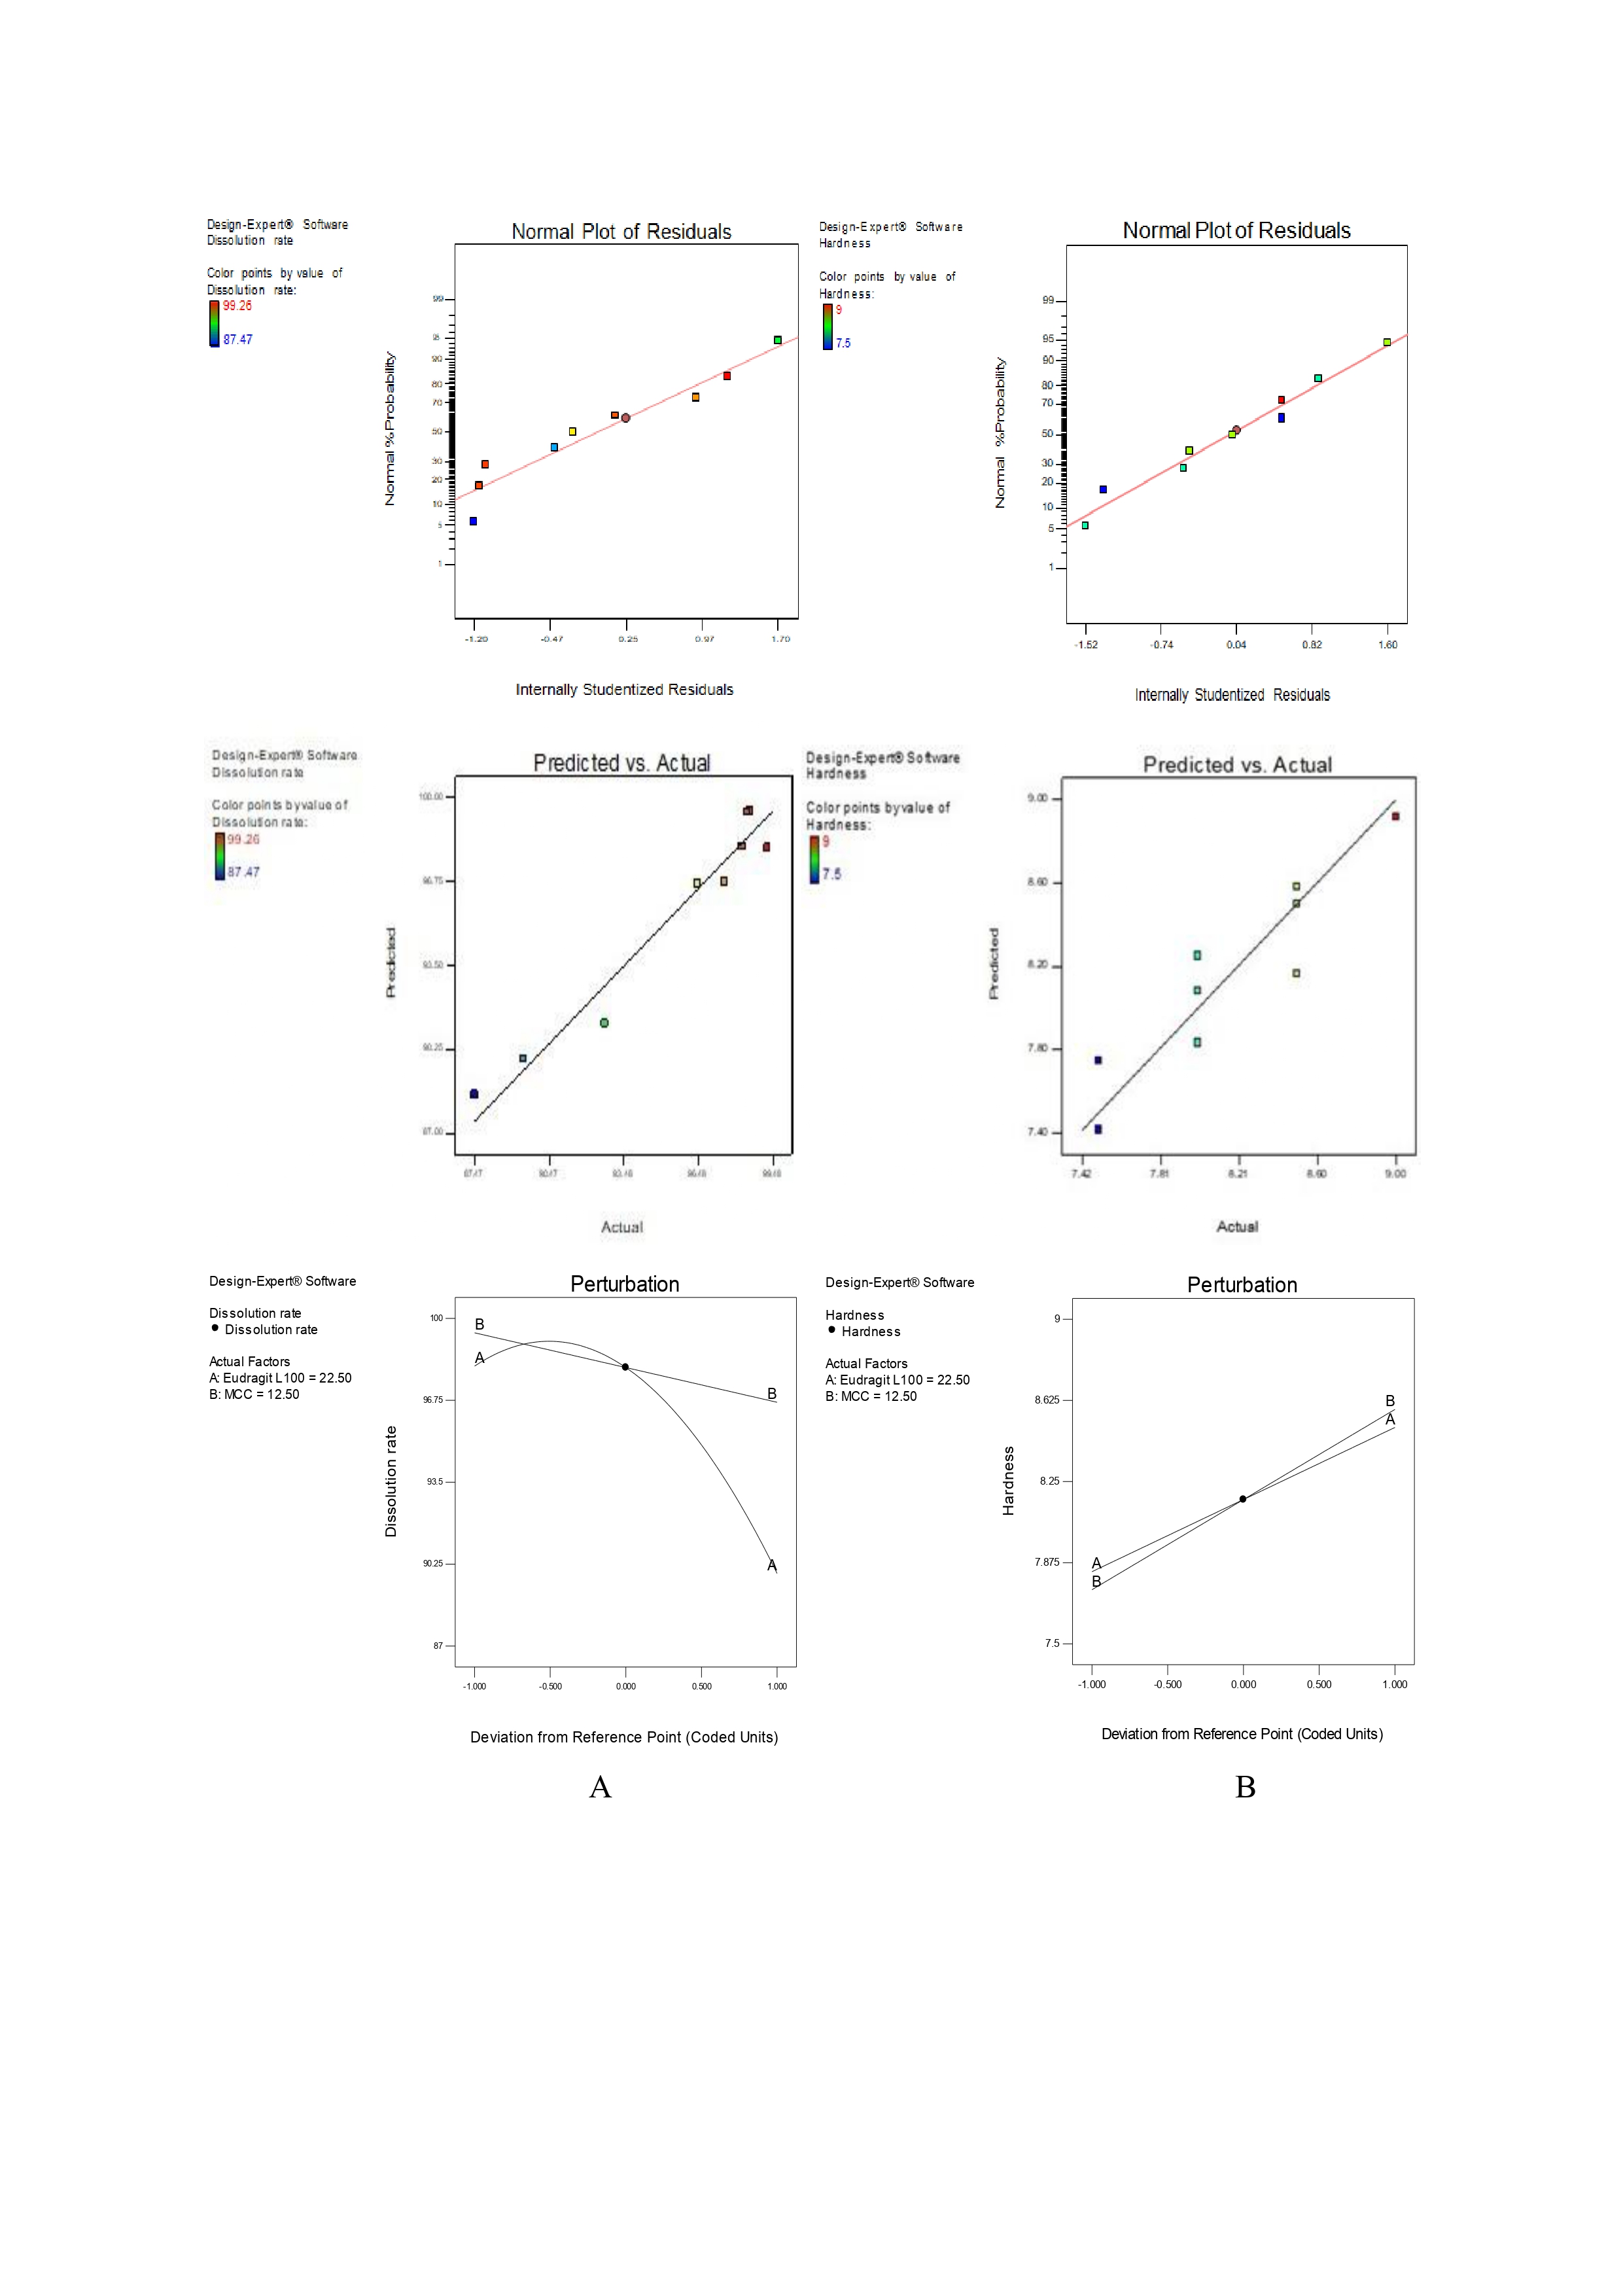
Fig. 4: Contour plots illustrating the effects of formulation variables on critical quality attributes of itraconazole-loaded FFG: (A) effect of dissolution rate and (B) effect of hardness
Surface morphology
SEM analysis of the optimized RE SR-matrix tablet (fig. 6) revealed minimal surface porosity in acidic medium (0.1N HCl, 1 h), corresponding to the limited drug release observed during the initial 0–2 h. Exposure to pH 6.8 phosphate buffer (10 h) induced pronounced surface pores, cracks, and partial erosion, facilitating sustained drug diffusion. These morphological changes confirm a biphasic release mechanism, where early diffusion is followed by polymer relaxation and erosion, consistent with the Korsmeyer-Peppas model (n = 0.8997). Furthermore, formulations with higher polymer content exhibited denser surfaces with reduced porosity, correlating with slower release and highlighting the role of matrix density in modulating drug release kinetics.
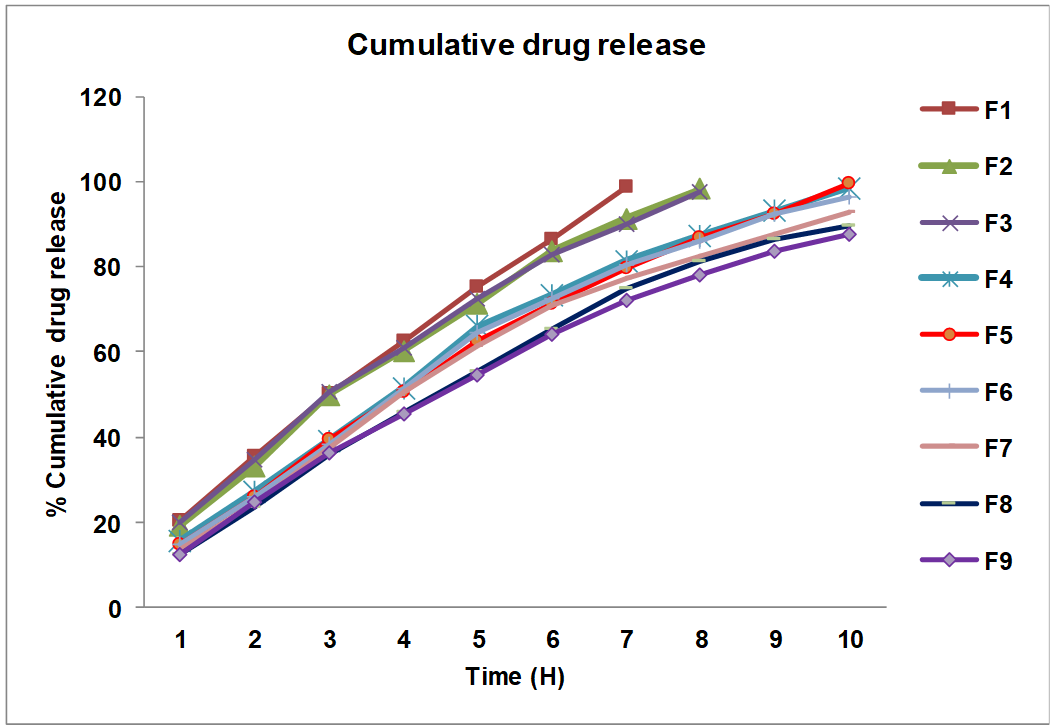
Fig. 5: % Cumulative drug release for formulations of RE SR-matrix tablets
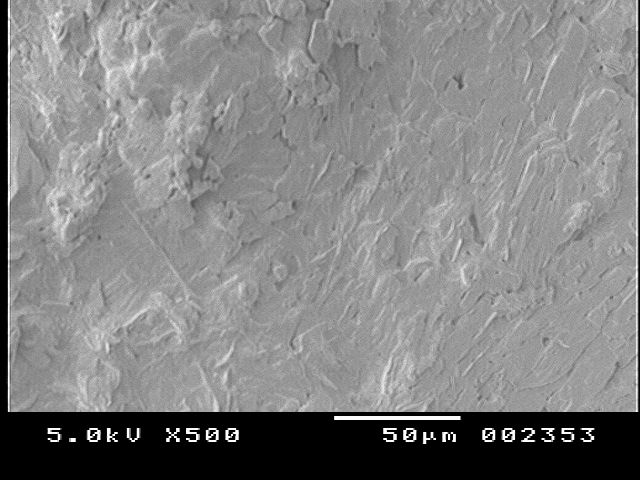
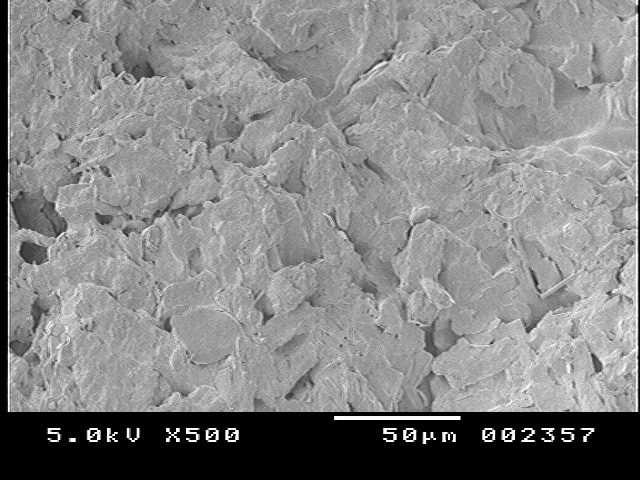
Fig. 6: SEM study showing surface morphology of optimized SR-matrix tablet in (a) acidic media, 1h and (b) basic media, 10h
Stability study
The optimized SR matrix tablet of RE was subjected to accelerated stability testing (40±2 °C/75±5% RH) over 6 mo which provides predictive information about the long-term stability of the formulation according to ICH Q1A(R2) guidelines (fig. 7). The hardness exhibited a minor decrease from 8.5±0.5 kg/cm² at 0 mo to 8.0±0.5 kg/cm² at 6 mo, confirming that the mechanical strength of the matrix was largely maintained. Thickness remained almost constant (4.4±0.2 mm initially to 4.2±0.2 mm), reflecting good dimensional stability. Friability showed a slight increase from 0.30±0.12 % to 0.34±0.15 %, but remained well below 1%, meeting pharmacopoeial requirements and indicating the structural integrity of the tablet. It may be due to MCC’s hygroscopicity. A minor reduction in cumulative drug release was observed over the study period, from 99.26±0.65% at 0 mo to 97.20±0.95 % at 6 mo, which may be attributed to slight variations in polymer hydration and gel formation during storage. Despite this, the sustained release profile remained within acceptable limits, confirming that the drug release performance was preserved. These findings confirm that physical integrity and in vitro release characteristics of the optimized batch remained unchanged, demonstrating excellent stability under ICH-recommended conditions.
Overall, ANOVA results confirmed that the observed variations were statistically insignificant (p>0.05), demonstrating that the optimized RE SR-matrix tablets maintained their mechanical integrity, physical attributes, and dissolution characteristics during 6 mo. of accelerated storage.
Based on ICH principles, formulations that remain stable under accelerated conditions are expected to exhibit comparable stability under long-term conditions (25±2 °C/60±5% RH) over 12–24 mo. Therefore, the accelerated stability data provides scientific justification that the optimized SR matrix tablets are likely to maintain their mechanical integrity, physical attributes, and sustained-release performance during long-term storage, and can serve as a predictive indicator until formal long-term studies are conducted.
In vivo drug performance
In vivo drug release studies of RE were carried out in rats plasma using RP-HPLC protocols. The method exhibited good resolution and a symmetric peak with Rt of 8.20 min with no interfering peak at the retention time of RE while the blank plasma was clean. Method validation was conducted in accordance with the USFDA guidelines. The overall % extraction recovery was 93.26 %, with a % CV of 1.78 % and the coefficient of determination was R2=0.9906, which showed a good linearity level of the protocol. Sensitivity analysis at the LLOQ showed acceptable values as 5 ng/ml with 2.68 % CV which were below the 20 % limit; matrix effect CV<10%; accuracy and precision within ±15%. These results demonstrate reliable plasma quantification.
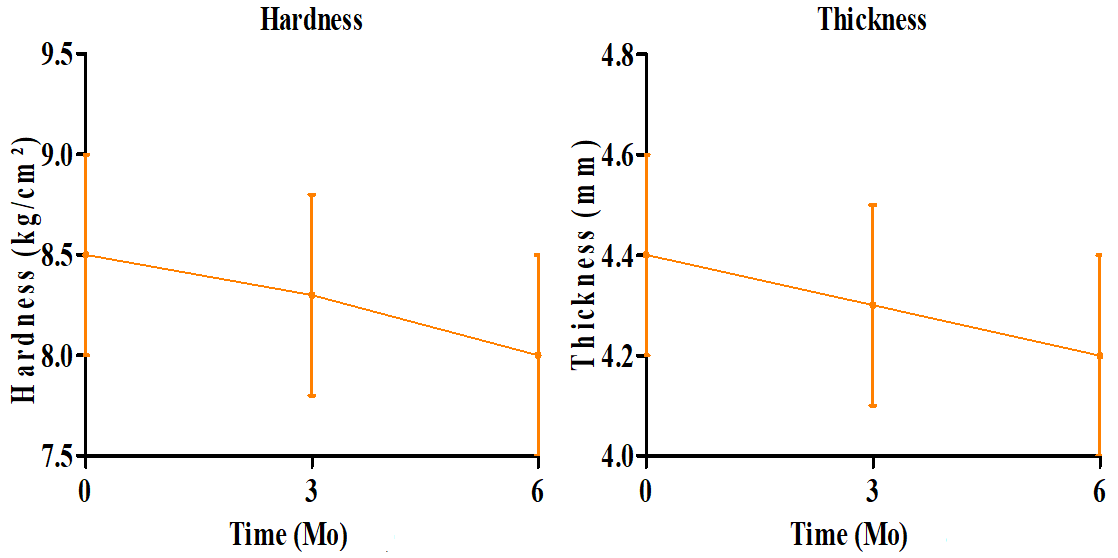
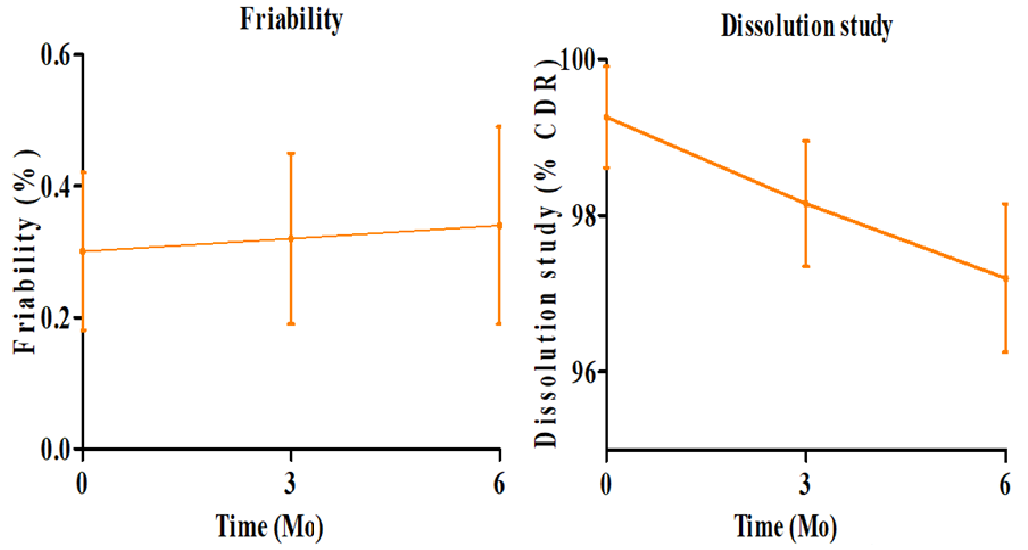
Fig. 7: Stability study-parameter trends over 6 mo (Mean±SD)
Pharmacokinetic profiling
The pharmacokinetic characteristics were assessed and results are summarized in table 7 and fig. 8. The optimized SR formulation exhibited a significantly lower Cmax (94.62±4.3 ng/ml) compared to the marketed reference tablet (127.51±6.1 ng/ml, p<0.01), along with a significantly prolonged Tmax (5.84±1.28 h vs. 1.99±0.34 h, p<0.001), indicating a controlled and sustained drug release profile. Also, AUC0–t for the SR tablets (2176.39±48.13 ng h/ml), was significantly higher than that of the marketed reference (1987.96±37.24 ng h/ml, p<0.05), suggesting improved systemic exposure. Likewise, the AUC₀–∞ of the SR formulation (2598.81±73.42 ng h/ml) was significantly greater than that of the marketed reference (2263.35±56.62 ng h/ml, p<0.05), confirming enhanced oral bioavailability.
The optimized formulation also demonstrated a prolonged elimination half-life (t₁/₂) of 7.64±0.17 h compared to 5.93±0.28 h for the marketed reference (p<0.05). This moderate but statistically significant extension of half-life indicates sustained systemic retention of the drug, consistent with the intended controlled-release mechanism. Since pharmacokinetic sampling over ≥3 half-lives is generally sufficient to characterize the elimination phase, the 24 h window (≈3.1 half-lives) provided adequate coverage for reliable estimation of t₁/₂, AUC, and clearance. Moreover, plasma concentrations at 24 h approached baseline levels, suggesting that the terminal elimination phase was appropriately captured so not extended to 48 h [37, 44].
Collectively, these pharmacokinetic findings highlight that the optimized SR-matrix tablets achieved superior in vivo performance compared with conventional formulations (p<0.05), thereby supporting their potential clinical utility for sustained glycemic control.
Table 7: Outcomes of pharmacokinetic parameters
| Parameter | Marketed reference | Optimized SR matrix tablets |
| Cmax (ng/ml) | 127.51±6.1 | 94.62±4.3 |
| Tmax (h) | 1.99±0.34 | 5.84 ± 1.28 |
| AUC0–t (ng h/ml) | 1987.96±37.24 | 2176.39 ± 48.13 |
| AUC0–∞ (ng h/ml) | 2263.35±56.62 | 2598.81±73.42 |
| t1/2 (h) | 1.93±0.28 | 7.64±0.17 |
*value are expressed as mean±SD (n = 6); Cmax: maximum plasma concentration; Tmax: time to reach Cmax; AUC0–t: area under the curve from time 0 to last measurable concentration; AUC0–∞: area under the curve from time 0 extrapolated to infinity; t1/2: elimination half-life.
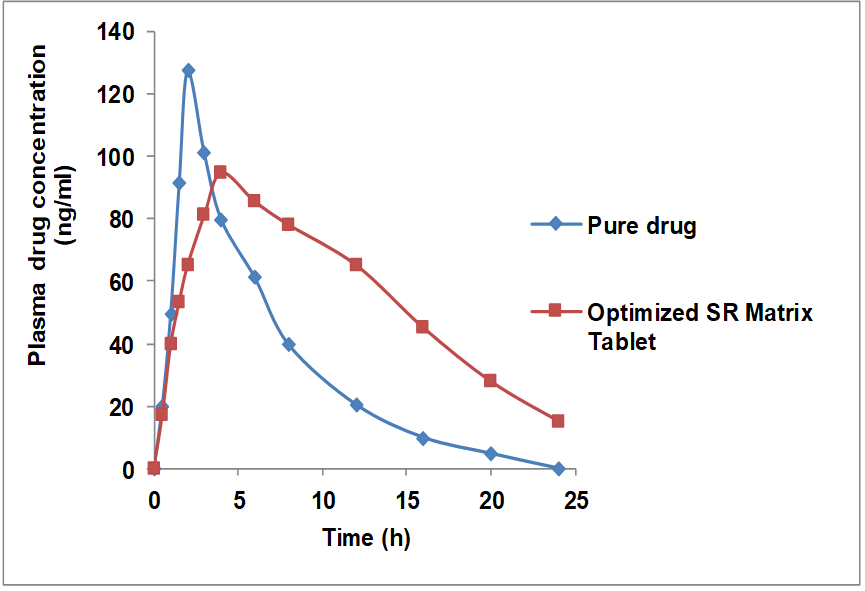
Fig. 8: Plasma drug concentration and time profile
CONCLUSION
The study successfully demonstrated the application of QbD principles in designing and optimizing SR-matrix tablets of RE. The combination of Eudragit L100 and MCC provided tablets with desirable mechanical properties and reproducible sustained-release behavior. The optimized batch (F5) achieved nearly complete drug release within 10 h, exhibited an anomalous diffusion mechanism, and maintained physicochemical stability over 6 mo of accelerated storage. Pharmacokinetic profiling confirmed prolonged systemic exposure and improved bioavailability, highlighting the potential of this formulation for enhancing therapeutic efficacy and patient adherence in type 2 diabetes management. Future work should focus on long-term stability, swelling/erosion behavior, and advanced characterization to establish robustness and clinical reliability, thereby facilitating large-scale development and therapeutic translation.
ACKNOWLEDGEMENT
We are thankful to the institute for providing all facilities required during conducting this experiment.
ABBREVIATIONS
RE: Remogliflozin etabonate; SR: sustained release; MCC: microcrystalline cellulose; TEA: Triethylamine; CMC: carboxymethylcellulose; GI: gastrointestinal; QbD: quality by design; DoE: design of experiment; ANOVA: analysis of variance; PK: pharmacokinetic; ICH: international conference on harmonization; USFDA: US food and drug administration; HPLC: high performance liquid chromatographic; LLOQ: lower limit of quantification; Rt: retention times.
AUTHORS CONTRIBUTIONS
M. A. Khan and S. B. Somwanshi designed and optimized the experiments and prepared the initial draft of the manuscript. K. T. Vaditake assisted in data interpretation and validation protocols. K. B. Kotade contributed to the pharmacokinetic study and statistical analysis. All authors reviewed and approved the final version of the manuscript.
CONFLICT OF INTERESTS
The authors declare that there is no conflict of interest
REFERENCES
Sune PR, Jumde KS, Hatwar PR, Bakal RL, Korde AV. Advances in oral controlled release drug delivery systems. GSC Biol Pharm Sci. 2024;29(3):286-97. doi: 10.30574/gscbps.2024.29.3.0475.
Bhutani U, Basu T, Majumdar S. Oral drug delivery: conventional to long-acting new-age designs. Eur J Pharm Biopharm. 2021;162:23-42. doi: 10.1016/j.ejpb.2021.02.008, PMID 33631319.
Park K. Controlled drug delivery systems: past, forward and future back. J Control Release. 2014 Sep 28;190:3-8. doi: 10.1016/j.jconrel.2014.03.054, PMID 24794901.
Ghosh TK, Jasti BR. Theory and practice of contemporary pharmaceutics. In: Akala EO, editor. Oral controlled release solid dosage forms. CRC PRESS; 2005. p. 333-65.
Purohita HS, Zhoub D, Yua M, Zaroudic M, Oberoia H, Angelica De L. Proof-of-concept in developing a 45% drug loaded amorphous nanoparticle formulation. J Pharm Sci. 2024;113(4):1007-19. doi: 10.1016/j.xphs.2023.10.012.
Adepu S, Ramakrishna S. Controlled drug delivery systems: current status and future directions. Molecules. 2021 Sep 29;26(19):5905. doi: 10.3390/molecules26195905, PMID 34641447.
Prajapat P, Agrawal D, Bhaduka G. A brief overview of sustained released drug delivery system. J Appl Pharm Res. 2022;10(3):5-11. doi: 10.18231/j.joapr.2022.10.3.5.11.
Loke YH, Jayakrishnan A, Mod Razif MRF, Yee KM, Kee PE, Goh BH, Helal Uddin ABM, Lakshminarayanan V, Liew KB. A comprehensive review of challenges in oral drug delivery systems and recent advancements in innovative design strategies. Current Pharmaceutical Design. 2025;31(5):360-76. doi: 10.2174/0113816128338560240923073357.
Aulton ME, Taylor KM. Aultons pharmaceutics: the design and manufacture of medicines. In: McConnell EL, Madla CM, Basit AW, editors. Modified-release oral drug delivery. 6th ed. Elsevier; 2021. p. 542-57.
Goyal S, Agarwal G, Agarwal S, Karar PK. Oral sustained release tablets: an overview with a special emphasis on matrix tablet. Am J Adv Drug Deliv. 2017;5(2):64-76. doi: 10.21767/2321-547X.1000013.
Kanojia N, Singh S, Sharma N. Development of sustained release Eudragit-based matrix tablet of fluvastatin sodium microspheres. Indian J Pharm Sci. 2021;83(6):1229-42. doi: 10.36468/pharmaceutical-sciences.878.
Shetty P, Kumar R, Yamunappa SP, Suvarna P, Swamy VN. Design and evaluation of sustained release matrix tablets of etodolac. Asian Jour Pharmac Rese. 2016;6(1):1. doi: 10.5958/2231-5713.2016.00001.5.
Mohan V, Mithal A, Joshi SR, Aravind SR, Chowdhury S. Remogliflozin etabonate in the treatment of type 2 diabetes: design, development and place in therapy. Drug Des Dev Ther. 2020 Jun 24;14:2487-501. doi: 10.2147/DDDT.S221093, PMID 32612352.
Mohan V, Mithal A, Joshi SR, Aravind SR, Chowdhury S. Remogliflozin etabonate in the treatment of type 2 diabetes: design development and place in therapy. Drug Des Devel Ther. 2020;14:2487-501. doi: 10.2147/DDDT.S221093, PMID 32612352.
Grangeia HB, Silva C, Simoes SP, Reis MS. Quality by design in pharmaceutical manufacturing: a systematic review of current status challenges and future perspectives. Eur J Pharm Biopharm. 2019;147:19-37. doi: 10.1016/j.ejpb.2019.12.007, PMID 31862299.
Parshuramkar P, Khobragade D, Kashyap P. Comprehension of quality by design in the development of oral solid dosage forms. J Young Pharm. 2023;15(3):406-18. doi: 10.5530/jyp.2023.15.56.
Simao J, Chaudhary SA, Ribeiro AJ. Implementation of quality by design (QbD) for development of bilayer tablets. Eur J Pharm Sci. 2023;184:106412. doi: 10.1016/j.ejps.2023.106412, PMID 36828037.
Dinde M, Galgatte U, Shaikh F. Development and evaluation of cinnarizine-loaded nanosponges: pharmacodynamic and pharmacokinetic study on Wistar rats. Int J Pharm Sci Rev Res. 2020 Dec 15;65(2):96-105. doi: 10.47583/ijpsrr.2020.v65i02.015.
Amsa P, Mathan GK, Magibalan S, Velliyangiri EK, Kalaivani T, Priya S. Formulation and evaluation of gabapentin sustained release matrix tablet using Hibiscus rosa sinensis leaves mucilage as release retardant. J Pharm Res Int. 2021 Dec 16;33(58B):564-72. doi: 10.9734/JPRI/2021/v33i58B34238.
Kumari S, Puri A, Dev D, Prasad DN, Monika. Formulation and evaluation of sustained release matrix tablet of metoprolol succinate by using xanthan gum and carbopol. J Drug Deliv Ther. 2019;9(3-s):309-16. doi: 10.22270/jddt.v9i3-s.2844.
Nikam BA, Gayke AU. Formulation development and evaluation of an immediate-release tablet of paracetamol and orphenadrine citrate by direct compression method. J Sci Arts. 2022 Sep 30;22(3):735-54. doi: 10.46939/J.Sci.Arts-22.3-b04.
Patel P, Dave A, Vasava A, Patel P. Formulation and characterization of sustained release dosage form of a moisture-sensitive drug. Int J Pharm Investig. 2015;5(2):92-100. doi: 10.4103/2230-973x.153385, PMID 25838994.
Zhu Y, Yu J, Zhou G, Gu Z, Adu Frimpong M, Deng W. Piperine fast disintegrating tablets comprising sustained release matrix pellets with enhanced bioavailability: formulation in vitro and in vivo evaluation. Pharm Dev Technol. 2020 Feb 11;25(5):617-24. doi: 10.1080/10837450.2020.1725892, PMID 32009511.
Jha Sk, Devanna V, Parameshwar K, Reddy MR. Formulation development and evaluation of vildagliptin sustained release tablet. Int J Drug Deliv Technol. 2018;8(4):180-6. doi: 10.25258/ijddt.8.4.5.
Gunda RK. Design development and in vitro evaluation of sustained release tablet formulations of olmesartan medoxomil. MOJDDT. 2018 Jun 22;2(3):164-9. doi: 10.15406/mojddt.2018.02.00043.
Sandhan S, Sapra K, Mor J. Formulation and evaluation of sustained release matrix tablets of glipizide. Indian J Pharm Biol Res. 2013;1(4):89-94. doi: 10.30750/ijpbr.1.4.16.
Zhao Y, Xin T, Ye T, Yang X, Pan W. Solid dispersion in the development of a nimodipine delayed-release tablet formulation. Asian J Pharm Sci. 2014 Feb;9(1):35-41. doi: 10.1016/j.ajps.2013.11.006.
Ekenna IC, Abali SO. Comparison of the use of kinetic model plots and DD solver software to evaluate the drug release from griseofulvin tablets. J Drug Deliv Ther. 2022;12(2-S):5-13. doi: 10.22270/jddt.v12i2-S.5402.
Gupta SK, Patra S. Development, characterization and pharmacokinetic evaluation of optimized vildagliptin sustained release matrix tablet using box-behnken design. Int J Appl Pharm. 2024;16(1):214-33. doi: 10.22159/ijap.2024v16i1.48052.
Gupta SK, Patra S. Development, characterization and pharmacokinetic evaluation of optimized vildagliptin sustained release matrix tablet using box-behnken design. Int J App Pharm. 2024;16(1):214-33. doi: 10.22159/ijap.2024v16i1.48052.
Tamilselvi N, Kanagapriya K. Bioequivalence study and bioanalytical method development of remogliflozin etabonate tablets in Wistar rat plasma using RP-HPLC method. Res J Pharm Technol. 2024;17(2):789-94. doi: 10.52711/0974-360X.2024.00122.
Ashwin K, Reddy TR. In vivo evaluation of quinapril trilayered matrix tablets. Asian J Pharm Clin Res. 2021;14(7):117-25. doi: 10.22159/ajpcr.2021.v14i7.42002.
Inturi R, Raju MD, Basaveswara Rao MV, Inturi S. Pharmacokinetic investigation of remogliflozin in rat plasma samples by high-throughput HPLC-MS-MS. Int J Appl Pharm. 2022;14(6):178-85. doi: 10.22159/ijap.2022v14i6.45700.
Aveek Datta, Subhasis Maity, Miltu KR, Ghosh, Kuntal Hazra. Design characterisation and evaluation of sustained release formulation of remogliflozin etabonate. Asian J Pharm Res Dev. 2024;12(6):18-24. doi: 10.22270/ajprd.v12i6.1431.
Jivraj II, Martini LG, Thomson CM. An overview of the different excipients useful for the direct compression of tablets. Pharm Sci Technol Today. 2000 Feb;3(2):58-63. doi: 10.1016/S1461-5347(99)00237-0, PMID 10664574.
Ceballos A, Cirri M, Maestrelli F, Corti G, Mura P. Influence of formulation and process variables on in vitro release of theophylline from directly-compressed Eudragit matrix tablets. Farmaco. 2005;60(11-12):913-8. doi: 10.1016/j.farmac.2005.07.002, PMID 16129436.
Zhao H, Zhao L, Lin X, Shen L. An update on microcrystalline cellulose in direct compression: functionality critical material attributes and co-processed excipients. Carbohydr Polym. 2022 Feb 15;278:118968. doi: 10.1016/j.carbpol.2021.118968, PMID 34973783.
Shi C, Zhao H, Fang Y, Shen L, Zhao L. Lactose in tablets: functionality critical material attributes, applications modifications and co-processed excipients. Drug Discov Today. 2023;28(9):103696. doi: 10.1016/j.drudis.2023.103696, PMID 37419210.
Lara Garcia RA, Afonso Urich JA, Afonso Urich AI, Jeremic D, Khinast J. Application of lactose co-processed excipients as an alternative for bridging pharmaceutical unit operations: manufacturing an omeprazole tablet prototype via direct compression. Sci Pharm. 2025;93(2):24. doi: 10.3390/scipharm93020024.
Ram D, Pankhaniya H. Formulation evaluation and optimization of sustained-release drug delivery system of cisapride tablet. Int J Pharm Pharm Sci. 2021;13(9):56-62. doi: 10.22159/ijpps.2021v13i9.41799.
Zhang Y, Law Y, Chakrabarti S. Physical properties and compact analysis of commonly used direct compression binders. AAPS PharmSciTech. 2003 Dec 15;4(4):E62. doi: 10.1208/pt040462, PMID 15198557.
Ohwoavworhua FO, Adelakun TA. Some physical characteristics of microcrystalline cellulose obtained from raw cotton of cochlospermum planchonii. Trop J Pharm Res. 2007;4(2):501-7. doi: 10.4314/tjpr.v4i2.14626.
Alam S, Bishal A, Bandyopadhyay B. Formulation and evaluation of metformin hydrochloride sustained release matrix tablets. Int J Curr Pharm Res. 2021;13(5):82-8. doi: 10.22159/ijcpr.2021v13i5.1899.
Kapur A, O Connor Semmes R, Hussey EK, Dobbins RL, Tao W, Hompesch M. First human dose escalation study with remogliflozin etabonate a selective inhibitor of the sodium glucose transporter 2 (SGLT2), in healthy subjects and in subjects with type 2 diabetes mellitus. BMC Pharmacol Toxicol. 2013 May 13;14:26. doi: 10.1186/2050-6511-14-26, PMID 23668634.