
Int J App Pharm, Vol 18, Issue 1, 2026, 526-541Original Article
D-OPTIMAL MIXTURE DESIGN ASSISTED FORMULATION OPTIMIZATION OF DESONIDE-LOADED EMULGEL FOR TOPICAL APPLICATION
KIRAN KAITHWAR, PRAKASH K. SONI*, REENA SONI, SURESH K. PASWAN
Nanotechnology Research Lab, Department of Pharmacy, Shri G. S. Institute of Technology and Science, 23-Park Road, Indore-452003, (M. P.), India
*Corresponding author: Prakash K. Soni; *Email: soniprakashpharma@gmail.com
Received: 12 Aug 2025, Revised and Accepted: 29 Oct 2025
ABSTRACT
Objective: This research specifically targets the development of a microemulsion formulation with critical quality attributes, i. e., optimal particle size distribution, drug content, and controlled release characteristics. The aim is to enhance the topical delivery of desonide.
Methods: Oil selection was carried out using the phase titration method for determining the appropriate Smix ratio, followed by the construction of ternary phase diagrams. A D-optimal mixture design was employed, considering oil, Smix, and water as independent variables, while particle size, polydispersity index (PDI), zeta potential, % transmittance, and cumulative % drug release (CDR %) as response variables.
Results: The optimized microemulsion was clear and transparent with a PS 18 nm, PDI 0.42, zeta potential 13.00mV, and transmittance of 92.25%. This microemulsion was incorporated into a 2% Carbopol 971P gel base. The resulting gel was clear, pH 6.02, with a spreadability of 23.379 g. cm/sec, CDR (%) of 94.03% in 24 h. followed Higuchi drug release kinetics. Ex vivo drug permeation through porcine skin was 27.83 % in 10 h., showing enhanced permeation when compared with the marketed product.
Conclusion: The developed gel possessed all desired quality attributes. The data obtained from in vitro and ex vivo studies validated its efficacy as an improved option over conventional products for the treatment of skin diseases.
Keywords: Desonide, Microemulsion, Phase diagram, D-optimal mixture design, Topical gel
© 2026 The Authors. Published by Innovare Academic Sciences Pvt Ltd. This is an open access article under the CC BY license (https://creativecommons.org/licenses/by/4.0/)
DOI: https://dx.doi.org/10.22159/ijap.2026v18i1.56510 Journal homepage: https://innovareacademics.in/journals/index.php/ijap
INTRODUCTION
Skin conditions affect millions of individuals globally, accounting for a large proportion of the global total of disease [1]. Atopic dermatitis, eczema, is a widespread chronic inflammatory skin disorder affecting children and adolescents [2, 3], with 20% of cases affecting this age group. Symptoms often emerge in infancy, with 70% of cases manifesting before the age of 5 [4]. Atopic dermatitis is often the initial stage of the "allergic march," a sequential progression of allergic conditions. Psoriasis is an inflammatory immune-mediated illness affecting the skin and joints, with autoimmune pathologic characteristics [5]. Acne is an enduring disorder affecting oil glands and hair sacs, with emerging evidence indicating that acne development involves an interplay of genetic predisposition [6], environmental factors, and saprophytic g-positive bacteria. Vitiligo is a prevalent skin syndrome characterized by the impairment of complexion, with non-scaly chalky-white patches on the skin [7].
The skin is the most commonly used route due to its accessibility and large surface area. These systems offer advantages like non-invasiveness, ease of use, and reduced systemic side effects compared to oral or injectable methods [8]. Gels are widely used due to their safety, effectiveness, and patient-friendly nature [9]. Topical products may include foams, sprays, powders, solutions, and medicated adhesives. An effective formulation must be stable, aesthetically acceptable, capable of drug release at the target site, and manufacturable at a commercial scale [10].
Topical corticosteroids are now essential for treating a variety of dermatoses [11]. Desonide is a topical corticosteroid used to minimize redness, swelling, and itching caused by skin conditions that respond to steroids. It is a synthetic non-fluorinated corticosteroid used to treat various skin conditions [12]. Desonide's pharmacodynamics include anti-inflammatory, anti-itching, and blood vessel constricting action [13].
Microemulsions, introduced by Hoar and Schulman in 1940, are clear mixtures containing oil, aqueous, and emulsifying agents for pharmaceutical administration [14]. They enhance absorption and therapeutic efficiency, and have long-term physical stability [15]. Microemulsions are classified into water-in-oil and oil-in-water types. In W/O emulsions, water droplets are dispersed in an oil continuous phase, while in O/W emulsions, oil droplets are dispersed in a water continuous phase. The continuous phase defines the emulsion type, with the other acting as the dispersed phase[16]. Microemulsions can be made using two main techniques [17, 18].
The mixture design method, a type of response surface methodology, is used to optimize variables based on their relative proportions within a mixture, where the total must equal 100 [19]. These delivery systems are promising for parenteral, topical, transdermal, ophthalmic and percutaneous medication administration [20]. Topical use of microemulsions is increasing due to their ability to improve drug penetration and stability [21-23].
The present research aims to develop a microemulsion-based topical gel of desonide using D-optimal approach in experimental design-assisted formulation optimization with an objective to increase skin retention, sustained drug release, enhanced drug permeation and effective topical drug delivery.
MATERIALS AND METHODS
Materials
Desonide was obtained as a gift sample from Farambios. Peppermint oil was purchased from local market, Tween 80 was purchased from Merck Life Science Pvt Ltd., India. Cremophor RH 40 was received from BASF (India) and Carbopol 971P from Lubrizol (India). Marketed desonide gel (0.05% w/w) was obtained from a local pharmacy. All others chemicals used in the study were of standard grade.
Methods
Formulation and designing of desonide-based microemulsion
Selection of oil
The approximate solubility technique was used to determine desonide solubility in a variety of oils. This method involved weighing 1 ml of each oil medium in a vial, adding a fraction of accurately measured desonide, and using a vortex mixer to agitate and mix the mixture until it became transparent. The medication was fully dissolved at that point; a tiny quantity was added once more until the drug stayed partly undissolved, and the solution reached saturation. The solubility of desonide was determined by reweighing the remaining drug [24]. The solubility of desonide in different oils is reported in .
Table 1: Different oils and their solubility in desonide
| S. No. | Oil | Approximate solubility (mg/ml) |
| 1 | Peppermint oil | 35 |
| 2 | Capmul MCM C8 | 23.5 |
| 3 | Capmul MCM | 19 |
| 4 | Capmul MCM C10 | 19 |
| 5 | Tea Tree Oil | 11 |
| 6 | Lavender Oil | 10 |
| 7 | Oleic Acid | 10 |
| 8 | Eucalyptus oil | 6 |
| 9 | Lemon Grass Oil | 4 |
| 10 | Ethyl oleate | 4 |
| 11 | Neem Oil | 3 |
| 12 | Tulsi oil | 3 |
| 13 | Jasmine oil | 3 |
| 14 | Sesame oil | 3 |
| 15 | Peanut oil | 3 |
| 16 | Mustard oil | 2.5 |
| 17 | Isopropyl myristate | 2.5 |
| 18 | Almond oil | 2 |
| 19 | Rosmery oil | 1.5 |
| 20 | Flax seed oil | 1 |
| 21 | Olive oil | 1 |
Selection of surfactants
Numerous types of surfactants were investigated for the development of desonide microemulsion, Surfactant was selected based on their oil accommodation capability. Using a micropipette, a 10% solution for various surfactants was made in DM water and the selected oil was gradually added. First, 10 µl of oil was added, and it was vortexed for 10-15 min. This was done until the solution became milky [24]. The solubility of desonide in different surfactants was reported in .
Table 2: Oil accommodation capacity of different surfactant
| S. No. | Surfactants | 10 % aq. solution of surfactant (ml) | Oil accommodation capacity (µl) |
| 1 | Polysorbate 20 | 1 | 20 |
| 2 | Tween 80 | 1 | 20 |
| 3 | Brij 35 | 1 | 10 |
| 4 | Poloxamer 188 | 1 | 10 |
| 5 | Poloxamer 407 | 1 | 10 |
| 6 | Cremophor RH 40 | 1 | 50 |
| 7 | Labrasol | 1 | 10 |
| 8 | PEG 200 | 1 | 10 |
| 9 | PEG 300 | 1 | 10 |
| 10. | PEG 600 | 1 | 10 |
| 11 | Transcutol P | 1 | 10 |
Selection of cosurfactants
The choice of co-surfactant is so important. Co-surfactant is included in the formulation when surfactant alone is unable to reduce interfacial tension or attain the dose of the drug required to form a stable emulsion. Using a micropipette, oil was gradually added to an aqueous solution of various co-surfactants and the selected surfactant that had been created in a 1:1 ratio. After adding 10 µl of oil, the mixture was vortexed for 10 to 15 min. This process was applied to the mixture until it became milky [24]. Oil accommodation capacity in different surfactant-cosurfactant combinations was reported in table 3.
Table 3: Oil accommodation capacity of different surfactant-cosurfactant (Smix) ratio
| S. No. | Surfactant and co-surfactant mixture 1:1 | 10 % aq. solution of (Smix) (ml) | Oil accommodation capacity (µl) |
| 1. | Cremophor RH 40: Tween 80 | 1 | 40 |
| 2. | Cremophor RH-40: Tween 20 | 1 | 30 |
| 3. | Cremophor RH-40: Butanol | 1 | 10 |
| 4. | Cremophor RH-40: Transcutol P | 1 | 10 |
| 5. | Cremophor RH-40: Iso propyl alcohol | 1 | 10 |
| 6. | Cremophor RH-40: Brij 35 | 1 | 10 |
| 7. | Cremophor RH-40: PEG 200 | 1 | 30 |
| 8. | Cremophor RH-40: PEG 300 | 1 | 30 |
| 9. | Cremophor RH-40: PEG 600 | 1 | 20 |
| 10. | Cremophor RH-40: Poloxamer 188 | 1 | 10 |
| 11. | Cremophor RH-40:PG | 1 | 10 |
Construction of pseudo ternary phase diagram for the formulation of desonide microemulsion
The water titration technique was applied to deciding the concentration range of formulation components in the microemulsion region for constructing a pseudo-ternary phase diagram [25]. Purified water was used as the aqueous phase, surfactant and cosurfactant based on the drug's solubility and the compatibility between the surfactant, cosurfactant. The pseudo-ternary phase diagram was developed by testing several different Smix ratios (e. g., 1:1, 1:2, 1:3, 2:1, and 3:1) [26] shown in fig. 1. These ratios were mixed with peppermint oil using a vortex at the following proportions:.0.9:0.1, 0.8:0.2, 0.7:0.3, 0.6:0.4, 0.5:0.5, 0.4:0.6, 0.3:0.7, 0.2:0.8, 0.1:0.9 [27]. Water was gradually introduced to the oil-Smix combination using a micropipette until the mixture became turbid or milky in appearance. These observations were carefully recorded and entered into Origin 2019b software to generate the phase diagram, which enabled the identification of the region is shown in table 4.
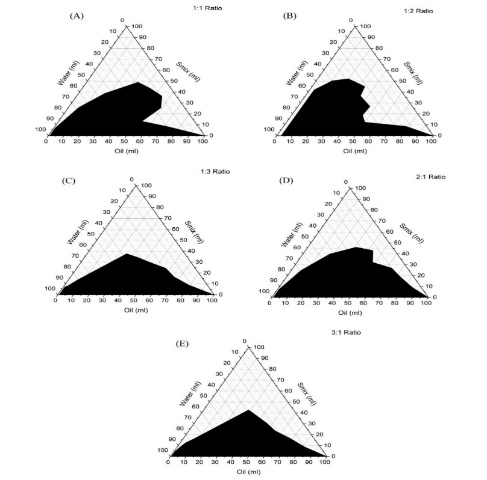
Fig. 1: Microemulsion phase diagrams using different Smix ratio, i. e., (A)1:1, (B)1:2, (C)1:3, (D)2:1, (E)3:1
Table 4: Zone of microemulsion region in pseudo-ternary phase diagram
| S. No. | Oil to smix ratio | Zone of microemulsion region (%) |
| 1 | 1:1 | 52.99% |
| 2 | 1:2 | 57.95 % |
| 3 | 1:3 | 60 % |
| 4 | 2:1 | 61.66 % |
| 5 | 3:1 | 46.03 % |
Formulation optimization by D-optimal mixture design
Design expert 13 software was used for the experimental design in this study [28]. A different kind of response surface methodology is called a mixture design. In such mixtures, the composition of individual components varies, and the outcomes or responses are influenced by the proportion of each ingredient present. Polynomial models were constructed using a single block d-optimal mixture design with 5 replicate points [29]. Three different independent variables were administered at maximum and minimum levels: A (oil), B (Smix), and C (water). A, B, and C total remained at 100%[30]. This approach works well to select the ideal microemulsion composition and evaluate the effects of mixture composition modifications shown in . This design includes a 16-run model that helps to understand how the ingredients in the formulation affect key factors like the size of the particles, their uniformity (polydispersity index), the charge on the particles (zeta potential), how clear the microemulsion is (transmittance), and how much of the drug is released over time [19].
Table 5: Independent and response variables of D-optimal mixture design
| Independent variable | Unit | Limit | |
| Lower limit | Higher limit | ||
| Oil | ml | 5 | 15 |
| Smix | ml | 55 | 80 |
| Water | ml | 15 | 30 |
| Response variable | Unit | Desired constraints | |
| Particle size | Nm | Target | |
| Polydispersity index | - | Minimum | |
| Zeta potential | mV | Maximum | |
| Transmittance | % | Maximum | |
| Cumulative % drug release | % | Maximum | |
Statistical model fitting
The software suggested 16 optimization batches were prepared and evaluated for all 5 response variables (R1 to R5) shown in . The formulation of the microemulsion was carried out employing the phase titration method. The observations of response variables were fed into the software. Experiments were done three times, and data were expressed as mean value±SD. ANOVA was used to analyse the statistical data and p-value of less than 0.05 was significant [31, 32].
Table 6: Model fitting and ANOVA of measured response variable of software designed desonide microemulsion formulations
| Response variable | Model | Sequential p-value | Lack of fit p-value | Adjusted R2 value | Predicted R2 value | Remarks |
| Mean particle size (R1) | Linear | 0.4420 | 0.6592 | -0.0177 | -0.2778 | |
| Quadratic | 0.2325 | 0.7926 | 0.1214 | -0.4142 | Suggested | |
| Special Cubic | 0.6721 | 0.7162 | 0.0441 | -0.6377 | ||
| Polydispersity index (R2) | Linear | 0.8229 | 0.4043 | -0.1198 | -0.4547 | |
| Quadratic | 0.0365 | 0.8565 | 0.3556 | -0.1837 | Suggested | |
| Special Cubic | 0.5614 | 0.8123 | 0.3118 | -0.3634 | ||
| Zeta potential (R3) | Linear | 0.9090 | 0.1519 | -0.1370 | -0.6090 | |
| Quadratic | 0.0082 | 0.6592 | 0.5218 | 0.1309 | Suggested | |
| Special Cubic | 0.2338 | 0.7225 | 0.5501 | 0.1219 | ||
| Transmittance (R4) | Linear | <0.0001 | 0.0087 | 0.8370 | 0.7682 | |
| Quadratic | 0.0112 | 0.0437 | 0.9268 | 0.8760 | ||
| Special Cubic | 0.0489 | 0.0864 | 0.9484 | 0.9080 | ||
| Cubic | 0.0293 | 0.9966 | 0.9810 | 0.9699 | Suggested | |
| Cumulative % drug release at 24h (R5) | Linear | 0.5221 | 0.8803 | -0.0441 | -0.4060 | |
| Quadratic | 0.3619 | 0.9450 | 0.0002 | -0.9043 | Suggested | |
| Special Cubic | 0.6469 | 0.9143 | -0.0839 | -1.1747 |
Table 7: The D-optimal design based microemulsion formulations and their observed response
| S. No. | Formulation component | Response variable | ||||||
| Oil (ml) | Smix (ml) |
Water (ml) | Mean particle size (nm) | Zeta potential (mV) |
PDI | Transmittance % |
CDR % at 24 h ±SD |
|
| DS/ME/01 | 12.51 | 72.49 | 15 | 89 | -23 | 1.67 | 85.4 | 84.77±0.61 |
| DS/ME/02 | 5 | 65 | 30 | 18.5 | 12 | 0.03 | 87.43 | 79.77±0.39 |
| DS/ME/03 | 5 | 80 | 15 | 55.3 | -19 | 1.02 | 97.54 | 82.82±0.2 |
| DS/ME/04 | 15 | 55 | 30 | 88 | -27 | 0.82 | 81.21 | 76.91±0.28 |
| DS/ME/05 | 5 | 70.99 | 24.01 | 55.3 | 21 | 0.01 | 94.12 | 85.86±0.35 |
| DS/ME/06 | 10 | 60 | 30 | 233 | 10 | 1.06 | 88.54 | 83.44±0.16 |
| DS/ME/07 | 15 | 64.84 | 20.16 | 73.9 | 36 | 0.005 | 83.4 | 89.34±0.85 |
| DS/ME/08 | 5 | 75.74 | 19.26 | 74 | 26 | 0.19 | 95.44 | 89.07±0.42 |
| DS/ME/09 | 10 | 60 | 30 | 83 | 15 | 1.67 | 88.43 | 85.1±0.9 |
| DS/ME/10 | 5 | 65 | 30 | 24.12 | 25 | 0.02 | 89.53 | 96.57±0.3 |
| DS/ME/11 | 15 | 60.09 | 24.91 | 90 | 27 | 0.01 | 83.1 | 89.07±0.85 |
| DS/ME/12 | 9.19 | 71.19 | 19.62 | 94 | 19 | 1.06 | 88.63 | 79.22±1.02 |
| DS/ME/13 | 5 | 80 | 15 | 128 | -21 | 1.02 | 98.92 | 97.2±0.11 |
| DS/ME/14 | 12.51 | 72.49 | 15 | 153.2 | 29.3 | 0.26 | 84.92 | 98.59±0.2 |
| DS/ME/15 | 9.45 | 67.09 | 23.46 | 50 | 15 | 0.07 | 89.54 | 75.54±0.26 |
| DS/ME/16 | 15 | 55 | 30 | 93 | -29 | 0.07 | 81.3 | 87.71±1 |
Characterizations of microemulsion
Determination of particle size, polydispersity index and zeta potential
Particle size analyser (Nanotrac wave II) was used to evaluated the particle size, PDI and zeta potential of optimization batches of the microemulsion. 1 ml of microemulsion formulation was diluted with 1 ml of distilled water (1:1). After gentle shaking, around 2 ml of the formed microemulsion was transferred into the sample cell to determine the particle size.
Determination of % transmittance
The % transmittance value that is closer to 100 indicates that the microemulsion formulation is transparent and clear. A UV-visible spectrophotometer was used to determine the % transmittance at a specific wavelength of 650 nm.
DSC study
DSC is a thermo-analytical method used to evaluate the purity of a sample and its compatibility with other components. This method was also utilized to investigate any significant differences in the thermal characteristics of both the drug and its excipients [33]. The analysis of the desonide drug sample and its physical mixture with Carbopol 971 was performed using a DSC. (Perkin Elmer 6000, Waltham, MA, USA)
Transmission electron microscope (TEM) analysis
To prepare a grid for transmission electron microscopy (TEM) analysis, start by handling the grid carefully to avoid any contamination or physical damage [34]. If the sample is too concentrated, it can dilute it with distilled water to reach a better concentration. Then, using a pipette, place a small droplet (around 2–5 μl) of the sample onto the surface of the grid. Let it sit for 1–2 min so that the particles or cells have time to stick to the grid. After this short adsorption time, carefully remove any extra liquid by touching the edge of the grid with filter paper. This helps prevent the formation of a thick layer that could interfere with imaging. If needed, you can add a drop of negative stain to improve contrast, and then allow it to dry. After staining, let the grid air dry completely, either by leaving it at room temperature or by gently blowing air over it. Once the grid is dry, inspect it to make sure the sample is evenly spread and looks good for imaging. If everything looks fine, place the grid in a holder or a sealed container to protect it from dust and contamination. The grid is now ready for TEM under the best conditions for high-quality imaging.
In vitro drug release study
The release properties of the developed microemulsions were characterized using a membrane diffusion system. A specially processed cellulose membrane (Himedia) with selective permeability (12-14 kDa) [35] was prepared through multiple purification stages. Initially, it was rinsed with running water for 3-4 h to remove any glycerin, then treated with a 0.3% sodium sulfite solution at 80 °C for 1 min to eliminate sulfur compounds. After this, the membrane was first washed with hot water at 60 °C for 2 min, then treated with 0.2% sulfuric acid. This was followed by a second rinse with hot water to ensure removal of any acid residues. Subsequently, the membrane was stored in saline PBS (pH 7.4) [36] containing SLS For the release experiments, precisely measured 1 ml samples of each formulation were loaded into the dialysis system containing 250 ml of release medium PBS with SLS. The apparatus was maintained at physiological conditions 37 ± 0.5 °C with continuous gentle mixing at intervals from 30 min to 24 h [37]. 5 ml samples were collected for analysis and replaced with fresh media [38] to maintain consistent conditions shown in . Drug concentration was determined through a UV-Visible spectrophotometer.
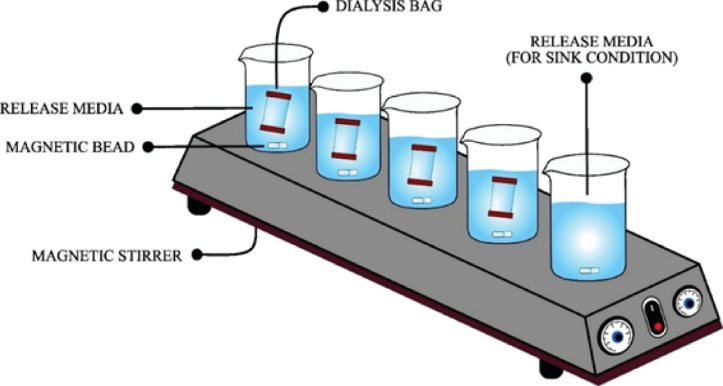
Fig. 2: Schematic presentation of in vitro drug release study of desonide based microemulsion by dialysis bag method
Preparation of optimized desonide based microemulsion
The software identified an optimized composition for the desonide-based microemulsion with the highest desirability value. This formulation comprised % of oil, Smix, and water. Based on this prediction, the optimized formulation was prepared and subsequently evaluated for all response variables. To validate the optimization process, the experimentally obtained response data were compared with the software-predicted values.
Development of a topical gel formulation of desonide
For enhanced topical utility, the optimized microemulsion was incorporated into a gel formulation. Gelling agents are employed to enhance the viscosity of microemulsion systems, thereby improving their adherence to the skin and prolonging their residence time. In the formulation of the gel base, several polymers were utilized including Carbopol 934, Carbopol 940, Carbopol 971P at concentrations of 2, 2.5 and 3% as well as xanthan gum 1% and polycarbophil 2%. These polymers were hydrated in water for a period of 12 h to ensure full swelling. A microemulsion-based gel was prepared by combining the optimized desonide microemulsion with the gel base [39].
Evaluations of the developed microemulsion-based gel formulation of desonide
Physical appearance
The physical appearance of the desonide microemulsion gel was visually assessed under bright light to assess its consistency, clarity, and overall uniform distribution.
pH determination
The pH of the desonide microemulsion gel was calculated using a digital pH meter [40] (CyberScan 510) as illustrated in . This was achieved by preparing a 1% aqueous solution of the gel for topical application. A pH close to the normal skin pH is essential to ensure compatibility and minimize irritation.

Fig. 3: Schematic presentation of a pH meter
Determination of spreadability
In the assessment of topical formulations, spreadability is a key attribute that indicates the uniform distribution and consistency of the product [41]. A texture analyzer (TA-XT plus), illustrated in was utilized to determine the spreadability of the desonide microemulsion gel. This parameter defines the extent to which the gel can be evenly spread when applied to the skin or the target area [42]. Spreadability plays a vital role in ensuring smooth application and adequate coverage, making it an important consideration in the evaluation of topical gel formulations.
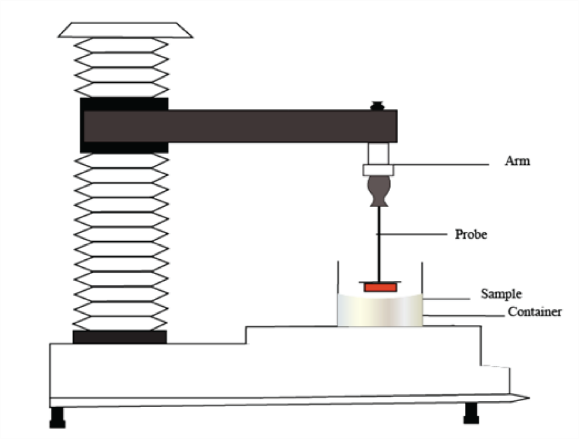
Fig. 4: Schematic presentation of texture analyzer
In vitro drug release and kinetic model
In vitro drug release characteristics of the developed microemulsion gel and commercial product were estimated using a dialysis membrane technique. In saline PBS (pH 7.4) containing sodium lauryl sulfate (SLS) as described earlier. The in vitro release profile of desonide from the microemulsion formulation was systematically analyzed using five distinct kinetic models to elucidate the mechanism and pattern of drug release. These models included Zero-order, First-order, Higuchi, Hixson-Crowell, and Korsmeyer-Peppas equations, each offering a different theoretical approach to interpreting drug release behavior from pharmaceutical dosage forms [43, 44]. Different kinetic models were assessed by their R² values, and the model with the best correlation was selected to describe the drug release kinetics [45].
Ex vivo drug permeation study of a developed microemulsion-based gel formulation of desonide
To evaluate drug penetration, an ex vivo study was performed using Franz diffusion cells with pig ear skin [46]. The skin samples, collected from a nearby slaughterhouse, were cleaned with cold tap water and gently shaved to eliminate hair. After sizing to fit the diffusion cells, the skin pieces were carefully positioned with the outer layer (stratum corneum) facing the chamber and the inner layer (dermis) in contact with the receiving solution. The receptor compartment was filled with saline PBS (pH 7.4) containing a SLS [39] (illustrated in ) and maintained at physiological conditions (37±0.5 °C). Equal amounts (1 g each) of microemulsion gel and commercial desonide gel were applied to separate donor chambers. At scheduled intervals (from 30 min to 24 h), 5 ml samples were collected from the receiver solution and promptly replaced with fresh medium to maintain consistent conditions. The amount of drug that permeated through the skin was measured by analyzing the samples at 247 nm using a UV spectrophotometer. A similar permeation study of a marketed product was also done for comparison purposes. The following formula was used to obtain the apparent skin permeability coefficient of the marketed formulation and the microemulsion gel formulation [47].


In this equation, dQ/dt shows how fast the drug moves into the receptor side over time (ug/h), the initial concentration of drug in the donor side in C0 (ug/cm2), and A is the area where the drug passes through, which is 2. 35 cm2.
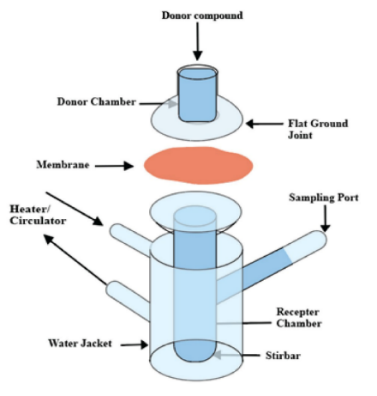
Fig. 5: Diagrammatic representation of Franz diffusion cell
RESULTS AND DISCUSSION
Selection of microemulsion components
The solubility of desonide in various oils was assessed, with the results show in . Among the tested oils, peppermint oil exhibited the highest solubility for desonide (35 mg/ml) and was therefore selected as the oil phase for the development of the microemulsion system.
The oil solubilization capacity of different surfactants, evaluated as 10% aqueous solutions, is presented in . For the formulation of oil-in-water (O/W) microemulsions, surfactants with hydrophilic-lipophilic balance (HLB) values exceeding 10 are generally preferred. Among the evaluated surfactants, Cremophor RH 40 demonstrated superior emulsification ability and the highest capacity to solubilize peppermint oil, making it the surfactant of choice for further formulation work.
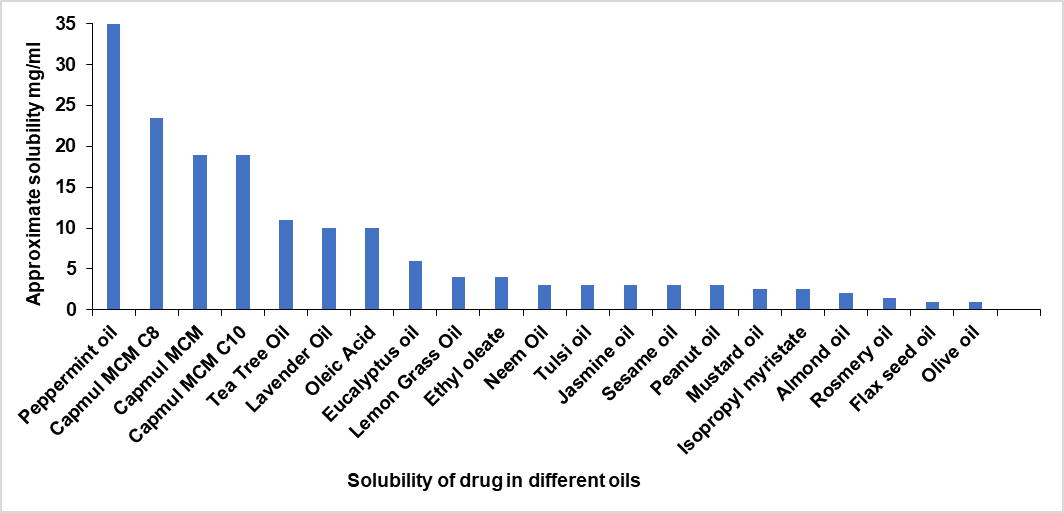
Fig. 6: Solubility of drug in 1 ml of different oil
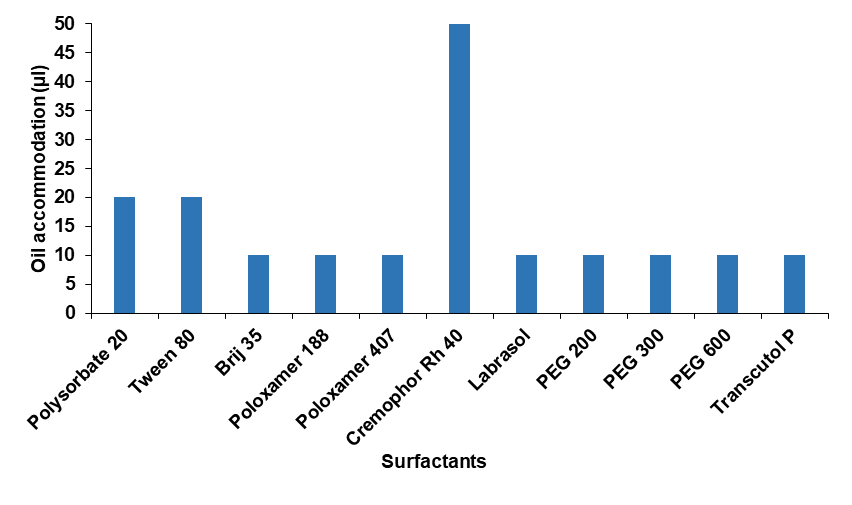
Fig. 7: Oil accommodation capacity of different surfactants (in 1 ml 10% w/v aqueous solution)
To identify an appropriate co-surfactant, various candidates were combined with Cremophor RH 40 in a 1:1 ratio and assessed for their oil accommodation capacity. As shown in , the combination of Cremophor RH 40 with Tween 80 exhibited the highest peppermint oil incorporation. Consequently, Tween 80 was selected as the co-surfactant for the optimized microemulsion formulation.
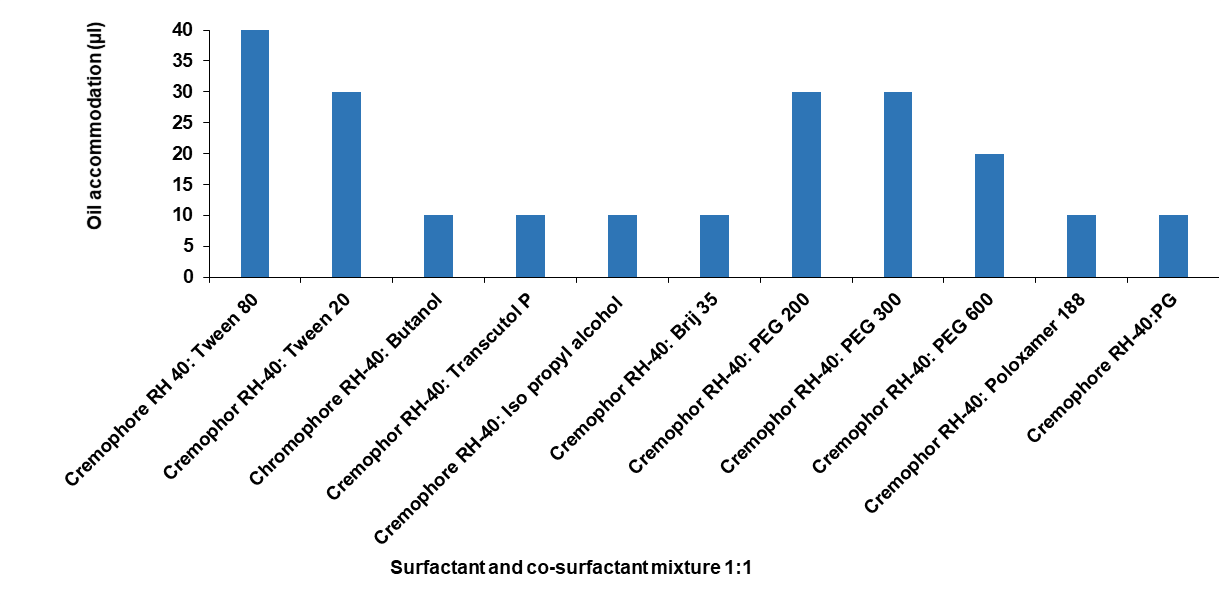
Fig. 8: Oil accommodation capacity of different Smix, 1:1 ratio (in 1 ml of 10% aqueous solution)
Selection of optimum Smix ratio by the pseudo-ternary phase diagram
To assess microemulsion formation, pseudo-ternary phase diagrams were developedusing peppermint oil, water, and Smix(a blend of Cremophor RH 40 and Tween 80) at different weight proportions, such as 1:1, 1:2, 1:3, 2:1, and 3:1. These diagram (), shows the dark (black) regions indicate turbid emulsions, while the clear (white) regions represent the microemulsion forming zones. Among the tested Smix ratios, the 2:1 (surfactant: co-surfactant) combination yielded the largest microemulsion region, occupying 61.66 % of the diagram area, as shown in . Based on this observation, the 2:1 Smix ratio was selected as the optimal composition for the development of the microemulsion system.
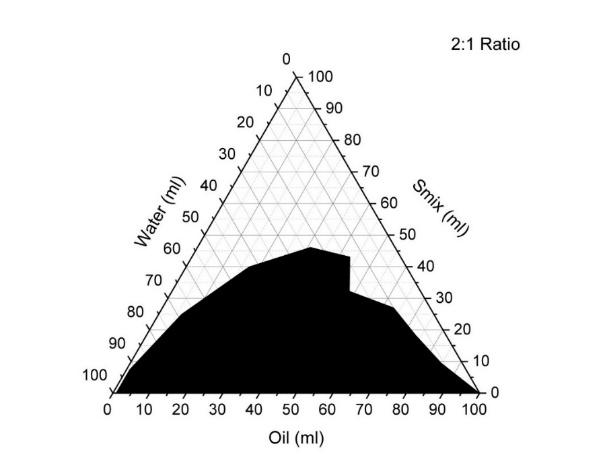
Fig. 9: Pseudo-ternary phase diagram of microemulsion using 2:1 Smix ratio
Optimization of desonide based microemulsion formulation
A total of 16 trial batches of desonide-based microemulsions were formulated using the D-optimal mixture design and prepared via the phase titration method, employing varying proportions of oil, Smix, and water. For formulation optimization, specific constraints were defined within the design software: a target range for particle size (R1), minimized polydispersity index (PDI) (R2), maximized zeta potential (R3), maximized % transmittance (R4), and maximum cumulative drug release as shown in . 3D response surface plots for each response variable illustrate the influence of the independent formulation variables and their interactions on the respective responses. Each response parameter for the desonide-based microemulsion was analyzed individually and is discussed in detail below.
Effect of the independent variables on mean particle size (R1)
The following quadratic model equation of Design Expert application used to represent the relationship between the mean particle size (R1).
R1=-747.999 A+93.687 B+123.3 C+1332.24 AB+1385.24 AC-308.445 BC
The particle size ranged from 18.5 to 233 nm across the batches (DS/ME/01-DS/ME/16) as shown in . Independent variables associated with positive coefficients contribute to an increase in the mean particle size, whereas those with negative coefficients exert a diminishing effect. The results of this study indicate that a lower oil content leads to the formation of smaller globule sizes [48]. Increasing the concentration of Smix ratio generally leads to decrease particle size. As the oil concentration rises, the particle size of the desonide microemulsion increases. A lower oil content favors the formation of smaller globules due to efficient surfactant coverage, lower viscosity, and reduced coalescence. As oil concentration increases, insufficient emulsification and internal phase crowding lead to larger globule sizes in the desonide microemulsion as shown in .
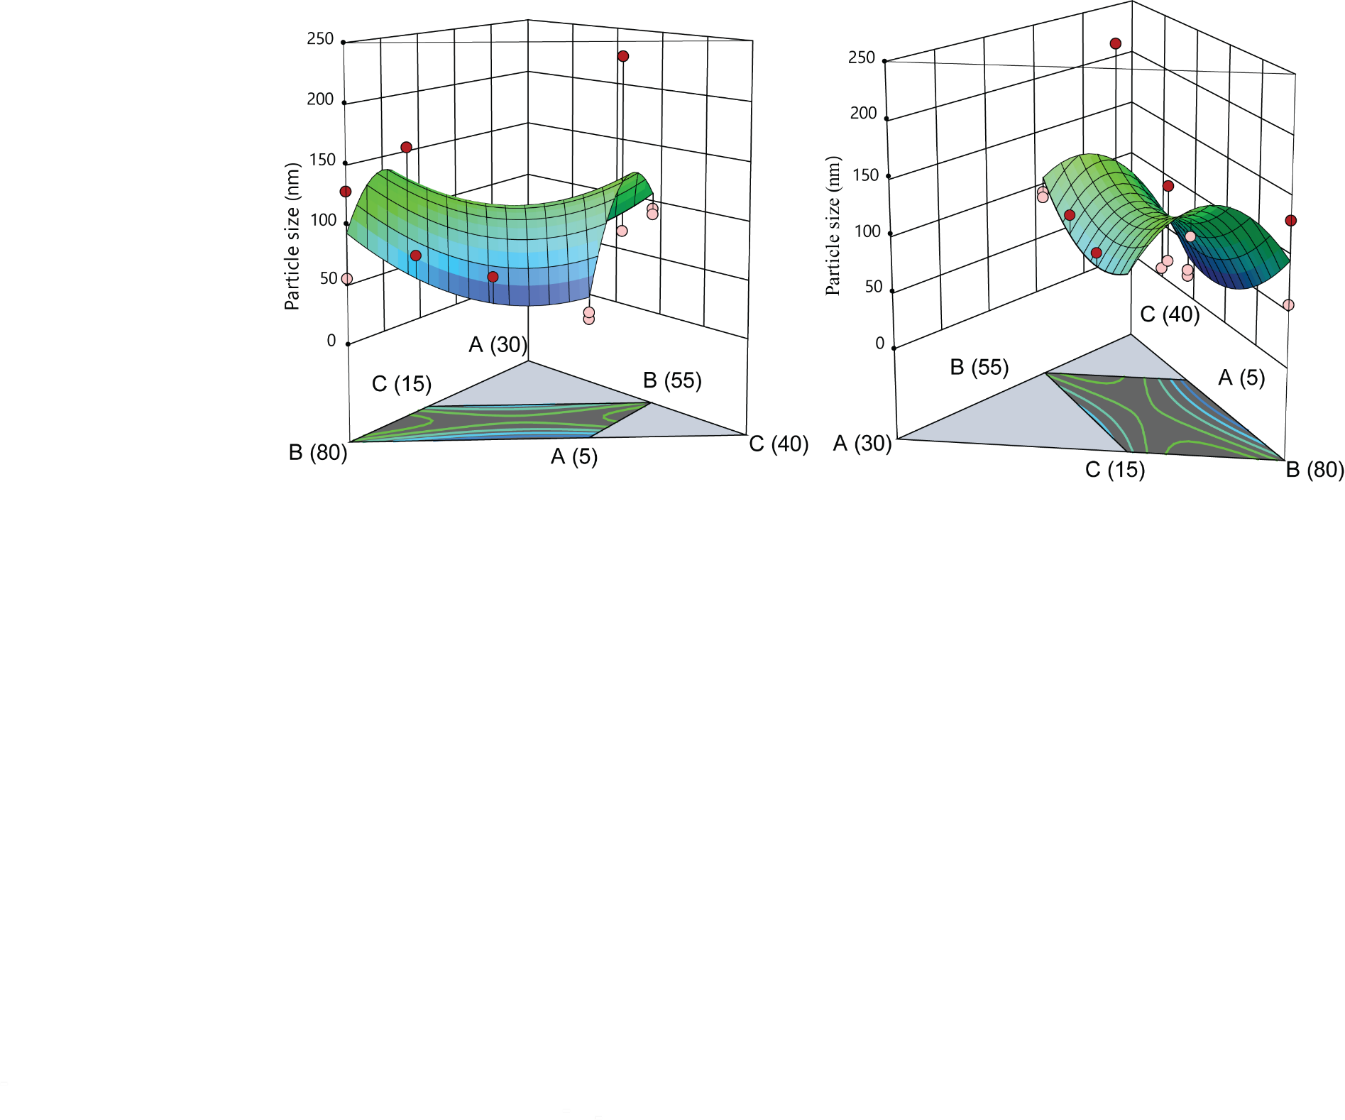
Fig. 10: 3D surface plots demonstrating the impact of oil (A), Smix(B), and water (C) on particle size of microemulsion
Effect of independent variable on polydispersity index (R2)
The design expert-13 application used to follow the quadratic model equation to represent the relationship between PDI and various degrees of independent variables.
R2 =-13.0088 A+0.975868 B+2.07576 C+19.8082 AB+18.9217 AC-6.39548 BC
The polydispersity index ranged from-29 to+36 across the batches (DS/ME/01-DS/ME/16) as shown in . Independent variables associated with positive coefficients contribute to an increase, whereas those with negative coefficients exert a diminishing effect. Increasing Smix ratio formulation leads to a decrease in PDI. While the oil content rises, the PDI of desonide microemulsion increases and increasing. Generally, more water content leads to higher PDI as shown in .
Effect of independent variable on zeta potential (R3)
The design expert-13 software used to follow a particular quadratic model equation to explain the relationship between the zeta potential (R3) and various degrees of independent variables.
R3= 43.21 A-20.8411 B-78.8848 C+38.3229 AB+42.3962 AC+316.004 BC
The Zeta potential ranged from 0.005 to 1.671 across the batches (DS/ME/01-DS/ME/16) as shown in . Independent variables associated with positive coefficients contribute to an increase, whereas those with negative coefficients exert a diminishing effect. Increasing oil content leads to a decrease in the magnitude of zeta potential, as well as increasing water content, as shown in .
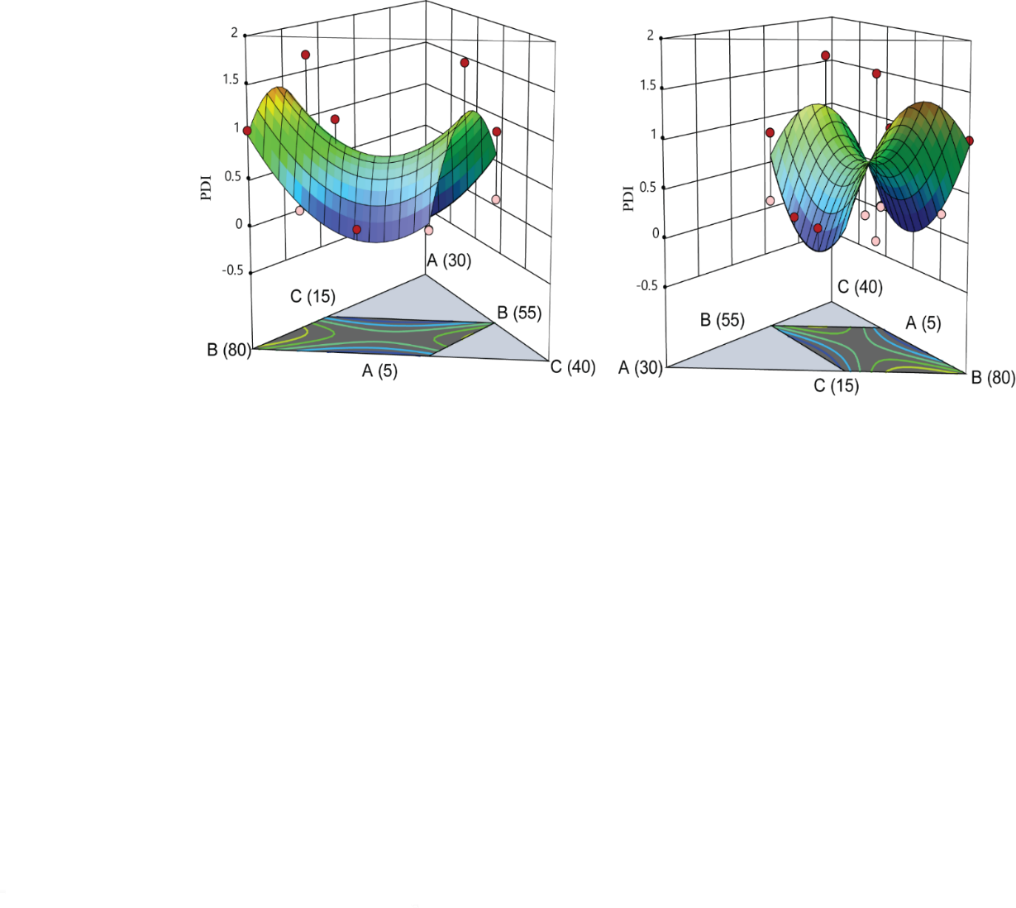
Fig. 11: 3D surface plots depicting effect of oil (A), Smix (B), and water (C) on polydispersity index of microemulsion
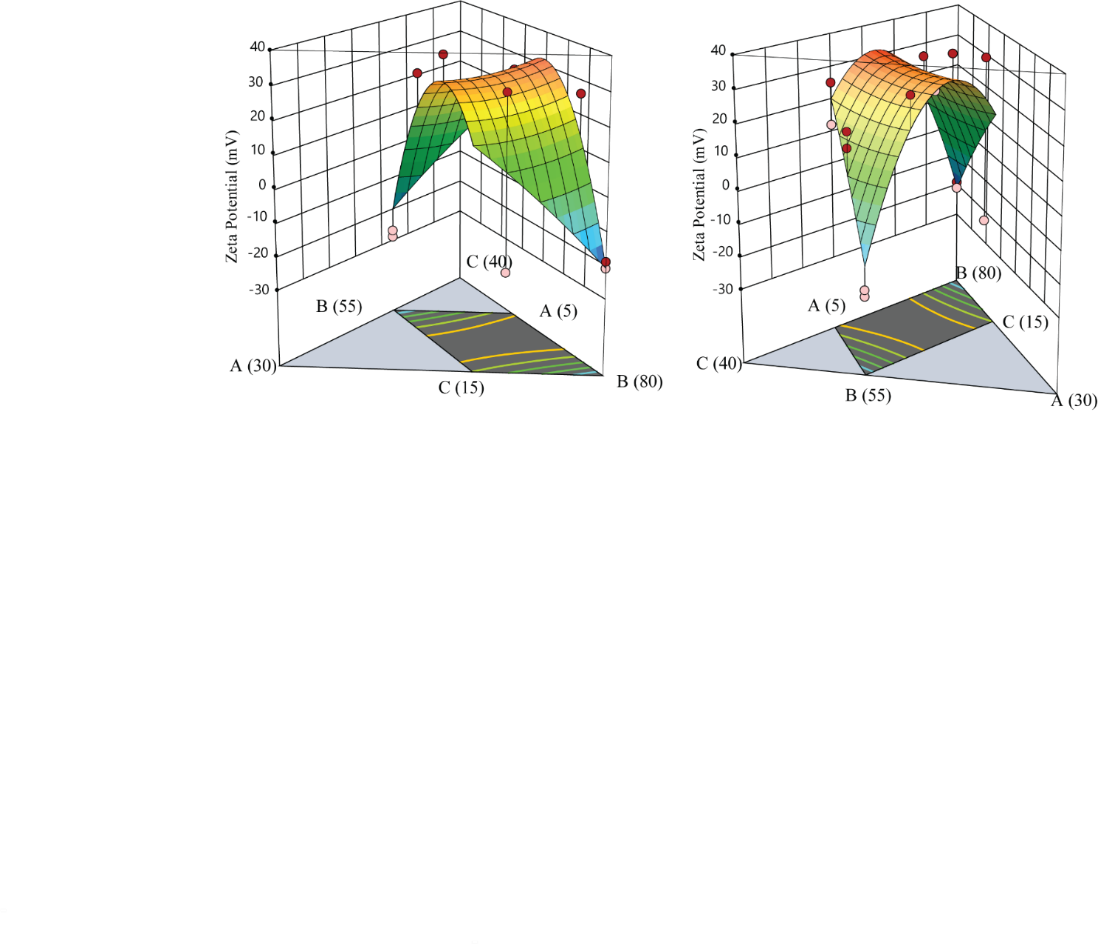
Fig. 12: 3D surface plots demonstrating the impact of oil (A), Smix (B), and water (C) on the zeta potential of microemulsion
Effect of independent variable on % transmittance (R4)
The design expert-13 application used to follow the cubic model equation to explain the relationship between different values of independent variables and the % Transmittance (R4).
R4=363.63 A+98.23 B+46.2643 C-532.162 AB-482.058 AC+78.4925 BC+489.103 ABC-225.082 AB(A-B)-494.551 AC(A-C)-53.9887 BC(B-C)
The transmittance ranged from 81.21% to 98.92% across the batches (DS/ME/01-DS/ME/16) as shown in . The transmittance of desonide microemulsion increased as the oil content decreased and the amount of surfactant mixture increased. This is because surfactants reduce interfacial tension between oil and water, causing the oil droplets to become smaller. This smaller-sized droplet scatters light less, resulting in higher transmittance as shown in owing to the more effective emulsification of the oil into finer droplets [48].
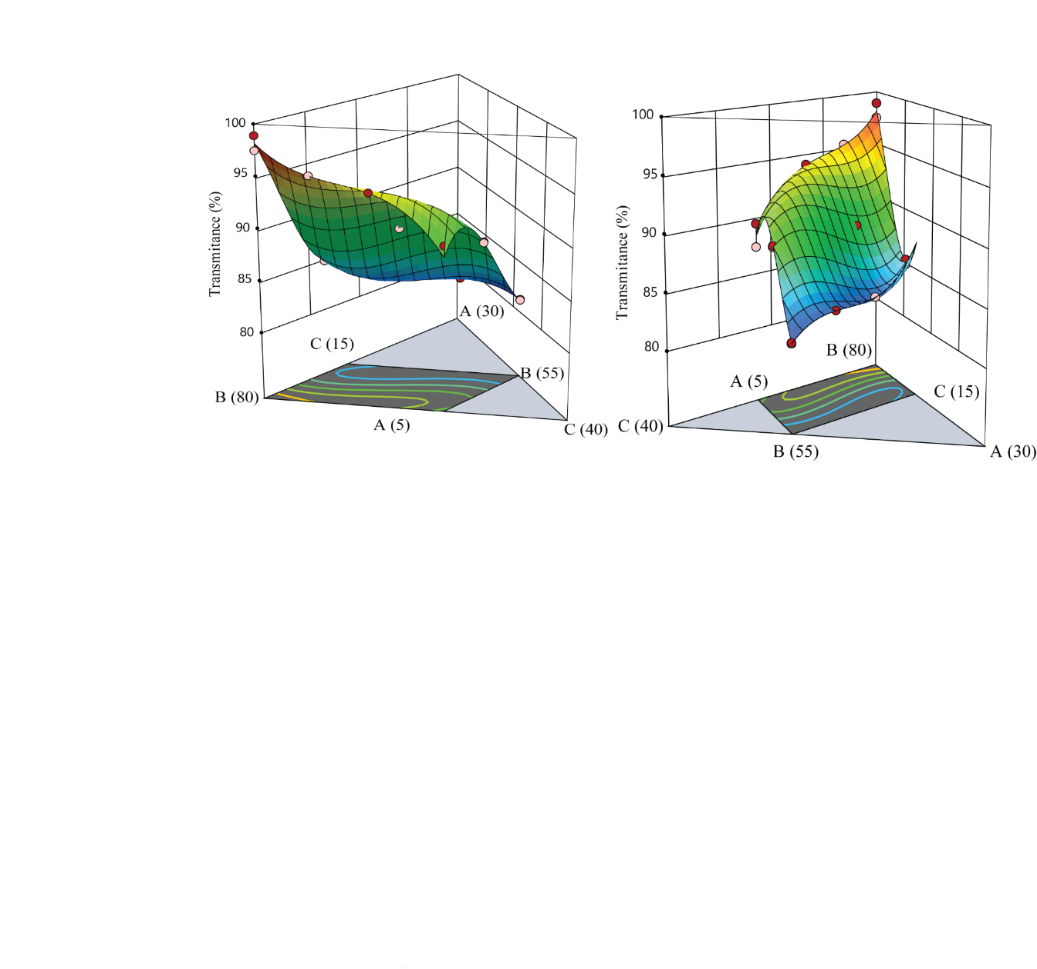
Fig. 13: 3D surface plots demonstrating the impact of oil (A), Smix (B), and water (C) on the transmittance of microemulsion
Effect of independent variable on cumulative % drug release (CDR %) (R5)
The design expert-13 software used to follow the quadratic model equation to explain the relationship between cumulative % drug release (R5) and various levels of independent variables.
R5=199.822 A+90.1046 B+109.15 C+-149.977 AB-253.551 AC-50.181 BC
The cumulative % drug release ranged from 75.54% to 98.59% across the batches (DS/ME/01-DS/ME/16) as shown in . The graph shows a curved surface that illustrates how the amount of oil, Smix, and water affects the drug released over time. The CDR% of desonide microemulsion increased and decreased with decreasing oil and water content levels, as shown in . The graph of the in vitro cumulative % drug release profile of desonide-based microemulsion batches is shown in .
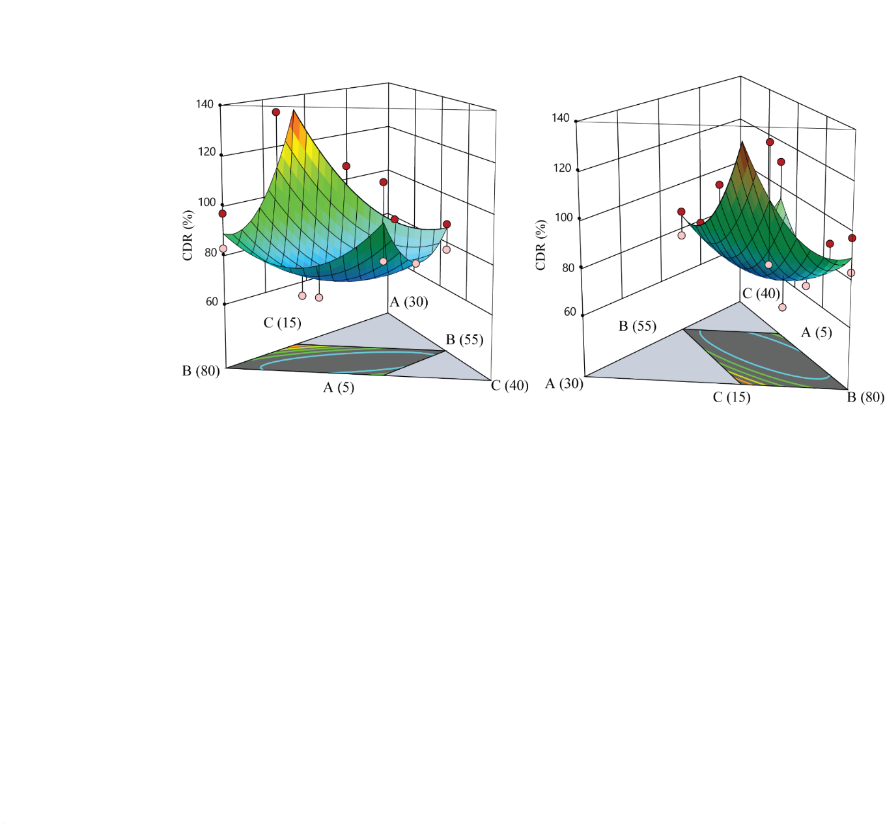
Fig. 14: 3D surface plots demonstrating the impact of oil (A), Smix (B), and water (C) on cumulative % drug release of microemulsion
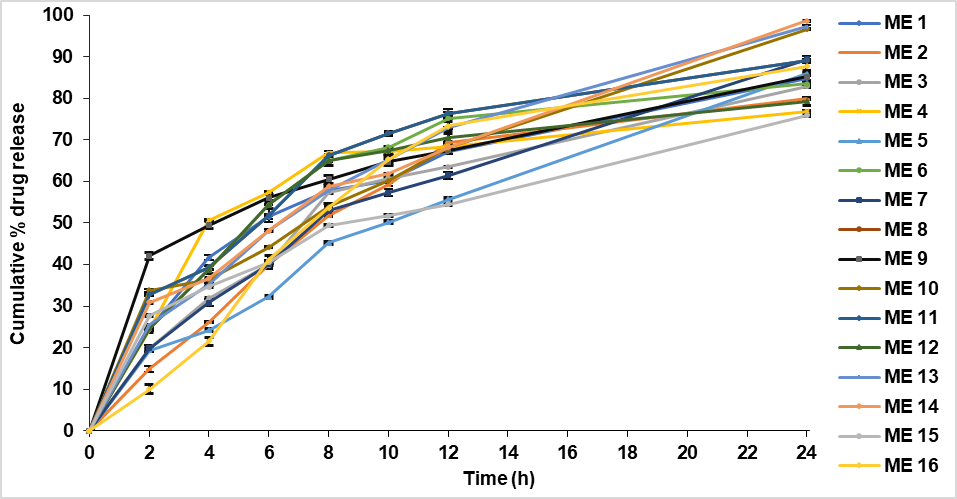
Fig. 15: In vitro cumulative % drug release profile of DS/ME-Optimization batches (mean ±SD, n=3)
Optimized composition of desonide microemulsion formulation
The prepared 16 microemulsion formulation batches, results, and all 5 response variables of formulation were fed into the d-optimal mixture design, which suggests optimum microemulsion compositions and their properties. The final batch was selected based on the highest desirability value. The selected formulation’s composition and its maximum desirability. The microemulsion formulation optimized using software consisted of 14.55% oil content (peppermint oil), 70.42 % Smix content, and 15 % water () and it was demonstrated to have the highest desirability value of 0.877. Both 2D and 3D contour plots highlighted the region with optimal formulation desirability shown . The formulation based on these predicted parameters was prepared and analyzed for all targeted response variables. To confirm the reliability of the optimization process, the predicted outcomes were compared with the experimentally obtained values.
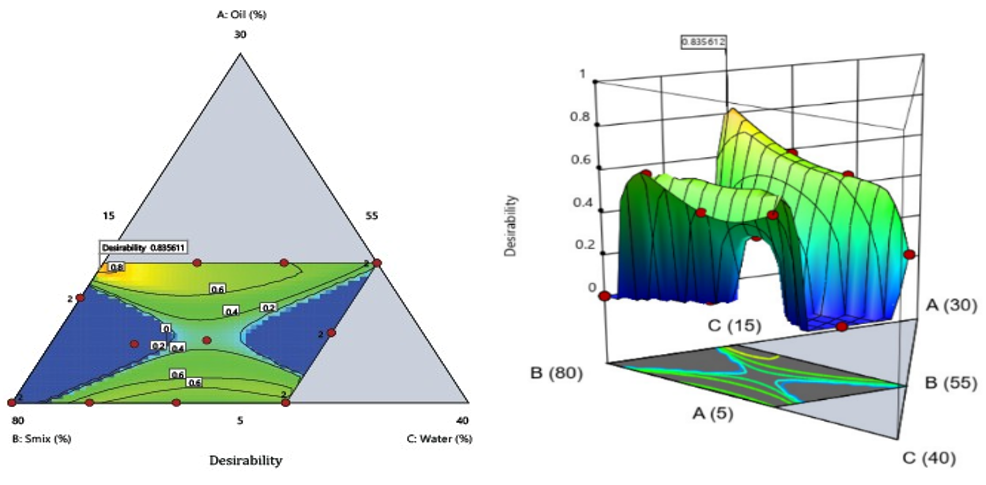
Fig. 16: The optimized batch of desonide based microemulsion having the highest desirability shown in 2D contour plots and 3D response surface
Table 8: Software predicted value and experimental observed data
| Components | Quantity (%) | Response variable | Software predicted value | Experimental observed value |
| A (oil) | 14.55 | Particle size(nm) | 86.10 | 18 |
| B (Smix) | 70.42 | PDI | 0.30 | 0.42 |
| C (Water) | 15.00 | Zeta potential (mV) | 12.75 | 13.00 |
| Transmittance (%) | 86.57 | 92.25 | ||
| Cumulative % drug release | 96.69 | 94.03 |
Characterization of desonide-based microemulsion
Particle size, polydispersity index, and zeta potential
For topical use, microemulsions are preferred to have a particle size less than 100 nm, as this enhances their stability, promotes better drug retention in the skin layers, and improves drug permeation at the targeted site [49]. The droplet size of the optimized microemulsion was found to be 18 nm, as shown in . Even after a 100 times dilution with water. The particle size remained within the nanometric range, confirming the particle size compatibility with water. The PDI value was recorded at 0.42 (), which reflects a narrow droplet size distribution, indicating a stable and uniform system.
The zeta potential value recorded at+13.00 mV (), suggesting the formulation is unlikely to cause irritation or adverse interactions with the skin upon topical use.
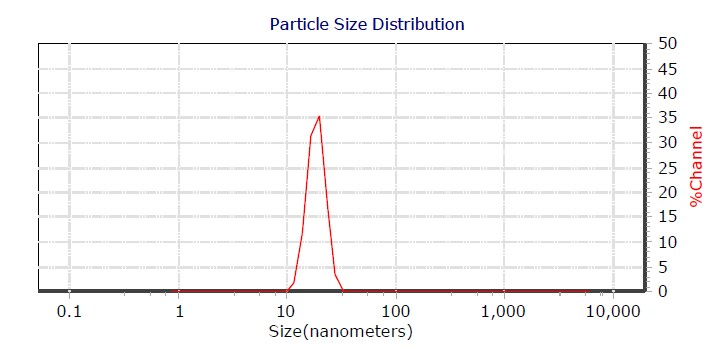
Fig. 17: Particle size distribution of optimized microemulsion formulation
Determination of % transmittance
A UV-visible spectrophotometer was used to determine the % transmittance at a specific wavelength of 650 nm [50]. The optimized formulation of desonide had been diluted 10 times with a continuous phase. The % transmittance of the optimized formulation was found to be 92.25% as shown in . The resultant transmittance was near 100%, which exhibits stable microemulsion.
Transmission electron microscope (TEM) analysis
The TEM image shows spherical droplets with an average diameter of approximately 10-20 nm and does not show any aggregation between particles. Droplet size suggested a well-defined phase separation, which is essential for the stability of the microemulsion system.
DSC study
The DSC thermogram of pure desonide revealed a distinct endothermic peak which corresponds to its melting point, likewise carbopol 971 P showed no sharp melting peak, since carbopol is amorphous is nature and the physical mixture (desonide and carbopol 971P) The Desonide peak is slightly shifted and/or reduced in intensity, which suggests Partial dispersion of Desonide in the polymer matrix and no new peaks appear, indicating no chemical interaction show in .
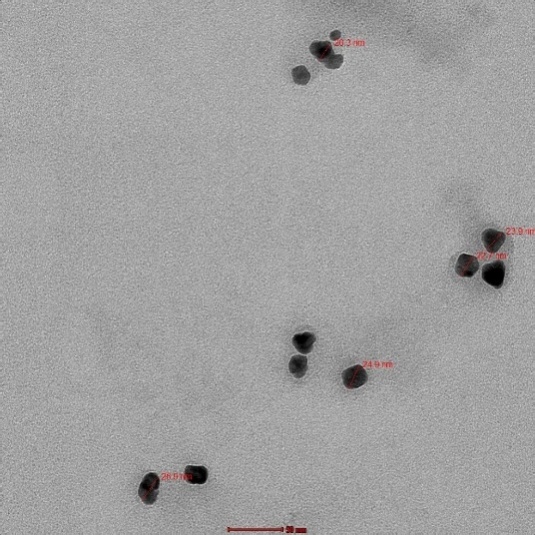
Fig. 18: TEM image of optimized microemulsion
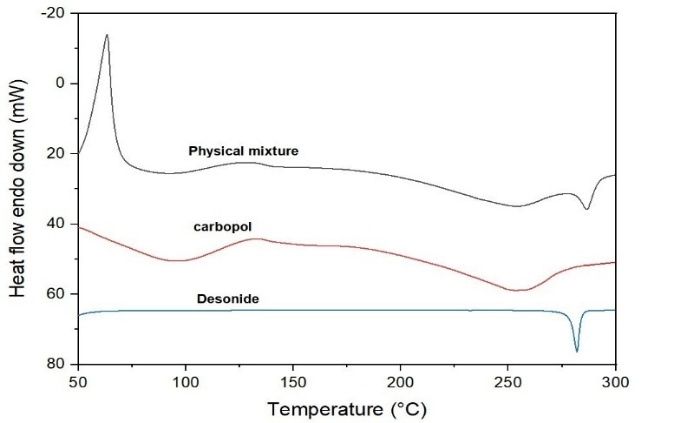
Fig. 19: DSC thermograph of desonide, carbopol 971P and physical mixture
In vitro drug release study
The in vitro drug release of the optimized desonide microemulsion was evaluated using the dialysis method [38]. The study was conducted in a PBS pH 7.4 containing 1% SLS. A dialysis membrane tube (5 cm long) was sealed at one end with a clip and, 2 ml of the optimized formulation was placed inside the membrane. The open end was sealed with another clip. The dialysis bag was immersed in a beaker containing 250 ml of the PBS solution, pH 7.4 with 1% SLS, and maintained at 37 ℃ using a magnetic stirrer. At specific time intervals (15, 30 min, 1, 2,3, 4, 6, 8, 10, 24 h) 5 ml of the sample was withdrawn from the beaker and replaced with an equal volume of fresh medium. The take-out samples were evaluated for desonide concentration using a UV-Visible spectrophotometer (Shimadzu 1700) at 247 nm.
Development and formulation of desonide based microemulsion gel
Gelling agents are employed to enhance the viscosity of microemulsion systems, thereby improving their adherence to the skin and prolonging their residence time. In the formulation of the gel base, several polymers were utilized, including carbopol 934, carbopol 940, carbopol 971 P at concentrations of 2,2.5, and 3% as well as xanthan gum 1% and polycarbophil 2% [51]. These polymers were hydrated in water for a period of 12 h to ensure full swelling. Following the hydration step, the optimized desonide microemulsion was incorporated into the prepared gel bases however, no gel formation occurred. When the microemulsion was combined with carbopol 934, carbopol 940, or polycarbophil regardless of the tested concentrations in contrast, the incorporation of the microemulsion into the carbopol 971 P solution successfully resulted in gel formation. The final product exhibited a transparent and clear.
Evaluations of a developed microemulsion based gel formulation of desonide
Physical appearance
The formulation appeared clear and uniform upon observation, with no presence of lumps or phase separation. These findings confirm the physical homogeneity of the gel, indicating proper formulation and stability.
pH determination
The pH value recorded for the gel was 6.02, which is within the typical physiological range of the skin. This compatibility suggests that the formulation is unlikely to cause a reaction upon local application making it acceptable for dermal use.
Determination of spreadability
In the assessment of topical formulations, spreadability is a key attribute that indicates the uniform distribution and consistency of the product. A texture analyzer (TA-XT plus) was utilized to determine the spreadability of the desonide microemulsion gel. This parameter defines the extent to which the gel can be evenly spread when applied to the skin or the targeted area. Spreadability plays a vital role in ensuring smooth application and adequate coverage, making it an important consideration in the evaluation of topical gel formulations. The spreadability of microemulsion gel was observed to be 23.379 g. cm/sec as graphically show in . The result indicates that microemulsion gel has good spreadability.
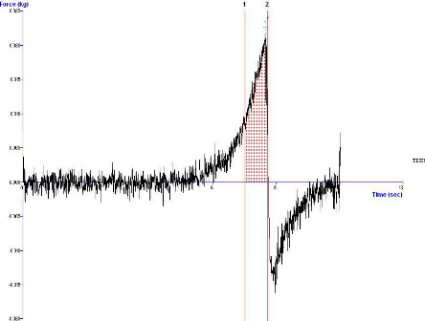
Fig. 20: Graphical representation of the spreadability of microemulsion gel
In vitro drug release and kinetic model fitting
Over a 24 h in vitro release study, the desonide microemulsion gel exhibited a total drug release of 94.32%, while the marketed gel formulation released 77.32% as shown .
This significant difference in release profiles suggests that the microemulsion-based gel enables more efficient and sustained drug delivery. The in vitro release profile of desonide from the microemulsion formulation was systematically analyzed using five distinct kinetic models to elucidate the mechanism and pattern of drug release. These models included Zero-order, First-order, Higuchi, Hixson-Crowell and Korsmeyer-Peppas equations . Each offering a different theoretical approach to interpreting drug release behavior from pharmaceutical dosage forms facilitates visual comparison of model fitting. The R2 values for the various kinetic models and were found to be in the range of zero-order (0.875), first order (0.978), Higuchi (0.985), Hixson-Crowell (0.984), Korsmeyer-Peppas (0.935) as shown in . It is clear that the drug release of desonide from the microemulsion based gel properly complies with the Higuchi model because the drug release profile showed the best fit to the regression line, with the highest R² value (R2) of 0.985.
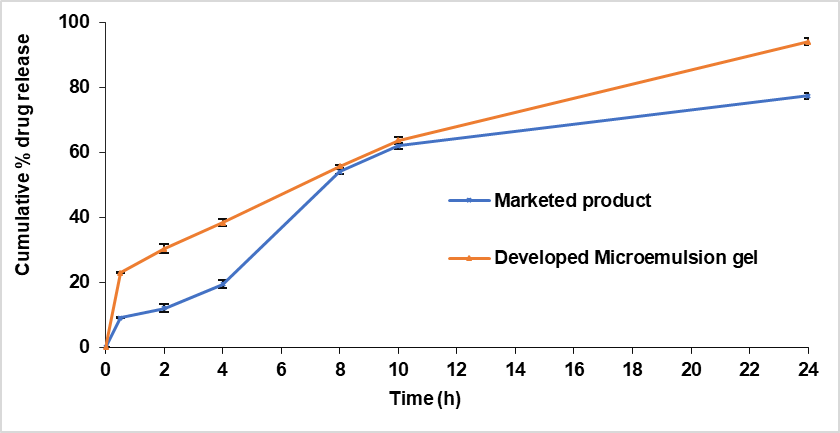
Fig. 21: Comparative in vitro release of developed microemulsion based gel formulation of desonide with marketed gel product (mean ±SD, n=3)
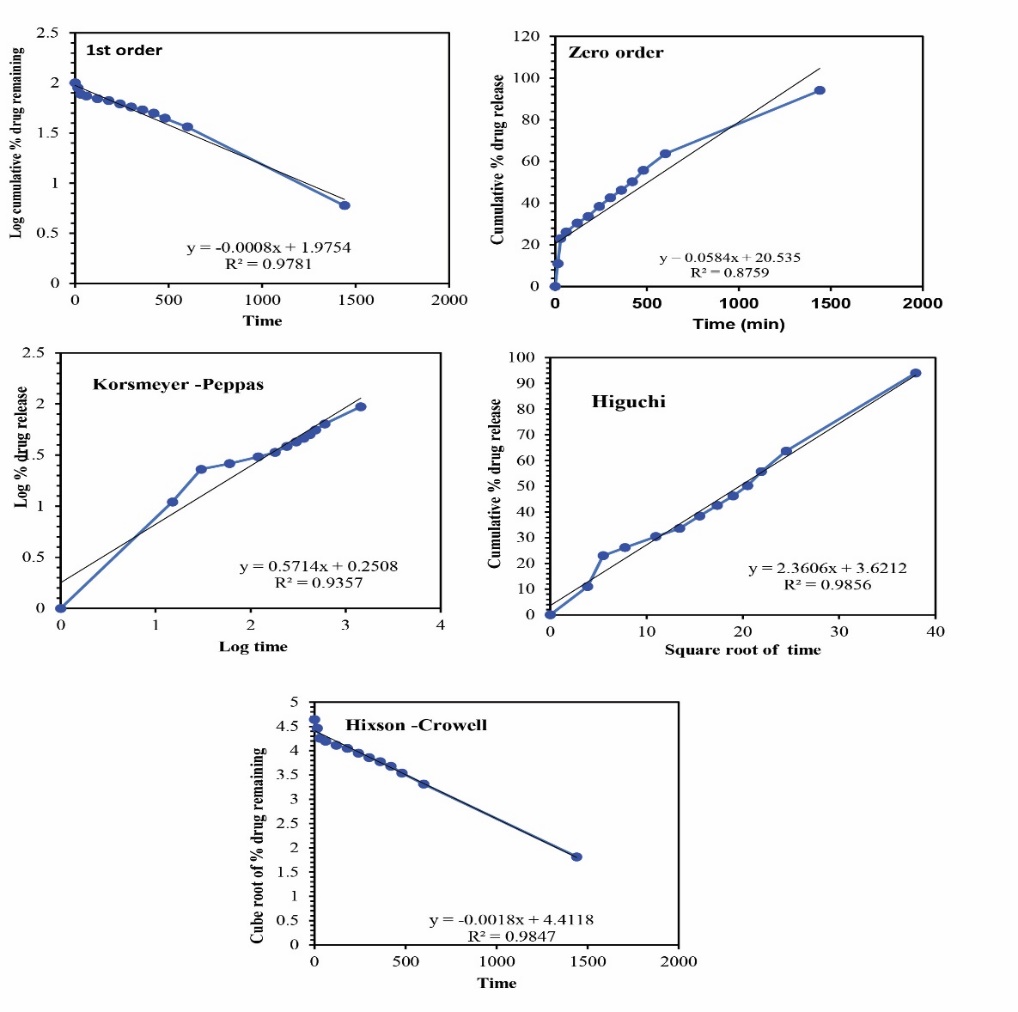
Fig. 22: The drug release kinetic model of desonide based microemulsion formulation
Table 9: Kinetic behaviour of developed desonide based microemulsion gel
| S. No. | Drug release kinetic model | Equation | k | R2 |
| 1. | Zero-order | Q0 – Qt = k0t | 0.05 | 0.875 |
| 2. | First order | log Qt = logQ0 – kt/2.303 | 0.01 | 0.978 |
| 3. | Higuchi | Q0 – Qt = kt1/2 | 2.36 | 0.985 |
| 4. | Hixson-Crowell | Q01/3 – Qt1/3 = kt | 0.02 | 0.984 |
| 5. | Korsmeyer-Peppas | Log (Q0 – Qt) = log k+n log t | 0.57 | 0.935 |
k is rate constant; t is time; Q0 is initial drug amount; Qt is drug amount remaining at time
Ex vivo drug permeation of the developed gel formulation
The developed desonide-based microemulsion gel in this study demonstrated significantly improved skin permeation [47]. When compared to the commercially available desonide formulation over a 10 h duration. The cumulative permeation achieved by the marketed product was 20.42 % whereas the microemulsion-based gel reached 27.83 %. A graphical comparison of ex vivo drug permeation between the formulated product and the marketed counterpart is presented in and as shown in . The apparent permeability (Papp) and permeation flux (Jss) of the developed formulation were found to be 2.017(μg·cm⁻²·h⁻¹) and 0.2017(cm·s⁻¹) respectively, the developed formulation provides a 4% enhancement in Jss and a 5% enhancement in Papp compared to the marketed product.
Table 10: Ex-vivo drug permeation data of developed formulation and marketed product
| S. No. | Sample | Jss (μg·cm⁻²·h⁻¹) | Papp (cm·s⁻¹) |
| 1. | Developed formulation | 2.01 | 0.20 |
| 2. | Marketed product | 1.94 | 0.19 |
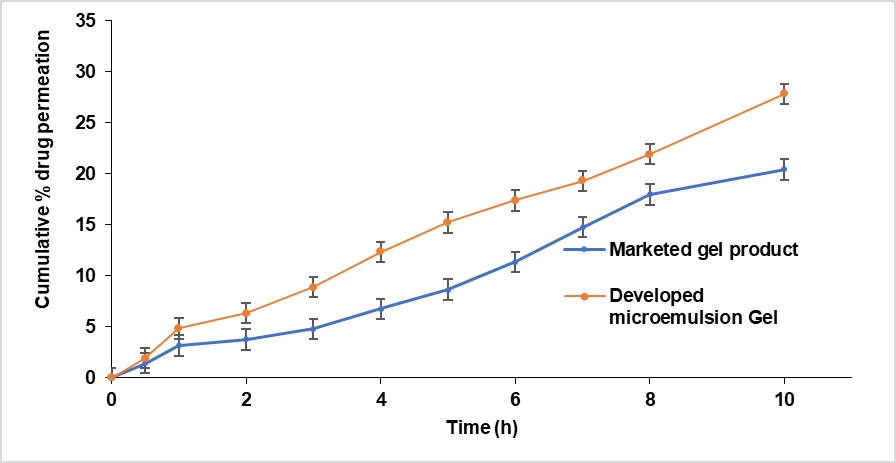
Fig. 23: Ex vivo permeation profile of microemulsion based gel formulation and marketed gel product (mean ±SD, n=3)
CONCLUSION
An optimized, sustained-release microemulsion for desonide was developed. Using a D-optimal design, the formulation metal quality targets, including particle size and drug release. The release was sustained and followed the Higuchi model, demonstrating its potential for effective topical delivery. Ex vivo permeation studies revealed that the optimized gel enhanced drug permeation compared to the marketed formulation, suggesting potential benefits for improved localized therapy, patient compliance, and therapeutic outcomes. Its favourable characteristics, such as physical stability, ease of use, and better skin retention, contribute to enhanced patient adherence and satisfaction. Moreover, the sustained release profile supports once-daily application, improving treatment outcomes for chronic inflammatory skin disorders.
FUNDING
Nil
ACKNOWLEDGMENT
The authors are thankful to Jamia Hamdard University, Delhi, for carrying out TEM analysis.
AUTHORS CONTRIBUTIONS
Dr. Prakash K. Soni conceptualized and supervised the whole research work. Kiran Kaithwar performed all the experiments, data observation and manuscript writing. Reena Soni contributed in material procurement, data analysis and manuscript drafting. Dr. Suresh K. Paswan contributed by technical inputs and data checking.
CONFLICT OF INTERESTS
The authors declare no conflict of interest
REFERENCES
Sawada Y, Saito Sasaki N, Mashima E, Nakamura M. Daily lifestyle and inflammatory skin diseases. Int J Mol Sci. 2021;22(10):5204. doi: 10.3390/ijms22105204, PMID 34069063.
Hebert AA, Group D. Desonide foam 0.05%: safety in children as young as 3 mo. JAAD. 2008;59(2):334-40. doi: 10.1016/j.jaad.2008.04.019.
Akhtar N, Verma A, Pathak K. Exploring preclinical and clinical effectiveness of nanoformulations in the treatment of atopic dermatitis: safety aspects and patent reviews. Bulletin of Faculty of Pharmacy Cairo University. 2017;55(1):1-10. doi: 10.1016/j.bfopcu.2016.12.003.
Mayba JN, Gooderham MJ. Review of atopic dermatitis and topical therapies. J Cutan Med Surg. 2017;21(3):227-36. doi: 10.1177/1203475416685077, PMID 28300440.
Gran F, Kerstan A, Serfling E, Goebeler M, Muhammad K. Current developments in the immunology of psoriasis. Yale J Biol Med. 2020;93(1):97-110. PMID 32226340.
Antiga E, Verdelli A, Bonciani D, Bonciolini V, Caproni M, Fabbri P. Acne: a new model of immune-mediated chronic inflammatory skin disease. G Ital Dermatol Venereol. 2015;150(2):247-54. PMID 25876146.
Bergqvist C, Ezzedine K. Vitiligo: a review. Dermatology. 2020;236(6):571-92. doi: 10.1159/000506103, PMID 32155629.
Bhowmik D. Recent advances in novel topical drug delivery system. J Pharm Innov. 2012;1(9):12-31.
Kathe K, Kathpalia H. Film forming systems for topical and transdermal drug delivery. Asian J Pharm Sci. 2017;12(6):487-97. doi: 10.1016/j.ajps.2017.07.004, PMID 32104362.
Tadwee IK, Gore S, Giradkar P. Advances in topical drug delivery system: a review. Int J Pharm Res All Sci. 2012;1(1):14-23.
Mehta AB, Nadkarni NJ, Patil SP, Godse KV, Gautam M, Agarwal S. Topical corticosteroids in dermatology. Indian J Dermatol Venereol Leprol. 2016;82(4):371-8. doi: 10.4103/0378-6323.178903, PMID 27279294.
Iqbal J, Husain A, Gupta A. Photochemistry of desonide a non-fluorinated steroidal anti-inflammatory drug. Chem Pharm Bull (Tokyo). 2006;54(6):836-8. doi: 10.1248/cpb.54.836, PMID 16755054.
PubChem. Bethesda (MD): National Library of Medicine. In: National Center for Biotechnology Information; 2004.
Zhang X, Song M, Chai J, Cui X, Wang J. Preparation characterization and application of a surfactant free microemulsion containing 1-octen-3-ol ethanol and water. J Mol Liq. 2020;300:112278. doi: 10.1016/j.molliq.2019.112278.
Paul BK, Moulik SP. Microemulsion: an overview. J Dispers Sci Technol. 1997;18(4):301-67. doi: 10.1080/01932699708943740.
Callender SP, Mathews JA, Kobernyk K, Wettig SD. Microemulsion utility in pharmaceuticals: implications for multi-drug delivery. Int J Pharm. 2017;526(1-2):425-42. doi: 10.1016/j.ijpharm.2017.05.005, PMID 28495500.
Gallani N, Choudhary R, Dighade S. Novel ionic liquid based microemulsion formulation: a potential tool for drug delivery. Int J Pharm Res Sch. 2022;11(1):34-43.
Sujatha B, Himabindu E, Bttu S, Abbulu K. Microemulsions a review. J Pharm Sci Res. 2020;12(6):750-3.
Chouhan P, Saini TR. D-optimal design and development of microemulsion based transungual drug delivery formulation of ciclopirox olamine for treatment of onychomycosis. Ind J Pharm Sci. 2016;78(4):498-511. doi: 10.4172/pharmaceutical-sciences.1000145.
Nirmala G, Padmini R, Rashmi M. Microemulsions for topical use a review. Ind J Pharm Educ Res. 2011;45(1):100-7.
Madhav S, Gupta D. A review on microemulsion based system. Int J Pharm Sci Res. 2011;2(8):1888. doi: 10.13040/IJPSR.0975-8232.2(8).1888-99.
Korting HC, Schafer Korting M. Carriers in the topical treatment of skin disease. Handb Exp Pharmacol. 2010;(197):435-68. doi: 10.1007/978-3-642-00477-3_15, PMID 20217539.
Grampurohit N, Ravikumar P, Mallya R. Microemulsions for topical use a review. Ind J Pharm Educ Res. 2011;45(1):100-7.
Hassan SF, Asghar S, Ullah Khan I, Munir R, Khalid SH. Curcumin encapsulation in geranium oil microemulsion elevates its antibacterial antioxidant anti-inflammatory and anticancer activities. ACS Omega. 2024;9(5):5624-36. doi: 10.1021/acsomega.3c08033, PMID 38343911.
Das S, Lee SH, Chia VD, Chow PS, Macbeath C, Liu Y. Development of microemulsion based topical ivermectin formulations: pre-formulation and formulation studies. Colloids Surf B Biointerfaces. 2020;189:110823. doi: 10.1016/j.colsurfb.2020.110823, PMID 32036331.
Jain P, Soni R, Paswan SK, Soni PK. Ketoconazole laden microemulsion based gel formulation against skin fungal infection. Int J App Pharm. 2023;15(3):49-60. doi: 10.22159/ijap.2023v15i3.47456.
Subongkot T, Sirirak T. Development and skin penetration pathway evaluation of microemulsions for enhancing the dermal delivery of celecoxib. Colloids Surf B Biointerfaces. 2020;193:111103. doi: 10.1016/j.colsurfb.2020.111103, PMID 32438237.
Prakash A, Soni PK, Paswan SK, Saini TR. Formulation and optimization of mucoadhesive buccal film for nicotine replacement therapy. Int J App Pharm. 2023;15(3):100-12. doi: 10.22159/ijap.2023v15i3.47412.
Sharma K, Sapra B, Kant S, Bedi N. Formulation and evaluation of desonide loaded microemulsion based gel for management of atopic dermatitis. J Nanomed. 2021;4(1):1035-47.
El Malah Y, Nazzal S, Khanfar NM. D-optimal mixture design: optimization of ternary matrix blends for controlled zero-order drug release from oral dosage forms. Drug Dev Ind Pharm. 2006;32(10):1207-18. doi: 10.1080/03639040600685167, PMID 17090443.
Moghimipour E, Salimi A, Eftekhari S. Design and characterization of microemulsion systems for naproxen. Adv Pharm Bull. 2013;3(1):63-71. doi: 10.5681/apb.2013.011, PMID 24312814.
Alam MS, Ali MD, Ansari MS, Sharma P. Inhibitory effects on tumor necrosis factor alpha and interleukin 12 using clobetasol propionate loaded tea tree oil nanoemulsion gel on animal model. Asian J Pharm Clin Res. 2018;11(6):182. doi: 10.22159/ajpcr.2018.v11i6.24888.
Cavalcanti AL, Reis MY, Silva GC, Ramalho IM, Guimaraes GP, Silva JA. Microemulsion for topical application of pentoxifylline: in vitro release and in vivo evaluation. Int J Pharm. 2016;506(1-2):351-60. doi: 10.1016/j.ijpharm.2016.04.065, PMID 27130362.
Zhao L, Wang Y, Zhai Y, Wang Z, Liu J, Zhai G. Ropivacaine loaded microemulsion and microemulsion-based gel for transdermal delivery: preparation optimization and evaluation. Int J Pharm. 2014;477(1-2):47-56. doi: 10.1016/j.ijpharm.2014.10.005, PMID 25304092.
Soni PK, Saini TR. Purification of drug loaded liposomal formulations by a novel stirred cell ultrafiltration technique. Pharm Nanotechnol. 2021;9(5):347-60. doi: 10.2174/2211738509666211124145848, PMID 34819014.
Salimi A, Hoseinzadeh H, Mohammad Soleymani S. Development and optimization of a methimazole microemulsion for topical application: formulation characteristics and transdermal permeation. J Cosmet Dermatol. 2024;23(12):4315-24. doi: 10.1111/jocd.16528, PMID 39135289.
Soni PK, Saini TR. Non-ionic surfactant vesicles (niosomes) based novel ophthalmic formulation of timolol maleate. J Drug Deliv Ther. 2017;7(7):59-61.
Al Saqr A, Annaji M, Poudel I, Aldawsari MF, Alrbyawi H, Mita N. Topical delivery of diacetyl boldine in a microemulsion formulation for chemoprotection against melanoma. Pharmaceutics. 2023;15(3):901. doi: 10.3390/pharmaceutics15030901, PMID 36986762.
Salerno C, Carlucci AM, Bregni C. Study of in vitro drug release and percutaneous absorption of fluconazole from topical dosage forms. AAPS PharmSciTech. 2010;11(2):986-93. doi: 10.1208/s12249-010-9457-1, PMID 20521179.
Farghaly DA, Aboelwafa AA, Hamza MY, Mohamed MI. Microemulsion for topical delivery of fenoprofen calcium: in vitro and in vivo evaluation. J Liposome Res. 2018;28(2):126-36. doi: 10.1080/08982104.2017.1281951, PMID 28081643.
Jagdale S, Brahmane S, Chabukswar A. Optimization of microemulgel for tizanidine hydrochloride. Antiinflamm Antiallergy Agents Med Chem. 2020;19(2):158-79. doi: 10.2174/1871523018666190308123100, PMID 30854978.
Chandwani S, Saini TR, Soni R, Paswan SK, Soni PK. Box-behnken design optimization of salicylic acid loaded liposomal gel formulation for treatment of foot corn. Int J App Pharm. 2023;15(3):220-33. doi: 10.22159/ijap.2023v15i3.47455.
Jamil L, Jan SU, Gul R. Formulation of microemulsion based gel of salbutamol sulphate and it’s in vitro studies. Int J Curr Pharm Sci. 2020;12(4):102-7. doi: 10.22159/ijcpr.2020v12i4.39093.
Barradas TN, Senna JP, Cardoso SA, De Holanda E Silva KG, Elias Mansur CR. Formulation characterization and in vitro drug release of hydrogel-thickened nanoemulsions for topical delivery of 8-methoxypsoralen. Mater Sci Eng C Mater Biol Appl. 2018;92:245-53. doi: 10.1016/j.msec.2018.06.049, PMID 30184748.
Mohammed W, Ali W, Al Awady M. Evaluation of in vitro drug release kinetics and antibacterial activity of vancomycin HCl-loaded nanogel for topical application. J Pharm Sci Res. 2018;10(11):2747-56.
Amra K, Momin M. Formulation evaluation of ketoconazole microemulsion-loaded hydrogel with nigella oil as a penetration enhancer. J Cosmet Dermatol. 2019;18(6):1742-50. doi: 10.1111/jocd.12945, PMID 30980617.
Ambade KW, Jadhav SL, Gambhire MN, Kurmi SD, Kadam VJ, Jadhav KR. Formulation and evaluation of flurbiprofen microemulsion. Curr Drug Deliv. 2008;5(1):32-41. doi: 10.2174/156720108783331032, PMID 18220549.
Alaoui YE, Fahry A, Rahali Y, Cherkaoui N, Bensouda Y, Laatiris A. Formulation optimization and characterization of ibuprofen loaded microemulsion using d-optimal mixture design. Int J App Pharm. 2019;11(4):304-12. doi: 10.22159/ijap.2019v11i4.33076.
Gandhi J, Suthar D, Patel H, Shelat P, Parejiya P. Development and characterization of microemulsion based topical gel of essential oil of clove (Syzygium aromaticum) for superficial fungal infections. Adv Tradit Med. 2021;21(3):519-34. doi: 10.1007/s13596-020-00462-6.
Kumar N, Shishu. D-optimal experimental approach for designing topical microemulsion of itraconazole: characterization and evaluation of antifungal efficacy against a standardized tinea pedis infection model in wistar rats. Eur J Pharm Sci. 2015;67:97-112. doi: 10.1016/j.ejps.2014.10.014, PMID 25445834.
Soni PK, Saini TR. Development and evaluation of HP-β-CD complexation based novel ophthalmic gel formulation of nepafenac. Int J Pharm Sci Res. 2019;10(12):5707-14. doi: 10.13040/IJPSR.0975-8232.10(12).5707-14.