
Int J App Pharm, Vol 18, Issue 1, 2026, 410-420Original Article
“FORMULATION AND EVALUATION OF METFORMIN HYDROCHLORIDE SUSTAINED-RELEASE AND EMPAGLIFLOZIN IMMEDIATE-RELEASE BILAYER TABLETS”
BIPANA BASNET1, ANUP LUITEL1*, RAJAN SHRESTHA1, PRAJESH SHRESTHA2, ARCHANA SHRESTHA3, LALIT MOHAN PANT1*
1Department of Pharmacy, School of Science, Kathmandu University, Nepal. 2Department of Pathobiological Sciences, School of Veterinary Medicine, Louisiana State University, USA. 3Department of Basic Pharmaceutical and Toxicological Sciences, College of Pharmacy, University of Louisiana, USA
*Corresponding author: Anup Luitel; *Email: anup.luitel@ku.edu.np
Received: 16 Aug 2025, Revised and Accepted: 10 Nov 2025
ABSTRACT
Objective: The present study aimed to formulate and evaluate bilayer tablets containing sustained-release Metformin hydrochloride and immediate-release Empagliflozin for the management of Type 2 diabetes.
Methods: The wet granulation technique was employed to formulate a sustained-release Metformin HCl layer and an immediate-release Empagliflozin layer. The impact of varying concentrations of independent variables (HPMCK100M and Carbopol 971P) on drug release at different times was evaluated using a 2-factor central composite design (CCD)with five central replicates. The formulation was optimized using responsesurface methodology (RSM) through CCD, and optimal levels of polymers were determined using surface plots and response optimizer. In vitro release data observed from the optimized formulation were subjected to pre-and post-compression analysis and fitted into various drug release kinetic models.
Results: Using response surface methodology (RSM), the optimized formulation contained 17.9% HPMCK100M and 3.8% Carbopol, respectively. Various parameters were noted: hardness, 21.33 kg/cm²; friability, 0.23%; and uniformity of content for empagliflozin (98.23%), whichwas within the limit. The assay percentages of metformin and empagliflozin were 95.27% and 96%, respectively. In vitro drug release at 1, 6, 10, and 12 h is 20.08%, 67.02%, 87.06%, and 97.52%, respectively, which is comparable to the predicted drug release by RSM. The optimized model accurately predicted the drug release profile, with a chi-square test (χ² = 0.436, df = 3) and a similarity factor (f2) of 82.54showing no significant differences. Similarly, the drug release of the optimized formulation followed the Korsmeyer–Peppas model (R²= 0.9986), indicating a combination of diffusion and polymer relaxation mechanisms inthe drug release process.
Conclusion: In conclusion, we developed an optimized fixed-dose bilayer formulation of sustained-release metformin HCl and immediate-release empagliflozin using a central composite design. The optimized formulation exhibited predictable release kinetics, best described by the Korsmeyer-Peppas model, confirming anomalous transport driven by both diffusion and polymer relaxation. This work presents how experimental design and mechanistic modeling can be integrated to aid in the development of bilayer tablet formulations, thereby validating the growing body of knowledge in this field. Clinically, the formulation presents a promising approach for improving glycemic control, enhancing patient compliance, and reducing healthcare costs.
Keywords: Type 2 diabetes, Sustained release, Central composite design, Metformin HCl, Empagliflozin, Response surface methodology
© 2026 The Authors. Published by Innovare Academic Sciences Pvt Ltd. This is an open access article under the CC BY license (https://creativecommons.org/licenses/by/4.0/)
DOI: https://dx.doi.org/10.22159/ijap.2026v18i1.56545 Journal homepage: https://innovareacademics.in/journals/index.php/ijap
INTRODUCTION
Diabetes mellitus (DM) continues to exert a significant global health challenge, affecting more than half a billion peopleworldwide, with prevalence projected torise by 46% by 2050 [1]. Type 2 diabetes mellitus (T2DM)accounts for over 90% of casesand is characterized by insulin resistance and progressive β-cell dysfunction, often associated with obesity, sedentary lifestyle, genetic predisposition, and aging. Treatment options for DM include lifestyle interventions, insulin, and oral anti-diabetic medications, which remain safe and effective treatment options. However, varying dosage requirements among patient populations and the growing demand for controlled-release formulations may aid in effective dosing, thereby optimizing therapeutic outcomes.
Metformin hydrochloridebelongs to a class of biguanide derivatives. It is the first-line therapy for T2DM due to its safety profile and unique mechanism of action, which activates protein kinase, reduces hepatic glucose production, and enhances peripheral glucose uptake [2, 3]. Another effective class of anti-diabetic drugs is the selective sodium-glucose cotransporter-2 (SGLT2) inhibitor, Empagliflozin, which acts by reducing blood glucose levels by blocking renal glucose reabsorption, leading to increased urinary glucose excretion [4, 5]. Dual therapy, combining Metformin HCl and Empagliflozin, is recommended by the American College of Endocrinology (AACE) and the Americandiabetes association (ADA) to achieve enhanced glycemic control, reduce HbA1C levels, and provide synergistic cardioprotective effects compared to monotherapy [6-9].
A fixed-dose bilayer oral tablet formulation enables the immediate release of one drug while maintaining sustained release of the other. This approach to drug dosage form design enhances patient compliance by reducing dosing frequency and controlling drug release, leading to a better therapeutic outcome that monotherapy cannot achieve [10, 11]. Therefore, this research aims to design, formulate, and evaluate a bilayer tablet comprising a sustained-release layer of metformin HCl and an immediate-release layer of empagliflozin, optimize the formulation parameters using a central composite design, and assess its in vitro drug release kinetics to achieve a clinically viable dosage form for improved management of T2DM.
MATERIALS AND METHODS
Materials
Metformin HCl, Empagliflozin, HPMCK100M, Carbopol 971P, Sodium CMC, PVK-90, Lactose Monohydrate, Crospovidone, Croscarmellose sodium, PVK-30, HPMC 15CPS, Microcrystalline Cellulose, Magnesium Stearate,Yellow oxide of Iron, Lactose anhydrous, Aerosil was provided by Nepal Pharmaceuticals Limited Pvt. Ltd. in Birgunj.
Methods
Active pharmaceutical ingredient (API)-excipient compatibility studies
For the API-excipient compatibility study, the API (Metformin HCl) was combined with excipients in equal weight portions and incubated in glass vials sealed with Teflon plugs and aluminum caps at 40 °C and 75% relative humidity for 6 mo. Infrared (IR) spectroscopy was used to analyze the stability of the drug in the blended mixture after 6 mo. The Fourier transform infrared spectroscopy (FTIR) spectra of API-HPMC K100M and API-Carbopol971P, stored for 6 mo at 40 °C, were compared with the spectrum of the API to assess changes in the API structure.
Design of experiment
A 2-factor, rotatable central composite design (CCD) was employed to investigate the effect of HPMCK100M and Carbopol 971P on formulation properties. Based on preliminary screening, the concentration of HPMCK100M varied between 14% and 19% w/w, and that of Carbopol 971P varied between 3% and 7% w/w. Factor levels were coded as-1 and+1 for low and high levels, respectively (table 1), with the center point set at 16.5% HPMCK100M and 5% Carbopol 971P. For the CCD, four full factorial points, four axial points at α=±1.41 were taken to estimate the curvature, and five replicates were taken at centerpoints for estimation of model fit and lack of fit. In total, 13 formulations were prepared, and the order in which they were run was randomized to minimize systematic bias, as shown in table 2.
Table 1: Variables in factorial design
| Factors | Levels used | ||
| Low (-1) | Medium (0) | High (+) | |
| HPMC K100M (X1) (%w/w) | 14 | 16.5 | 19 |
| Carbopol 971P (X2) (%w/w) | 3 | 5 | 7 |
| Dependent variables | Target | ||
| Drug release at 1h (Y1) | 15-25 | ||
| Drug release at 6h (Y2) | 50-70 | ||
| Drug release at 10h (Y3) | not less than (NLT) 80 | ||
| Drug release at 12h (Y4) | not less than (NLT) 90 | ||
Table 2: Two-factor, rotatable central composite design (CCD) with independent variables HPMCK100M (X1) and carbopol 971P (X2)
| Formulation | Type | Independent variables (Polymers) | |
| HPMCK100 (X1) | Carbopol 971P (X2) | ||
| F1 | Center | 16.5 | 5 |
| F2 | Factorial | 14 | 3 |
| F3 | Center | 16.5 | 5 |
| F4 | Center | 16.5 | 5 |
| F5 | Factorial | 19 | 7 |
| F6 | Axial | 16.5 | 7.8 |
| F7 | Axial | 20.03 | 5 |
| F8 | Center | 16.5 | 5 |
| F9 | Center | 16.5 | 5 |
| F10 | Axial | 12.96 | 5 |
| F11 | Factorial | 19 | 3 |
| F12 | Axial | 16.5 | 2.17 |
| F13 | Factorial | 14 | 7 |
Preparation of bilayer tablet
Preparation of metformin hydrochloride part (ER Part) and empagliflozin immediate release part (IR Part)
Metformin HCl granules were prepared using wet granulation, and direct blending was used for the Empagliflozin part as described by Chinta et al. [12]. Thirteen different formulations were prepared, as listed in table 3 and table 4 for Metformin and Empagliflozin, respectively.
Evaluation of pre-compression parameters of metformin granules
Before compressing the granules into a bilayer tablet, several pre-compression tests were performed on the metformin granules. Parameters tested were Bulk density, Tapped density, Hausner ratio, Carr’s index, and Angle of Repose.
Post compression parameters
After compressing the granules into bilayer tablets, the tablets were tested for weight variation, dimensions, hardness, and friability. Similarly, the percentage assay was calculated for both APIs, and the disintegration time of the Empagliflozin immediate-release portion was calculated.
In vitro drug release
Dissolution studies were performed, and the % release of metformin was analyzed at different time points (1 h, 6 h, 10 h, and 12 h). The experimental drug release data were fitted to a second-order polynomial model:
Y= β0+β1 X1+β2X2+β12X1X2+β11X12+β22X22+ε
where, Y is the measured response (%drug release at various time points) and X1 and X2 are the coded values of HPMCK100M and Carbopol 971P, respectively (table 1 and table 2); ε is the residual error. Using multiple regression analysis and plots, the adequacy of the models was assessed.
Formulation optimization and drug release kinetics evaluation
After the model is prepared, the optimum concentration of the independent variable required for desirable drug release is determined using a response surface plot and a desirability function and is then formulated. Different pre-and post-compression parameters are measured. Finally, the drug release kinetics isestimated by fitting the release profile into various models. The models tested werethe Zero-Order kinetics model, first-order kinetics model, Higuchi model, and Korsmeyer-Peppas model.
Table 3: Composition of metformin parts of different formulations
| Ingredients/Batches | F1 | F2 | F3 | F4 | F5 | F6 | F7 | F8 | F9 | F10 | F11 | F12 | F13 |
| Metformin HCl (ER part) | |||||||||||||
| Metformin HCl | 500 | 500 | 500 | 500 | 500 | 500 | 500 | 500 | 500 | 500 | 500 | 500 | 500 |
| HPMC K 100M | 16.5 | 14 | 16.5 | 16.5 | 19 | 16.5 | 20.03 | 16.5 | 16.5 | 12.96 | 19 | 16.5 | 14 |
| Carbopol | 5 | 3 | 5 | 5 | 7 | 7.828 | 5 | 5 | 5 | 5 | 3 | 2.171 | 7 |
| PVK-90 | 27 | 27 | 27 | 27 | 27 | 27 | 27 | 27 | 27 | 27 | 27 | 27 | 27 |
| Sod. CMC | 45 | 45 | 45 | 45 | 45 | 45 | 45 | 45 | 45 | 45 | 45 | 45 | 45 |
| Mg. stearate | 9 | 9 | 9 | 9 | 9 | 9 | 9 | 9 | 9 | 9 | 9 | 9 | 9 |
| Aerosil | 9 | 9 | 9 | 9 | 9 | 9 | 9 | 9 | 9 | 9 | 9 | 9 | 9 |
| Lactose MH | 288.5 | 293 | 288.5 | 288.5 | 284 | 285.672 | 284.965 | 288.5 | 288.5 | 292.04 | 288 | 291.329 | 289 |
| Total (mg) | 900 | 900 | 900 | 900 | 900 | 900 | 900 | 900 | 900 | 900 | 900 | 900 | 900 |
Table 4: Composition of empagliflozin immediate release part
| Empagliflozin (IR part) | |
| Empagliflozin | 5 |
| Crospovidone | 7.5 |
| PVK-30 | 9 |
| HPMC 15 CPS | 9 |
| Croscarmellose Sodium | 6 |
| Lactose anhydrous | 129 |
| MCCP | 130 |
| Mg. stearate | 1.8 |
| Aerosil | 1.8 |
| Yellow oxide of Iron | 0.9 |
| Total | 300 mg |
RESULTS AND DISCUSSION
Compatibility
IR spectra of the API and the API-excipient mixture were obtained under different conditions (fig. 1, 2, 3A-C). The spectrum from all the samples showed characteristic peaks at about 1100 cm-1 corresponding to the functional group Aromatic (C-F) stretch and 1650 cm-1 for (C=O) Stretch, C-H aliphatic at about 3059 – 2946 cm-1, and C-N stretching at about 1350 cm-1. The obtained spectra indicated that the principal IR peaks of the API were similar to those of the API-excipient mixture, confirming the compatibility of the API with various excipients. Detailed observations are provided in table 5.
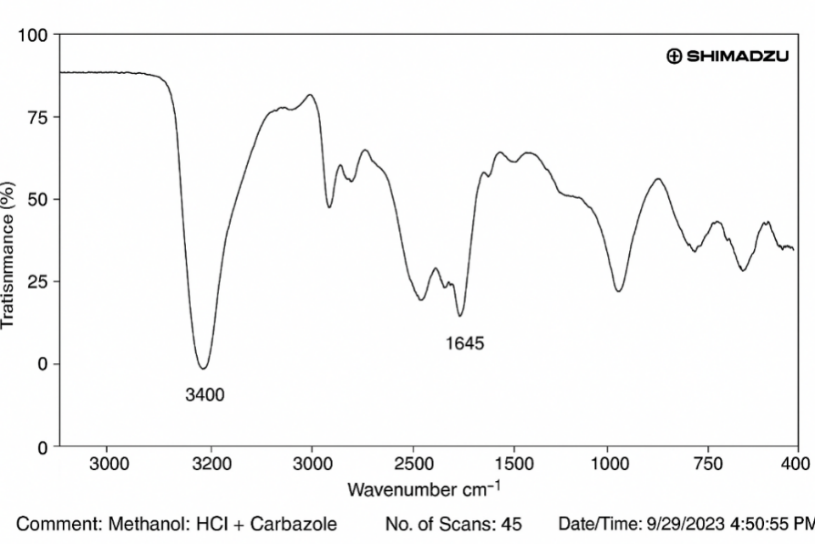
Fig. 1: Infrared (IR) spectrum of metformin HCl and carbopol at the initial stage
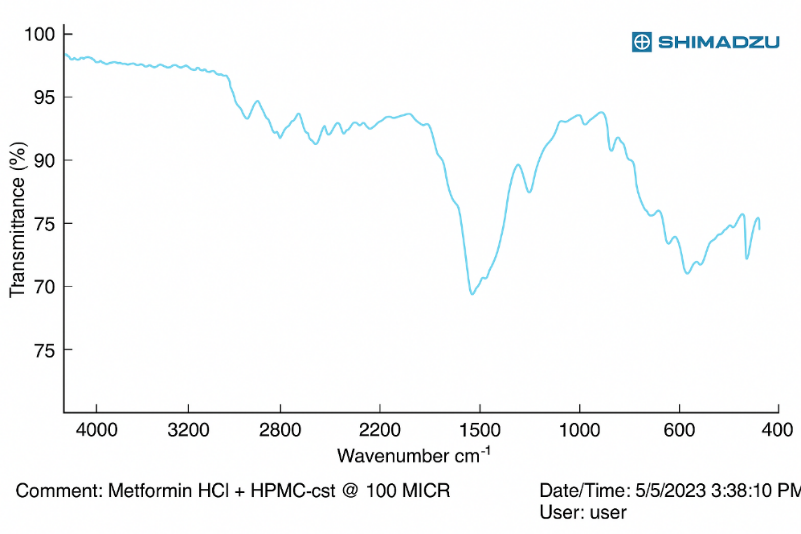
Fig. 2: IR spectrum of metformin HCl and HPMC K 100M at the initial stage
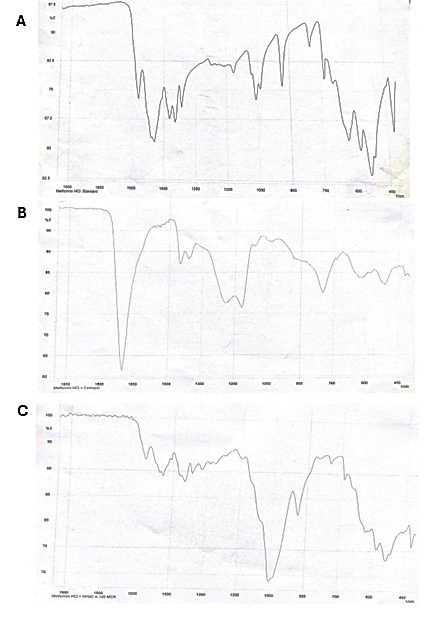
Fig. 3: IR spectra of API and API-excipient mixture after incubation for 6 mo at 40 °C and 75% relative humidity for 6 mo. A) Metformin HCl B) Metformin HCl with Carbopol971P C) metformin HCl with HPMCK100M
Table 5: Summary of IR peaks in compatibility study
| Functional group | Characteristic peak (cm⁻¹) pure drug | Metformin+carbopol (cm⁻¹) | Metformin+HPMC K100M (cm⁻¹) | Observation |
| N–H stretching (biguanide) | ~3360–3290 | ~3362 (no shift) | ~3358 (no shift) | Retained – no significant shift, suggesting hydrogen bonding unchanged |
| N–H bending (scissoring) | ~1620–1640 | ~1622 | ~1620 | Retained – peak position stable |
| C=N stretching (biguanide group) | ~1550–1570 | ~1552 | ~1551 | Retained – no new peak or disappearance |
| C–N stretching | ~1040–1070 | ~1041 | ~1043 | Slight shift (<5 cm⁻¹) – not significant |
Table 6: Pre-compression parameters for the metformin HCl granules
| Formulations | Bulk density g/ml | Tapped density g/ml | Hausner’s ratio | Carr’s Index (CI) |
Angle of repose (º) | Moisture content (%) |
| F1 | 0.404 | 0.531 | 1.164 | 14.556 | 30.7 | 3 |
| F2 | 0.372 | 0.525 | 1.153 | 13.33 | 32.9 | 2.9 |
| F3 | 0.39 | 0.51 | 1.122 | 10.909 | 35.09 | 2 |
| F4 | 0.409 | 0.51 | 1.122 | 10.909 | 32.537 | 2.9 |
| F5 | 0.357 | 0.49 | 1.137 | 12.069 | 31.84 | 2.4 |
| F6 | 0.366 | 0.49 | 1.132 | 11.666 | 30.11 | 2 |
| F7 | 0.35 | 0.475 | 1.15 | 13.114 | 32.37 | 2.6 |
| F8 | 0.377 | 0.508 | 1.142 | 12.5 | 33.384 | 2 |
| F9 | 0.337 | 0.446 | 1.142 | 12.5 | 30.54 | 2.1 |
| F10 | 0.322 | 0.444 | 1.155 | 13.461 | 27 | 2.1 |
| F11 | 0.322 | 0.434 | 1.152 | 13.207 | 29.59 | 2.6 |
| F12 | 0.327 | 0.444 | 1.143 | 12.369 | 35.79 | 2.3 |
| F13 | 0.312 | 0.416 | 1.166 | 14.285 | 30.96 | 2.5 |
Note. For granules, pre-compression parameters were calculated once before compression.
Pre-compression parameter results
Thirteen batches (F1 to F13) were prepared according to the experimental design for optimizing the HPMCK100M and Carbopol 971P concentrations (table 3). The granules were subjected to pre-compression parameters (table 6). Based on the observation, the bulk density ranges from 0.312 (F13) to 0.409 g/ml (F4), and the tapped density ranges from 0.416 (F13) to 0.531 g/ml (F1). Hausner’s ratio ranged from 1.122 (F3 and F4) to 1.166 (F13), Carr’s index ranged from 10.909 (F3 and F4) to 14.556 (F1). The angle of repose ranged from 27° (F10) to 35.79° (F12). Overall, for the metformin HCl granules, the values for Carr’s index and Hausner’s ratio were within the pharmacopeial limits (<16% and<1.25, respectively), indicating good flowability and compressibility. Similarly, the angle of repose was less than 40°, indicating an acceptable flow property. Finally, the moisture content was between 2% and 3% reflecting adequate drying.
Post compression parameters
The tablets were subjected to various post-compression parameters. The mean weight variation of the tablet for different formulations ranged between 1200.18±2.29 and 1203.14±1.85 mg, which was within the acceptable limit. Furthermore, the average hardness ranged from 19.583±0.705 to 23.183±0.714 kg/cm². The average range of dimensions of the tablet, i. e., thickness, was from 6.43±0.026 to 6.64±0.019 mm, width was from 9.51±0.018 to 9.532±0.018 mm, and length was from 21.08±0.011 to 21.113±0.048 mm. Assay was performed for Metformin and Empagliflozin. All assays for metformin in all the formulations were greater than 95%. The disintegration time for the Empagliflozin immediate-release portion was less than 7 min, and friability was less than 1%. Thus, all the formulations had acceptable post-compression parameters.
In vitro drug release
Data analysis and model validation
The response data (Y) fitted into the experimental design (table 8). After fitting the response data, the results were analyzed using ANOVA for various statistical parameters. Table 9 represents the ANOVA results and R2values for each response. value with p<0.05 are considered significant. The mean release values for empagliflozin across formulations ranged from 83% to 95%, as confirmed in table 8, indicating the rapid dissolution of the IR layer. For the empagliflozin immediate release tablet, not less than 75% of the drug is released in 45 min. These results, together with the disintegration time (<7 min) and assay (>95%), provide strong evidence that the empagliflozin portion of the bilayer tablet meets the requirements of an immediate-release formulation.
Table 7: Post-compression parameters for bilayer tablets
Formu lations |
Weight variation (n=20) |
Hardness (n=6) | Thickness (n=6) | Width (n=6) |
Length (n=6) |
Assay | Friab ility |
Disinte gration |
||||||
Mean (mg) |
SD | Mean (kg) |
SD | Mean (mm) |
SD | Mean (mm) |
SD | Mean (mm) |
SD | MET (%) |
EMPA (%) |
(%) | EMPA (min) |
|
| F1 | 1201.01 | 2.55 | 22.967 | 0.843 | 6.63 | 0.036 | 9.523 | 0.012 | 21.113 | 0.048 | 95.671 | 96.523 | 0.071 | 6.16 |
| F2 | 1200.747 | 2.4 | 21.833 | 1.274 | 6.64 | 0.019 | 9.517 | 0.01 | 21.1 | 0.017 | 99.652 | 98.325 | 0.098 | 6.45 |
| F3 | 1202.765 | 1.61 | 20.867 | 1.201 | 6.5 | 0.03 | 9.51 | 0.018 | 21.092 | 0.017 | 101.07 | 102.4 | 0.042 | 6.39 |
| F4 | 1200.18 | 2.29 | 22.767 | 0.689 | 6.49 | 0.052 | 9.518 | 0.016 | 21.085 | 0.012 | 97.169 | 96.865 | 0.013 | 6.31 |
| F5 | 1203.14 | 1.68 | 19.583 | 0.705 | 6.54 | 0.026 | 9.525 | 0.008 | 21.09 | 0.023 | 98.93 | 100.4 | 0.001 | 6.09 |
| F6 | 1201.06 | 2.4 | 23.183 | 0.714 | 6.5 | 0.024 | 9.53 | 0.011 | 21.087 | 0.015 | 95.864 | 96.646 | 0.02 | 6.13 |
| F7 | 1202.193 | 3.16 | 22.1 | 1.173 | 6.46 | 0.024 | 9.532 | 0.018 | 21.08 | 0.011 | 96.279 | 95.409 | 0.015 | 6.03 |
| F8 | 1203.14 | 1.85 | 20.867 | 1.467 | 6.43 | 0.026 | 9.525 | 0.008 | 21.095 | 0.019 | 96.142 | 95.973 | 0.021 | 6.16 |
| F9 | 1201.193 | 2.87 | 21.133 | 1.628 | 6.49 | 0.025 | 9.52 | 0.017 | 21.085 | 0.022 | 96.32 | 101.51 | 0.076 | 6.34 |
| F10 | 1202.193 | 3.16 | 22.783 | 0.9 | 6.51 | 0.032 | 9.518 | 0.016 | 21.095 | 0.018 | 97.65 | 94.663 | 0.043 | 6.47 |
| F11 | 1200.747 | 2.4 | 21.867 | 1.329 | 6.5 | 0.029 | 9.52 | 0.009 | 21.088 | 0.017 | 96.978 | 95.31 | 0.006 | 6.01 |
| F12 | 1202.765 | 1.61 | 21 | 1.23 | 6.53 | 0.028 | 9.528 | 0.012 | 21.09 | 0.011 | 98.215 | 94.304 | 0.026 | 6.06 |
| F13 | 1201.102 | 2.64 | 22.783 | 0.643 | 6.52 | 0.027 | 9.525 | 0.019 | 21.095 | 0.014 | 97.231 | 96.652 | 0.041 | 6.28 |
Note. For weight variation, the number of replicates (n)=20, for other post-compression parameters, n=6. Data format: mean of SD
Table 8: Observed responses in 2-Level factorial (Full factorial): Central composite design (CCD)and % release of empagliflozin in different formulations
| Formulation | Type | Independent variables (Polymers) | Mean % drug release (Metformin HCl) | Mean % drug release (Empagliflozin) | ||||
| HPMCK100 X1 | Carbopol 971P X2 | 1sth (Y1) | 6thh (Y2) | 10thh (Y3) | 12thh (Y4) | (60 min) | ||
| F1 | Center | 16.5 | 5 | 23.94 | 65.21 | 87.59 | 98.45 | 89.25 |
| F2 | Factorial | 14 | 3 | 16.66 | 66.95 | 84.7 | 95.44 | 85.55 |
| F3 | Center | 16.5 | 5 | 22.46 | 63.96 | 86.58 | 99.15 | 87.04 |
| F4 | Center | 16.5 | 5 | 24.32 | 68.96 | 89.11 | 98.86 | 83.25 |
| F5 | Factorial | 19 | 7 | 24.59 | 66.89 | 88.89 | 95.43 | 86.71 |
| F6 | Axial | 16.5 | 7.8 | 24.88 | 64.29 | 89.47 | 95 | 89.33 |
| F7 | Axial | 20.03 | 5 | 20.05 | 62.05 | 85.4 | 92.35 | 91.34 |
| F8 | Center | 16.5 | 5 | 22.41 | 66.25 | 88.1 | 96.93 | 83.11 |
| F9 | Center | 16.5 | 5 | 21.76 | 68.22 | 87.97 | 96.96 | 92.16 |
| F10 | Axial | 12.96 | 5 | 16.85 | 63.44 | 89.38 | 98.25 | 95.13 |
| F11 | Factorial | 19 | 3 | 16.29 | 62.98 | 81.35 | 91.47 | 85.86 |
| F12 | Axial | 16.5 | 2.17 | 15.8 | 63.85 | 80.02 | 92.09 | 84.24 |
| F13 | Factorial | 14 | 7 | 20.89 | 61.61 | 85.99 | 93.54 | 84.24 |
Note. n = 6 samples were analyzed from every formulation in this study and mean % drug release is tabulated.
For the drug release responses (Y), the R²,Adjusted R², and Predicted R²values were 0.9632, 0.9369, and 0.9312(Y1), 0.6607, 0.4183, and 0.0612(Y2), 0.9220,0.8320, and0.4737(Y3), and 0.8808, 0.7957, and 0.4390 (Y4). These results showed that the created models were statistically sufficient to predict the formulation responses. The Model for Y2 demonstrated moderate fit, accounting for 0.6607 variance; however, the models for Y1, Y3, and Y4 showed excellent predictive accuracy (R²>0.85).
Table 9: ANOVA result for prediction of % drug release employing HPMCK100M and carbopol 971P as polymers
| Source | Adjusted sum of squares | df | Adjusted mean square | F value | Pvalue |
| 1sth Drug release Y1(%) | |||||
| Model | 133.081 | 5 | 26.6163 | 36.66 | <0.0001 |
| Linear | 88.175 | 2 | 44.0875 | 60.73 | <0.0001 |
| X1 | 7.714 | 1 | 7.7136 | 10.62 | 0.014 |
| X2 | 80.461 | 1 | 80.4613 | 110.83 | <0.0001 |
| Square | 40.765 | 2 | 20.3827 | 28.08 | <0.0001 |
| X12 | 34.003 | 1 | 34.0033 | 46.84 | <0.0001 |
| X22 | 11.147 | 1 | 11.1474 | 15.35 | 0.006 |
| 2-Way Interaction | 4.141 | 1 | 4.1412 | 5.7 | 0.048 |
| X1* X2 | 4.141 | 1 | 4.1412 | 5.7 | 0.048 |
| Error | 5.082 | 7 | 0.726 | ||
| Lack-of-Fit | 0.281 | 3 | 0.0937 | 0.08 | 0.969 |
| Pure Error | 4.801 | 4 | 1.2002 | ||
| Total | 138.163 | 12 | |||
Regression equation of the fitted Model: Y1=-78.9+11.05 X1+1.39 X2-0.3537 X12-0.3165 X22+0.2035 X1* X2 R2=0.9632Adjusted R² = 0.9369, Predicated R² = 0.9312 |
|||||
| 6th h Drug release Y2 (%) | |||||
| Model | 42.7051 | 5 | 8.541 | 2.73 | 0.112 |
| Linear | 0.1353 | 2 | 0.0677 | 0.02 | 0.979 |
| X1 | 0.0538 | 1 | 0.0538 | 0.02 | 0.899 |
| X2 | 0.0816 | 1 | 0.0816 | 0.03 | 0.876 |
| Square | 21.1792 | 2 | 10.5896 | 3.38 | 0.094 |
| X12 | 17.5315 | 1 | 17.5315 | 5.59 | 0.05 |
| X22 | 5.9522 | 1 | 5.9522 | 1.9 | 0.211 |
| 2-Way Interaction | 21.3906 | 1 | 21.3906 | 6.83 | 0.035 |
| X1* X2 | 21.3906 | 1 | 21.3906 | 6.83 | 0.035 |
| Error | 21.934 | 7 | 3.1334 | ||
| Lack-of-Fit | 4.7478 | 3 | 1.5826 | 0.37 | 0.781 |
| Pure Error | 17.1862 | 4 | 4.2965 | ||
| Total | 64.6391 | 12 | |||
Regression equation of the fitted Model: Y2= 30.5+6.04 X1-5.37 X2-0.254 X12-0.231 X22+0.463 X1* X2 R2=0.6607Adjusted R² = 0.4183, Predicated R² = 0.0612 |
|||||
| 10th h Drug release Y3 (%) | |||||
| Model | 98.118 | 5 | 19.6236 | 12.89 | 0.002 |
| Linear | 66.192 | 2 | 33.096 | 21.73 | 0.001 |
| X1 | 4.619 | 1 | 4.6186 | 3.03 | 0.125 |
| X2 | 61.573 | 1 | 61.5735 | 40.43 | 0 |
| Square | 22.16 | 2 | 11.0802 | 7.28 | 0.02 |
| X12 | 1.401 | 1 | 1.4009 | 0.92 | 0.369 |
| X22 | 21.825 | 1 | 21.8249 | 14.33 | 0.007 |
| 2-Way Interaction | 9.766 | 1 | 9.7656 | 6.41 | 0.039 |
| X1* X2 | 9.766 | 1 | 9.7656 | 6.41 | 0.039 |
| Error | 10.66 | 7 | 1.5228 | ||
| Lack-of-Fit | 7.317 | 3 | 2.4389 | 2.92 | 0.164 |
| Pure Error | 3.343 | 4 | 0.8357 | ||
| Total | 108.778 | 12 | |||
Regression equation of the fitted Model: Y3= 81.1+0.5 X1+0.66 X2-0.0718 X12-0.443 X22+0.313 X1* X2 R2=0.9020Adjusted R² = 0.8320, Predicated R² = 0.4737 |
|||||
| 12th h Drug release Y4 (%) | |||||
| Model | 76.186 | 5 | 15.237 | 10.35 | 0.004 |
| Linear | 18.349 | 2 | 9.174 | 6.23 | 0.028 |
| X1 | 13.582 | 1 | 13.582 | 9.22 | 0.019 |
| X2 | 4.767 | 1 | 4.767 | 3.24 | 0.115 |
| Square | 49.252 | 2 | 24.626 | 16.72 | 0.002 |
| X12 | 15.613 | 1 | 15.613 | 10.6 | 0.014 |
| X22 | 39.26 | 1 | 39.26 | 26.66 | 0.001 |
| 2-Way Interaction | 8.585 | 1 | 8.585 | 5.83 | 0.046 |
| X1* X2 | 8.585 | 1 | 8.585 | 5.83 | 0.046 |
| Error | 10.309 | 7 | 1.473 | ||
| Lack-of-Fit | 5.842 | 3 | 1.947 | 1.74 | 0.296 |
| Pure Error | 4.467 | 4 | 1.117 | ||
| Total | 86.495 | 12 | |||
Regression equation of the fitted Model: Y4= 48.5+5.92 X1+1.49 X2-0.2397 X12-0.594 X22+0.293 X1* X2 R2=0.8808Adjusted R² = 0.7957, Predicated R² = 0.4390 |
Note: All regression models are presented in coded units for X₁ (HPMC K100M) and X₂ (Carbopol 971P). The coefficients are thus dimensionless, while the response (Y) remains expressed as % drug release. Y1: %Drug release at 1 h, Y2: %Drug release at 6 h, Y3: %Drug release at 10 h, Y4: %Drug release at 12 h, X1:HPMCK100M, X2: Carbopol 971P
Data analysis of 1sth (Y1)
The mathematical relationships for the measured responses derived from the statistical design in the form of polynomial equationsare:
Y1=-78.9+11.05 X1+1.39 X2-0.3537 X12-0.3165 X22+0.2035 X1*X2
where, Y1 (%): %Drug release at 1 h, X1:HPMCK100M, X2: Carbopol 971P
According to the regression equation for the 1st hour, both HPMCK100M (X1) and Carbopol 971P (X2) have a positive impact on drug release. Compared to Carbopol 971P (1.39), HPMCK100M exhibits a more substantial linear effect (11.05). The negative quadratic terms imply that release is decreased when either polymer is increased past a particular point. A synergistic effect between the two polymers is shown by a positive interaction (+0.2035). Similarly, drug release is effectively enhanced when both excipients are in an ideal balance. According to surface regression analysis(table 9), Carbopol 971P had the most significant impact (p<0.0001), while HPMC K100 M’s linear effect was relatively weaker despite being significant (p = 0.014). At higher polymer concentrations, non-linear and combined effects were indicated by the significant quadratic terms (X12: p<0.0001; X22: p = 0.006) and the interaction term (X1X2:p = 0.048). Similar results were obtained by Acharya et al. (2014) and Vueba et al., where Carbopol showed stronger gel matrices and had a greater impact on early drug release, whereas high-viscosity HPMC grades, such as K100M, delayed early release [13, 14].
The contour plot revealed that both HPMC and Carbopol 971P polymers positively affect drug release within the first hour, with drug release increasing as the concentration of both polymers rises (fig. 4A). Carbopol 971P plays a dominant role in enhancing 1st h drug release, while HPMC K100M contributes up to an optimal concentration.
Pareto Chart of the Standardized Effects at 1st h (fig. 4B) showedthat Carbopol 971P has the most potent effect on the 1st h release as its standardized effect is above the red line (critical t-value = 2.36), indicating statistical significance. AA (quadratic term of HPMC K 100M) and BB (quadratic term of Carbopol 971P) also have a moderate effect. HPMCK100M and AB (interaction between A and B) have a minor or insignificant impact (below the red line). Thus, at 1st h, formulations containing Carbopol exhibited a noticeable effect on drug release, likely due to its rapid swelling and viscosity-building behavior. In contrast, HPMC K100M did not significantly influence release at this stage, which may be attributed to its delayed gel formation characteristics. These findings align with the known swelling kinetics of Carbopoland the time-dependent matrix behavior of HPMC. Thus, the regression and Pareto outcomes are fully supported by physical matrix behavior observed in controlled-release formulations.
Data analysis of 6th h (Y2)
The fitted model’s equation is:
Y2= 30.5+6.04 X1-5.37 X2-0.254 X12-0.231 X22+0.463 X1* X2
where, Y2 (%): %Drug release at 6 h, X1:HPMCK100M, X2: Carbopol 971P
Following time-dependent gel strength and interaction effects, Carbopol 971P had a greater impact at the 1st h, but HPMC’s contribution increased over time. Contour Plot of 6 h vs. Carbopol 971P and HPMC K 100M (fig. 4C) showed that HPMC K100M has a more substantialsustained release effect compared to Carbopol at 6 h.
The Pareto Chart (fig. 4D) showed that the interaction between HPMCK100M (A) and Carbopol is a substantial and sustained statistically significant factor (critical t-value 2.365). The quadratic terms AA and BB have a moderate influence but arenot statistically significant. The main effects of A (HPMC K 100M) and B (Carbopol) are minimal and insignificant. Thus, at the 6thh, a synergistic interaction between HPMC K100M and Carbopol appears to influence the drug release behavior. Such a drug release profile can be attributed to the complete hydration and gel formation of both polymers, resulting in a more cohesive and retentive matrix structure, which leads to a more sustained and controlled release compared to individual polymers alone. Similar findings were obtained by Li et al., in which the authors showed that the interactions between Carbopol and HPMC dramatically alter the swelling and release kinetics in hydrophilic matrix tablets [15].
It should be noted that, based on the regression model for the 6-h release, the coefficient of determination (R² = 0.6607) is lower, which is not statistically significant (p = 0.112). This is a major limitation of the article. Similarly, it should be noted that the regressionmodel for Y2 was weaker, with only the interaction term reaching significance (p = 0.035) and the X12 term on the borderline of significance (p = 0.05). However, we retained this time point, considering the clinical relevance of the 6 h drug release of the Metformin sustained-release formulation. Similarly, the lack-of-fit test (table 9) was not significant (p = 0.781), indicating that, despite the low predictive power, the observed data did not deviate significantly from the model. Finally, the multi-response integration includes all four points, which diminishes the overall effect of any single point.
Data analysis for 10th h (Y3)
The fitted model’s equation for the 10th h drug release is:
Y3= 81.1+0.5 X1+0.66 X2-0.0718 X12-0.443 X22+0.313 X1* X2
where, Y3 (%): %Drug release at 10 h, X1:HPMCK100M, X2: Carbopol 971P
The Contour Plot of drug release at the 10th h vs. Carbopol and HPMC K 100M (fig. 4E) showed that both HPMC K100M and Carbopol contribute to sustained drug release at this time. However, HPMC K100M shows a more consistent enhancing effect, while Carbopol’s effect is optimal at moderate levels.
Pareto Chart (fig. 4F) showedthat Carbopol has the highest and statistically significant effect (critical t-value: 2.365). BB (the Quadratic term of Carbopol) and AB (the interaction of HPMC and Carbopol) also showed a moderate impact but were not statistically significant. A (HPMC K 100M) and AA (Quadratic of HPMC) have minimal effects. At 10 h, Carbopol concentration alone (B) is the most dominant factor in controlling drug release. These findings are consistent with optimization experiments by Roy et al. [16] on Metformin HCl matrix tablets, where the gel strength of Carbopol considerably inhibited drug diffusion at later time points, supporting the notion that it was predominant at 10 h.
Data analysis of 12th h (Y4)
The fitted model’s equation for 12th h drug release is:
Y4= 48.5+5.92 X1+1.49 X2-0.2397 X12-0.594 X22+0.293 X1* X2
where, Y4 (%): %Drug release at 12 h, X1:HPMCK100M, X2: Carbopol 971P
The contour plot (fig. 4G) illustrates that the combined concentrations of HPMC K100M and Carbopol significantly influenced drug release at the 12th h. A maximal release (>97.5%) was observed in the central region of the plot, specifically where HPMC ranged from 15% to 16% and Carbopol ranged from 4.5% to6%. Beyond these optimal ranges, either an excess of HPMC or a deficiency in Carbopol resulted in suboptimal release (<90%).
The release at the 12th h is most influenced by the non-linear effect of Carbopol, followed by the non-linear and linear effects of HPMC K100M. The quadratic effect of Carbopol (BB) had the most substantial influence on 12th h drug release, followed by the quadratic and linear effects of HPMC K100M (AA and A, respectively) (fig. 4H). While HPMC showed both linear and non-linear contributions, Carbopol’s linear effect (B) was not statistically significant. The interaction between HPMC and Carbopol (AB) also did not significantly affect the release profile. Similar results were obtained by Deb et al. [17]. In the study, higher Carbopol concentrations significantly retardedthe early release of drug from Metformin-loaded microspheres, while increasing HPMC concentration produced a more subtle delay [18].
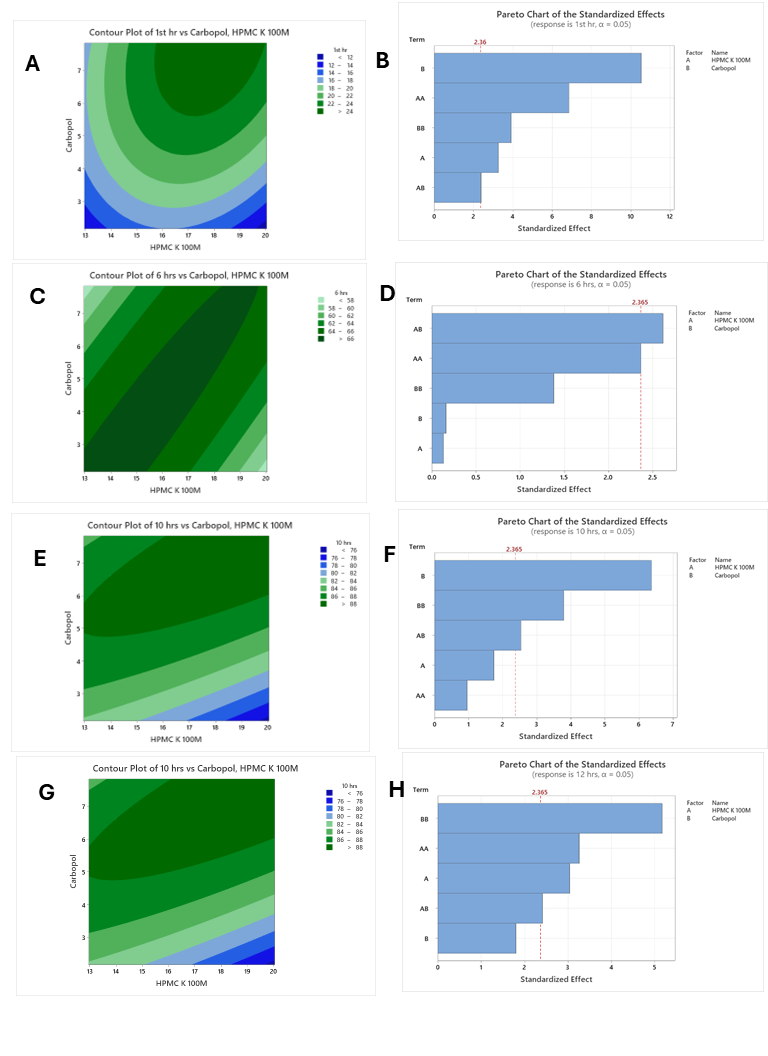
Fig. 4: A, C, E, G contour plot for drug release v/s Polymer concentration at 1,6,10, and 12 h, respectively. B, D, F, H pareto chart for % drug release v/s Polymer concentrations at 1, 6, 10, and 12 h, respectively
In line with earlier factorial design investigations in sustained-release formulations, the contour plots clearly show the interactive influence of HPMC K100M and Carbopol 971P concentrations on drug release duration [18].
HPMC K100M has the greatest impact on the release profile, above the statistical threshold, according to Pareto charts, which is consistent with RSM-based optimization studies [19].
Formulation optimization
For formulation optimization, the influence of each dependent variable on the response was investigated. A desirability function was simultaneously optimized for all four responses (Y1-Y4). The goal was set for each response: Y1:15-25%, Y2:50-70%, Y3:80-90% and Y4:90-100%. The final optimized formula was established using response surface methodology (fig. 5), and the concentration of polymer for the desired response is tabulated in table 10.
Pre-compression and post-compression properties of optimized formulation
The optimized formulation was subjected to the same pre-and post-compression parameters as mentioned previously for the different formulations.
Table 10: Polymer concentration in optimized formulation
| Factor | Low | High | Optimum |
| HPMC K100M | 12.96 | 20.03 | 17.9 |
| Carbopol 971P | 2.17 | 7.28 | 3.8 |
The Optimized tablet was prepared using the optimum concentrations of the polymer. The physicochemical parameters and assay were evaluated.
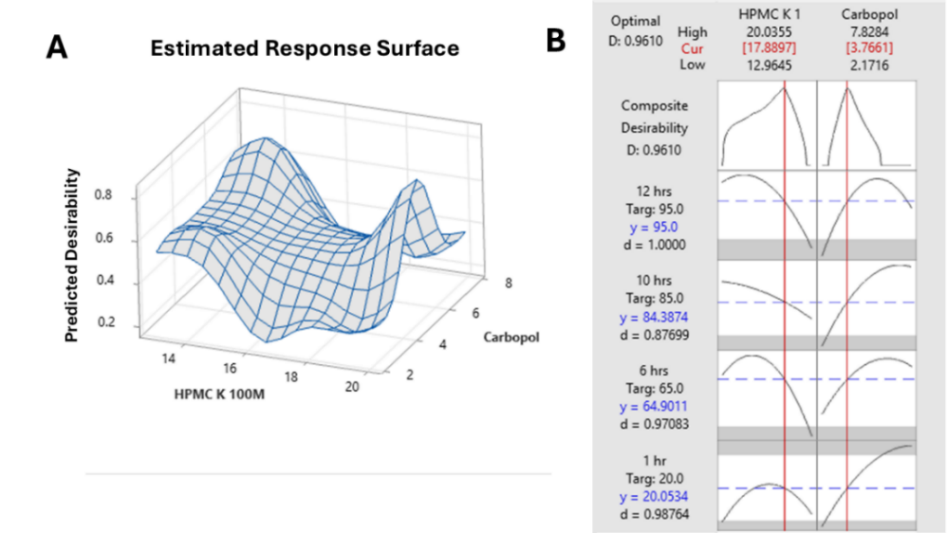
Fig. 5: A) Response surface Plot. B) Response optimization: 12, 10, 6, and 1st h drug release
Table 11: Pre-compression and post-compression properties of optimized formulation
| Precompression parameters | Bulk density (g/ml) | Tapped density (g/ml) | Moisture content (%) | ||||||
| Optimized formulation | 0.58±0.13 | 0.62±0.11 | 2.16±0.84 | ||||||
| FO | |||||||||
| Post-compression parameters | |||||||||
| Optimized formulation | Wt. variation (mg) n=20 |
Hardness (kg) n=6 |
Thickness (mm) n=6 |
Width (mm) n=6 |
Length (mm) n=6 |
Friability (%) n=8 |
Disintegration time (min) n=6 | Assay (%) n=20 |
Content uniformity (%) n=10 |
| FO | 1200.73 | 21.33 | 6.43 | 9.53 | 21.08 | 0.23 | 6.26 | MET: 95.27 EMPA: 96.00 | 98.23 |
Note. For precompression parameters were analyzed once before compression. For post compression parameters weight variation was done in 20 tablets. (n=20), For hardness, thickness, dimensions and disintegration time; 6 tablets were used.(n=6). For the Assay calculation, 20 tablets and for content uniformity 10 tablets are used.
In vitro drug release study of optimized formulation
The in vitro drug release study of the optimized formulation was conducted (fig. 6) and compared with the predicted average percentage of drug release from the CCD (table 12).
The optimized drug release and the observed values of the improved formulation were compared statistically using the Chi-Square test. The chi-square goodness of fit test was conducted to compare the average percentage with the predicted average release of the optimized formulation. Since the calculated value (χ² = 0.436, df=3) is less than the critical value (χ² critical = 7.815) at a 5% level of significance, we accept the null hypothesis. This indicates that there is no statistically significant difference between the observed and predicted release values. Consequently, it suggests that the optimized formulation closely follows the predicted release profile, thereby validating the predictive model utilized. The predicted errors were within acceptable bounds when compared to the observed values from the optimized batch. The optimized drug release and the observed values of the improved formulation were compared for similarity factors using the following equation.
Similarity factor (f2) = 50. log ( ),
),
where n=4
According to these findings,the calculated similarity factor was 82.54 (between 50 and 100), indicating that the observed and predicted dissolution profiles are similar. Thus, the drug release behavior of the extended-release formulation could be expected both statistically and practically using the response surface methodology (RSM) employed for optimization.
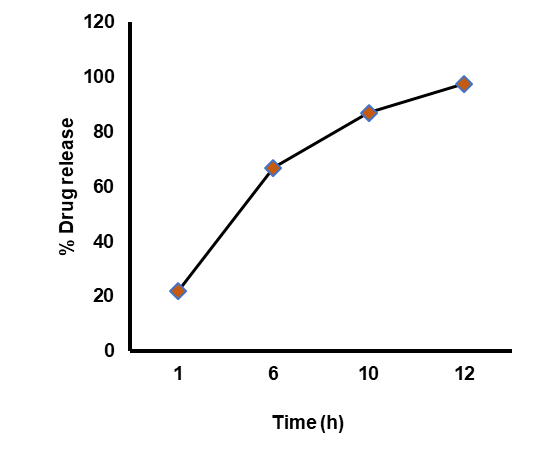
Fig. 6: In vitro drug release of optimized formulation
Table 12: Comparison of predicted and observed responses
Time interval (hour) |
Avg. release of optimized formulation % (O) | Predicted avg. release % (E) |
O-E | (O-E)2 | (O-E)2/E | Similarity (f2) |
| 1 | 22.08 | 20.04 | 2.04 | 4.1616 | 0.207 | |
| 6 | 67.02 | 64.9 | 2.12 | 4.4944 | 0.069 | |
| 10 | 87.06 | 84.378 | 2.682 | 7.194 | 0.085 | 82.54 |
| 12 | 97.52 | 97.863 | -0.343 | 0.1176 | 0.074 | |
 |
χ2=0.436 |
Table 13: Correlation coefficients for release data of metformin HCl after fitting into different release kinetic models
| Formulations | Zero order (R2) | First order (R2) | Higuchi model (R2) | Peppas model (R2) |
| F1 | 0.8921 | 0.9855 | 0.984 | 0.9985 |
| F2 | 0.8204 | 0.978 | 0.996 | 0.9988 |
| F3 | 0.8666 | 0.9667 | 0.9916 | 0.9997 |
| F4 | 0.896 | 0.9645 | 0.9847 | 0.999 |
| F5 | 0.9087 | 0.9941 | 0.9716 | 0.9935 |
| F6 | 0.835 | 0.9772 | 0.995 | 0.9991 |
| F7 | 0.8672 | 0.9802 | 0.9906 | 0.9994 |
| F8 | 0.9416 | 0.9738 | 0.9642 | 0.9981 |
| F9 | 0.906 | 0.992 | 0.9674 | 0.9896 |
| F10 | 0.8948 | 0.9789 | 0.9844 | 0.9991 |
| F11 | 0.8576 | 0.9869 | 0.9892 | 0.997 |
| F12 | 0.9008 | 0.9912 | 0.9696 | 0.9901 |
| F13 | 0.8359 | 0.9673 | 0.9927 | 0.9969 |
| FO | 0.8671 | 0.9813 | 0.9897 | 0.9986 |
The release data of the optimized formulations were fitted into four different mathematical models: zero-order, first-order, Higuchi model, and Peppas model. The curve-fitting data for different formulations, including zero-order, first-order, Higuchi, and Peppas models, are shown in table 13. Several kinetic models were used to examine the in vitro drug release data of the optimized Metformin HCl extended-release tablet. Out of all of them, the Korsmeyer–Peppas model showed the best correlation (R2 = 0.998), suggesting a combination process of drug diffusion and polymer matrix relaxation. This indicates that the drug release followed anomalous (non-Fickian) transport.
Diffusion plays a significantrole in the release process, as supported by the good fit of the Higuchi model (R² = 0.9897) and the First-order model (R² = 0.9813). On the other hand, the Zero-order model (R2 = 0.8671) was the least appropriate, suggesting that the release fluctuated with time (table 14).
Table 14: Release kinetic parameters of optimized formulation
| Model | Parameters |
| Zero order | K0 (h-1) = 0.2087, R2=0.8671 |
| First order | K1 (h-1) = 0.248, R2=0.9813 |
| Higuchi | KH (h-1/2) = 27.56, R2=0.9897 |
| Korsemeyer-Peppas | Kkp (hn)= 23.16, n=0.5791, R2=0.998 |
As matrix-forming agents, HPMC K100M and Carbopol 971P were used to alter the release profile of metformin HCl. Water causes HPMC K100M, a hydrophilic polymer, to swell and create a gel layer that functions as a diffusion barrier, regulating the rate at which the medicine is released through the hydrated matrix. In addition to improving matrix integrity, the cross-linked polyacrylic acid polymer Carbopol 971P also influences the dynamics of erosion and swelling in the tablet system. Simultaneous drug diffusion, polymer swelling, and water penetration define the complex release environment produced by the combined use of these polymers. The assumptions of the Korsmeyer–Peppas model, which is ideal for examining drug release from systems displaying non-Fickian (anomalous) transport behavior, align with this complex mechanism [20].
CONCLUSION
To effectively control type 2 diabetes mellitus (T2DM), the current study focuses on the development and assessment of a bilayer tablet comprising Empagliflozin immediate-release (IR) and Metformin HCl extended-release (ER). Carbopol 971P and HPMC K 100M were used to create an extended-release matrix tablet containing metformin HCl. Using response surface methods, the formulations’ dependent variables, the amounts of HPMC K 100M and Carbopol 971P, were tuned to achieve predetermined drug release at predetermined time intervals. The wet granulation method was employed to formulate the Metformin HCl extended-release layer, which incorporated hydrophilic polymers such as HPMC K100M and Carbopol to control the drug’s release over 12 h. Conversely, the direct compression approach was used to manufacture the Empagliflozin immediate release layer, ensuring immediate drug availability upon administration. No signs of a chemical interaction between the excipients and the API were found. The pre-compression and post-compression parameters of the bilayer were measured. With a high correlation coefficient (R² = 0.9986), the Korsmeyer–Peppas model provided the best fit to the metformin HCl release kinetics data. For cylindrical matrix systems, a release exponent (n) value ranging from 0.45 to 0.89 indicates anomalous transport, suggesting a combination of drug diffusion through the hydrated matrix and polymer relaxation or erosion mechanisms. Thus, a non-Fickian transport was indicated by the release exponent (n), which was determined to be 0.5791. The Korsmeyer–Peppas constant (Kkp = 23.16%/hⁿ) serves as a scaling factor dependent on both the extent of drug release and the exponent n.
Thus, we successfully prepared a bilayer tablet forsustained-release metformin and immediate-release empagliflozin. This work presents how experimental design and mechanistic modeling can be integrated to aid in the development of bilayer tablet formulations, contributing to the existing pool of knowledge in this field.
FUNDING
Nil
AUTHORS CONTRIBUTIONS
B. B. experimented and conceived the original idea. B. B. and P. S. wrote the manuscript with support from A. S. A. L. supervised the project. A. L. also conceived the original idea, providing oversight throughout.
CONFLICT OF INTERESTS
Declared none
REFERENCES
International Diabetes Federation. Over 250 million people worldwide are unaware they have diabetes according to new IDF research. Brussels (BE): International Diabetes Federation; 2025 Aug 11. Available from: https://idf.org/news/idf-diabetes-atlas. [Last accessed on 07 Oct 2025].
Dutta S, Shah RB, Singhal S, Dutta SB, Bansal S, Sinha S. Metformin: a review of potential mechanism and therapeutic utility beyond diabetes. Drug Des Devel Ther. 2023;17:1907-32. doi: 10.2147/DDDT.S409373, PMID 37397787.
Rena G, Hardie DG, Pearson ER. The mechanisms of action of metformin. Diabetologia. 2017;60(9):1577-85. doi: 10.1007/s00125-017-4342-z, PMID 28776086.
Neumiller JJ. Empagliflozin: a new sodium-glucose co-transporter 2 (SGLT2) inhibitor for the treatment of type 2 diabetes. Drugs Context. 2014;3:212262. doi: 10.7573/dic.212262, PMID 24991224.
Hasan I, Rashid T, Jaikaransingh V, Heilig C, Abdel Rahman EM, Awad AS. SGLT2 inhibitors: beyond glycemic control. J Clin Transl Endocrinol. 2024;35:100335. doi: 10.1016/j.jcte.2024.100335, PMID 38525377.
Blonde L, Dipp S, Cadena D. Combination glucose lowering therapy plans in T2DM: case-based considerations. Adv Ther. 2018;35(7):939-65. doi: 10.1007/s12325-018-0694-0, PMID 29777519.
Hu J, Zou P, Zhang S, Zhou M, Tan X. Empagliflozin/metformin fixed-dose combination: a review in patients with type 2 diabetes. Expert Opin Pharmacother. 2016;17(18):2471-7. doi: 10.1080/14656566.2016.1258062, PMID 27819159.
Hadjadj S, Rosenstock J, Meinicke T, Woerle HJ, Broedl UC. Initial combination of empagliflozin and metformin in patients with type 2 diabetes. Diabetes Care. 2016;39(10):1718-28. doi: 10.2337/dc16-0522, PMID 27493136.
Bu Y, Peng M, Tang X, Xu X, Wu Y, Chen AF. Protective effects of metformin in various cardiovascular diseases: clinical evidence and AMPK-dependent mechanisms. J Cell Mol Med. 2022;26(19):4886-903. doi: 10.1111/jcmm.17519, PMID 36052760.
Deepika Gupta, Manju Pandey, Anup Maiti, Neelkanth M Pujari. Bilayer tablet technology: a concept of immediate and controlled drug delivery. J Pharm Negat Results. 2023;14(1):503-12. doi: 10.47750/pnr.2023.14.S01.59.
Patel D, Patel A, Solanki T. Formulation and evaluation of bilayer tablet by using melt granulation technique for treatment of diabetes mellitus. J Pharm Bioallied Sci. 2012;4(Suppl 1):S37-9. doi: 10.4103/0975-7406.94135, PMID 23066199.
Chinta R, Pilli R. Formulation design of empagliflozin and metformin hydrochloride extended-release tablets: optimization of formulation using statistical experimental design. Int J Pharm Sci Res. 2020;11(12):6434-47. doi: 10.13040/IJPSR.0975-8232.11(12).6434-47.
Acharya S, Patra S, Pani NR. Optimization of HPMC and carbopol concentrations in non-effervescent floating tablet through factorial design. Carbohydr Polym. 2014;102:360-8. doi: 10.1016/j.carbpol.2013.11.060, PMID 24507292.
Vueba ML, Batista de Carvalho LA, Veiga F, Sousa JJ, Pina ME. In vitro release of ketoprofen from hydrophilic matrix tablets containing cellulose polymer mixtures. Drug Dev Ind Pharm. 2013;39(11):1651-62. doi: 10.3109/03639045.2012.729146, PMID 23094867.
Li S, Lin S, Daggy BP, Mirchandani HL, Chien YW. Effect of HPMC and carbopol on the release and floating properties of gastric floating drug delivery system using factorial design. Int J Pharm. 2003;253(1-2):13-22. doi: 10.1016/S0378-5173(02)00642-7, PMID 12593933.
Roy A, Roy K, Roy S, Deb J, Ghosh A, Ali KA. Response surface optimization of sustained release metformin-hydrochloride matrix tablets: influence of some hydrophillic polymers on the release. ISRN Pharm. 2012 Sep 4;2012:364261. doi: 10.5402/2012/364261, PMID 22988527.
Deb J. Formulation and evaluation of carbopol microspheres of metformin HCl. Asian J Biomed PharmSci. 2011;1(2):11-9.
Patel H, Patel J, Patel M. Formulation optimization of metformin HCl matrix tablets using hydrophilic polymers. Int J Curr Res Rev. 2021;13(6):45-52.
Singh R, Kumar A. Design and optimization of sustained release matrix tablets of metformin using response surface methodology. Int J Pharm Pharm Sci. 2020;12(2):88-94.
Sharma P, Verma S. Optimization of HPMC and carbopol concentrations in floating tablets using factorial design. Asian J Pharm Clin Res. 2019;12(3):110-5.