
Int J App Pharm, Vol 18, Issue 2, 2026, 160-172Original Article
FORMULATION AND OPTIMIZATION OF FLOATING SUSTAINED RELEASE TABLETS OF RITONAVIR THROUGH BOX-BEHNKEN DESIGN
BALIJEPALLI MURALI KRISHNA1,2*, CHANDRA SEKHAR PATRO1, CH. TARAKA RAMARAO3
1Department of Pharmaceutics, Centurion University of Technology and Management, Odisha, India. 2Department of Pharmaceutics, Sri Sivani College of Pharmacy, Chilakapalem, Srikakulam, Andhra Pradesh-532410, India. 3Department of Pharmaceutics, Sri Venkateswara College of Pharmacy, Etchrela, Srikakulam, Andhra Pradesh-532410, India
*Corresponding author: Balijepalli Murali Krishna; *Email: muralimk242@gmail.com
Received: 25 Aug 2025, Revised and Accepted: 08 Jan 2026
ABSTRACT
Objective: The purpose of this study is to design and evaluate floating sustained-release tablets of ritonavir (RTZ) employing box-behnken development (BBD).
Methods: The BBD was utilized to improve the formulation parameters. The main release-retarding polymers were selected as independent variables: methocel K100M (A), the gas-generating agent was sodium bicarbonate (B), the secondary release-retarding polymer was ethyl cellulose (C), and the floating aid was Cetyl alcohol and which was kept constant. Floating lag time (FLT) (Y1), swelling index (SI) (Y2), and percentage drug release (Y3) were chosen as the dependent variables. Differential scanning calorimetry (DSC) and fourier transform infrared spectroscopy (FTIR) were used to assess the compatibility of the drug and excipient. FLT, flotation time, SI, hardness, drug content, friability, in vitro drug release, and drug release kinetics were assessed after the tablets were manufactured using the direct compression method.
Results: FTIR and DSC analyses showed no interaction between the drug and the excipients. Every tablet that was tested produced positive outcomes. The validated optimized (VO) tablets exhibited zero-order kinetics, with a steady and sustained drug release over 12 h (95.76±0.75 %), FLT of VO formulation was found to be 53±0.5 sec with 91.21±1.6% of SI. In vivo bioavailability of optimized formulation shows a 1.5-fold increase in bioavailability.
Conclusion: Using a statistical optimization model, the optimized tablets with the desired formulation characteristics were identified. The optimized formulation remarkably maintained the drug release for up to 12 h, suggesting improved therapeutic potential for HIV therapy.
Keywords: Floating time, FTIR, DSC, Optimization, Sustained release
© 2026 The Authors.Published by Innovare Academic Sciences Pvt Ltd. This is an open access article under the CC BY license (https://creativecommons.org/licenses/by/4.0/)
DOI: https://dx.doi.org/10.22159/ijap.2026v18i2.56631 Journal homepage: https://innovareacademics.in/journals/index.php/ijap
INTRODUCTION
The gastro-retentive drug delivery system (GRDDS) is designed to retain the drug in the gastrointestinal tract (GIT), specifically in the stomach, for an extended period. In the commercialization of novel drug entities, complexities have increased substantially; consequently, considerable attention has been directed towards the improvement of sustained or controlled drug delivery systems (CRDDS). The primary objective of designing a sustained drug release system is to reduce the dosing frequency or enhance the drug's efficacy by localizing it at the target site, thereby providing uniform drug delivery. Certain limitations in the oral drug delivery system must be overcome using GRDDS [1-3]. In addition to the continuous release of drugs to the small intestine, GRDDS offers several advantages, including a) Achievement of a prolonged therapeutic effect; b) Reduction in the frequency of drug dosing; c) Effective treatment for proximal gastric disorders [4].
RTZ is an HIV protease inhibitor used in combination with other antivirals in the treatment of HIV infection. After a single oral dosage, the half-life is three to five hours. Choosing the right medicine and delivery method is essential to a therapy's effectiveness [5]. The purpose of controlled-release dosage forms is to resolve RTZ's biopharmaceutical challenges, such as poor solubility, limited bioavailability, and a short absorption window are resolved when it is combined with a GRDDS. This ensures that the drug remains in the optimal absorption site (upper GIT) for a longer period of time, improving therapeutic performance. RTZ is therefore selected as an ideal candidate for the gastric floating release drug delivery method [6].
The Floating tablets offer a novel strategy for improving RTZ pharmacokinetics by avoiding premature drug release into the intestine and keeping it in the acidic gastric environment for a longer period [7], hence enhancing drug absorption. Sustained-release floating matrix tablet formulations address major issues in HIV treatment, such as medication resistance, adherence, and side effects induced by changing drug levels, so we may expect high patient compliance [8, 9]. Floating tablets were developed with a unique formulation to ensure sustained drug release and optimized buoyancy characteristics. To optimize the formulation parameters for floating tablets of RTZ, BBD was used. BBD proved to be a robust tool for optimizing formulation parameters and assessing the effects of formulation components on the efficacy of RTZ gastro-retentive sustained-release floating tablets [10-12].
MATERIALS AND METHODS
Materials
RTZ was provided by Laurus Private Ltd, Visakhapatnam. Sodium hydrogen carbonate, methocel K100M, EC, and supratab 11 SD were obtained from Merck Life Science Pvt. Ltd., Mumbai. Further, cetyl alcohol, talc, hydrochloric acid, and magnesium stearate were obtained from Yarrow Chem Products, Mumbai.
Methods
The tablets were prepared by the direct compression method and the BBD as the basis for the experimental design shown in table 1. Seventeen formulations of RTZ tablets have been formulated employing different combinations of matrix-forming agents (methocel K100M, ethyl cellulose), filler (SUPRATAB 11 SD), gas-generating agents (sodium bicarbonate), cetyl alcohol as a floating assistance, talc as a glidant, and magnesium stearate as a lubricant. All of the materials were weighed precisely following the formula and combined in symmetrical proportions with a pestle and mortar. The resulting mixture has been filtered through a sieve 80 and properly stirred in a polythene bag. The powdered blend was then mixed with talc and magnesium stearate and subsequently compacted into a tablet using a tablet press machine Mini-8 D [13, 14].
Table 1: Formulae of RTZ floating sustained-release tablets
Ingredients (mg) |
F1 | F2 | F3 | F4 | F5 | F6 | F7 | F8 | F9 | F10 | F11 | F12 | F13 | F14 | F15 | F16 | F17 | VO |
| RTZ | 100 | 100 | 100 | 100 | 100 | 100 | 100 | 100 | 100 | 100 | 100 | 100 | 100 | 100 | 100 | 100 | 100 | 100 |
| EC | 45 | 50 | 40 | 45 | 45 | 40 | 50 | 45 | 50 | 45 | 40 | 45 | 40 | 45 | 50 | 45 | 45 | 50 |
| Sodium bicarbonate | 30 | 30 | 30 | 30 | 25 | 30 | 35 | 30 | 25 | 30 | 25 | 35 | 35 | 25 | 30 | 30 | 35 | 33.38 |
| Methocel K100M | 72.5 | 65 | 65 | 72.5 | 65 | 80 | 72.5 | 72.5 | 72.5 | 72.5 | 72.5 | 80 | 72.5 | 80 | 80 | 72.5 | 65 | 80 |
| Cetyl alcohol | 15 | 15 | 15 | 15 | 15 | 15 | 15 | 15 | 15 | 15 | 15 | 15 | 15 | 15 | 15 | 15 | 15 | 15 |
| Supratab 11 SD | 27.5 | 30 | 40 | 27.5 | 40 | 25 | 17.5 | 27.5 | 27.5 | 27.5 | 37.5 | 15 | 27.5 | 25 | 15 | 27.5 | 30 | 11.62 |
| Talc | 5 | 5 | 5 | 5 | 5 | 5 | 5 | 5 | 5 | 5 | 5 | 5 | 5 | 5 | 5 | 5 | 5 | 5 |
| Mg Stearate | 5 | 5 | 5 | 5 | 5 | 5 | 5 | 5 | 5 | 5 | 5 | 5 | 5 | 5 | 5 | 5 | 5 | 5 |
| Total Weight of tab (mg) | 300 | 300 | 300 | 300 | 300 | 300 | 300 | 300 | 300 | 300 | 300 | 300 | 300 | 300 | 300 | 300 | 300 | 300 |
Experimental design
In this design, a statistical approach employing BBD with (3x3, i. e., three factors at three levels given in table 2) has been used to analyze the primary, interaction, and quadratic effects of independent variables on the dependent variables. A second-order polynomial equation was generated using Design-Expert software (Version 13, Stat-Ease Inc., USA) to facilitate statistical optimization of formulation variables. This method was selected intentionally instead of the central composite design because it requires fewer experiments to be conducted to carry out an adequate analysis of the effects of three variables. The design matrix had 17 runs of experiments, which provided a sequential analysis of the formulation factors and their impact on the product. The release-retarding polymer methocel K100M (Factor A), the gas-generating agent sodium bicarbonate (Factor B), and the secondary release-retarding polymer ethyl cellulose (Factor C) were chosen. Factors A, B, and C were identified as independent variables. In this design, factors A, B, and C were designated as independent variables, while three response variables, FLT (Y₁), SI (Y₂), and percentage drug release (Y₃), were selected as the dependent variables. Model evaluation parameters, including the coefficient of variation (CV), coefficient of determination (R²), adjusted R², predicted R² (Pred. R²), adequate precision, optimization, along desirability, have been analyzed using Design-Expert software to identify the best-fit model.
The primary objectives were to maximize drug release (85–95% over 12 h), minimize FLT (<2 min), and maintain the SI within an ideal range (150–250%). Adequate buoyancy and prolonged drug release without rapid breakdown are guaranteed within this range. The limitations were decided on based on preliminary research that showed that although insufficient swelling (<100%) decreased buoyancy, excessive swelling (>300%) led to faster erosion and abrupt matrix rupture. To balance all of these responses and provide an ideal formulation with consistent flotation and controlled release over a period of 12 h, the desired function was further adjusted.
Analysis of variance (ANOVA) was conducted to determine the significance of regression coefficients and their impact on the responses, based on p-values and F-values [15, 16]. The selected factors and their levels, as well as their respective quantities, are detailed in table 2 [17, 18]. The 17 combinations of factors generated by a statistical approach employing BBD, along with their corresponding measured responses, are presented in table 3.
Table 2: Factors and their levels employed in the BBD matrix [19]
| Factors | Level: low (-1) | Level: medium (0) | Level: high (+1) |
| Methocel K100M (A)mg | 65 | 72.5 | 80 |
| Sodium bicarbonate (B)mg | 25 | 30 | 35 |
| Ethyl cellulose (C)mg | 40 | 45 | 50 |
Table 3: Independent and dependent variable responses as per BBD
| S. No. | Independent variables | Dependent variables | ||||
| Methocel K100 (A) | Sodium bicarbonate (B) | EC (C) | FLT (sec) (Y1) | SI (%) (Y2) | % drug release in 12h (Y3) | |
| F1 | 72.5 | 30 | 45 | 90±0.6 | 65.58±1.4 | 81.70 ±1.19 |
| F2 | 65 | 30 | 50 | 105±0.3 | 78.96±1.2 | 75.30±0.22 |
| F3 | 65 | 30 | 40 | 108±0.5 | 73.14±1.6 | 72.50±0.60 |
| F4 | 72.5 | 30 | 45 | 91±0.4 | 63.28±1.9 | 83.10 ±0.24 |
| F5 | 65 | 25 | 45 | 82±0.3 | 74.37±1.7 | 74.76±0.44 |
| F6 | 80 | 30 | 40 | 105±0.4 | 80.1±1.20 | 84.35±0.38 |
| F7 | 72.5 | 35 | 50 | 65±0.8 | 77.2±1.6 | 80.88±0.10 |
| F8 | 72.5 | 30 | 45 | 90±0.7 | 64.32±1.5 | 82.20±0.42 |
| F9 | 72.5 | 25 | 50 | 83±0.9 | 77.65±1.5 | 85.1±0.24 |
| F10 | 72.5 | 30 | 45 | 92±0.3 | 62.43±1.6 | 82.76±0.24 |
| F11 | 72.5 | 25 | 40 | 98±0.7 | 71.42±1.2 | 78.10±0.21 |
| F12 | 80 | 35 | 40 | 80±0.8 | 82.48±1.3 | 86.32±0.44 |
| F13 | 72.5 | 35 | 40 | 78±0.9 | 75.98±1.4 | 78.6±0.44 |
| F14 | 80 | 25 | 45 | 95±0.5 | 80.32±1.2 | 85.2±0.44 |
| F15 | 80 | 30 | 50 | 56±0.9 | 89.53±1.6 | 93.6±0.44 |
| F16 | 72.5 | 30 | 45 | 94±0.6 | 63.23±1.5 | 81.90±0.84 |
| F1 | 65 | 35 | 45 | 83±0.8 | 70.23±1.2 | 77.4±0.77 |
| VO | 80 | 33.38 | 50 | 53±0.5 | 91.21±1.6 | 95.46±1.03 |
Results are given as mean±SD, n=3
Drug excipient compatibility studies
FTIR
An ALPHA-Brooker FTIR spectrophotometer with KBR disc FTIR spectra recorded ritonavir, and its combination with various excipients, such as methocel K100 M, sodium bicarbonate, Cetyl alcohol, and ethyl cellulose. The resolution was 2 cm-1, and scanning was 400-4000 cm-1 [19].
DSC
The thermal behaviour of RTZ and various excipients (methocel K100M, ethyl cellulose, cetyl alcohol, sodium bicarbonate) was tested in terms of their melting endotherm. This was performed with a combined thermal analysis system, Hitachi Japan, with about 1 to 5 mg of the sample placed in a sealed aluminium pan. The samples were scanned at 30-350 °C at a constant rate of 10 °C/min under nitrogen [20].
Post-compression evaluation
Floating tablets were developed with a unique formulation to ensure sustained drug release and optimized buoyancy characteristics.
Hardness
This was assessed using a Monsanto hardness tester, and the force was measured in kilograms (kg). A hardness within the range of 4-6 kg/cm² is considered acceptable for uncoated tablets. Hardness values were determined for ten tablets from each formulation [21].
Friability
Friability, indicative of the tablet's capacity to withstand abrasion during packaging, handling, and transport, was determined utilizing a Roche Friabilator. Twenty tablets from each formulation were subjected to rotation at 25 rpm for 4 min. The tablets were subsequently dedusted and reweighed, and the percentage friability was calculated using the formula:
Weight variation test
Twenty tablets were individually and collectively weighed on a digital balance (Scout Pro), and the mean weight of one tablet was determined [22].
Buoyancy test (In vitro floating behavior studies)
The in vitro floating behavior of the tablets was assessed by measuring two critical parameters: FLT and total floating time (TFT). The evaluation was conducted in an electrically controlled water bath maintained at 37±0.5 °C. A 200 ml borosilicate beaker containing 100 ml of 0.1 N HCl solution (pH 1.2) served as the dissolution medium, simulating gastric conditions. FLT was defined as the time required for the tablet to rise to the surface of the medium, while TFT represented the duration for which the tablet remained buoyant on the surface. These parameters were analyzed to evaluate the buoyancy performance of the formulation [23].
Swelling studies
To measure swelling, also known as water absorption capacity petri dish equipped with a glass plate holding the tablet was utilized. The tablets were placed in a petri dish with 50 ml of dissolving medium at a temperature of 37±0.5 °C. At regular intervals, the petri dish was removed from the apparatus, blotted with absorbent tissue to remove any excess dissolution medium on the surface, and weighed [24]. The following equation was used to calculate the degree of swelling (% water uptake).

Where W0 is the initial weight of the dry tablet, and Wt is the weight of the wet, swollen tablet.
In vitro drug release studies
The in vitro drug release profile of Ritonavir gastric-floating tablets was assessed using a LABINDIA DS 8000 dissolution apparatus (Type-II, Paddle-DT-600). The study was carried out in 900 ml of 0.1N HCl used as the buffer, maintained at 37±0.5 °C, and rotated at 50 rpm. Over 12 h, 5 ml of buffer was withdrawn at predetermined intervals (1, 2, 4, 6, 8, 10 h, and up to 12 h) and 5 ml of medium replaced after each sampling to maintain sink condition. The collected samples were filtered through a 0.45 μm membrane filter, diluted appropriately with 0.1N HCl, and analyzed for drug content with a UV-visible spectrophotometer at a wavelength of 245 nm nm ((ELICO Double Beam SL 210). This methodology enabled precise monitoring of drug release kinetics, simulating gastric conditions effectively [25].
Release kinetics of the drug
Several mathematical models were used to analyze the kinetics of releasing drugs from RTZ floating tablets. The drug release kinetics were analyzed using the higuchi matrix model, zero-order model, Korsmeyer-Peppas model, Hixson-Crowell model, and first-order model [26].
Drug content uniformity (DCU)
The DCU was spectrophotometrically analyzed at 245 nm by a UV-spectrophotometer to confirm uniform drug distribution within the tablets. An equivalent mass of 200 milligrams of RTZ powder has been placed in a 100 ml measuring cylinder and then dissolved in 0.01N HCl. The resulting content was clarified later, suitably diluted for analysis [27].
In vivo pharmacokinetic study design
The institutional animal ethical committee (IAEC) has approved the study's protocol. Jeeva Life Sciences, Hyderabad (Approval No: CCSEA/IAEC/JLS/21/04/24/027). Six rabbits were kept in a wire cage with free access to food and water, and were exposed to a 12-hour cycle of light and a 12-hour interval of dark each day within an atmosphere of cleanliness, along with an ambient temp (20-25 °C). Rabbits of either sex (2–2.5 kg) were chosen at random and divided into two batches, each with 6. All groups received different treatments: one group received pure medication (8.82 mg/kg body weight), the second group received a validated optimized formulation (8.82 mg/Kg body weight) all animals were restricted for 12 h before the study started, and they only had intermittent availability of water and food while it was being conducted. Following the medication's administration. Blood was drawn from a marginal ear veinat predetermined frequencies about zero (pre-dose), 1, 2, 4, 6, 8, 10, 12 and 14 h. During collection, the blood sample has been mixed thoroughly with heparin in order to prevent blood clotting. Plasma was separated by centrifugation of the blood at 5000 rpm in a cooling centrifuge for 5 min to 10 min and stored frozen at −20 °C until analysis [28].
Determination of RTZ in rabbit plasma by HPLC method
C18 (250 mm×4.6 mm, 5μ) column at room temperature using potassium hydrogen phosphate buffer (pH adjusted to 6.0±0.1 with diluted potassium hydroxide solution), acetonitrile and methanol in the ratio of 50:35:15 v/v and at a flow rate of 1.0 ml/min, while UV detection was performed at 254 nm. The retention time for lopinavir (IS) and ritonavir was found to be 6.0±0.2 and 3.7±0.1 min, respectively [29].
Preparation of plasma samples for HPLC analysis
Rabbit plasma (0.5 ml) was prepared for chromatography by precipitating proteins with 2.5 ml of ice-cold absolute ethanol for each 0.5 ml of plasma. After centrifugation, the ethanol was transferred into a clean tube. The precipitate was resuspended with 1 ml of acetonitrile by vortexing for 1 min. After centrifugation (5000-6000 rpm for 10 min), the acetonitrile was added to the ethanol and the organic mixture was taken to near dryness by a steam of nitrogen at room temperature. Samples were reconstituted in 200 μl of 50% acetonitrile and 50% 0.1% orthophosphoric acid were injected for HPLC analysis [30].
RESULTS AND DISCUSSION
Analytical method of RTZ
The spectrophotometric method was determined by using 0.1N hydrochloric acid at 245 nm for the estimation of RTZ. The standard calibration curve was developed to show that the drug samples were linear for 0.009x+0.016 and had a high R2 value of about 0.998 over their concentration, ranging from 2-10 μg/ml.
Drug excipient compatibility studies
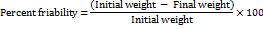
The FTIR analysis spectrum of RTZ showed characteristic peaks observed at 3328.39 cm-1 (-NH stretching) 2964.62 cm-1(-C-H stretching of alkanes) and 1704.31 cm-1 (C=O stretching), and 1613.82. cm-1 to 1535 cm-1(-C=C aromatic stretching) follows confirming the RTZ pure drug structure. The spectrum peaks of the physical were similar to those of the pure RTZ, clearly indicating that there is no change in characteristics with no drug and excipient interaction.
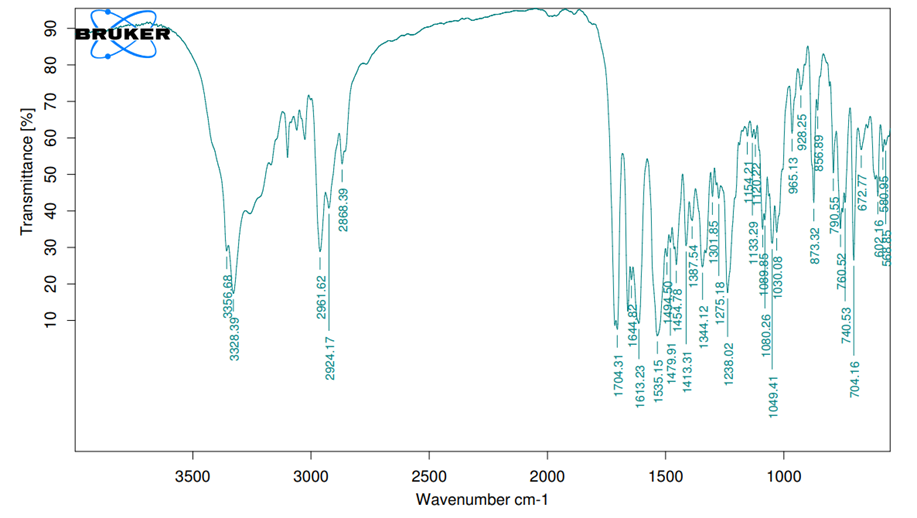
Fig. 1: FTIR spectra of RTZ
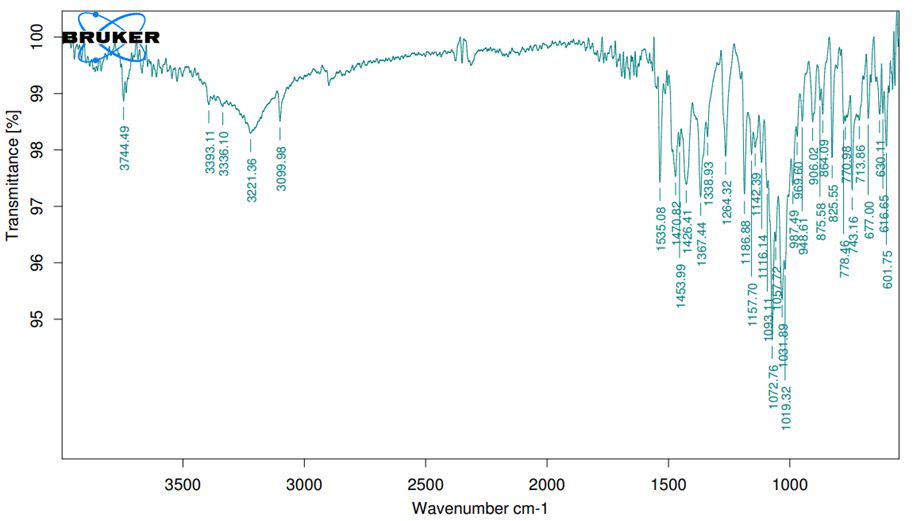
Fig. 2: FTIR spectra of RTZ with a physical mixture DSC
Fig. 3: DSC thermogram of pure RTZ
The melting point of pure drug RTZ was determined to be between 50 and 300 degrees celsius. The DSC thermograms of pure RTZ have a noticeable sharp peak at 121.3 °C, which corresponds to a pure RTZ melting point (120 °C – 122 °C). The DSC thermogram of the RTZ mixture (1:1) with methocel K100, ethyl cellulose, cetyl alcohol, and sodium bicarbonate also showed endothermic peaks at 151.8 °C, indicating no changes in the melting point of the RTZ mixture. The DSC observation indicates no interaction between the drug and the excipients used.
Results of post-compression parameters
Hardness
The tablet exhibits a hardness from 4.2±0.37 to5.8±0.81 kg per cm2. It can be attributed to the cohesive properties imparted by these excipients. This hardness was found to be good enough to withstand handling. Data was provided below in table 4. These tablets have better hardness compared to the tablets formulated by G. Dias et al. (3.6±0.547 to 4.2±0.447) [31].
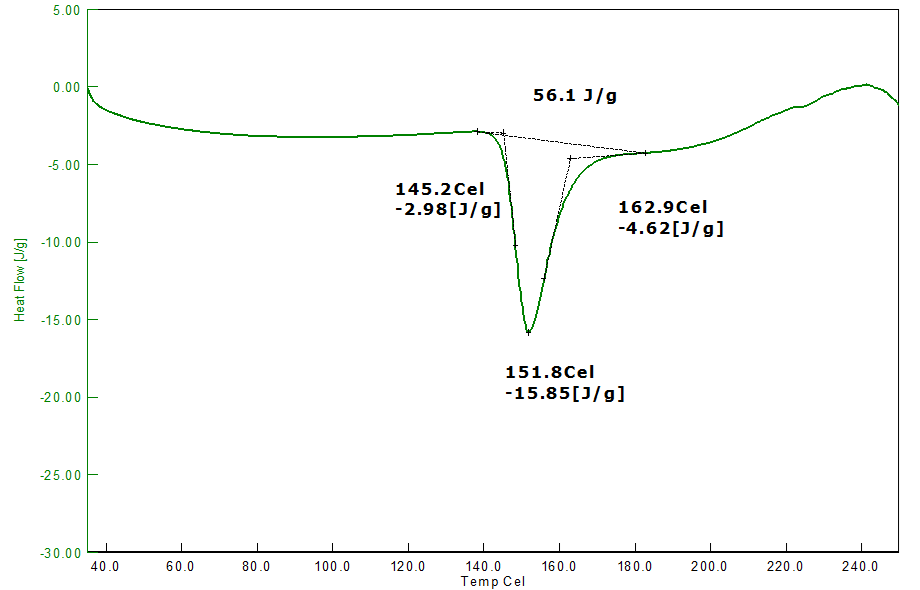
Fig. 4: DSC thermogram of RTZ with physical mixture
Friability
As per USP, the recommended friability range for the tablet dosage forms is not more than (NMT 1.0 %). Each formulation was tested 3 times for friability, and the data is presented below in table 4. The friability data, 0.43±0.08 to 0.88±0.09, revealed that the prepared tablets have good mechanical strength during manufacturing, packing, and shipping. These tablets have higher friability compared to the tablets formulated by K. R. Shankar et al. (0.29±0.005 to 0.82±0.015) [32]
Weight variation
The weight variation ranged from 292±1.9 to 310±2.5 mg/tab. The results meet the official pharmacopoeial standards shown in the following table 4.
In vitro buoyancy studies
The FLT of several tablets remained within the stated range of 56±0.9 seconds to 105±0.3 seconds. Furthermore, the floating time varies amongst various floating tabs, greater than 12 h. These results show that the tablets floated satisfactorily and could stay buoyant over an extended time the outcomes are illustrated in table 4. ANOVA results of FLT were shown in table 5.
Drug content uniformity
The content uniformity of RTZ floating tablets ranged from 96.01±1.34 to 99.58±1.63 mg/tab. The results obtained from this method are shown in the following table 4. The content uniformity was higher than the tablets made by Kiran R Set al., it has a content uniformity of 98.36 ±0.68 mg/tab [28].
SI
The tablet exhibits an SI ranging from 65.58±1.4 to 89.53±1.6, the VO formula having a SI of 91.21±1.6, the results are represented in table 3. Swelling enables buoyancy and medication dissolution, notably in floating tablets, because polymer molecules make a gel layer as they come into contact with water, influencing drug release. As the quantity of methocel K100 M in the formulation increased, it increased the water intake capacity. The water content of the tablet has a significant effect on drug diffusion. The quantity of water in the system may have a significant impact on this due to the flexibility of the polymer chain. The rise in volume is used to soften the high-water-content polymer chain, which successfully promotes network expansion. Higher moisture content may also suggest additional gastric fluid penetration into the tablet, which would lower the FLT by accelerating the release of carbon dioxide gas. Faster and larger tab swelling thus caused tab dimensions to increase, which in turn caused an expanding diffusion channel and, ultimately, a reduction in the diffusion rate. Rahamathulla M et al. reported initially significant drug release followed by gradually decreased drug release [33]. ANOVA results of SI was shown in table 6.
In vitro drug release
Fig. 6 to 8 illustrate the in vitro release profiles of RTZ floating tablets over time. The amount of drug released from the matrix tablets were determined by the nature of the polymers included in the formula. An increase in polymer content resulted in a viscous swelling layer, which increased the in vitro dissolution of RTZ from composition (F15). Contrastingly, the higher proportion of ethyl cellulose and methocel K100 influences higher drug release 93.6±0.44% for 12 h (F15), due to faster-FLT and a greater degree of swelling and erosion of the hydrophilic polymer. The VO formulation had 95.76±0.75% of drug release. This drug release was in line with the tablets prepared by Krishnamurthy A et al., 2019. Their tablets had 94.3±3,2 % drug release [34]. ANOVA results of in vitro drug release are shown in table 7. The increasing order of drug dissolution of various floating formulations were shown below.
VO>F15>F12>F14>F9>F6>F4>F10>F8>F16>F1>F7>F13>F11>F17>F2>F5>F3.
 |
 |
| At 0h | At 12h |
Fig. 5: SI of VO formulation
Table 4: Post-compression measurements of RTZ floating tablet from F1 to F17
| S. No. | Formulation | Weight variation (mg/tab) |
Friability (%) | Hardness (Kg/cm2) | Total floating time (h’s) | Drug content |
| 1 | F1 | 300±2.5 | 0.85±0.09 | 4.8±0.45 | >12 | 97.53±1.42 |
| 2 | F2 | 305±3.5 | 0.71±0.07 | 5.35±0.78 | >12 | 96.66±1.28 |
| 3 | F3 | 295±1.7 | 0.68±0.06 | 4.5±0.95 | >12 | 95.45±1.46 |
| 4 | F4 | 310±2.5 | 0.85±0.09 | 4.2±0.56 | >12 | 97.50±0.87 |
| 5 | F5 | 292±1.9 | 0.51±0.05 | 5.2±0.42 | >12 | 96.38±0.76 |
| 6 | F6 | 298±1.6 | 0.79±0.08 | 4.6±0.47 | >12 | 98.19±1.03 |
| 7 | F7 | 302±3.4 | 0.68±0.05 | 4.8±0.54 | >12 | 96.01±1.34 |
| 8 | F8 | 294±1.5 | 0.56±0.08 | 5±0.72 | >12 | 97.13±1.35 |
| 9 | F9 | 300±2.5 | 0.72±0.05 | 5.8±0.47 | >12 | 95.25±1.45 |
| 10 | F10 | 295±2.4 | 0.88±0.09 | 4.2±0.37 | >12 | 97.37±0.89 |
| 11 | F11 | 305±1.2 | 0.45±0.06 | 4.6±0.45 | >12 | 98.19±0.76 |
| 12 | F12 | 300±1.4 | 0.80±0.03 | 5.4±0.57 | >12 | 96.16±1.05 |
| 13 | F13 | 300±1.1 | 0.78±0.05 | 5.8±0.81 | >12 | 95.19±1.03 |
| 14 | F14 | 300±1.6 | 0.62±0.06 | 6.2±0.36 | >12 | 98.15±1.04 |
| 15 | F15 | 300±2.1 | 0.59±0.07 | 6.5±0.44 | >12 | 99.58±1.63 |
| 16 | F16 | 310±1.3 | 0.85±0.09 | 5.8±0.41 | >12 | 97.23±1.25 |
| 17 | F17 | 298±1.8 | 0.43±0.08 | 4.6±0.58 | >12 | 94.42±1.41 |
| 18 | VO | 300±1.2 | 0.39±0.10 | 5.1±0.42 | >12 | 99.08±1.30 |
Results are given as mean±SD, n=3
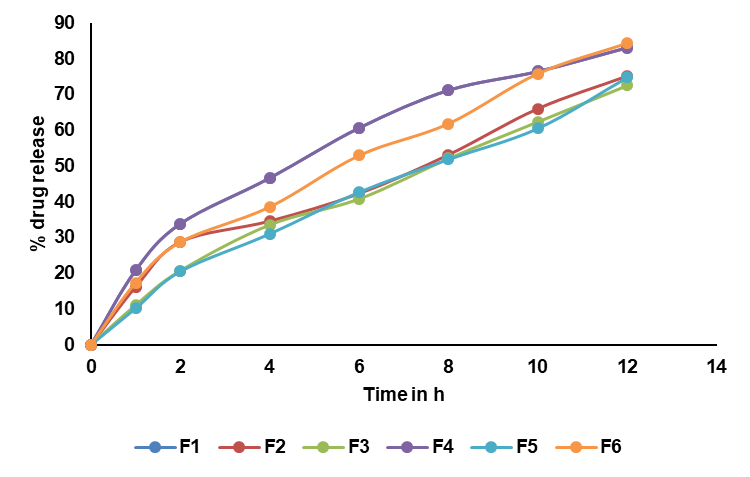
Fig. 6: In vitro drug release profiles of RTZ floating tablets F1 to F6 (Data are given as mean, n=3)
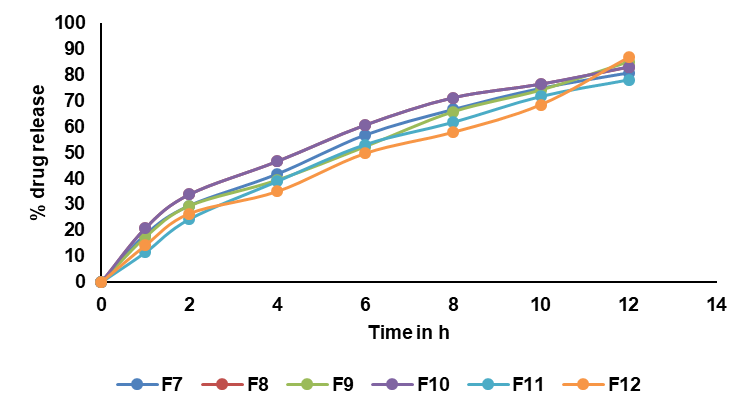
Fig. 7: In vitro drug release profiles of RTZ floating tablets F7 to F12. Data are given as mean, n=3
Drug release kinetics
The in vitro drug release studies were analyzed using various kinetic models, including zero-order, first-order, higuchi, and Korsmeyer-Peppas models. The results, as summarized in table 8, optimized formulation F15 and VO formulation showed zero-order drug release and super case-II, release controlled by polymer erosion and consistent with sustained release over 12 h.
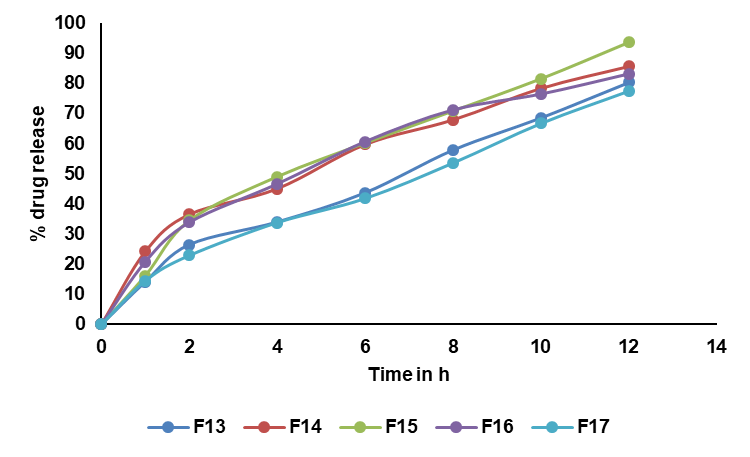
Fig. 8: In vitro drug release profiles of RTZ floating tablets F12 to F17. Data are given as mean, n=3
Table 8: Drug release kinetics of all formulations
| Formulation | Correlation coefficient (r) | ||||
| Zero order | First order | Higuchi | Peppas | N value | |
| F1 | 0.9610 | 0.7270 | 0.9982 | 1.367 | 0.630 |
| F2 | 0.9807 | 0.7567 | 0.9863 | 0.7984 | 0.515 |
| F3 | 0.9915 | 0.8039 | 0.9858 | 0.8537 | 0.6627 |
| F4 | 0.9609 | 0.7271 | 0.9970 | 0.7980 | 0.5340 |
| F5 | 0.968 | 0.853 | 0.975 | 1.12 | 0.895 |
| F6 | 0.9856 | 0.7636 | 0.9914 | 0.9725 | 1.082 |
| F7 | 0.9734 | 0.7487 | 0.9968 | 1.072 | 0.786 |
| F8 | 0.9607 | 0.7280 | 0.9979 | 1.085 | 0.873 |
| F9 | 0.9840 | 0.7619 | 0.9926 | 1.177 | 0.748 |
| F10 | 0.9609 | 0.7268 | 0.9981 | 1.156 | 0.876 |
| F11 | 0.9815 | 0.7926 | 0.9909 | 1.072 | 0.714 |
| F12 | 0.9892 | 0.7861 | 0.9810 | 1.154 | 0.763 |
| F13 | 0.9896 | 0.7829 | 0.9836 | 1.165 | 0.890 |
| F14 | 0.9644 | 0.7144 | 0.9981 | 1.096 | 0.914 |
| F15 | 0.9763 | 0.7608 | 0.9941 | 1.089 | 0.972 |
| F16 | 0.9610 | 0.7258 | 0.9980 | 0.970 | 0.928 |
| F17 | 0.9918 | 0.7881 | 0.9827 | 1.063 | 0.938 |
| VO | 0.9932 | 0.8143 | 0.9820 | 1.061 | 0.968 |
Comparative studies
Comparative studies were conducted with marketed tablets (Cipla: Ritomune 100 mg) and the optimized formulation (F15). The commercial tablets released their entire contents within 3h. F15 showed 93.6±0.44% drug release in 12 h, and the VO formulation had drug release of 95.6±0.20%at the end of 12 h. The dissolution profile of the marketed and optimized formulation (F15) and the VO formulation was presented in fig. 9.
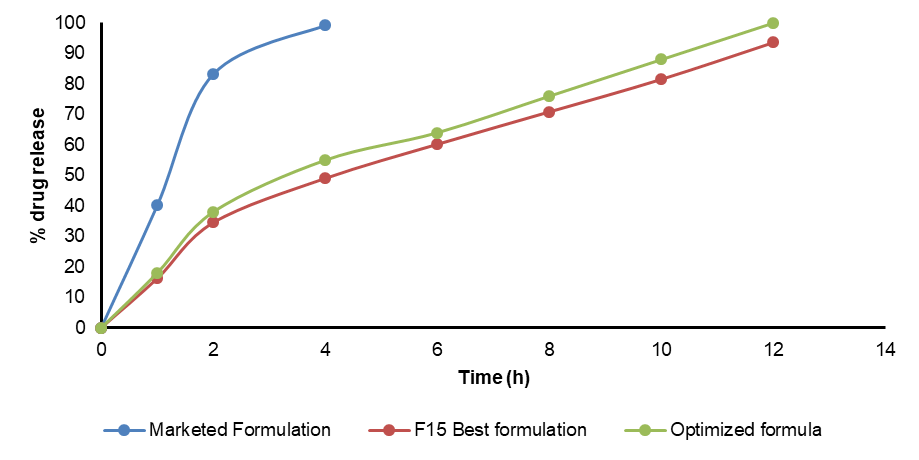
Fig. 9: In vitro drug release profiles of marketed RTZ, F15, validated optimized floating tablets. Data are given as mean, n=3
Table 5: ANOVA of FLT of RTZ floating tablets
| Source of variation | Sum of squares | df | Mean square | F-value | Prob>F | Result |
| Model | 2321.74 | 9 | 257.97 | 2.89 | 0.0043 | Significant |
| A-MethocelK100 | 220.5 | 1 | 220.5 | 2.47 | 0.0061 | |
| B-Sodium bicarbonate | 338 | 1 | 338 | 3.79 | 0.0001 | |
| C-Ethylcellulose | 800 | 1 | 800 | 8.97 | 0.0021 | |
| AB | 64 | 1 | 64 | 0.4250 | 0.0015 | |
| AC | 529 | 1 | 529 | 0.0451 | 0.0321 | |
| BC | 1 | 1 | 1 | 0.9187 | 0.0346 | |
| A2 | 59.21 | 1 | 59.21 | 0.4421 | 0.0852 | |
| B2 | 322.37 | 1 | 322.37 | 0.0991 | 0.0002 | |
| C2 | 0.26 | 1 | 0.26 | 0.9582 | 0.08 | |
| Residual | 624.5 | 7 | 89.21 | |||
| Lack of Fit | 624.5 | 3 | 208.17 | |||
| Pure Error | 0 | 4 | 0 | |||
| Cor Total | 2946.24 | 16 |
All the values are expressed as mean±SD, where n=3, SD: Standard Deviation. df-Degree of freedom, P>0.05 indicates non-significance, P<0.05 Indicates Significance, ANOVA-Analysis of Variance.
Table 6: ANOVA of SI of RTZ floating tablets
| Source of variation | Sum of squares | df | Mean square | F | Prob>F | |
| Model | 806.16 | 9 | 89.57 | 50.99 | 0.0001 | Significant |
| A-MethocelK100 | 159.58 | 1 | 159.58 | 90.84 | 0.0001 | |
| B-Sodium bicarbonate | 0.57 | 1 | 0.57 | 0.32 | 0.5877 | |
| C-Ethylcellulose | 64.41 | 1 | 64.41 | 36.67 | 0.0005 | |
| AB | 9.92 | 1 | 9.92 | 5.65 | 0.0491 | |
| AC | 3.26 | 1 | 3.26 | 1.85 | 0.2155 | |
| BC | 6.28 | 1 | 6.28 | 3.57 | 0.1007 | |
| A2 | 274.21 | 1 | 274.21 | 156.09 | 0.0001 | |
| B2 | 43.12 | 1 | 43.12 | 24.54 | 0.0016 | |
| C2 | 193.69 | 1 | 193.69 | 110.26 | 0.0001 | |
| Residual | 12.3 | 7 | 1.76 | |||
| Lack of Fit | 12.3 | 3 | 4.1 | |||
| Pure Error | 0 | 4 | 0 | |||
| Cor Total | 818.46 | 16 |
All the values are expressed as mean±SD, where n=3, SD: Standard Deviation. df-Degree of freedom, P>0.05 indicates non-significance, P<0.05 Indicates Significance, ANOVA-Analysis of Variance.
Table 7: ANOVA of in vitro drug release of RTZ floating tablets
| Source of variation | Sum of squares | df | Mean square | F-value | Prob>F | |
| Model | 390.16 | 9 | 43.35 | 14.33 | 0.001 | significant |
| A-MethocelK100 | 306.41 | 1 | 306.41 | 101.31 | 0.0001 | |
| B-Sodium bicarbonate | 0.47 | 1 | 0.47 | 0.16 | 0.705 | |
| C-Ethylcellulose | 47.19 | 1 | 47.19 | 15.6 | 0.0055 | |
| AB | 0.58 | 1 | 0.58 | 0.19 | 0.6753 | |
| AC | 10.4 | 1 | 10.4 | 3.44 | 0.1061 | |
| BC | 11.63 | 1 | 11.63 | 3.84 | 0.0907 | |
| A2 | 3.95 | 1 | 3.95 | 1.31 | 0.2906 | |
| B2 | 6.18 | 1 | 6.18 | 2.04 | 0.196 | |
| C2 | 2.03 | 1 | 2.03 | 0.67 | 0.44 | |
| Residual | 21.17 | 7 | 3.02 | |||
| Lack of Fit | 21.17 | 3 | 7.06 | |||
| Pure Error | 0 | 4 | 0 | |||
| Cor Total | 411.33 | 16 |
All the values are expressed as mean±SD, where n=3, SD: Standard Deviation. df-Degree of freedom, P>0.05 indicates non-significance, P<0.05 Indicates Significance, ANOVA-Analysis of Variance.
Experimental design
A mathematical polynomial equation was formulated using Design Expert software to quantitatively evaluate the impact of independent variables Y1, Y2, and Y3 at various combinations and levels on dependent responses. The analysis was carried out by utilizing the coded values of the independent factors.
FLT (sec) Y1
FLT(Y1) =-920.58+6.63A+26.53B+20.53C-0.10AB-0.30AC+0.02BC+0.06A2-0.35B2-1.0C2
In equation (Y1), the main effect A, B, and C, and their quadratic term A, and the interaction effect BC had positive regression coefficients. Interaction terms (AB, AC) and quadratic terms B and C had negative regression coefficients. Contour plot analysis indicates an inverse relationship between polymer concentration and FLT, with higher polymer levels yielding faster buoyancy. This effect can be attributed to the enhanced generation of effervescence at higher sodium bicarbonate concentrations, which accelerates the formation of pores and, in turn, promotes the rapid hydration of the sustained-release layer of the tablets. The significance of each coefficient was assessed using p-values, as shown in table 5. The main effects of all the selected independent variables were found to be highly significant, as demonstrated by their corresponding p-values. The negative sign indicates that increasing Methocel concentration decreases FLT; The combinatorial effects of AB, BC, and AC were also significant based on their p-values. These results suggest that the amount of A, B, and C and the combined effect of BC and the quadratic effect of A have a direct relationship for achieving a formulation that releases 93.6±0.44% of the drug in 12 h with a minimal FLT of 56±0.9 sec. Fig. 10 to 12 depict the effects of response 3D contour plots and surface plots, illustrating the influence of interaction terms on FLT. The mathematical model generated for FLT(Y1) was significant with an F-value of 2.89, indicating that the model is significant. There exists a 0.01% chance that a “Model F-value” this large might be occur to noise. value of "Prob>F" less than 0.0500 indicate model terms are significant.
SI (Y2)
An estimated F-value of 50.99 demonstrates that the fit of the model is significant in statistical terms. P-values lower than 0.0500 indicate that the corresponding parameters of the model are significant. The SI R-squared score of 0.9850 indicates a good association between each of the dependent and independent variables.
SI =+1516.1-22.55A-8.41B-24.09C+0.04AB+0.02AC-0.05BC+0.143A2+0.12B2+0.27C2
The main effect of A, B, and C, the interaction effect of BC, shows a negative effect on the SI. The interaction terms of AB, AC, and the quadratic terms of A, B, and C show a positive effect. As the concentration of polymers increases SI also increases, so a high level of methocel K100 M and EC shows the maximum SI. Fig. 13 to 15 depict the effects of response 3D contour plots and surface plots, illustrating the influence of interaction terms on the SI. The mathematical model generated for SI(Y2) was significant with an F-value of 50.99, indicating that the model is significant. There exists a 0.01% chance that a “model F-value” this large might occur to noise. value of "prob>F" less than 0.0500 indicate model terms are significant. 50 mg of ethyl cellulose, 80 mg of methocel K100, and 33.38 mg of sodium bicarbonate show a good SI, as confirmed from response surface plots.
% Drug release (Y3)
The estimated F-value of 14.33demonstrates that the model is statistically significant, with only a 0.01% probability of such a large F-value occurring due to random noise. The % drug release R-squared value of 0.9485. There is an excellent correlation among the variables that are both independent and dependent.
% Drug release (Y3) =-164+1.69A+6.75B+1.91C-0.01AB+0.04AC-0.06BC-0.01A2-0.04B2-0.02C2
In equation (Y3), the main effects (A, B, C) and their interaction term AC had a positive effect. Interaction terms (AB and BC) and quadratic terms A, B, and C had negative regression coefficients. The contour and RSM plots depict the maximum drug release observed at methocel K100 M 80 mg, ethyl cellulose 50 mg, and sodium bicarbonate 50 mg. Fig. 16 to 18 depict the effects of response 3D contour plots and surface plots, illustrating the influence of interaction terms on percent drug release. The mathematical model generated for % drug release (Y3) was significant with an F-value of 14.33, indicating that the model is significant. There exists a 0.01% chance that a “model F-value” this large might occur to noise. value of "Prob>F" less than 0.0500 indicate model terms are significant.
As the concentration of a (methocel K100 M) increases, a denser gel network is formed, which can also slow down drug release. While the concentration of EC increases, showing reduced diffusion resistance, as the concentration of B increases, it shows unstable floating of the tablet due to rapid gas escape.
To maintain the medication's release for a maximum of twelve hours, methocel K100 M and EC need to be carefully optimized by considering the polymer ratio. From the design matrix formula, F15 shows a maximum percent release of 93.6±0.44after 12 h, which contains a high level of methocel K100 (80 mg), an intermediate level of NaHCO3 (30 mg), and a high level of EC (50 mg).
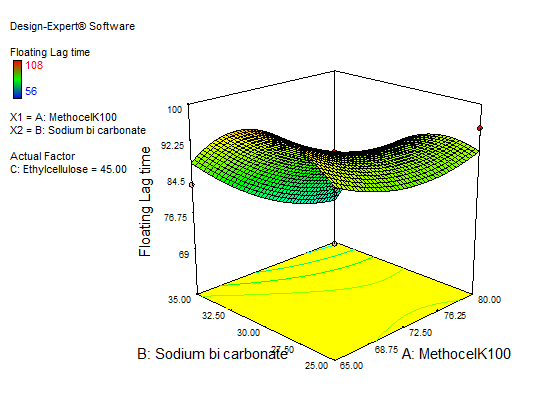
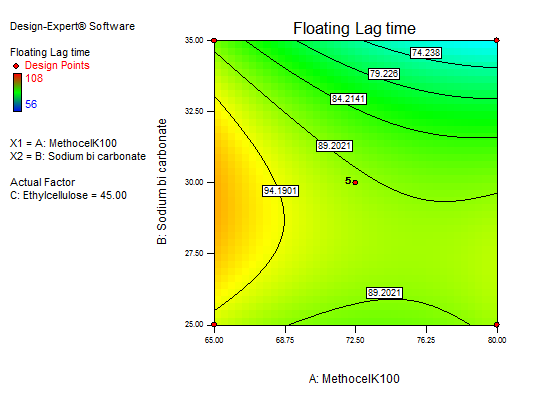
Fig. 10: 3D RSM and contour plot (effect from methocel K100 M and sodium bicarbonate) on FLT
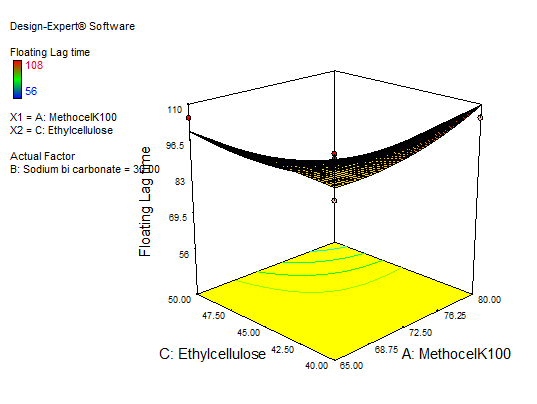
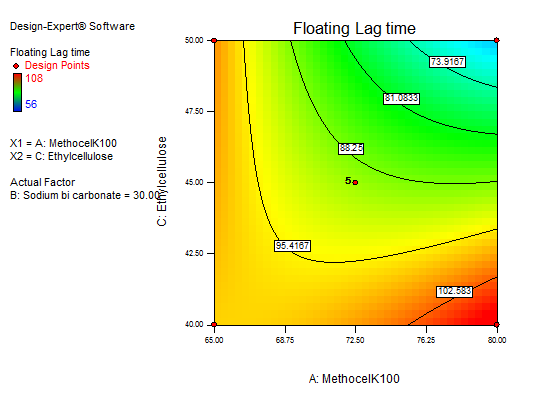
Fig. 11: 3D RSM and contour plot (effect from methocel K100M and EC) on FLT
Table 9: Summary of regression findings with outputs Y1, Y2, and Y3 after fitting into a quadratic equation
| Analysis | Predicted mean | Adjusted R2 | Predicted R2 | SD | %CV | p-value | F value |
| FLT | 87.53 | 0.5155 | 0.788 | 9.45 | 10.79 | <0.0005 | 89.10 |
| SI | 74.08 | 0.9657 | 0.9850 | 1.33 | 1.79 | <0.0001 | 50.99 |
| Cumulative drug release | 81.75 | 0.9736 | 0.8824 | 1.74 | 2.13 | <0.0010 | 14.33 |
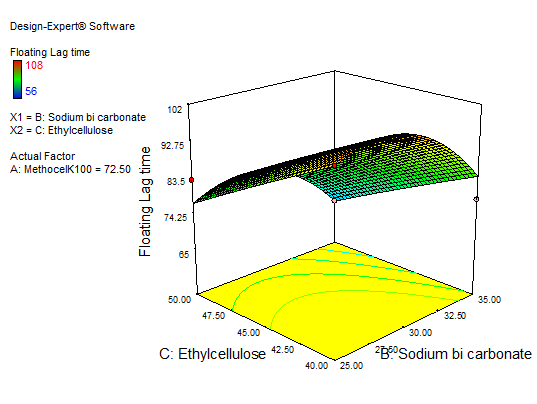
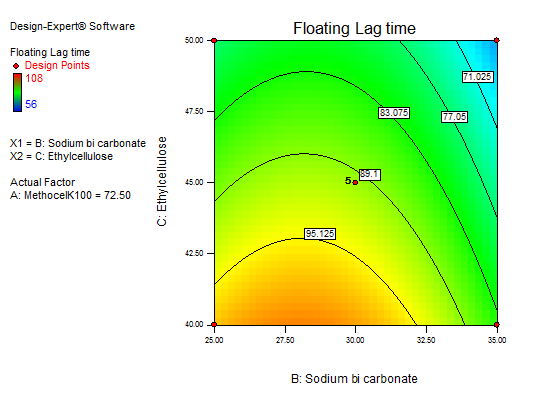
Fig. 12: 3D RSM and contour plot (effect of sodium bicarbonate and EC) on FLT
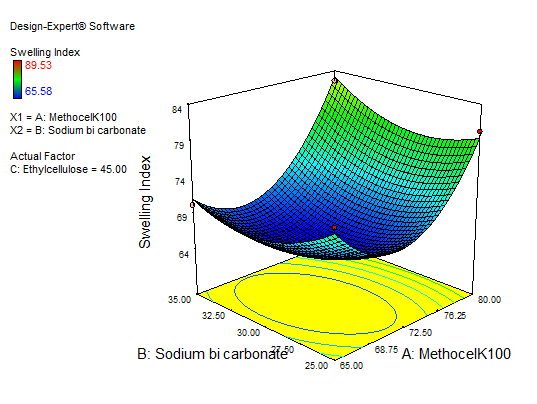
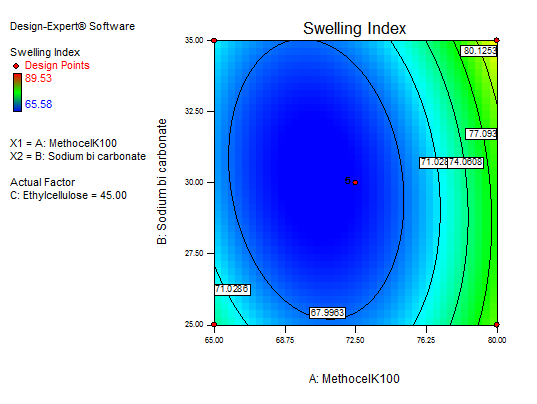
Fig. 13: Explains 3D RSM and contour plot (effect from methocel K100M and sodium bicarbonate) on SI
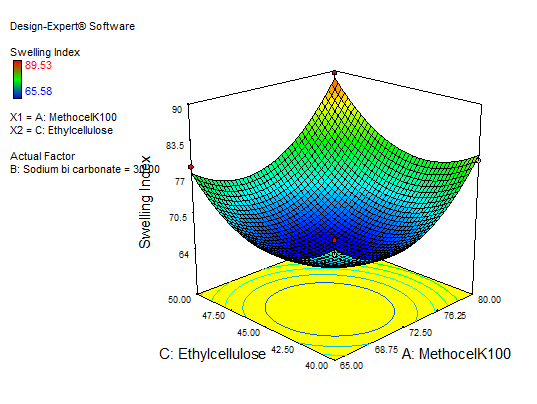
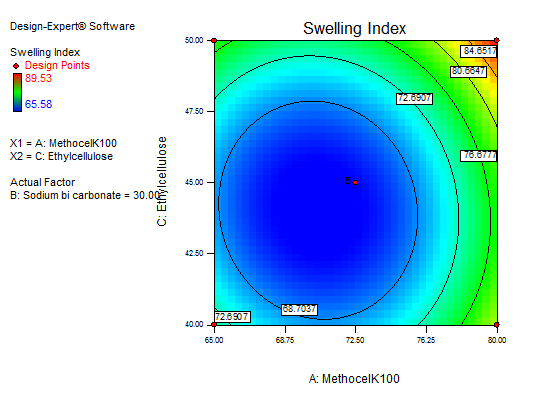
Fig. 14: Explains 3D RSM and contour plot (effect from methocel K100M and EC) on SI
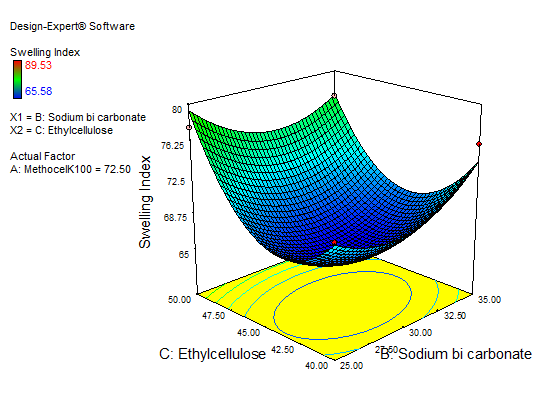
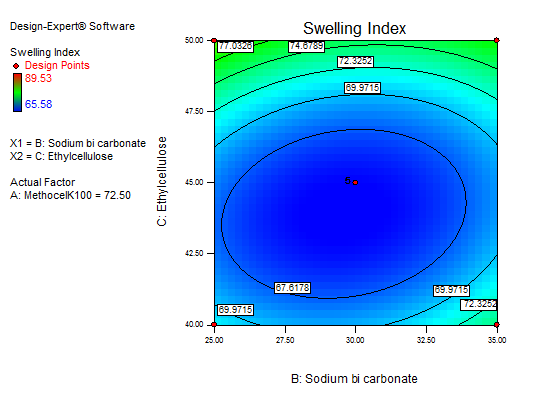
Fig. 15: Explains 3D RSM and contour plot (effect from sodium bicarbonate and EC) on SI
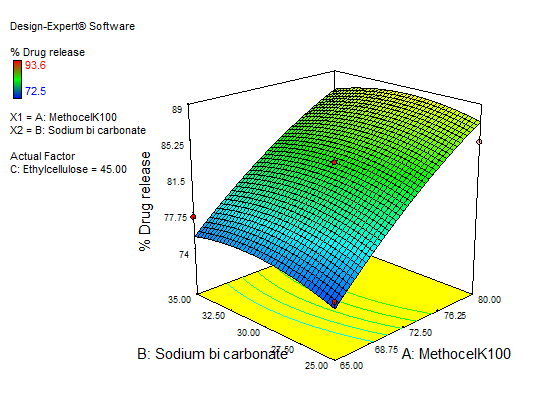
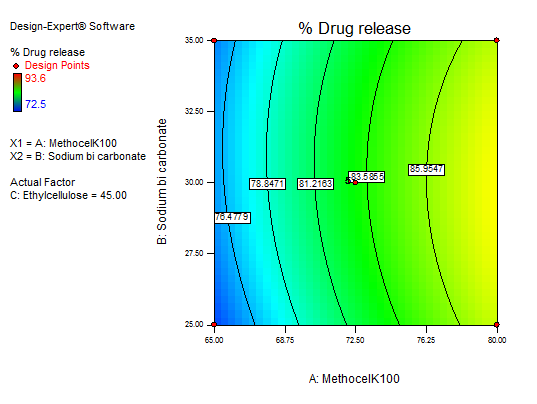
Fig. 16: 3D RSM plot and contour plot (effect from methocel K100 M and sodium bicarbonate) on percentage drug release
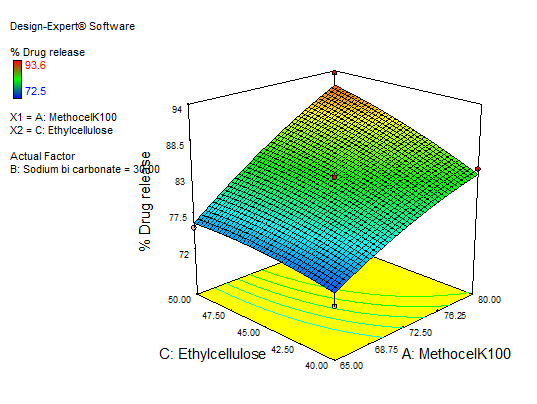
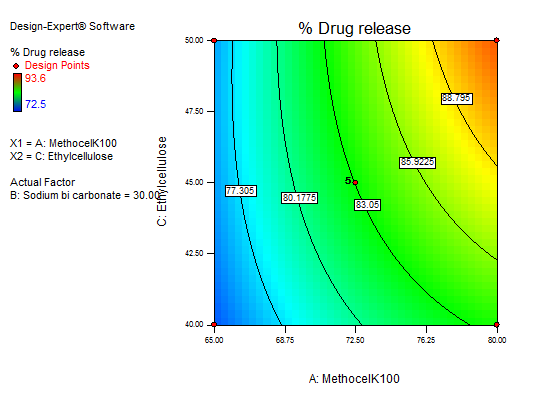
Fig. 17:3D RSM plot and contour plot (effect from methocel K100 M and EC) on percentage drug release
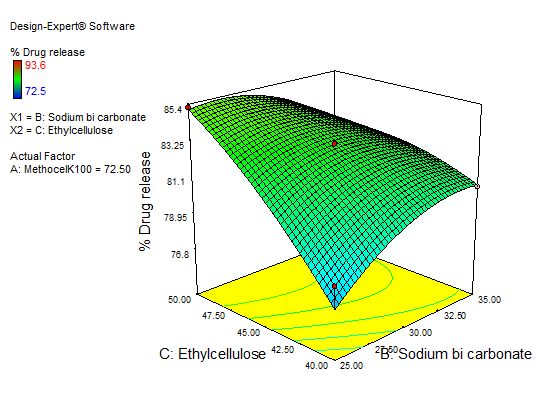
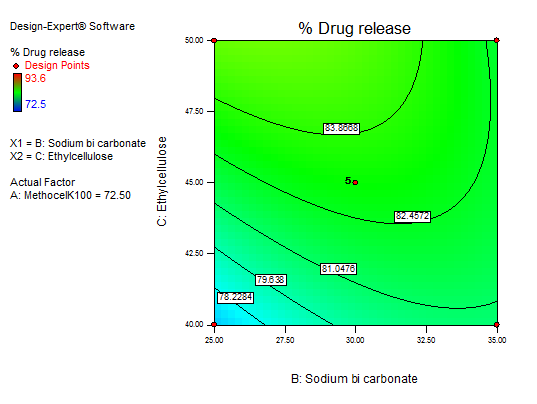
Fig. 18: Explains 3D RSM and contour plot (effect of sodium bicarbonate and EC) on percentage drug release
Validation and optimization
The statistical regression equation originated by BBD was used for optimizing the RTZ floating tablet. The responses were examined, and a single checkpoint formulation was created. Table 10 displays the experimental and projected response values for the validation batch. Fig. 19 shows the ramp plots of VO formulation independent variable values. The validated batch contained methocel K100M 80 mg, EC was 50 mg, and sodium bicarbonate was 33.38 mg. VO formulation shows 95.46±1.03% of drug release after 12 h.
Table 10: Validation batch of independent variables and their dependent responses
| Independent variables | Dependent variables | ||||
| Methocel K100 (A) | Sodium bicarbonate (B) | Ethyl cellulose (C) | FLT (sec) (Y1) | SI (%) (Y2) | % drug release in12 h (Y3) |
| 80 | 33.38 | 50 | 53±0.5 | 91.21±1.6 | 95.46 ±1.03 |
Results are given as mean±SD, n=3
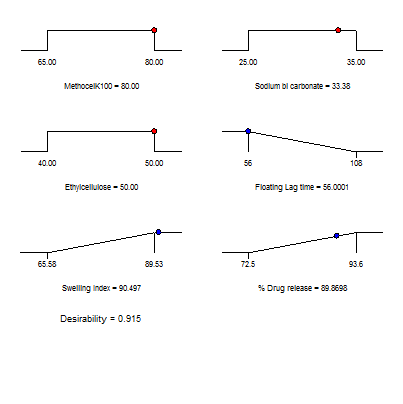
Fig. 19: Ramps plots explain the VO formulation independent variable values
Pharmacokinetics studies
The pharmacokinetic analysis compared the behavior of the pure drug with the VO formulation after oral administration. The AUCs of pure drug and VO formulation after oral doses were found to be 60.77±7.5, 91.65±8.2ug. h/ml, this increase in AUC demonstrates that the VO formulation improved drug absorption, resulting in approximately a 1.5fold enhancement in bioavailability compared to the pure drug. VO formulation’s AUCs was in line with the tablets tested by Best BM et al., 2019, which had AUC of 92.3±1.2ug. h/ml [35]. The Cmax for the VO formulation was discovered to be higher than that of pure drug, i. e. the VO formulation had a Cmax of 6.30±7.5ug/ml and pure drug 4.10±7.5ug/ml, respectively. The VO formulation exhibited a longer Tmax compared to the pure drug, this delayed Tmax suggests that the formulation provided a controlled and sustained release of the drug rather than a rapid burst release. Which suggested that the release of the drug from the floating tablets was prolonged and sustained. Table 11 and fig. 20 show the complete pharmacokinetic parameters in this study.
Table 11: Summary of pharmacokinetic parameters
| Parameter | Pure RTZ | VO Formulation |
| AUC₀–₁₄ (µg·h/ml) | 40.50±6.2 | 54.15±7.1 |
| AUC₀–∞ (µg·h/ml) | 60.77±7.5 | 91.65±8.2 |
| Cmax (µg/ml) | 4.10±7.5 | 6.30±7.5 |
| Tmax (h) | 4.00±0.2 | 6.00±0.5 |
| Ke(h-1) | 0.0888±0.0.5 | 0.0773±0.0.5 |
| t½ (h) | 7.80±0.1 | 8.97±0.1 |
| Ka (h-1) | 1.1586±0.02 | 0.4021±0.03 |
Results are given as mean±SD, n=3
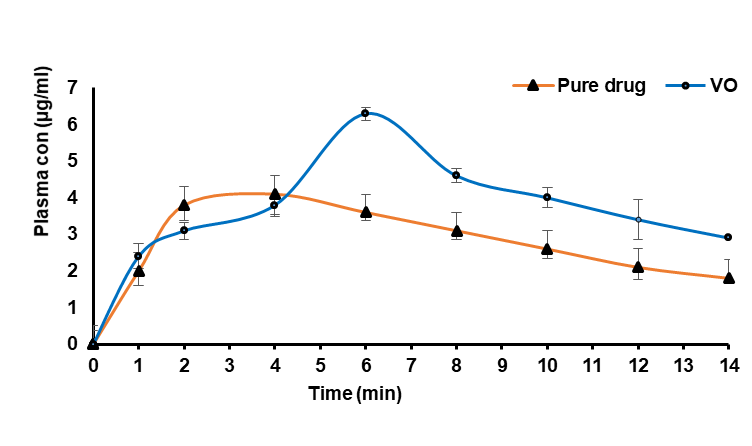
Fig. 20: plasma concentration-time profile of a pure drug and VO formulation. Error bars indicate SD of triplicate
CONCLUSION
The present study successfully employed BBD to design and develop RTZ floating tablets by the direct compression method. RTZ tablets are successfully formulated to retain the tablet in the gastric region so that it increases gastric residence time and thereby enhances its bioavailability. The quality control parameters of the prepared tablets met the official IP tablet specifications. Prepared formulations were further subjected to statistical optimization to guarantee that they had met key dissolution, FLT and SI. Among the formulations VO formulation, which contained methocel K100 (80 mg), sodium bicarbonate (33.38 mg), EC (50 mg), and cetyl alcohol 15 mg demonstrated notably 95.46% of drug release in 12 h. The QBD technique determined the best combination of A, B, and C in the formula to produce the RTZ floating tablet that has the desired characteristics.
ACKNOWLEDGEMENT
Balijepalli Murali Krishna, method selection, compilation of data, and writing the original draft. Chandra Sekhar Patro, CH. Taraka Ramarao, Review, compilation of data, editing, and supervision.
ABBREVIATIONS
RTZ-Ritonavir, ANOVA-Analysis of Variance, BBD-Box-Behnken Design, CDDS-Controlled Drug Delivery Systems, CV-Coefficient of Variation, DSC-Differential Scanning Calorimetry, DCU-Drug Content Uniformity, EC-Ethylcellulose, FTIR-Fourier Transformer Infrared Spectroscopy, FLT-Floating Lag Time, TFT-Total Floating Time, GRDD-Gastro-retentive drug delivery, HIV-Human immunodeficiency virus, SEM-Scanning Electron Microscopy, SI-Swelling Index, VO-Validated Optimized, XRD-X-Ray Diffraction.
AUTHORS CONTRIBUTIONS
The authors report that this publication is based on the Ph. D. thesis (Murali krishna), who conducted the preliminary research, collected the data, carried out the work, and produced the entire manuscript. (Chandra Sekhar Patro, CH. Taraka Ramarao) were the supervisors, and they revised the text and validated the data for this study.
CONFLICT OF INTERESTS
The authors declare that there is no conflict of interest.
REFERENCES
Chen RN, Ho HO, Yu CY, Sheu MT. Development of swelling/floating gastroretentive drug delivery system based on a combination of hydroxyethyl cellulose and sodium carboxymethyl cellulose for losartan and its clinical relevance in healthy volunteers with CYP2C9 polymorphism. Eur J Pharm Sci. 2010;39(1-3):82–9. doi: 10.1016/j.ejps.2009.10.015.
Singh BN, Kim KH. Floating drug delivery systems: an approach to oral controlled drug delivery via gastric retention. J Control Release. 2000;63(3):235-59. doi: 10.1016/S0168-3659(99)00204-7, PMID 10601721.
Gopalakrishnan S, Chenthilnathan A. Floating drug delivery systems: a review. J Pharm Sci Technol. 2011;3(2):548-54.
Bhowmik D, Kumar CP, Chandira M, Jayakar B, Sampath K. Floating drug delivery system a review. Pharm Lett. 2009;1(2):199-218.
Biswas M, Gupta RN, Parhi R, Sethi KK, Sahoo SK. Formulation and in vitro evaluation of gastroretentive floating drug delivery system of ritonavir. Turk J Pharm Sci. 2013;10(1):69-81.
Kiran RS, Shekar BC, Babu BN. Formulation and pharmacokinetic evaluation of ritonavir floating tablets in the management of AIDS. Int J Pharm Sci Drug Res. 2018;10(6):492-6. doi: 10.25004/IJPSDR.2018.100610.
Velivela S, Abbulu K, Vinyas M, Pati NB. Formulation and in vitro evaluation of ritonavir floating tablets by melt granulation technique. Int J Appl Pharm. 2016;8(3):12-5. doi: 10.22159/ijap.2016v8i3.11113.
Biswas M, Gupta RN, Parhi R, Sethi KK, Sahoo SK. Formulation and in vitro evaluation of gastroretentive floating drug delivery system of ritonavir. Turk J Pharm Sci. 2013;10(1):69-86.
Patel JK, Li N, Patel M, Raval JA. Ranitidine hydrochloride floating matrix tablets based on low density powder: effects of formulation and processing parameters on drug release. Asian J Pharm Sci. 2007;2(4):130-42.
Shah S, Pandya S. A novel approach in gastroretentive drug delivery system: floating drug delivery system. Int J Pharm Sci Res. 2010;1(6):7-18. doi: 10.13040/IJPSR.0975-8232.1(6).7-18.
Nasa P, Mahant S, Sharma D. Floating systems: a novel approach towards gastroretentive drug delivery systems. Int J Pharm Pharm Sci. 2010;2(3):2-7.
Shah SH, Patel JK, Patel NV. Stomach-specific floating drug delivery system: a review. Int J PharmTech Res. 2009;1(3):623-33.
Kavitha K, Yadav SK, Mani TT. The need of floating drug delivery system: a review. Res J Pharm Biol Chem Sci. 2010;1(2):396.
Balijepalli MK, Patro CS. Formulation and optimization of floating sustained release tablets of atazanavir sulfate through box–behnken design. Asian J Pharm Clin Res. 2025;18(3):75-86. doi: 10.22159/ajpcr.2025v18i3.53791.
Pawar AY, Aurangabadkar VM, Erande KB, Walke PS, Derle DV. Recent trends in gastroretentive dosage forms. J Pharm Res. 2011;4(7):2019-22.
Kusuma A, Kumar RS. Optimization of fast-dissolving tablets of carvedilol using 23 factorial design. Int J App Pharm. 2024;16(1):98-107. doi: 10.22159/ijap.2024v16i1.49535.
Singh H, Pahwa S, Dhamija K, Arora V. Formulation and evaluation of floating tablets of cimetidine. IJCTR. 2018;11(9):383-92. doi: 10.20902/IJCTR.2018.110944.
Prudhvi Y, Manikiran SS, Rao NR. Formulation design optimization and evaluation of cimetidine floating tablets by using 32 factorial design. Int J Res PharmSci Technol. 2020;2(3):79-84. doi: 10.33974/ijrpst.v2i3.264.
Gurumukhi VC, Bari SB. Development of ritonavir-loaded nanostructured lipid carriers employing quality by design (QbD) as a tool: characterizations permeability and bioavailability studies. Drug Deliv Transl Res. 2022;12(7):1753-73. doi: 10.1007/s13346-021-01083-5, PMID 34671949.
Kiran RS, Shekar BC, Babu BN. Formulation and pharmacokinetic evaluation of ritonavir floating tablets in the management of AIDS. Int J Pharm Sci Drug Res. 2018;10(6):492-6. doi: 10.25004/IJPSDR.2018.100610.
Anusha K, Venu K. Formulation and characterization of sustained release matrix tablets of verapamil hydrochloride using synthetic semi-synthetic and natural polymer. World J Pharm Pharm Sci. 2019;8(5):1633-44.
Velivela S, Abbulu K, Vinyas M, Pati NB. Formulation and in vitro evaluation of ritonavir floating tablets by melt granulation technique. Int J Appl Pharm. 2016;8(3):12-5. doi: 10.22159/ijap.2016v8i3.11113.
Sarmah J, Choudhury A. Formulation and evaluation of gastro retentive floating tablets of ritonavir. Res J Pharm Technol. 2020;13(9):4099-104. doi: 10.5958/0974-360X.2020.00724.6.
Li S, Lin S, Daggy BP, Mirchandani HL, Chien YW. Effect of HPMC and carbopol on the release and floating properties of gastric floating drug delivery system using factorial design. Int J Pharm. 2003;253(1-2):13-22. doi: 10.1016/S0378-5173(02)00642-7, PMID 12593933.
Velpula K. Preparation and evaluation of metronidazole matrix tablets for colon targeting. WJPR. 2017;6(8):2242-56. doi: 10.20959/wjpr20178-9122.
Frutos P, Pabon C, Lastres JL, Frutos G. In vitro release of metoclopramide from hydrophobic matrix tablets influence of hydrodynamic conditions on kinetic release parameters. Chem Pharm Bull (Tokyo). 2001;49(10):1267-71. doi: 10.1248/cpb.49.1267, PMID 11605652.
Jimenez Martinez I, Quirino Barreda T, Villafuerte Robles L. Sustained delivery of captopril from floating matrix tablets. Int J Pharm. 2008;362(1-2):37-43. doi: 10.1016/j.ijpharm.2008.05.040, PMID 18588962.
Kiran RS, Shekar BC, Babu BN. Formulation and pharmacokinetic evaluation of ritonavir floating tablets in the management of AIDS. Int J Pharm Sci Drug Res. 2018;10(6):492-6.
Godela R, Pola KK, Panukanti M, Kusuma A, Shireen S, Srinivas M. Estimation of glyoxylic acid in emtricitabine by a new validated RP-HPLC method. Int J Pharm Qual Assur. 2024;15(2):622-5. doi: 10.25258/ijpqa.15.2.10.
Naik AV, Sellappan K. Physicochemical and phytochemical analysis of different plant parts of Annona muricata L. (Annonaceae). Pharm Methods. 2019;10(2):70-8. doi: 10.5530/phm.2019.2.13.
Dias G, Bobde SS, Desai P. Statistical design of experiment-based formulation development and optimization of floating matrix tablet of anti-emetic drug. Int J App Pharm. 2024;16(4):199-207. doi: 10.22159/ijap.2024v16i4.50771.
Shankar KR, Aminabee S, Lakshmi KC, Reddy GR, Shaik R, Tiyagura V. Effect of various sustained release polymers on floating tablets of carvedilol phosphate a comparative study. Int J App Pharm. 2023;15(6):125-31. doi: 10.22159/ijap.2023v15i6.49170.
Rahamathulla M, Saisivam S, Gangadharappa HV. Development of valsartan floating matrix tablets using low density polypropylene foam powder: in vitro and in vivo evaluation. AAPS PharmSciTech. 2019;20(1):35. doi: 10.1208/s12249-018-1265-z, PMID 30604045.
Kamlapurkar KA, Rumane MB, Ghurghure SM, Sontakke SS, Mujewar. Formulation and evaluation of ritonavir floating tablets. AJPTR. 2019;9(2):321-31. doi: 10.46624/ajptr.2019.v9.i2.025.
Best BM, Capparelli EV, Diep H, Rossi SS, Farrell MJ, Williams E. Pharmacokinetics of lopinavir/ritonavir crushed versus whole tablets in children. J Acquir Immune Defic Syndr. 2011;58(4):385-91. doi: 10.1097/QAI.0b013e318232b057, PMID 21876444.