
Int J App Pharm, Vol 18, Issue 2, 2026, 369-376Original Article
AN LC-MS/MS METHOD DEVELOPMENT AND VALIDATION FOR THE QUANTIFICATION OF ANTIVIRAL DRUGS IN PLASMA SAMPLES
DIVYA G.1, RAGHAVAMMA STV2*
1Research Center, Chalapathi Institute of Pharmaceutical Sciences, Lam, Guntur, Department of Pharmaceutical Analysis, Acharya Nagarjuna University, Guntur, India. 2Department of Pharmaceutics, Chalapati Institute of Pharmaceutical Sciences, Lam, Guntur, India
*Corresponding author: Raghavamma Stv; *Email: divyagolivi07@gmail.com
Received: 27 Oct 2025, Revised and Accepted: 22 Dec 2025
ABSTRACT
Objective: A reliable and specific LC-MS/MS method was developed and validated for the simultaneous quantification of cabotegravir (CBTG) and rilpivirine (RLPV) in plasma samples.
Methods: Chromatographic separation was achieved on a Hypersil BDS C18 (50 × 4.6 mm, 5 µm) column maintained at 35 °C. The mobile phase consisted of 0.1% HCOOH, acetonitrile, and methanol in the ratio 10:80:10 (v/v/v). The injection volume was 10 µl**, and the autosampler temperature was maintained at 10 °C. The retention times for RLPV, internal standard, and CBTG were 2.00, 3.20, and 5.15 min, respectively.
Results: Accuracy ranged from 96.32% to 98.19% for CBTG and 95.57% to 97.00% for RLPV. The intra-and inter-day precision values were 0.39%–3.82% RSD for CBTG and 1.56%–4.55% RSD for RLPV mean recovery values at three QC levels were 96.14%–97.70% for CBTG and 96.06%–97.75% for RLPV. All stability assessments were within acceptance criteria.
Conclusion: The method is robust for the quantitative determination of CBTG and RLPV in biological samples and is suitable for application in forensic, quality-control, bioavailability, and bioequivalence studies.
Keywords: Cabotegravir, Rilpivirine, HIV/AIDS, LC-MS/MS, Method validation, Stability
© 2026 The Authors.Published by Innovare Academic Sciences Pvt Ltd. This is an open access article under the CC BY license (https://creativecommons.org/licenses/by/4.0/)
DOI: https://dx.doi.org/10.22159/ijap.2026v18i2.56739 Journal homepage: https://innovareacademics.in/journals/index.php/ijap
INTRODUCTION
Cabenuva is an HIV/AIDS treatment that combines cabotegravir and rilpivirine. The kit contains two injectable vials of cabotegravir and rilpivirine [1]. The most common adverse effects include injection site reactions, fever (pyrexia), lethargy, headache, muscle and joint discomfort, nausea, difficulties sleeping, lightheadedness, and rashes [2, 3]. US medical clearance of the co-packaged drug came in January 2021. This monthly injectable regimen is the first FDA-approved HIV treatment for adults [4-6].
Adults infected with HIV-1(human immunodeficiency virus type 1) who are virologically suppressed and on a stable antiretroviral treatment who have not experienced treatment failure should be treated with cabotegravir/rilpivirine as a complete regimen [7]. This combination is approved for use in the European Union as a maintenance treatment for adults with HIV who have viral loads below 50 copies/ml, are on antiretroviral medication, and whose virus has not become resistant to non-nucleoside reverse transcriptase inhibitor [8].
Cabotegravir (CBTG) is a chemical compound with the formula C19H17F2N3O5 and weight 405.358 g•mol−1. Its chemical name is N-((2,4-Difluorophenyl)methyl)-6-hydroxy-3-methyl-5,7-dioxo-2,3,5,7,11,11a-hexahydro(1,3)oxazolo(3,2-a)pyrido(1,2-d)pyrazine-8 (fig. 1A). Rilpivirine (RLPV) is 4-[4-(€-2-cyanovinyl]-2,6-dimethylphenyl-amino)pyrimidin-2-yl]aminobenzonitrile, with formula C22H18N6 and weight 366.428 g•mol−1 [9, 10] (fig. 1B).
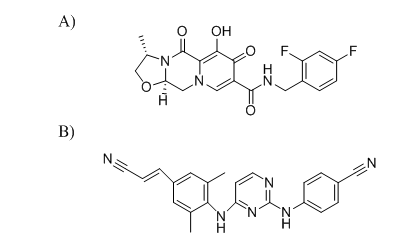
Fig. 1: Structures of A) Cabotegravir, and B) Rilpivirine
Few methods have been published for the determination of CBTG and RLPV individually and together. These methods includeRP-HPLC [11] LC-MS [12], and UPLC-MS/MS [13, 14]. Bevers et al. developed E-isomers CBTG and RLPV in human EDTA plasma, also considering RPV E-isomer instability. Ramöller et al. reported an HPLC-MS method for simultaneous quantification of the CBTG and RLPV in rat plasma and tissues, not in human plasma, and that it was not the LC-MS/MS method. Ethel D et al. developed and validatedLC-MS/MS quantification.
Although several analytical methods have been reported for quantifying CBTG and RLPV, including UHPLC–MS/MS and LC–MS assays, many existing approaches involve gradient elution, solid-phase extraction (SPE), or complex sample-cleanup procedures that increase cost, analysis time, and operational difficulty. For example, the multiplex UHPLC–MS/MS method described by Courlet et al. (2020) [15] offers broad analyte coverage but requires gradient solvent programming and SPE, making it less suitable for routine, high-throughput applications.
In contrast, the present study focuses on developing a simplified and cost-effective LC–MS/MS method specifically optimized for simultaneous estimation of CBTG and RLPV in K₂EDTA plasma. The novelty of this work lies in the use of a simple protein-precipitation extraction, a straightforward isocratic mobile phase composed of commonly available solvents, and short chromatographic run times that support rapid processing. The method achieves higher and more consistent extraction recovery, shows excellent precision and accuracy, and includes an expanded stability evaluation under multiple handling and storage conditions. These improvements enhance the practicality of the assay for routine therapeutic drug monitoring, pharmacokinetic profiling, and bioequivalence studies in both clinical and research laboratories.
MATERIALS AND METHODS
Reagents and chemicals
The reference standards of CBTG (99.81%), RLPV (99.72%), and amprenavir (AMP) (99.82%) were procured from Dr. Reddy's Lab in Hyderabad, India. Methanol and acetonitrile of HPLC grade were acquired from AB firms in Mumbai, India. The milli-Q water purification system processes deionized water.
LC–MS/MS instrument parameters
The Agilent1200 (Japan) liquid chromatography instrument with an SL-dual pump and the 6460 triple-quadrupole mass detector with ESI comprised the LC-MS/MS setup. The Mass Hunter B0104 software collected data and controlled the LC-MS/MS equipment. A Hypersil BDS C18 reverse-phase analytical column (50 × 4.6 mm, 5 µm) was used for analyte separation at 35 °C. The mobile phase system comprises 0.1% HCOOH, acetonitrile, and methanol in a proportion of 10:80:10 (%V/V/V), monitored at 0.7 ml/min. The infusion volume was 10.0 µl**, and the auto-sampler temperature was maintained at 10 °C. Mass system operation employed+ve ionisation using MRM mode. Finally, adjusting MS/MS constraints to resolve all analytes gave the LC-MS/MS system exceptional resolution MRM mode was used to acquire data in positive ionization mode for AMP, RLPV, and CBTG with transitions of 506.23 → 380.17, 367.16 → 340.15, and 406.10 → 263.06, respectively.
Method optimization
In the beginning of the method development, acetonitrile, methanol, and HCOOH were mixed, but resolution and peak response were poor. Separation was achieved using a Hypersil/BDS (50×4.6 mm, 5µ) C18 reverse phase column utilizing an isocratic solvent system of 0.1% HCOOH, acetonitrile, and methanol (10:80:10 (%V/V/V)) at 0.7 ml/min. 6.5-minute runtime. 10.0 µl** of injection volume and 10.0 ºC of an auto-sampler temperature were utilized.
Standard and quality control solutions
The separate stock solutions of CBTG, RLPV, and IS were diluted in a mixture of methanol and acetonitrile in a ratio of 1:1. To get the working standards, the CBTG and RLPV stock solutions were then diluted serially. After diluting the IS stock solution with acetonitrile, the 350 ng/ml working solutions were processed. Working standards for CBTG (400, 750, 1500, 2500, 4500, 8000, 12000, and 16000 ng/ml) and RLPV (5.8, 11.5, 33.0, 66.0, 103.0, 145.0, 185.0, and 235.0 ng/ml) were spiked into blank plasma in order to process the calibration curves. Samples for quality control (QC) purposes were processed with diluent at the following concentrations: 400, 1120, 8000, and 12000 ng/ml for CBTG, and 5.8, 16.24, 116, and 174 ng/ml for RLPV.
Protocol for sample solution
All sample solutions, except blanks, were prepared by adding amprenavir internal standard to 100.0 µl** of plasma to obtain a final IS concentration of 350 ng/ml. The mixture was vortexed, followed by addition of 3.0 ml of methanol and shaking for 5 min to ensure complete protein precipitation and improved analyte release from plasma-binding components, which we found to enhance extraction consistency. The samples were then centrifuged at 14,000 × g for 10 min at 4 °C. The resulting supernatant (approximately 600 µl**) was transferred to a clean tube and evaporated to dryness under a gentle stream of nitrogen at 40 °C. The residues were reconstituted in 150 µl** of mobile phase, vortexed for 30 seconds, centrifuged at 14,000 × g for 5 min, and 10 µl** was injected for LC–MS/MS analysis.
The calibration curve was generated using a weighted 1/x linear regression model, which yielded optimal accuracy and precision across the full concentration range.
Method validation
To ensure that the established analytical technique met the acceptance limit, it was validated as per the criteria of the FDA (Food and Drug Administration) [16, 17].
RESULTS AND DISCUSSION
Mass system optimization
Separate injections of blank analyte solutions were made using the positive ionization mode while optimizing the mass instrument for product and parent ions. At m/z 406.1 for CBTG and 367.16 for RLPV, precursor ions were detected, and upon parent ion fragmentation, pieces of varying m/z values were noted. The most intense fragment ions were found to have m/z 263.06 for CBTG and 340.15 for RLPV [18, 19]. Since commercially available CBTG and RLPV isotopes were not accessible, we conducted a search for several potential IS and settled on Amprenavir as our internal standard. Following optimization of the instrument settings, the MRM transitions were observed at m/z 406.10 → 263.06 for CBTG, 367.16 → 340.15 for RLPV, and 506.23 → 380.17 for the internal standard amprenavir.
Mass spectrum conditions
The positive ionization mode was used to run the mass system. The MRM scan mode was utilized to arrange the MS/MS investigation. The MS/MS parameters were fine-tuned to include the following: a 3.5 kV capillary voltage, a source temperature of 450.0 ºC, a flow rate of 10.0 l/min of N2 drying gas, and a nebulizer gas pressure of 45.0 psi. The collision energies of 18 eV, 20 eV, and 15 eV were applied for the MRM transitions of AMP (506.23 → 380.17), RLPV (367.16 → 340.15), and CBTG (406.10 → 263.06), respectively.
Selection of internal standard
Amprenavir (AMP) was selected as the internal standard based on its physicochemical and analytical compatibility with CBTG and RLPV. Under the optimized isocratic mobile phase (0.1% HCOOH-acetonitrile-methanol, 10:80:10 v/v/v), AMP exhibited a retention time (3.20 min) falling within the same chromatographic window as the analytes, ensuring equivalent exposure to chromatographic conditions. Additionally, all three compounds demonstrated efficient ionization in the positive ESI mode, with AMP producing a stable and abundant precursor ion at m/z 506.23 and a consistent product ion at m/z 380.17 (MRM 506.23 → 380.17), matching its established fragmentation pathway.
Protein-precipitation extraction yielded recovery values for AMP that were comparable to those obtained for CBTG and RLPV, confirming that the IS undergoes similar sample preparation effects. No endogenous interference was observed at the retention times of AMP or the analytes in blank plasma. Collectively, the similarity in retention behaviour, ionization characteristics, extraction recovery, and matrix response supports the suitability of AMP as an internal standard for simultaneous quantification of CBTG and RLPV.
Back-calculated concentrations for all calibration standards met the acceptance criteria, with %bias values within ±15% at each level. The calibration curves demonstrated excellent linearity across the validated range, with correlation coefficients of ≥ 0.99 for both CBTG and RLPV.
Method validation
Specificity and selectivity
Neither the CBTG nor the RLPV nor the IS plasma samples showed any interference peaks. As shown in fig. 2, the chromatograms of spiked plasma were shown at the lower limit of quantification (400 ng/ml, CBTG, 5.8 ng/ml RLPV) and IS. For RLPV, IS, and CBTG, the retention times were 2.0, 3.2, and 5.15 min, correspondingly.
Sensitivity and linearity
Each lot linearity graph was plotted against a concentration range of 400–16,000 ng/ml for CBTG and 5.8–232 ng/ml for RLPV in the plasma sample (table 1). For CBTG (fig. 3) and RLPV (fig. 4), the average regression line equations obtained were y = 0.0001x+0.0007 and y = 0.0025x-0.0018, respectively, with x representing plasma concentrations and y denoting ratio of analytes to IS [17–20]. Results showed a signal-to-noise ratio (SNR) more than 10.0 with CBTG and RLPV LLOQ standards of 400 and 5.8 ng/ml, respectively. For RLPV, IS, and CBTG, the retention times were 2.0, 3.2, and 5.15 min, correspondingly.
Recovery, precision and accuracy
Results for intraday and interday precision and accuracy are shown in tables 2 and 3, respectively, which include the quality control standards of analytes at A) LQC, B) MQC, and C) HQC levels. Between 96.32 and 98.39% for CBTG and 95.57 to 97.74% for RLPV, the precision values varied from 0.39% to 3.82% RSD and 1.56 to 4.55% RSD, respectively, for the drug component [20-23]. The results demonstrated that the method was both precise and accurate. At three different QC levels, the average recovery values for CBTG ranged from 96.14% to 97.70%, and for RLPV, they ranged from 96.06% to 97.75% (tables 2 and 3).
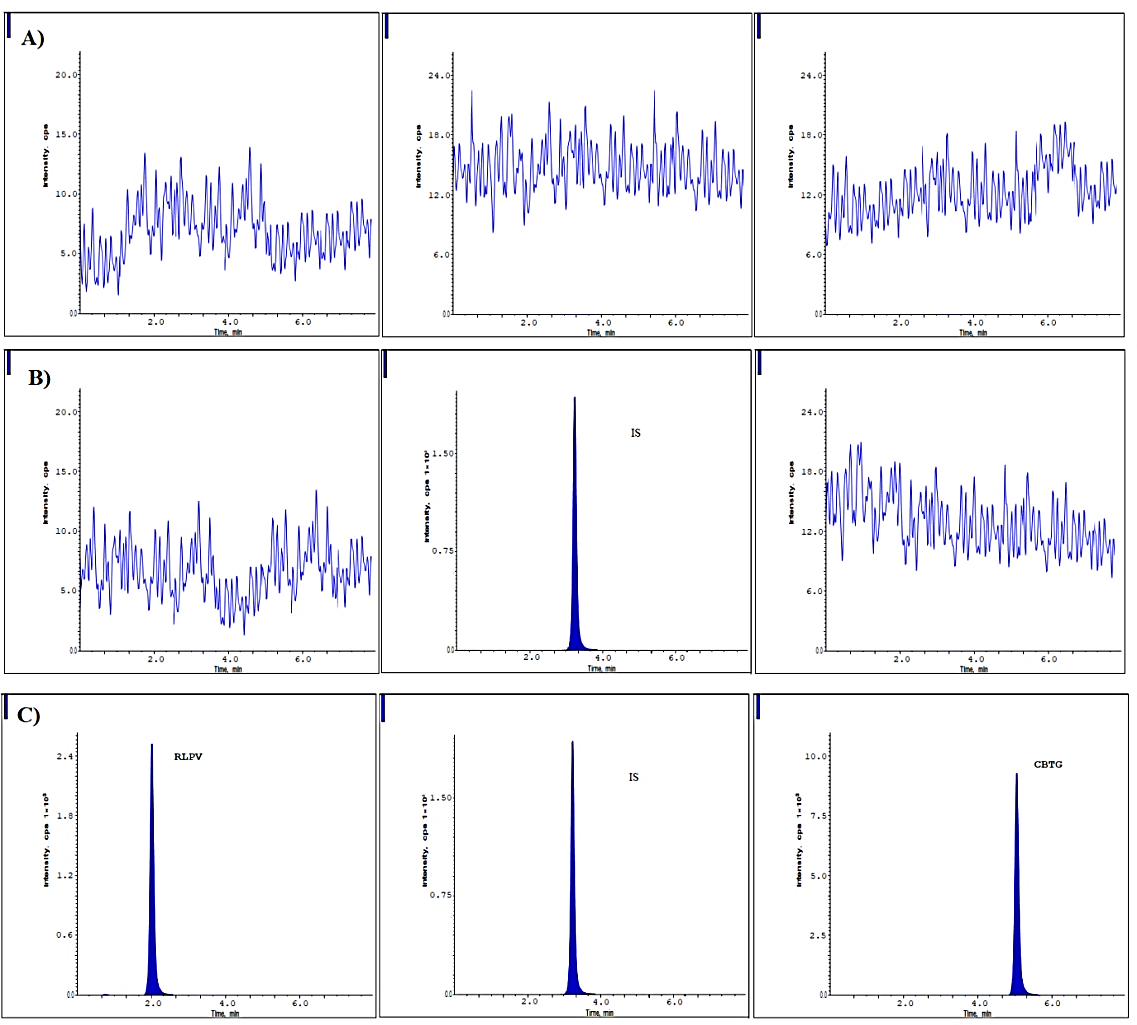
Fig. 2: Chromatograms at A) Blank, B) Blank with IS and C) LLOQ level
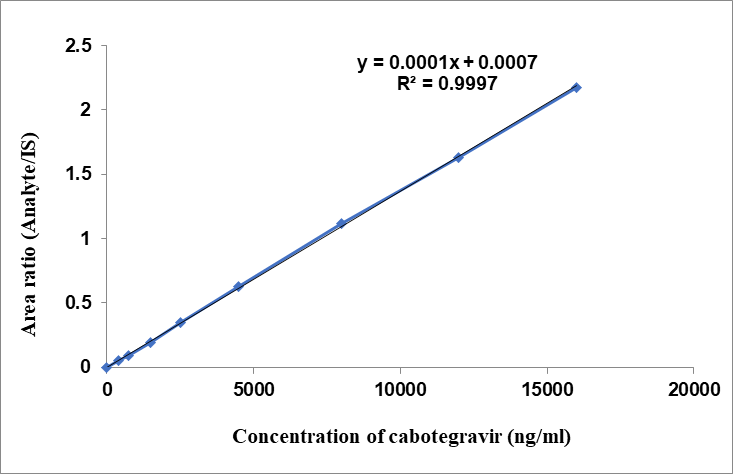
Fig. 3: Linearity of CBTG
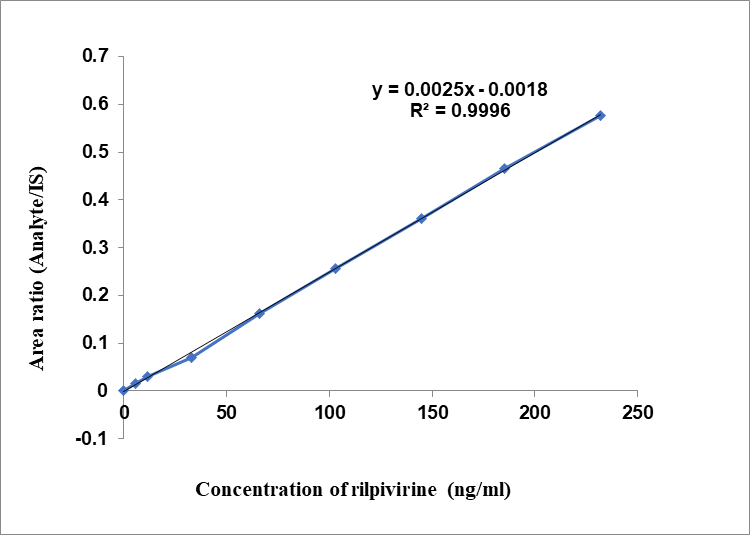
Fig. 4: Linearity of RLPV
Table 1: Linearity of CBTG and RLPV
| CBTG | |||
| Concentration (ng/ml) | Analyte/IS ratio | Analyte peak area | IS peak area |
| 400 | 0.0541736 | 9532 | 175953 |
| 750 | 0.0935913 | 16454 | 175807 |
| 1500 | 0.1907229 | 33531 | 175810 |
| 2500 | 0.3489366 | 61327 | 175754 |
| 4500 | 0.6250619 | 109894 | 175813 |
| 8000 | 1.12041 | 196958 | 175791 |
| 12000 | 1.631406 | 287010 | 175928 |
| 16000 | 2.1761099 | 382917 | 175964 |
| RLPV | |||
| 5.8 | 0.015549607 | 2736 | 175953 |
| 11.5 | 0.030305961 | 5328 | 175807 |
| 33 | 0.070689949 | 12428 | 175810 |
| 66 | 0.163051766 | 28657 | 175754 |
| 103 | 0.256152844 | 45035 | 175813 |
| 145 | 0.36101962 | 63464 | 175791 |
| 185 | 0.465468828 | 81889 | 175928 |
| 232 | 0.576492919 | 101442 | 175964 |
Table 2: Precision and accuracy of CBTG
| LLOQ (400ng/ml) | LQC (1120ng/ml) | MQC (8000ng/ml) | HQC (12000ng/ml) | |
| I | ||||
| n | 6 | 6 | 6 | 6 |
| Mean | 390.52 | 1091.45 | 7709.15 | 11558.21 |
| SD | 1.53 | 13.76 | 294.14 | 241.21 |
| %CV | 0.39 | 1.26 | 3.82 | 2.087 |
| % Mean accuracy | 97.63 | 97.45 | 96.36 | 96.32 |
| II | ||||
| n | 6 | 6 | 6 | 6 |
| Mean | 393.55 | 1093.64 | 7785.34 | 11571.77 |
| SD | 3.03 | 23.22 | 261.88 | 245.93 |
| %CV | 0.77 | 2.12 | 3.37 | 2.12 |
| % Mean accuracy | 98.39 | 97.65 | 97.32 | 96.43 |
| III | ||||
| n | 6 | 6 | 6 | 6 |
| Mean | 393.28 | 1092.04 | 7792.69 | 11565.80 |
| SD | 2.66 | 20.31 | 262.89 | 247.382 |
| %CV | 0.68 | 1.86 | 3.37 | 2.139 |
| % Mean accuracy | 98.32 | 97.50 | 97.41 | 96.38 |
| Between batch precision and accuracy | ||||
| n | 18 | 18 | 18 | 18 |
| Mean | 392.82 | 1091.82 | 7759.94 | 11565.26 |
| SD | 2.92 | 19.52 | 275.41 | 244.92 |
| %CV | 0.74 | 1.79 | 3.545 | 2.12 |
| % Mean accuracy | 98.11 | 97.53 | 97.03 | 96.38 |
LLOQ: Lower limit of quantification; LQC: Low quality control; MQC: Medium quality control; HQC: High quality control.
Table 3: Precision and accuracy of RLPV
| LLOQ (5.8ng/ml) | LQC (16.24ng/ml) | MQC (116ng/ml) | HQC (174ng/ml) | |
| n | 6 | 6 | 6 | 6 |
| Mean | 5.68 | 15.63 | 112.26 | 167.84 |
| SD | 0.13 | 0.35 | 5.10 | 6.17 |
| %CV | 2.24 | 2.27 | 4.55 | 3.68 |
| % Mean accuracy | 97.97 | 96.26 | 96.77 | 96.46 |
| II | ||||
| n | 6 | 6 | 6 | 6 |
| Mean | 5.64 | 15.52 | 113.38 | 168.50 |
| SD | 0.15 | 0.34 | 3.08 | 5.66 |
| %CV | 2.64 | 2.22 | 2.71 | 3.36 |
| % Mean accuracy | 97.27 | 95.57 | 97.74 | 96.84 |
| III | ||||
| n | 6 | 6 | 6 | 6 |
| Mean | 5.66 | 15.63 | 112.39 | 168.32 |
| SD | 0.19 | 0.24 | 4.765 | 6.34 |
| %CV | 3.48 | 1.56 | 4.23 | 3.76 |
| % Mean accuracy | 97.51 | 96.28 | 96.89 | 96.73 |
| Between batch precision and accuracy | ||||
| n | 18 | 18 | 18 | 18 |
| Mean | 5.66 | 15.59 | 112.67 | 168.22 |
| SD | 0.16 | 0.32 | 4.43 | 6.07 |
| %CV | 2.84 | 2.07 | 3.93 | 3.61 |
| % Mean accuracy | 97.58 | 96.03 | 97.13 | 96.68 |
LLOQ: Lower Limit of Quantification; LQC: Low Quality Control; MQC: Medium Quality Control; HQC: High Quality Control.
Matrix effects
To assess the matrix impact for the LC-MS/MS method, six distinct batches of plasma that had been chromatographically screened were used by comparing with the neat standard solutions. At each dosage level, triplicates of both the LQC and HQC-equivalent samples were spiked to the RLPV and CBTG in every plasma batch after the extraction. The overall% CV of back calculated concentrations for CBTG was determined to be 98.14 and 97.81 for the HQC samples of all the lots that were analyzed, and for RLPV, it was 97.81 and 98.14, respectively [24-26]. On comparing the matrix effect results, it was observed that there was a slight decrease in the recovery results in presence of plasma. There is a 15.00% chance of acceptance based on these criteria. Within the acceptable range of 85.00-115.00%, the mean accuracy of back calculated concentrations was found to be 98.14 for HQC samples and 97.48% for LQC samples across all tested lots. The results are summarized in table 4. Matrix effect was assessed by comparing the mean peak areas of post-extraction spiked samples with neat solutions. The calculated %ME ranged from 96.64% to 98.14%, with %CV values<15% at both LQC and HQC levels for all analytes, indicating no significant ion suppression or enhancement.
Table 4: Matrix effect evaluation
| LQC | HQC | |||
| S. No. | Peak area in absence of matrix | Peak area in presence of matrix |
Concentration obtained | Peak area in absence of matrix |
| CBTG | ||||
| n | 18 | 18 | 18 | 18 |
| Mean | 27422 | 26501.11 | 1083.46 | 287027.78 |
| SD | 1015 | 1345.34 | 61.54 | 15.64 |
| %CV | 3.70 | 5.08 | 5.68 | 0.005 |
| %mean accuracy | 96.64 | |||
| RLPV | ||||
| n | 18 | 18 | 18 | 18 |
| Mean | 7268 | 7109.22 | 15.89 | 76084 |
| SD | 229.25 | 350.34 | 0.80 | 4.06 |
| %CV | 3.15 | 4.92 | 5.08 | 0.01 |
| %mean accuracy | 97.81 | |||
LQC: Low Quality Control; HQC: High Quality Control.
Dilution integrity
The dilute the stock solution as a spiked standard in the screened plasma allowed us to test the method's dilution integrity. In order to test the method's dilution integrity, we spiked the screened plasma with DI, creating a DIQC concentration that is around three times the ULOQ.
Dilution integrity was evaluated by preparing a dilution-quality control (DIQC) sample at approximately three times the ULOQ and diluting it 1/5 and 1/10 with screened blank plasma. Each diluted sample was analyzed against the calibration curve to assess accuracy (% of nominal) and precision (%RSD).
For CBTG, the 1/5 dilution showed 98.15% accuracy with 3.77% RSD, while the 1/10 dilution yielded 102.07% accuracy with 4.63% RSD.
For RLPV, the 1/5 dilution produced 97.98% accuracy with 2.18% RSD, and the 1/10 dilution resulted in 98.87% accuracy with 3.77% RSD.
All values were within the ±15% acceptance criterion, confirming reliable quantification following sample dilution.
Auto sampler carryover effect
The carryover effect induced by the autosampler was evaluated by injecting a series of unextracted samples consisting of MP, AQ ULOQ, MP, and AQ LLOQ, as well as extracted samples consisting of standard STD Blank, ULOQ, STD Blank, and LLOQ [25-29]. During this trial, we did not find any substantial carryover. Table 5 summarizes the findings.
Table 5: Auto sampler carryover
| CBTG | RLPV | ||||
| Sample ID.0 | Peak area | Sample ID | Peak area | ||
| Drug | ISTD | Drug | ISTD | ||
| Unextracted samples | Unextracted samples | ||||
| MP | 0 | 0 | MP | 0 | 0 |
| AQ ULOQ | 382680 | 175953 | AQ ULOQ | 101440 | 175953 |
| MP | 0 | 0 | MP | 0 | 0 |
| AQ LLOQ | 9567 | 175741 | AQ LLOQ | 2609 | 175741 |
| Extracted samples | Extracted samples | ||||
| STD Blank | 0 | 0 | STD Blank | 0 | 0 |
| ULOQ | 382680 | 175752 | ULOQ | 101241 | 175752 |
| STD Blank | 0 | 0 | STD Blank | 0 | 0 |
| LLOQ | 9567 | 175768 | LLOQ | 2536 | 175768 |
MP: mobile phase; AQ: aqueous; ULOQ: upper limit of quantification; LLOQ: lower limit of quantification; STD: standard.
Stability of analytes
Stability studies were evaluated at both LQC and HQC levels. The following conditions and durations were applied:
Short-term (bench-top) stability: Samples were kept at room temperature for 7 h.
Long-term stability: Stability of the analytes and internal standards was assessed after storage at 2–8 °C for 10 d, 16 h, and 20 min.
Freeze–thaw stability: Samples underwent freeze–thaw cycles at –28±5 °C and –70±10 °C.
Bench-top stability (extended): Additional bench-top stability was assessed by keeping samples at room temperature for 17 h and 28 min.
Autosampler stability: Samples were stored in the autosampler at 5±3 °C for 2 d, 20 h, and 27 min.
Wet extract stability (room temperature): Processed samples were kept at room temperature for 23 h and 42 min.
Wet extract stability (refrigerated): Processed samples were kept at 2–8 °C for 2 d, 20 h, and 23 min.
Dry extract stability: Dried extracts were stored at –28±5 °C for 2 d, 20 h, and 2 min.
All stability results are presented in table 6, including the acceptance criterion (±15% of initial values). All stability assessments at LQC and HQC levels met the predefined acceptance criterion of ±15% of the initial mean area, indicating that CBTG and RLPV remained stable under all tested conditions. The stability studies including short-term, long-term, freeze–thaw, bench-top, autosampler, wet extract, and dry extract demonstrated % mean stability values within the acceptable range. A single borderline value (95.01% for CBTG under dry extract stability at the HQC level) was observed; however, this result remains within the acceptable limit (≥85%) and therefore does not affect the overall stability conclusion. These findings confirm that both analytes exhibit adequate stability during routine sample handling and analysis.
Table 6: Stability data for CBTG and RLPV (Acceptance criterion: % mean stability should be within ±15% of initial)
| Stability study | Concentration level |
CBTG | RLPV |
| Initial mean area | Stability samples area mean | ||
| Short term stability | LQC | 29006.17 | 28203.67 |
| HQC | 287026.70 | 280895.80 | |
| Long term stability | LQC | 29006.17 | 27608.50 |
| HQC | 287026.70 | 277587.50 | |
| Freeze thaw stability at-28±5 °C |
LQC | 29006.17 | 27870 |
| HQC | 287026.70 | 279456.80 | |
| Freeze thaw stability at-70±10 °C |
LQC | 29006.17 | 28103.67 |
| HQC | 287026.70 | 280730.80 | |
| Bench top stability | LQC | 29006.17 | 27842.00 |
| HQC | 287026.70 | 277811.30 | |
| Auto sampler stability | LQC | 29006.17 | 28214.17 |
| HQC | 287026.70 | 279491.20 | |
| Wet extract stability RT | LQC | 29006.17 | 27535.33 |
| HQC | 287026.70 | 277232.30 | |
| Wet extract stability (2-8 °C) | LQC | 29006.17 | 27870.33 |
| HQC | 287026.70 | 279282.00 | |
| Dry extract stability | LQC | 29006.17 | 27543.50 |
| HQC | 287026.70 | 272727.20 |
Acceptance criteria: % mean Stability should remain within ±15% of the initial mean area (i. e., 85%–115%). LQC: Low Quality Control; HQC: High Quality Control.
CONCLUSION
To estimate CBTG and RLPV in plasma samples at the same time, a targeted, trustworthy, and verified LC-MS/MS method was created. A Hypersil BDS C18 reverse-phase analytical column (50 × 4.6 mm, 5 µm) was used for analyte elution at 35 °C. The mobile phase consisted of 0.1% HCOOH, acetonitrile, and methanol in the fraction of 10:80:10 (%V/V/V) with a 0.70 ml/min flow rate. For each lot, linearity graphs were generated in the plasma sample across concentrations ranging from 5.8 to 232ng/ml for RLPV and 400 to 16000ng/ml for CBTG. Accuracy values were from 96.32% to 98.19% for CBTG and from 95.57% to 97% for RLPV, respectively, while intra-and inter-day precision values for CBTG and RLPV, correspondingly, were 0.39% to 3.82% RSD and 1.56% to 4.55% RSD, respectively. At three different QC levels, the average recovery values for CBTG ranged from 96.14% to 97.70%, while for RLPV, the values ranged from 96.06% to 97.75%. The dilution integrity of 1/5 and 1/10 was determined to have a CBTG precision of 3.77 and 4.63%, respectively. Results showed that the RLPV accuracy for dilution integrity of 1/5 was 2.18, and for a 1/10 it was 3.77%.
ABBREVIATIONS
CBTG: Cabotegravir; RLPV: Rilpivirine; LC-MS/MS: Liquid chromatography-Tandem mass spectrometry. LOQ: Lower quality control; HQC: High quality control; MQC: Median quality control; LLOQ: Lower limit of quality control; DIQC: Dilution integrity quality control; UPLC: Ultra performance liquid chromatography; RP-HPLC: Reverse phase high performance liquid chromatography; MRM: Multiple reaction monitoring; QC: Quality control; IS: internal standard.
ACKNOWLEDGMENT
Thanks to the Acharya Nagarjuna University, Guntur, India, and Chalapati Institute of Pharmaceutical Sciences, Lam, Guntur, India. for resources and support.
FUNDING
Nil
AUTHORS CONTRIBUTIONS
All the authors contributed equally to the research work.
CONFLICTS OF INTERESTS
The authors declare no conflict of interest.
REFERENCES
Ferretti F, Boffito M. Rilpivirine long-acting for the prevention and treatment of HIV infection. Curr Opin HIV AIDS. 2018;13(4):300-7. doi: 10.1097/COH.0000000000000474, PMID 29794818.
Stellbrink HJ, Hoffmann C. Cabotegravir: its potential for antiretroviral therapy and preexposure prophylaxis. Curr Opin HIV AIDS. 2018;13(4):334-40. doi: 10.1097/COH.0000000000000480, PMID 29746267.
Cattaneo D, Gervasoni C. Pharmacokinetics and pharmacodynamics of cabotegravir a long-acting HIV integrase strand transfer inhibitor. Eur J Drug Metab Pharmacokinet. 2019;44(3):319-27. doi: 10.1007/s13318-018-0526-2, PMID 30387005.
Swindells S, Andrade Villanueva JF, Richmond GJ. Long-acting cabotegravir+rilpivirine as maintenance therapy: ATLAS week 48 results. Presented at: Conference on Retroviruses and Opportunistic Infections (CROI); 2019 Mar 4-7.
Orkin C, Arasteh K, Hernandez Mora MG. Long-acting cabotegravir+rilpivirine for HIV maintenance: FLAIR week 48 results. Presented at: Conference on Retroviruses and Opportunistic Infections (CROI); 2019 Mar.
Janssen Pharmaceutical Companies of Johnson & Johnson. Janssen reports positive top-line phase 3 study results of investigational long-acting injectable HIV treatment regimen administered every two months; 2019. Available from: https://www.drugs.com/janssen-reports-positive-top-line-phase-3-study-results-investigational-long-acting-injectable-hiv-18243.html. [Last accessed on 03 Sep 2025].
Jackson AG, Else LJ, Mesquita PM, Egan D, Back DJ, Karolia Z. A compartmental pharmacokinetic evaluation of long-acting rilpivirine in HIV-negative volunteers for pre-exposure prophylaxis. Clin Pharmacol Ther. 2014;96(3):314-23. doi: 10.1038/clpt.2014.118, PMID 24862215.
Landovitz RJ, Li S, Grinsztejn B, Dawood H, Liu AY, Magnus M. Safety tolerability and pharmacokinetics of long-acting injectable cabotegravir in low-risk HIV-uninfected individuals: HPTN 077, a phase 2a randomized controlled trial. PLOS Med. 2018;15(11):e1002690. doi: 10.1371/journal.pmed.1002690, PMID 30408115.
Margolis DA, Gonzalez Garcia J, Stellbrink HJ, Eron JJ, Yazdanpanah Y, Podzamczer D. Long-acting intramuscular cabotegravir and rilpivirine in adults with HIV-1 infection (LATTE-2): 96-week results of a randomised open-label phase 2b, non-inferiority trial. Lancet. 2017;390(10101):1499-510. doi: 10.1016/S0140-6736(17)31917-7, PMID 28750935.
Vejendla A, Talari S, Moturu R, Boddapati SN, Kola AE. Method development and validation for Cabotegravir and Rilpivirine by using HPLC and its degradants are characterized by LCMS and FTIR. Futur J Pharm Sci. 2021;7(1):226. doi: 10.1186/s43094-021-00355-8.
Ramoller IK, Abbate MT, Vora LK, Hutton AR, Peng K, Volpe Zanutto F. HPLC-MS method for simultaneous quantification of the antiretroviral agents rilpivirine and cabotegravir in rat plasma and tissues. J Pharm Biomed Anal. 2022;213:114698. doi: 10.1016/j.jpba.2022.114698, PMID 35259714.
Courlet P, Alves Saldanha S, Cavassini M, Marzolini C, Choong E, Csajka C. Development and validation of a multiplex UHPLC-MS/MS assay with stable isotopic internal standards for the monitoring of the plasma concentrations of the antiretroviral drugs bictegravir cabotegravir doravirine and rilpivirine in people living with HIV. J Mass Spectrom. 2020;55(6):e4506. doi: 10.1002/jms.4506, PMID 32160389.
Bevers LA. Van Ewijk Beneken Kolmer EWJ, Te Brake HML, Burger DM. Development validation and clinical implementation of a UPLC-MS/MS bioanalytical method for simultaneous quantification of cabotegravir and rilpivirine E-isomer in human plasma. J Pharmacol Toxicol Methods. 2024;238:115832. doi: 10.1016/j.jpba.2023.115832.
Weld ED, Parsons TL, Gollings R, Mc Cauley M, Grinsztejn B, Landovitz RJ. Development and validation of a liquid chromatographic-tandem mass spectrometric assay for the quantification of cabotegravir and rilpivirine from dried blood spots. J Pharm Biomed Anal. 2023;228:115307. doi: 10.1016/j.jpba.2023.115307, PMID 36842333.
European Medicines Agency. Guideline on Bioanalytical Method Validation. London: EMA; 2011. Available from: http://www.ema.europa.eu/docs/en_GB/document_library/Scientific_guideline/2011/08/WC500109686.pdf. [Last accessed on 03 Sep 2025].
US Food and Drug Administration. Guidance for industry: bioanalytical method validation. In: Silver Spring, MD: FDA; 2018. Available https://www.fda.gov/downloads/drugs/guidances/ucm368107.pdf. [Last accessed on 03 Sep 2025].
Gallant JE, Thompson M, DeJesus E, Voskuhl GW, Wei X, Zhang H. Antiviral activity safety and pharmacokinetics of bictegravir as 10-day monotherapy in HIV-1-infected adults. J Acquir Immune Defic Syndr. 2017;75(1):61-6. doi: 10.1097/QAI.0000000000001306, PMID 28196003.
Yee KL, Sanchez RI, Auger P, Liu R, Fan L, Triantafyllou I. Evaluation of doravirine pharmacokinetics when switching from efavirenz to doravirine in healthy subjects. Antimicrob Agents Chemother. 2017;61(2):e01757-16. doi: 10.1128/AAC.01757-16, PMID 27872069.
Dadhaniya T, Chaudhary K, Mehta P. Development of LC-MS/MS method for determination of iloperidone in rabbit plasma: application to a pharmacokinetic study. Int J Pharm Pharm Sci. 2013;7(4):294-7.
Deepan T, Basaveswara Rao MV, Dhanaraju MD. Bioanalytical method development and validation of canagliflozin in human plasma by LC-MS/MS. Asian J Pharm Clin Res. 2019;12(8):46-51. doi: 10.22159/ajpcr.2019.v12i18.33228.
Gurav P, Damle M. Bioanalytical method for estimation of teriflunomide in human plasma. Int J Pharm Pharm Sci. 2022;14(9):19-23. doi: 10.22159/ijpps.2022v14i9.45151.
Nimmakayala MR, Kolli D, Durga Bhavani PN. Bioanalytical method development and validation of maralixibat in rat plasma by LC-MS/MS detection and its application to a pharmacokinetic study. Int J App Pharm. 2023;15(4):166-72. doi: 10.22159/ijap.2023v15i4.47768.
Parmar I, Patel YA. Recent method development by analytical techniques of new FDA-approved drugs in 2021. Int J Curr Pharm Sci. 2022;14(3):17-21. doi: 10.22159/ijcpr.2022v14i3.1975.
Ravi Y, Bhikshapathi D, Cheruku S, Rajkamal B. Development of fast and simple LC-ESI-MS/MS technique for the quantification of regorafenib; application to pharmacokinetics in healthy rabbits. Curr Pharm Anal. 2021;17(4):554-63. doi: 10.2174/1573412916666191111144707.
Rozet E, Ceccato A, Hubert C, Ziemons E, Oprean R, Rudaz S. Analysis of recent pharmaceutical regulatory documents on analytical method validation. J Chromatogr A. 2007;1158(1-2):111-25. doi: 10.1016/j.chroma.2007.03.111, PMID 17420026.
Hubert P, Nguyen Huu JJ, Boulanger B, Chapuzet E, Chiap P, Cohen N. Harmonization of strategies for the validation of quantitative analytical procedures. A SFSTP proposal part I. J Pharm Biomed Anal. 2004;36(3):579-86. doi: 10.1016/j.jpba.2004.07.027, PMID 15522533.
Lolla S, Gubbiyappa KS, Cheruku S, Bhikshapathi DV. Validation of an LC-MS/MS method for quantitation of fostemsavir in plasma. J Pharmacol Toxicol Methods. 2023;120:107254. doi: 10.1016/j.vascn.2023.107254, PMID 36863666.
Chapuzet E, Mercier N, Bervoas Martin S. Methodes chromatographiques de dosage dans les milieux biologiques: strategie de validation-rapport d’une commission SFSTP. STP Pharm Sci. 1997;7:169-94.
Krishnan VS, Bhikshapathi D, Cheruku S. Method development and validation for the quantification of abametapir in biological matrices by LC-ESI-MS/MS. Ind J Pharm Edu Res. 2024;58(3s):s1028-33. doi: 10.5530/ijper.58.3s.102.