
Int J App Pharm, Vol 18, Issue 2, 2026, 97-111Original Article
A NOVEL NANOPRECIPITATION ROUTE TO SILVER NANOPARTICLES: INSIGHTS INTO STRUCTURE, STABILITY, AND BIOACTIVITY
SUNIRMAL BHATTACHARJEE1,4, DEBJANI SARKAR1*, RICHA DAYARAMANI2, SWEET NASKAR3, SUBHASHIS DEBNATH4, SURAJ SHARMA5
1Department of Pharmaceutical Technology, JIS University, Nilgunj Rd, Agarpara, Kolkata, West Bengal - 700109, India. 2Centre for Medical Devices, NIPER – A, Gandhinagar, Gujarat, India. 3Institute of Pharmacy, Kalyani Kolkata, Nadia, West Bengal-741235, India. 4Bharat Pharmaceutical Technology, Amtali, Agartala, Tripura (W)-799130, India. 5Sikkim Professional College of Pharmaceutical Sciences, Gangtok, Sikkim-737121, India
*Corresponding author: Debjani Sarkar; *Email: debjani.sarkar@jisuniversity.ac.in
Received: 03 Sep 2025, Revised and Accepted: 15 Jan 2026
ABSTRACT
Objective: To synthesize silver nanoparticles (Ag-NPs) via a modified citrate reduction method and comprehensively evaluate their physicochemical properties, antimicrobial efficacy, and cytotoxicity for potential application in wound healing.
Methods: Ag-NPs were synthesized using silver nitrate and trisodium citrate as the reducing agent. The nanoparticles were characterized using UV-Vis spectroscopy, Fourier-Transform Infrared (FTIR) spectroscopy, X-ray Diffraction (XRD), Field Emission Scanning Electron Microscopy (FESEM), and Transmission Electron Microscopy (TEM). Dynamic light scattering was used to determine particle size, polydispersity index (PDI), and zeta potential (ZP). The antimicrobial activity was evaluated against a panel of microorganisms, including Escherichia coli, Pseudomonas aeruginosa, Enterococcus faecalis, Staphylococcus aureus, and Trichoderma asperellum. Cytocompatibility was assessed using the HaCaT human keratinocyte cell line via an MTT assay after 24 h of exposure.
Results: UV-Vis spectroscopy confirmed the formation of Ag-NPs with a characteristic surface plasmon resonance (SPR) peakat 407 nm. The nanoparticles were spherical and crystalline, with a size range of 26.82±0.42 nm to 306.00±0.31 nm and a zeta potential ranging from-9.13±0.12 mV to 30.89±0.30 mV, indicating moderate colloidal stability. The Ag-NPs demonstrated significant, broad-spectrum antimicrobial activity against all tested bacterial and fungal strains. Cytotoxicity assessment revealed a concentration-dependent effect on HaCaT cells, with an IC₅₀ value of approximately 9.93 µg/ml.
Conclusion: The successfully synthesized citrate-stabilized Ag-NPs possess desirable physicochemical characteristics and potent antimicrobial properties. Overall, the results suggest that Ag-NPs may be utilized as antimicrobial agents to promote wound healing.
Keywords: Silver nanoparticles, Synthesis, Characterization, Antimicrobial effect, MTT assay, Wound healing
© 2026 The Authors.Published by Innovare Academic Sciences Pvt Ltd. This is an open access article under the CC BY license (https://creativecommons.org/licenses/by/4.0/)
DOI: https://dx.doi.org/10.22159/ijap.2026v18i2.56744 Journal homepage: https://innovareacademics.in/journals/index.php/ijap
INTRODUCTION
The rapid advancement of nanotechnology has enabled the creation of nanomaterials with distinct and enhanced physical, chemical, and biological properties compared to their bulk counterparts [1-3]. Among noble metals, silver (Ag) is extensively researched due to its remarkable chemical stability, high conductivity, catalytic activity, and potent antimicrobial capabilities. These properties make Ag-NPs highly valuable for a broad spectrum of biomedical applications, including antimicrobial coatings, wound dressings, drug delivery systems, biosensors, and tissue engineering scaffolds [3-6].
The antimicrobial efficacy of Ag-NPs, which extends to bacteria, viruses, and fungi, is primarily attributed to the release of silver ions (Ag⁺). These ions generate reactive oxygen species (ROS) and can bind to membrane proteins and nucleic acids, triggering a cascade of events-including structural alterations, protein denaturation, and inhibition of replication—that ultimately lead to cell death [4-6]. Furthermore, the size-dependent optical properties of Ag-NPs, particularly their surface plasmon resonance, are exploited in applications such as deep tissue imaging, tumor targeting, and spectroscopic techniques like surface-enhanced Raman scattering (SERS) [7-14].
A critical factor influencing these properties is nanoparticle size and morphology, which is fundamentally governed by the kinetics of nucleation and growth during synthesis. The synthesis temperature is a well-established parameter for exerting this control, as it directly influences reaction rates and the final size of metallic nanoparticles such as Ag-NPs [15].
Smaller particles possess a higher surface-area-to-volume ratio, leading to greater physiological activity, as evidenced by Tawfeeq [16], who showed that 100 nm Ag-NPs could induce apoptosis in human glioblastoma cells.
The citrate reduction method, pioneered by Turkevich et al. in 1951 [17] is a cornerstone for synthesizing Ag-NPs due to its simplicity and use of benign reagents. However, a significant challenge with the classical one-pot Turkevich synthesis typically, involving rapid heating to a rolling boil (~100 °C) with a fixed reagent ratio, was the precise control over particle size distribution and aggregation tendency. This can limit its effectiveness for applications requiring high uniformity. To address this, our study introduces a modified citrate reduction protocol. While maintaining the core principles of the method, our modification introduced two specific, quantitative optimizations designed to decouple nucleation and growth phases more effectively:
We replaced the standard single boiling step with a precise thermal ramp, heating the reaction mixture from ambient temperature to 60 °C at a rate of 5 °C/min, holding for 10 min to promote homogeneous nucleation, before a final ramp to 90 °C to complete growth. This gradual temperature increase was designed to yield a narrower size distribution.
We employed a molar ratio of silver nitrate to trisodium citrate of 1:3, deviating from common ratios (e. g., 1:1). This increased citrate concentration enhances its dual role as a reducing and capping agent, improving colloidal stability and preventing aggregation.
This strategy was created to attain a more homogeneous nucleation and growth environment, with the hypothesis that it would yield Ag-NPs with improved monodispersity and colloidal stability compared to those from the standard one-pot synthesis. The synthesized Ag-NPs were then comprehensively characterized and evaluated using UV-Vis, FTIR, XRD, FESEM, TEM, and DLS (for size and zeta potential). To evaluate their potential for biomedical application by investigating their antibacterial efficacy and cytotoxicity to assess their potential for wound healing applications.
MATERIALS AND METHODS
Chemicals and reagents
Silver nitrate (AgNO₃, ≥99.0%) was procured from National Chemicals, India. Trisodium citrate dihydrate (Na₃C₆H₅O₇·2H₂O, ≥99.0%) was procured from Merck, Germany. All other chemicals and reagents were of analytical grade. Potassium chloride (KCl) and Absolute ethanol were obtained from Lab India Ltd, India. For cell culture studies, Dulbecco’s Modified Eagle Medium (DMEM), fetal bovine serum (FBS), dimethyl sulfoxide (DMSO), and the MTT (3-(4,5-dimethylthiazol-2-yl)-2,5-diphenyltetrazolium bromide) assay kit were procured from Gibco/Thermo Fisher, USA. Throughout the synthesis and experimental studies, ultrapure Millipore water with a resistivity of 18.2 MΩ·cm was utilized. All chemicals were used as received without further purification.
Synthesis of silver nanoparticles (Ag-NPs)
Silver nanoparticles were synthesized using a modified citrate reduction method. Briefly, an aqueous solution of silver nitrate (1 mmol, 100 ml) was heated to 60 °C under vigorous stirring. A predetermined volume of trisodium citrate solution (10 mmol) was then added dropwise to achieve a final AgNO₃: citrate molar ratio of 1:3. The mixture was maintained at 60 °C for 10 min before the temperature was raised to 80 °C and held for 30 min. The reaction was continued until a persistent yellow-brown color indicated nanoparticle formation. The colloid was then cooled to room temperature, centrifuged, washed twice with ethanol and water, and the pellet was redispersed in Millipore water for further characterization [17].
The synthesis parameters for different formulations (F-1 to F-5) are provided in table 1. To ensure clarity and reproducibility, the table now includes the calculated molar concentrations of the precursors.
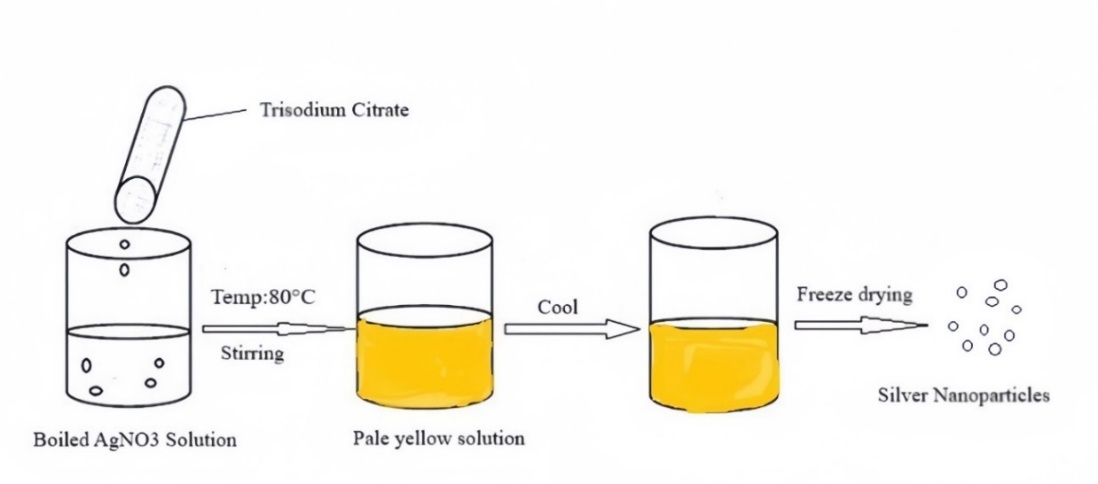
Fig. 1: The schematic representation of the modified citrate reduction method
Table 1: Composition and molar concentrations of different Ag-NP Formulations (n=3)
| Formulation code | Weight of AgNO3 (mg) | Na3C6H5O7(mg) | Final volume (ml) | Molarity of AgNO₃ (mM) | Molarity of Na₃C₆H₅O₇ (mM) |
| F-1 | 16.9 | 200 | 100 | 1.0 | 6.8 |
| F-2 | 37.8 | 400 | 200 | 1.1 | 6.8 |
| F-3 | 20.0 | 250 | 140 | 0.8 | 6.0 |
| F-4 | 15.9 | 180 | 100 | 0.9 | 6.1 |
| F-5 | 17.9 | 210 | 110 | 0.9 | 6.1 |
The endpoint of the reaction was determined quantitatively by monitoring the solution’s UV-Vis absorbance spectrum. Heating was stopped when the characteristic SPR peak for Ag-NPs was observed between 400-420 nm, which typically occurred within 20-25 min of citrate addition.
Methods
Characterization of prepared Ag-NPs
UV-visible spectroscopy
The maximum absorbance of Ag-NPs was measured at pH 7.4 using a JASCO V-550 double-beam UV/vis spectrophotometer (JASCO Corporation, Tokyo, Japan). The UV spectrum of Ag-NPs was obtained using a 1 cm cell, and the solution scanning was performed at a speed of 400 nm/min between 200 nm and 800 nm wavelengths.
Size
A Zetasizer (Malvern Zen 350, Malvern Panalytical Ltd, UK) was used to measure the Ag-NPs’ particle size. Using 1:5-time dilutions, 100 µl** of the produced Ag-NPs dispersion was diluted to 5 ml using double-distilled water, and the size was determined. Every sample underwent three examinations.
Polydispersity index
A Zetasizer (Malvern Zen 350, Malvern Panalytical Ltd, UK) was used to measure the Ag-NPs’PDI. Using 1:5-time dilutions, 100 µl** of the produced Ag-NPs dispersion was diluted to 5 ml using double-distilled water, and the size was determined. Every sample underwent three examinations.
Zeta potential
Ag-NPs’ZP was ascertained using Zetasizer (Malvern Zen 350, Malvern Panalytical Ltd, UK). Ag-NP samples were diluted with potassium chloride (KCL) (0.1 mmol) and then placed in an electrophoretic cell with an electrical field of 15.2 Vcm-1. A Zetasizer (Malvern Zen350) was used to measure the Ag-NPs’ZP. Using 1:5-time dilutions, 100 µl** of the produced Ag-NPs dispersion was diluted to 5 ml using double-distilled water, and the size was determined. Every sample underwent three examinations.
FTIR analysis
An IR spectrophotometer (PerkinElmer Spectrum Two spectrometer, PerkinElmer Inc., USA) was used to record the spectra for the Ag-NP formulation. Samples were made using the KBr pellet method, which involved gently combining 1 mg of the sample with 200 mg of KBr within the scanning range of 4000-400 cm-1.
XRD analysis
One effective method for identifying crystallinity was X-ray diffractometry (XRD). Cu-Kα radiation with a wavelength of 1.5404 Å was used for XRD investigation on a Rigaku Ultima III X-ray diffractometer (Bruker D8 Advance diffractometer, Bruker Corporation, USA) at 40kV and 36mA.
TEM
Using a Transmission Electron Microscope (FEI, Tecnai G2, TF30-ST, FEI Company, USA), the morphology of Ag-NPs was examined. To do this, a drop of the nanoparticle formulation was put on the sample holder and allowed to air dry after the freeze-dried Ag-NPs had been appropriately diluted 100 times with double-distilled water. A platinum coating machine (FEI, Tecnai G2, TF30-ST; fine coater) was used to sputter coat this. The sample was then put in a TEM and studied at different magnifications at an accelerating voltage of 15,000 volts. In general, a high vacuum was used to perform TEM imaging.
Field emission scanning electron microscope (FESEM)
The size and shape of Ag-NPs were examined. Carbon-coated copper grids were coated with a drop of the substance, which was then allowed to dry. The grid containing the nanoparticle sample as a dry film was dyed with a suitable reagent after the excess liquid had been drained off and allowed to dry. A scanning electron microscope (SEM) (SIGMA VPFESEM, ZEISS, Carl Zeiss AG, Oberkochen, Germany) was used to view the dry film.
Antimicrobial assay
The minimum inhibitory concentration (MIC) of the Ag-NPs was determined against selected bacterial strains using the broth microdilution method as per CLSI guidelines (M07-A10). Briefly, two-fold serial dilutions of the Ag-NP dispersions were prepared in Mueller-Hinton broth directly in a 96-well microtiter plate. Each well was then inoculated with a standardized bacterial suspension to achieve a final concentration of ~5 × 10⁵ CFU/ml. The positive control (bacteria without Ag-NPs) and the negative control (sterile broth) were included. The plate was incubated at 37 °C for 18-24 h, after which the MIC was recorded as the lowest concentration of Ag-NPs that prevented visible turbidity.
Anti-microbial activity assay (E. coli)
0.5McFarland standard dilution of the microorganisms was employed in the investigation. Five microliters of prepared treatment dilutions of varying strengths (0 µg/ml, 1.08 µg/ml, 5.42 µg/ml, 10.79 µg/ml, 26.97 µg/ml, 53.94 µg/ml, and 107.87 µg/ml) were added to the designated tubes after 100 µl of diluted log cultures of the test organism (E. coli–MTCC 452) had been introduced to the microcentrifuge tube. The tubes were then incubated for twenty-four hours. Following incubation, all of the material was moved to a 96-well plate, and a turbidity reading was obtained at 630 nm using an Elisa Plate Reader (iMarkBiorad). Graph Pad Prism-6 and the gompertz model were used to estimate the MIC and no inhibitory concentration (NIC) values. Additionally, the graph displays the junction of the curve’s projection at the inflection point (red angled) and the horizontal line at the curve's top (or bottom) plateau (horizontally dotted). The logarithm of concentration was shown on the X-axis, and the percentage of growth relative to control was shown on the Y-axis [17, 18].
Anti-microbial activity assay (P. aeruginosa)
0.5 McFarland standard dilution of the microorganisms was employed in the investigation. The microcentrifuge tube was filled with 100 µl of diluted log cultures of the test organism (P. aeruginosa – MTCC 3541). Five µl of prepared treatment dilutions of varying strengths (0 µg/ml, 1.08 µg/ml, 5.42 µg/ml, 10.79 µg/ml, 26.97 µg/ml, 53.94 µg/ml, and 107.87 µg/ml) were then added to the designated tubes, and the tubes were incubated for twenty-four hours. Following incubation, all of the material was moved to a 96-well plate, and a turbidity reading was obtained at 630 nm using an Elisa Plate Reader (iMarkBiorad). Graph Pad Prism-6 and the Gompertz model were used to estimate the MIC and NIC values. Additionally, the horizontal line intersection at the curve’s top (or bottom) plateau (horizontally dotted) was displayed on the graph. Additionally, the graph displays the junction of the curve’s projection at the inflection point (red angled) and the horizontal line at the curve's top (or bottom) plateau (horizontally dotted). The logarithm of concentration is shown on the X-axis, while the percentage of growth relative to control is shown on the Y-axis [18, 19].
Anti-microbial activity assay (E. faecalis)
0.5 Mc Farland Standard dilution of microbes to be used for the study. 100 µl diluted log cultures of test organism (E. faecalis-MTCC429) was added to the microcentrifuge tube and added with 5 µl of prepared treatment dilutions of different concentrations (0 µg/ml, Positive control (ciprofloxacin 2 mg/ml), 1.08 µg/ml, 5.42 µg/ml, 10.79 µg/ml, 26.97 µg/ml, 53.94 µg/ml, and 107.87 µg/ml) to the defined tubes and incubated for the 24 h. After Incubation all content was transferred to the 96 well plate and turbidity reading was taken by Elisa Plate Reader (iMarkBiorad) at 630 nm. Ciprofloxacin (2 mg/ml) was used as Positive Control. MIC and NIC values were estimated using the software Graph Pad Prism-6 and the Gompertz model. The graph also shows the intersection of the horizontal line at the top (or bottom) plateau of the curve (horizontally dotted) and the projection of the curve at the inflection point (red angled). The X-axis presents the logarithm of concentration and the Y-axis presents the % Growth vs Control [19].
Anti-fungal activity assay (S. aureus)
0.5 McFarland standard dilutions were employed in the microbes for investigation. The microcentrifuge tube was filled with 100 µl of diluted log cultures of the test organism (S. aureus-MTCC 96). 7µl of prepared treatment dilutions of varying strengths (0 µg/ml, 1.08 µg/ml, 5.42 µg/ml, 10.79 µg/ml, 26.97 µg/ml, 53.94 µg/ml, and 107.87 µg/ml) were then added to the designated tubes, and the tubes were incubated for 24 h. Following incubation, all of the material was moved to a 96-well plate, and a turbidity reading was obtained at 630 nm using an Elisa Plate Reader (iMarkBiorad). Ciprofloxacin (10µg-SRL Chem-78079) was used as the Positive Control. Graph Pad Prism-6 and the gompertz model were used to estimate the MIC and NIC values. Additionally, the horizontal line intersection at the curve’s top (or bottom) plateau (horizontally dotted) was displayed on the graph. Additionally, the graph displays the junction of the curve’s projection at the inflection point (red angled) and the horizontal line at the curve’s top (or bottom) plateau (horizontally dotted). The logarithm of concentration is shown on the X-axis, while the percentage of growth relative to control is shown on the Y-axis [18-20].
Anti-fungal activity assay (T. asperellum)
0.5 McFarland standard dilution of the microbes was employed in the investigation. 500 µl diluted log cultures of the test organism (T. asperellum-MTCC4347) was added to the microcentrifuge tube and added with 25 µl of prepared treatment dilutions of different concentrations (0 µg/ml, 1.08 µg/ml, 5.42 µg/ml, 10.79 µg/ml, 26.97 µg/ml, 53.94 µg/ml, and 107.87 µg/ml) to the defined tubes and incubated for 24 h. After Incubation, all content was transferred to the 96-well plate, and turbidity reading was taken by Elisa Plate Reader (iMarkBiorad) at 630 nm. Amphotericin B (50 µg) was used as a Positive Control. Graph Pad Prism-6 and the gompertz model were used to estimate the MIC and NIC values. Additionally, the horizontal line intersection at the curve’s top (or bottom) plateau (horizontally dotted) was displayed on the graph. Additionally, the graph displays the junction of the curve’s projection at the inflection point (red angled) and the horizontal line at the curve's top (or bottom) plateau (horizontally dotted). The logarithm of concentration is shown on the X-axis, while the percentage of growth relative to control is shown on the Y-axis [18-20].
In vitro cytotoxicity study
Sample preparation for Ag-NPs
For biological testing, a stock suspension of the synthesized Ag-NPs was prepared in sterile phosphate-buffered saline (PBS) or cell culture medium (as appropriate) at a concentration of 1 mg/ml. This stock was sonicated for 15 min to ensure homogeneity and prevent aggregation. From this stock, a series of working concentrations (e. g., 1, 5, 10, 25, 50, 100 µg/ml) was prepared via serial dilution in the relevant sterile medium (Mueller-Hinton broth for antimicrobial tests or DMEM for cytotoxicity assays) immediately prior to each experiment. The sterility of the nanoparticle suspensions was confirmed by the absence of microbial growth in control samples.
MTT assay
The MTT assay was used to assess the samples’ cytotoxicity on the HaCaT (purchased from NCCS Pune) cell line. 10,000 cells per well were cultivated in 96-well plates for 24 h in DMEM medium (Dulbecco's Modified Eagle Medium-AT149-1L-HIMEDIA) supplemented with 1% antibiotic solution (Penicillin-Streptomycin-Sigma-Aldrich P0781) and 10% FBS (Fetal Bovine Serum-HIMEDIA-RM 10432) at 37 °C with five percent CO2 [21]. Cells were treated with varying doses of the samples the following day (0 µg/ml, 0.11 µg/ml, 1.08 µg/ml, 5.42 µg/ml, 10.79 µg/ml, 26.97 µg/ml, 53.94 µg/ml, and 107.87 µg/ml). To obtain varying quantities in an inadequate cell culture medium (without FBS), a stock solution of samples was made in distilled water and then further diluted [22]. MTT (5 mg/ml) was added to the cell culture after a 24-hour incubation period, and the culture was then incubated for an additional 2 h. Untreated cells were taken into consideration. Cells without MTT were referred to as Blank, and cells without treatment were referred to as Control. Following the removal of the culture supernatant after the experiment, the cell layer matrix was dissolved in 100 µl of Dimethyl Sulfoxide (DMSO–SRL-Cat no. 67685), and the results were measured at 540 nm using an Elisa plate reader (iMark, Biorad, USA) [23]. Graph Pad Prism-6 was used to compute the IC50. Images were taken with a camera (Am Scope digital camera 10 MP Aptima CMOS) and an inverted microscope (Olympus ek2). Results were presented as mean±SEM. The given formula was used for calculating the percentage of viable cells [24].
(Atest = Absorbance of the test sample)
(AControl= Absorbance of control sample)
Lyophilization of NPs
The Ag-NPs solution was made and stored for the night at-40 °C in a deep freezer (Scanlaf, cool safe 55-4). The frozen formulation samples were then placed in a freeze-dryer (Vaccubrand RZ2.5; Scanlaf, cool safe 55-4). To obtain a powdered lyophilized product, the sample was dried for approximately 72 h while a vacuum was applied. Once the ZP, PDI, and particle size have been measured, the powdered formulation is employed for additional research.
Stability studies
For 6 mo, the freeze-dried Ag-NPs producedwere kept in a refrigerator. Particle size, PDI, ZP, assay, and entrapment efficiency were measured at regular intervals after one, three, and six months of storage to track formulation changes.
Statistical analysis
For MIC/NIC value data are presented as the mean value from n=3 independent antimicrobial assays. Data from stability studies are presented as mean±standard deviation (SD) of triplicate measurements. For a DLS/TEM size distribution graph: value represent the mean±standard deviation (SD) from n=3 measurements of independently prepared samples. For an MTT assay dose-response curve: Data points show the mean±standard error of the mean (SEM) from n=3 independent experiments, each performed in triplicate. The IC₅₀ was calculated from the combined data. Statistical significance between time points was determined using one-way analysis of variance (ANOVA) followed by Tukey’s post-hoc test, with for p<0.05 considered significant.
RESULTS AND DISCUSSION
UV-visible spectra
The SPR band of Ag-NPs was indicated by a peak in UV-visible absorption spectra at 407 nm. This revealed the existence and behavior of Ag-NPs in the sample, enabling thorough characterization of the nanoparticles and offering important insights into their optical characteristics. In addition to confirming the presence of Ag-NPs, the accurate measurement and characterization of this SPR band at 407 nm provided a better understanding of their behavior and interactions in the solution. The SPR band at 407 nm using UV-visible spectroscopy highlighted the value of precise and accurate analytical methods in the study of nanomaterials such as silver nanoparticles, illuminating their fascinating optical phenomena. Fig. 2 displays the synthesized Ag-NPs’ UV-vis spectrum [25].
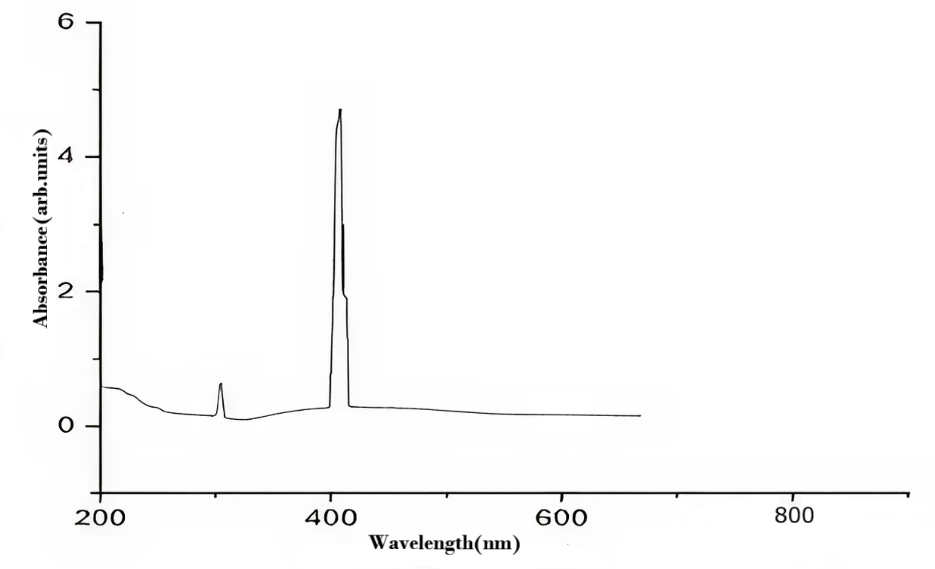
Fig. 2: UV-vis spectrum of Ag-NPs
Size
Dynamic light scattering (DLS) measured particle size distribution of nanoparticles, ranging from 26.82±0.42 to 306.00±0.31 nm. This increased surface area enhances interaction with microbial cell membranes, releasing silver ions and disrupting cell physiology. The diffusion of nanoparticles within microorganisms is significantly influenced by their smaller size. The main way that silver ions work is by causing the creation of ROS, which starts the biocidal or fungicidal effects. This initiates a series of events that culminate in the delamination and rupturing of the cell membrane. It also messes with transport and membrane proteins, as well as metabolic and signalling networks. Replication failure ultimately results from this, which lyses and kills microbial cells [26]. The particle size of synthesized Ag-NPs is given in fig. 3.
Polydispersity index
The PDI values of Ag-NPs range between 0.2801±0.09 and 0.439±0.217. This confirms the stability, uniformity, and quality of Ag-NPs, indicating a moderate to high polydispersity. Characterization of different Ag-NP formulations is given in table 2.
Zeta potential
The ZP values for formulations F-1, F-2, F-4, and F-5 are negative, as expected for citrate-capped Ag-NPs. However, the strongly positive value for formulation F-3 (+30.89 mV) is inconsistent with a pure citrate-stabilized system. This suggests potential contamination, incomplete removal of unreacted Ag⁺ ions, or a measurement artifact specific to that sample. Consequently, the data for F-3 should be interpreted with caution, and the formulation is not recommended for applications requiring the well-established anionic surface chemistry of citrate-capped nanoparticles. The Zeta potential of Ag-NPs is given in fig. 4.
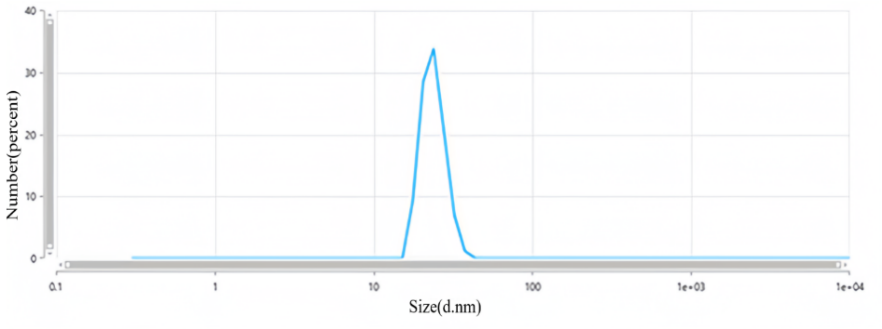
Fig. 3: Particle size of Ag-NPs (F-1)
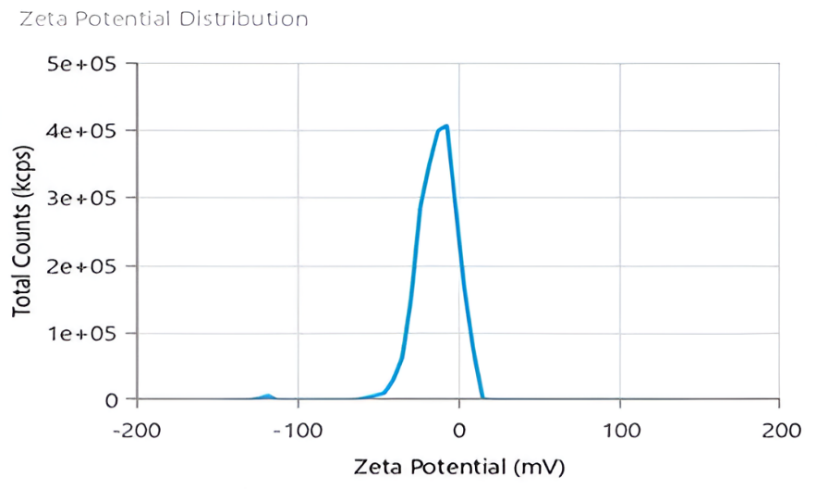
Fig. 4: Zeta potential of Ag-NPs (F-2)
Table 2: Characterization of different Ag-NP formulations
| Formulation code | Particle size(nm) | Zeta potential (mV) | Polydispersity index |
| F-1 | 26.82±0.347 | -9.126±0.124 | 0.383±0.189 |
| F-2 | 148.00±0.542 | -13.34±0.165 | 0.439±0.217 |
| F-3 | 306.00±0.478 | 30.89±0.298 | 0.418±0.209 |
| F-4 | 152.5±0.321 | -15.67±0.185 | 0.394±0.178 |
| F-5 | 131.10±0.245 | -41.61±0.267 | 0.2801±0.145 |
Results are presented as mean±SD, n=3
FTIR analysis
FTIR spectroscopy was employed to confirm the role of sodium citrate as both a reducing and capping agent on the surface of the synthesized Ag-NPs. The FTIR spectra of pure sodium citrate and the citrate-capped Ag-NPs are compared in fig. 5 to identify key binding interactions.
The spectrum of pure sodium citrate (fig. 5) displays characteristic peaks of its carboxylate groups. The strong, broad band centered at ~3450 cm⁻¹ is attributed to O–H stretching vibrations. The two most significant features are the asymmetric stretching vibration (νₐs COO⁻) at 1587 cm⁻¹ and the symmetric stretching vibration (νₛ COO⁻) at 1390 cm⁻¹ [27, 28].
The FTIR spectrum of the synthesized Ag-NPs (fig. 5) shows distinct shifts in these key carboxylate peaks, confirming the coordination of citrate to the silver surface. The asymmetric COO⁻ stretch shifts from 1587 cm⁻¹ to 1602 cm⁻¹, while the symmetric COO⁻ stretch shifts from 1390 cm⁻¹ to 1384 cm⁻¹. This change in the peak positions and the reduction in the separation (Δν) between νₐs and νₛ from ~197 cm⁻¹ to ~218 cm⁻¹ indicates a binding mode where the carboxylate groups coordinate directly to the Ag⁰ surface, likely in a unidentate or bridging configuration [27, 29].
The broad O–H stretching band persists in the Ag-NPs spectrum, which is expected due to the hydroxyl groups of citrate and potentially adsorbed water. Peaks in the range of 1000-1300 cm⁻¹, corresponding to C–O and C–C stretching vibrations of the citrate backbone, are also observed in both spectra but with minor shifts upon binding.
Notably, the absence of a characteristic C=O stretch above 1700 cm⁻¹ in the Ag-NPs spectrum confirms that the citrate remains in its deprotonated (carboxylate) form and did not convert back to a carboxylic acid during synthesis.
In conclusion, the FTIR analysis confirms the successful chemisorption of citrate molecules onto the nanoparticle surface via carboxylate groups. The functional groups present are consistent with citrate and adsorbed water, featuring O–H and COO⁻ bands, with no evidence of extraneous nitrile or amine moieties.
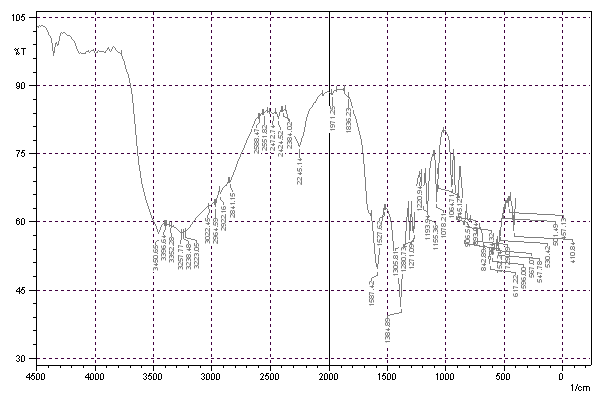
Fig. 5: FTIR spectrum of synthesized Ag-NPs
XRD analysis
XRD analysis was employed to unambiguously determine the crystalline phase, purity, and structural characteristics of the synthesized nanoparticles. The diffraction pattern, presented in fig. 6, provides critical insights into the outcome of the synthesis process.
A definitive observation from the XRD pattern was the complete absence of the characteristic diffraction peaks for face-centered cubic (fcc) metallic silver (Ag⁰). The expected peaks for Ag⁰ (JCPDS 04-0783), such as 38.1° , 44.3° , 64.4° , and 77.3° , were not present. Instead, the observed set of peaks at 2θ = 12.55°, 17.45°, 24.15°, 27.45°, 29.40°, 31.95°, 37.05°, 41.08°, 50.48°, and 61.05° indicates the formation of a different, non-metallic crystalline product.
Phase identification and synthesis pathway
Careful comparison with the ICDD database reveals an excellent correspondence between the acquired pattern and those of silver oxide (Ag₂O, JCPDS 41-1104) and silver carbonate (Ag₂CO₃, JCPDS 26-0339) [30, 31]. The prominent peak at approximately 32.0° was a signature reflection for the plane of Ag₂O, while the peak at 37.05° could be indexed to its plane. The lower-angle peaks (e. g., 12.55°, 17.45°) were consistent with the crystal structure of Ag₂CO₃.
Therefore, the synthesized nanoparticles were not metallic silver but a composite of silver oxide (Ag₂O) and silver carbonate (Ag₂CO₃). This phase composition suggests a specific synthesis pathway:
Incomplete reduction
The presence of Ag₂O indicates that the reducing power of citrate under the applied conditions was insufficient to fully reduce all Ag⁺ ions to Ag⁰, leaving a significant fraction as Ag⁺ in an oxide matrix.
Carbonate formation
The detection of Ag₂CO₃ was a significant finding. Silver ions in solution were known to react with atmospheric carbon dioxide (CO₂) in the presence of a base (e. g., from the NaOH often used to adjust pH in such syntheses) to form insoluble silver carbonate [32]. This side reaction effectively competes with the reduction process, consuming a portion of the silver precursor.
Structural and morphological inferences
The X‑ray diffraction pattern reveals the presence of both Ag₂O and Ag₂CO₃ phases, indicating a composite nanostructure. The diffraction peaks attributed to Ag₂O were notably broadened. This confirms the successful formation of nanoparticles, as opposed to bulk crystalline material. However, the presence of multiple phases (Ag₂O and Ag₂CO₃) implies a composite nanostructure.
Implications of the composite nature
The synthesis yielded an Ag₂O/Ag₂CO₃ nanocomposite, not metallic Ag⁰ nanoparticles. This has direct implications for interpreting the material’s properties. While metallic silver was renowned for its plasmonic activity (explaining the observed UV-Vis peak), silver oxide (Ag₂O) was a p-type semiconductor with recognized potential in photocatalysis and as an antimicrobial agent that releases Ag⁺ ions. Silver carbonate was also an active compound. Consequently, all subsequent discussions of antimicrobial activity and cytotoxicity must be framed in the context of this Ag₂O/Ag₂CO₃ composite, not metallic Ag⁰.
TEM
The properties of the Ag-NPs were evaluated using TEM, revealing crucial information about their size and shape. A thorough analysis made possible by the use of TEM provided a thorough comprehension of the morphology of the Ag-NPs. The findings demonstrated that the Ag-NPs were primarily approximately spherical, which was consistent with the results predicted from the micrographs shown in fig. 7.
FESEM
FESEM reveals a pattern of agglomeration in the synthesized Ag-NPs particles, suggesting interconnected particles during the synthesis process. This insight into particle formation allows for a better understanding of their properties and potential applications. The images provided valuable information for further analysis and interpretation of the agglomerated state of Ag-NPs. FESEM of Ag-NPs is given in fig. 8.
Anti-microbial activity assay
The antimicrobial action of Ag-NPs was directly proportional to their size, as smaller Ag-NPs enhance internalization and growth inhibition, as seen in Ag-NPs against E. coli, P. aeruginosa, E. faecalis, S. aureus, and T. asperellum.
Anti-microbial activity assay (E. coli)
The investigation revealed variable bacterial reactivity by testing substances against E. coli at different doses. The MI Cof Ag-NPs in the case of E. coli was 14.35 µg/ml, which was the lowest concentration of Ag-NPs needed to stop the bacteria’s growth. In the same way, Ag-NPs’ NIC value is 4.89 µg/ml. According to these results, E. coli was not inhibited by concentrations below 4.89 µg/ml, however, doses over 14.35 µg/ml significantly limit bacterial growth. The study recorded MIC and NIC values, indicating the potency of possible antimicrobial effects. As shown in fig. 9, the percentage of growth MIC was 100, 63.46, 59.26, 48.25, 44.54,42.94, and 40.62 for Ag-NPs concentrations of 0 µg/ml, 1.08 µg/ml, 5.39 µg/ml, 10.79 µg/ml, 26.97 µg/ml, 53.94 µg/ml, and 107.87 µg/ml, respectively, when compared with the control group [28-31]. MIC assay of (E. coli) of Ag-NPs is given in fig. 9. %Growth vs control and concentration (µg/ml) of MIC of (E. coli) of Ag-NPs is given in fig. 10. % Growth vs control vs concentration (µg/ml) of NIC of (E. coli) of Ag-NPs is given in fig. 11.
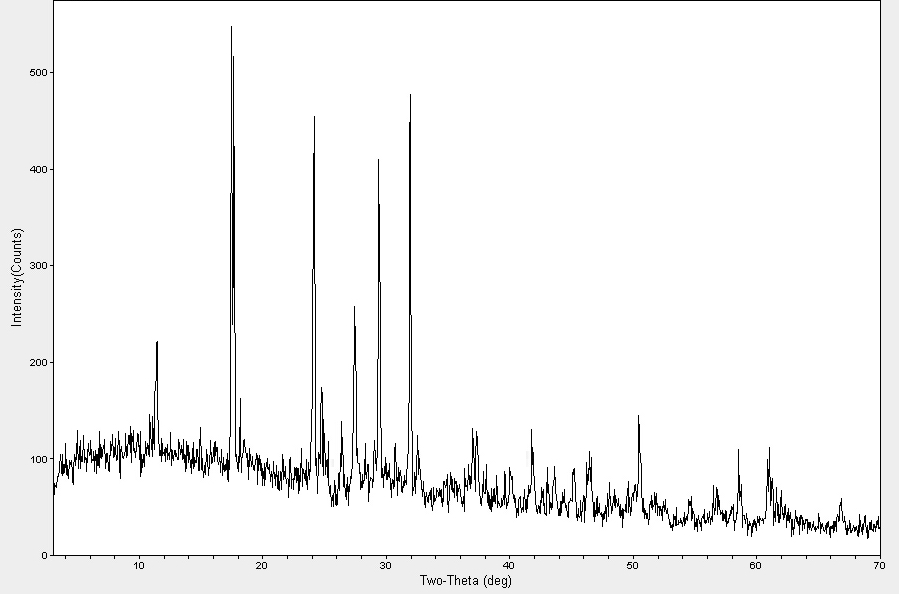
Fig. 6: X-ray diffraction patterns of Ag-NPs
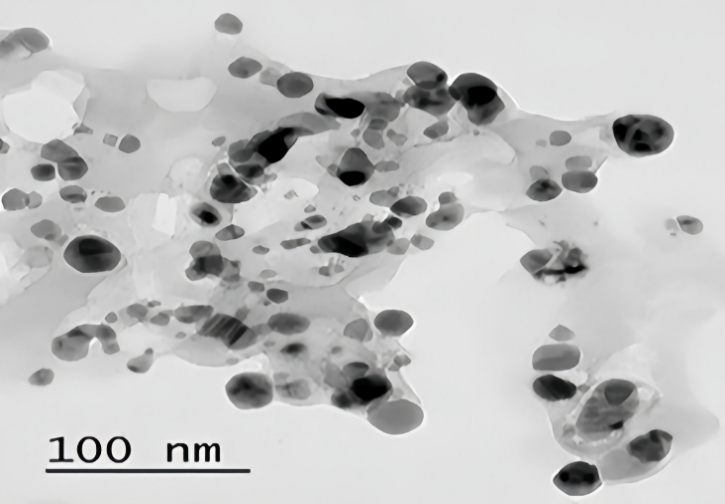
Fig. 7: TEM image of Ag-NPs
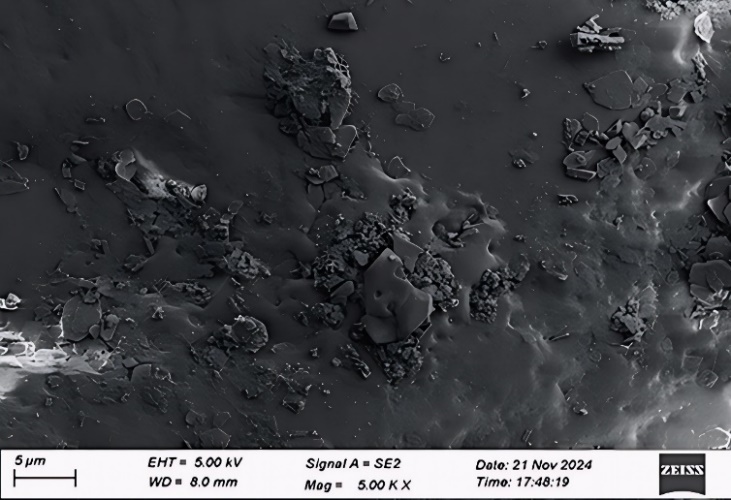
Fig. 8: Field emission scanning electron microscopy of Ag-NPs
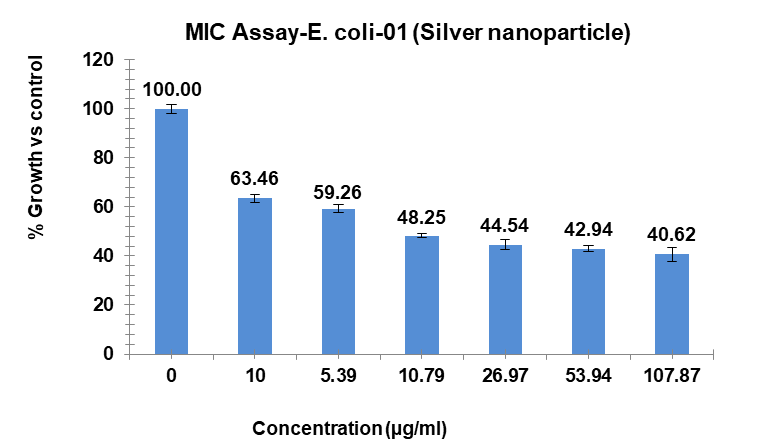
Fig. 9: MIC assay of (E. coli) of Ag-NPs. Results are presented as mean±SD, n=3
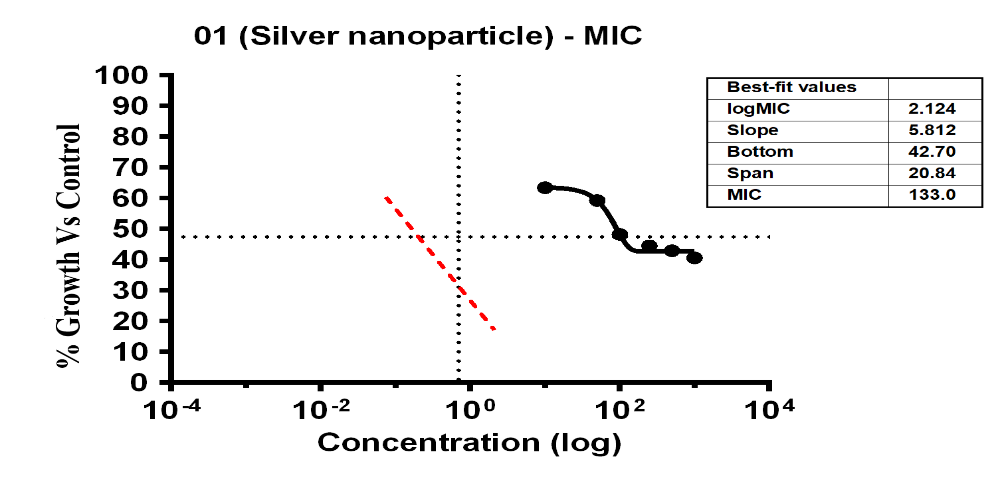
Fig. 10: % Growth vs Control vs concentration (µg/ml) of MIC of (E. coli) of Ag-NPs
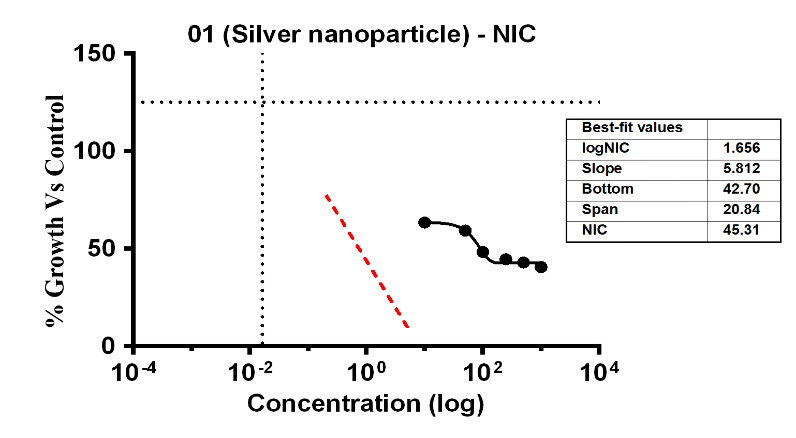
Fig. 11: % Growth vs control vs concentration (µg/ml) of NIC of (E. coli) of Ag-NPs
Anti-microbial activity assay (P. aeruginosa)
The study found that the substances exhibited differing levels of antimicrobial activity against P. aeruginosa when tested at different doses. The MIC of silver Ag-NPs in the case of P. aeruginosa was 29.36 µg/ml, which was the lowest concentration of Ag-NPs needed to stop the bacteria’s growth. In the same way, Ag-NPs’ NIC value is 13.15 µg/ml; According to these results, P. aeruginosa was not inhibited by concentrations below 13.15 µg/ml, however, doses over 14.35 µg/ml significantly limit bacterial growth. The study recorded MIC and NIC values, indicating the potency of possible antimicrobial effects. The study recorded MIC and NIC values, indicating the potency of possible antimicrobial effects. As shown in fig. 12, the percentage of growth MIC was 100, 77.59, 74.40, 73.75, 48.99,47.50, and 42.43 for Ag-NPs concentrations of 0 µg/ml, 1.08 µg/ml, 5.39 µg/ml, 10.79 µg/ml, 26.97 µg/ml, 53.94 µg/ml, and 107.87 µg/ml, respectively, when compared with the control group [28-31]. MIC assay of (P. aeruginosa) of Ag-NPs, fig. 12. % Growth vs control and concentration (µg/ml) of MIC of (P. aeruginosa) of Ag-NPs is given in fig. 13. % Growth vs control vs concentration (µg/ml) of NIC of (P. aeruginosa) of Ag-NPs fig. 14.
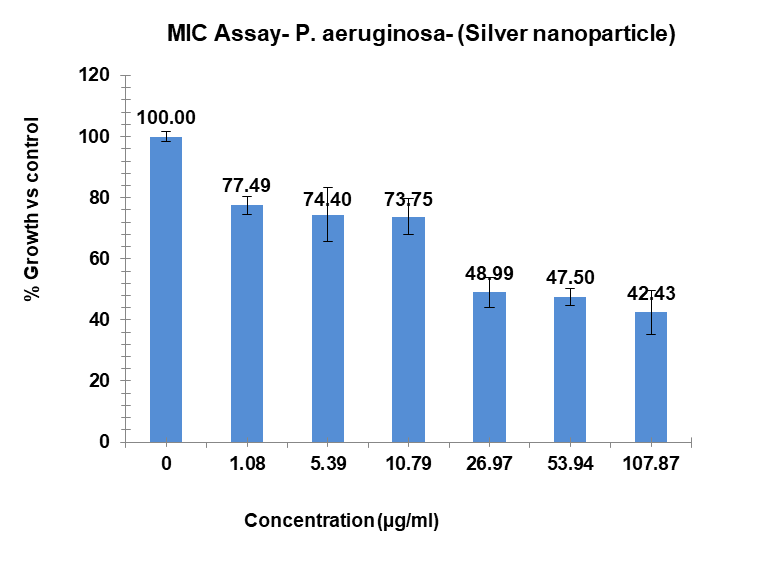
Fig. 12: MIC assay of (P. aeruginosa) of Ag-NPs. Results are presented as mean±SD, n=3
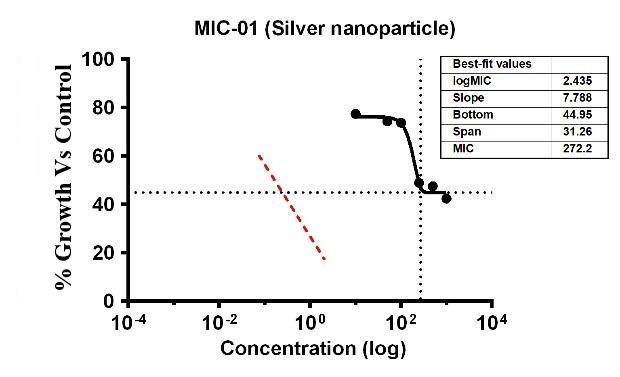
Fig. 13: % Growth vs Control vs concentration (µg/ml) of MIC of (P. aeruginosa) of Ag-NPs
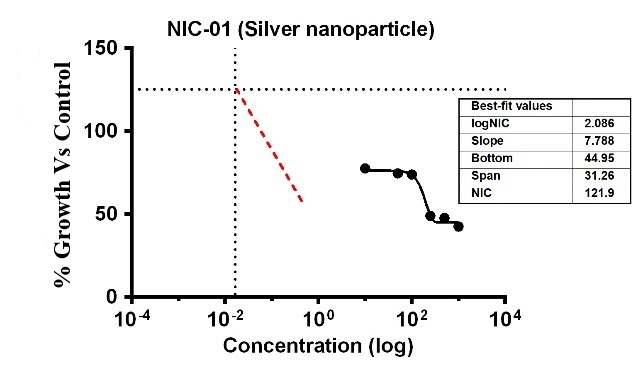
Fig. 14: % Growth vs control vs concentration (µg/ml) of NIC of (P. aeruginosa) of Ag-NPs
Anti-microbial activity assay (E. faecalis)
The study showed that the substances displayed differing levels of antimicrobial activity when tested against E. faecalis at various concentrations. The MIC of silver Ag-NPs in the case of E. faecalis was 74.17 µg/ml, which was the lowest concentration of Ag-NPs needed to stop the bacteria’s growth. In the same way, Ag-NPs’ NIC value is 27.86 µg/ml. According to these results, E. faecalis was not inhibited by concentrations below 27.86 µg/ml, however, doses over 74.17 µg/ml significantly limit bacterial growth. The study recorded MIC and NIC values, indicating the potency of possible antimicrobial effects. The study recorded MIC and NIC values, indicating the potency of possible antimicrobial effects. As shown in fig. 12, the percentage of growth MIC was 100, 60.39, 96.38, 95.01, 93.32, 90.58, 73.35, and 62.96 for Ag-NPs concentrations of 0 µg/ml, positive control (ciprofloxacin 2 mg/ml), 1.08 µg/ml, 5.39 µg/ml, 10.79 µg/ml, 26.97 µg/ml, 53.94 µg/ml, and 107.87 µg/ml respectively [28-31]. MIC assay of (E. faecalis) of Ag-NPs fig. 15. % growth vs control and concentration (µg/ml) of MIC of (E. faecalis) of Ag-NPs is given in fig. 16. % growth vs control vs concentration (µg/ml) of NIC of (E. faecalis) of Ag-NPs is given in fig. 17.
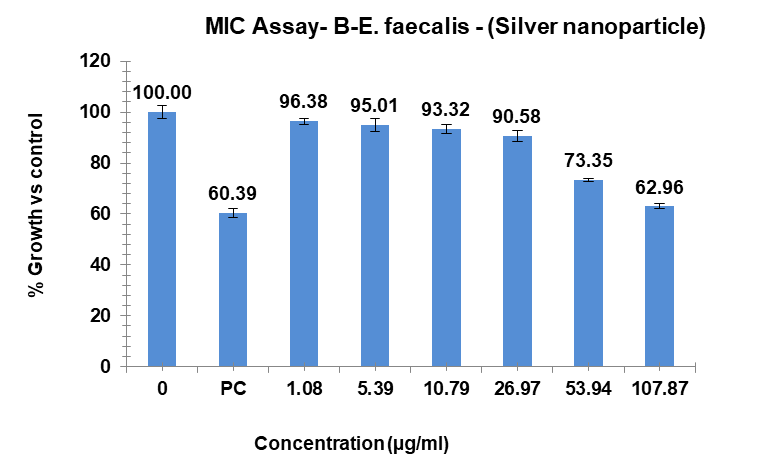
Fig. 15: MIC assay of (E. faecalis) of Ag-NPs, results are presented as mean±SD, n=3
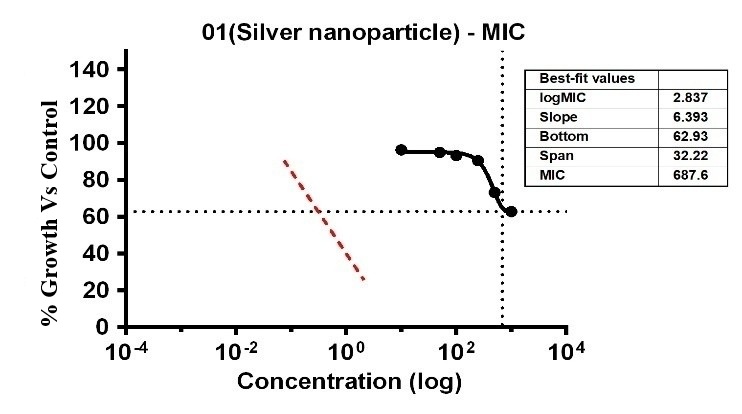
Fig. 16: % Growth vs control vs concentration (µg/ml) of MIC of (E. faecalis) of Ag-NPs
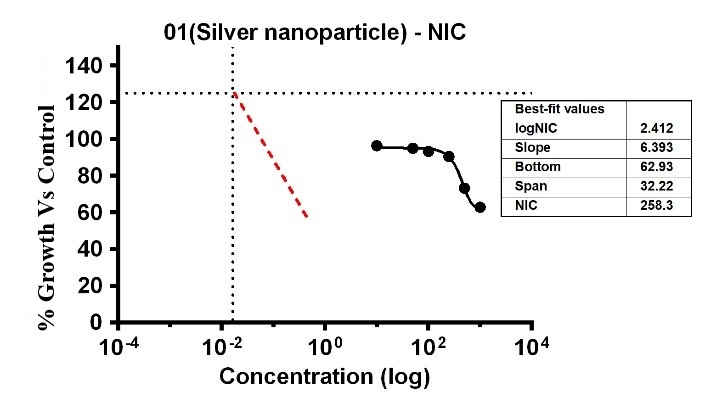
Fig. 17: % Growth vs control vs concentration (µg/ml) of NIC of (E. faecalis) of Ag-NPs
Anti-microbial activity assay (S. aureus)
Variable bacterial reactivity was revealed by the investigation through testing substances against S. aureus at different doses. The MIC of Ag-NPs in the case of S. aureus was 34.21 µg/ml, which was the lowest concentration of Ag-NPs needed to stop the bacteria’s growth. In the same way, Ag-NPs’ NIC value is 3.69 µg/ml, the study recorded MIC and NIC values, indicating the potency of possible antimicrobial effects. As shown in fig. 18, the percentage of organism MIC was 100, 23.01, 87.17, 86.28, 72.57, 67.26, 62.39, and 61.06 for Ag-NPs concentrations of 0 µg/ml, 1.08 µg/ml, 5.39 µg/ml, 10.79 µg/ml, 26.97 µg/ml, 53.94 µg/ml, and 107.87 µg/ml, respectively, when compared with the control group [28-31]. MIC assay of (S. aureus) of Ag-NPs, fig. 18. % Growth vs control and concentration (µg/ml) of MIC of (S. aureus) of Ag-NPs is given in fig. 19. % Growth vs control vs concentration (µg/ml) of NIC of (S. aureus) of Ag-NPs is given in fig. 20.
Anti-microbial activity assay (T. asperellum)
The investigation revealed varying bacterial reactivity of T. asperellum when testing substances at different doses. The MIC of Ag-NPs in the case of T. asperellum was 15.52 µg/ml, which was the lowest concentration of Ag-NPs needed to stop the bacteria’s growth. In the same way, Ag-NPs’ NIC value is 8.86 µg/ml. The study recorded MIC and NIC values, indicating the potency of possible antimicrobial effects. As shown in fig. 21, the percentage of organism MIC was100,3.15, 77.95, 77.17, 59.84, 30.17, 29.53, and 27.56 for Ag-NPs concentrations of 0 µg/ml, 1.08 µg/ml, 5.39 µg/ml, 10.79 µg/ml, 26.97 µg/ml, 53.94 µg/ml, and 107.87 µg/ml, respectively, when compared with the control group [28-31]. MIC assay of (T. asperellum) of Ag-NPs, fig. 21. % growth vs control and concentration (µg/ml) of MIC of (T. asperellum) of Ag-NPs is given in fig. 22. % Growth vs control vs concentration (µg/ml) of NIC of (T. asperellum) of Ag-NPs is given in fig. 23.
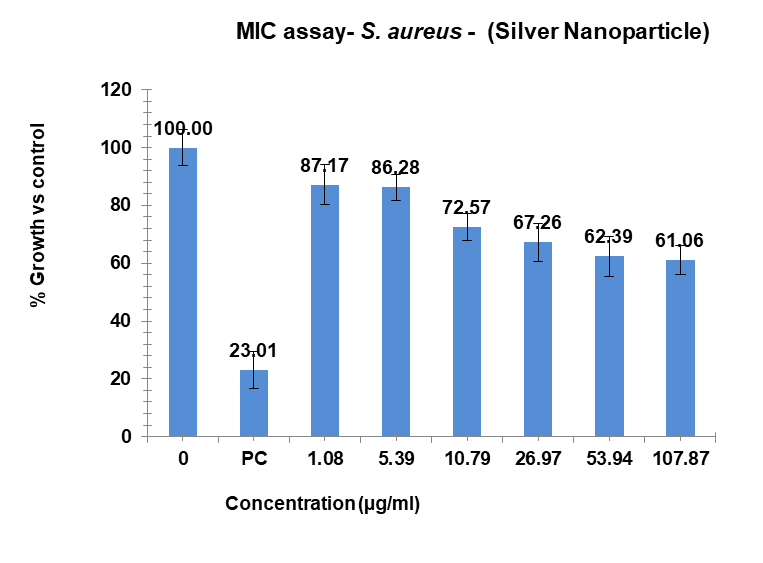
Fig. 18: MIC assay of (S. aureus) of Ag-NPs. Results are presented as mean±SD, n=3
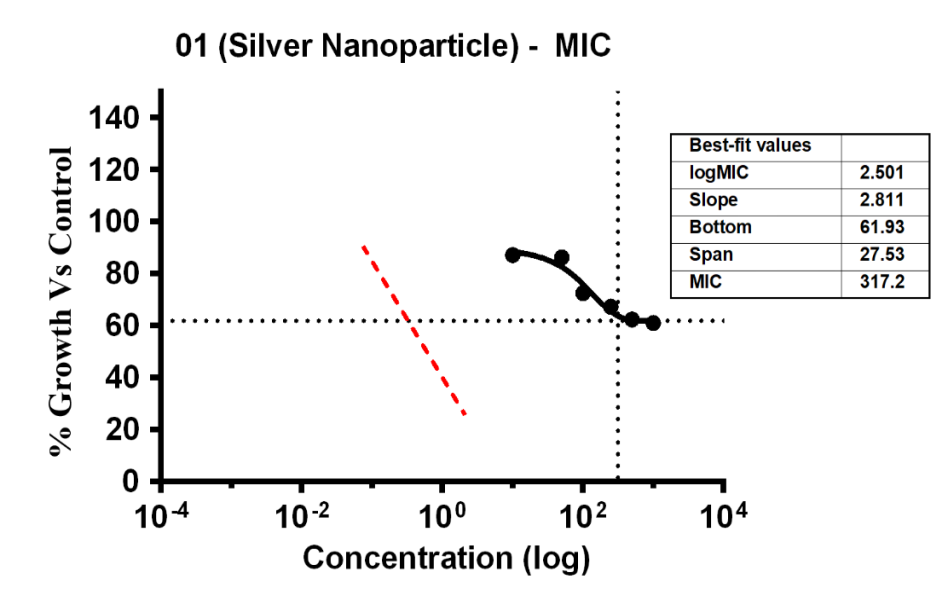
Fig. 19: % Growth vs control vs concentration (µg/ml) of MIC of (S. aureus) of Ag-NPs
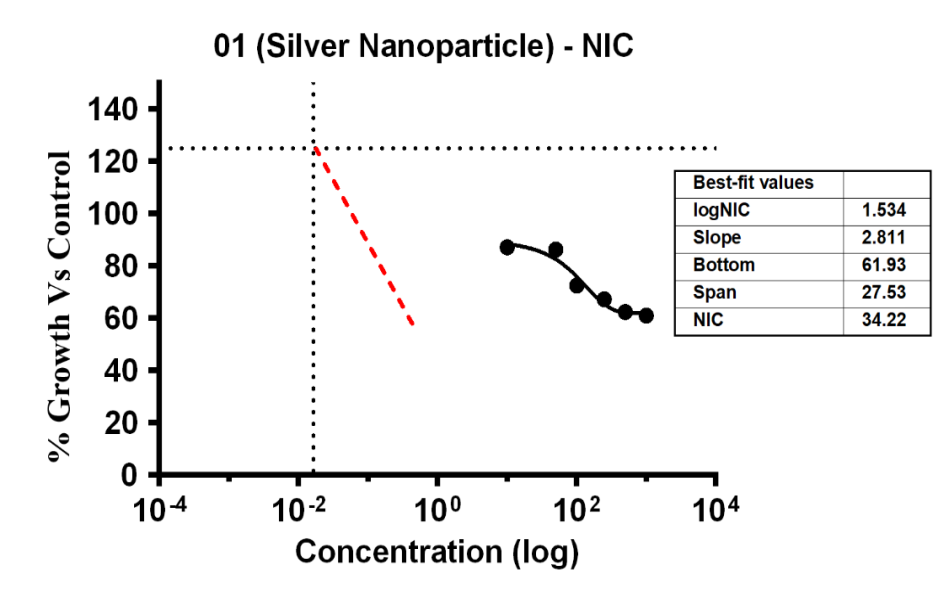
Fig. 20: % Growth vs control vs concentration (µg/ml) of NIC of (S. aureus) of Ag-NPs
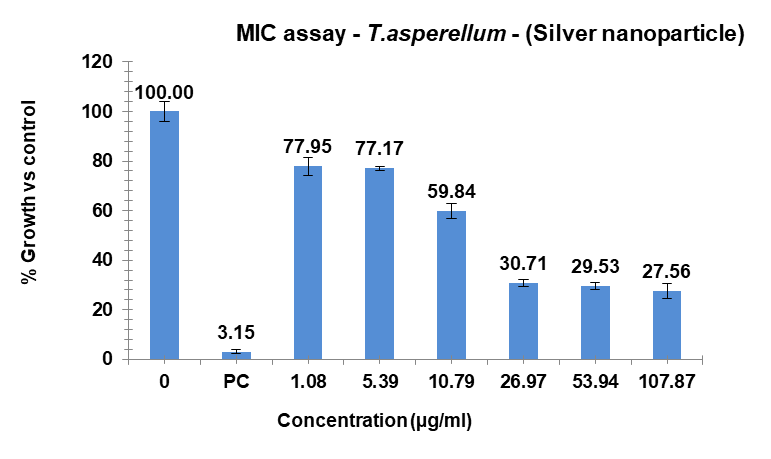
Fig. 21: MIC assay of (T. asperellum) of Ag-NPs. Results are presented as mean±SD, n=3
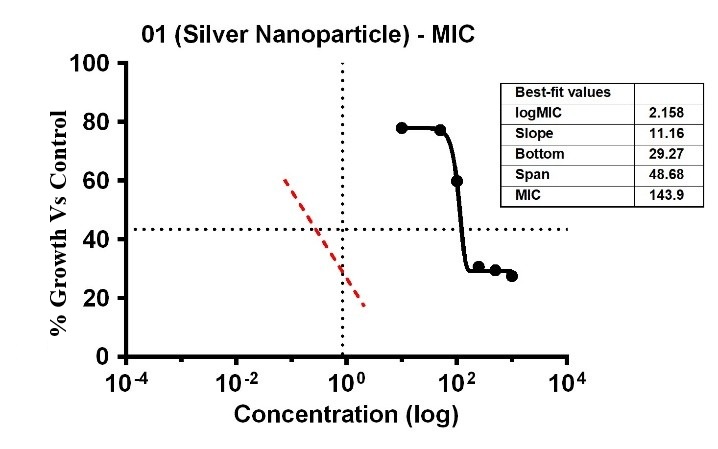
Fig. 22: % Growth vs control vs concentration (µg/ml) of MIC of (T. asperellum) of Ag-NPs
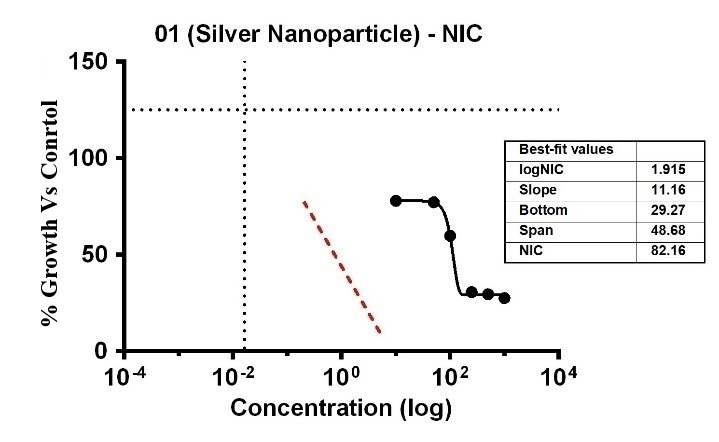
Fig. 23: % Growth vs control vs concentration (µg/ml) of NIC of (T. asperellum) of Ag-NPs
MTT assay
Using the MTT assay, the investigation revealed useful information about how different sample quantities affected the HaCaT cell line, a model for human keratinocytes. It was shown that these cells’ exposure to varying sample concentrations caused noticeable changes in their cytotoxic activity during the course of the experiment.
The cytotoxicity of the Ag₂O/Ag₂CO₃ nanocomposite against HaCaT keratinocytes was assessed via MTT assay. The results revealed a clear dose-dependent reduction in cell viability. The half-maximal inhibitory concentration (IC₅₀) was calculated to be approximately 9.9 µg/ml [30, 31].
Stability studies
For six months, stability studies of the produced Ag-NPs were carried out in a refrigerator. Periodically, the samples were gathered and examined for size, PDI, and zeta potential. Ag-NPs’ vulnerability to stability issues during storage in a refrigerator was demonstrated by the results, which showed some size and zeta potential value variations that were statistically insignificant (table 3).
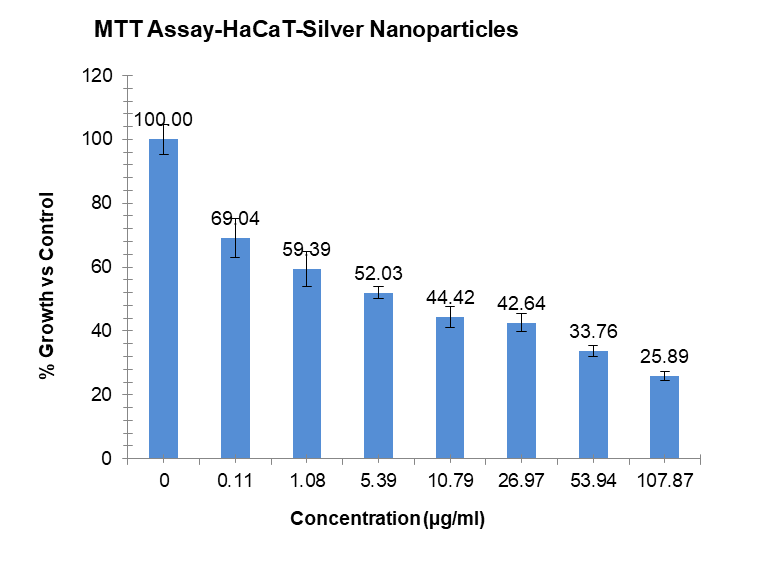
Fig. 24: % Growth vs control and concentration (µg/ml) of Ag-NPs. Results are presented as mean±SD, n=3
Table 3: Stability studies of different Ag-NP formulations
| Month/s (after) | Formulation code | Particle size(nm) | Zeta potential (mV) | Polydispersity index |
| 1 | F-1 | 26.61±0.335 | -9.026±0.113 | 0.361±0.178 |
| 1 | F-2 | 148.54±0.537 | -13.04±0.154 | 0.409±0.205 |
| 1 | F-3 | 305.67±0.439 | 30.19±0.285 | 0.378±0.202 |
| 1 | F-4 | 152.22±0.317 | -15.13±0.182 | 0.345±0.172 |
| 1 | F-5 | 131.66±0.238 | -41.38±0.258 | 0.2739±0.136 |
| 3 | F-1 | 26.27±0.319 | -9.006±0.105 | 0.335±0.155 |
| 3 | F-2 | 148.11±0.514 | -12.72±0.136 | 0.386±0.156 |
| 3 | F-3 | 305.27±0.413 | 29.99±0.265 | 0.378±0.198 |
| 3 | F-4 | 152.02±0.226 | -15.02±0.173 | 0.329±0.184 |
| 3 | F-5 | 131.16±0.213 | -41.18±0.132 | 0.2613±0.116 |
| 6 | F-1 | 26.05±0.289 | -9.001±0.102 | 0.331±0.124 |
| 6 | F-2 | 148.03±0.428 | -12.63±0.126 | 0.374±0.165 |
| 6 | F-3 | 305.11±0.363 | 29.87±0.216 | 0.359±0.176 |
| 6 | F-4 | 151.84±0.192 | -15.01±0.110 | 0.317±0.151 |
| 6 | F-5 | 131.05±0.188 | -41.04±0.205 | 0.2601±0.104 |
Results are presented as mean±SD, n=3
DISCUSSION
This study successfully synthesized a citrate-capped silver oxide/silver carbonate (Ag₂O/Ag₂CO₃) nanocomposite, as confirmed by XRD and FTIR, which demonstrated broad-spectrum antimicrobial activity. The key findings—moderately high MICs (14-74 µg/ml) compared to some literature reports, an IC₅₀ of ~9.9 µg/ml against human keratinocytes, and good colloidal stability over six months require interpretation within the framework of the material’s unique physicochemical properties and the established mechanisms of Ag-NP action.
The observed antimicrobial potency, while significant, places our nanocomposite in a moderately active range compared to some state-of-the-art Ag-NPs. For instance, studies reporting ultra-small (<10 nm), pure metallic Ag-NPs (Ag⁰) stabilized by potent reducing agents often achieve MICs below 5 µg/ml against similar bacterial strains [32, 33]. The higher MICs we report (e. g., 14.35 µg/ml for E. coli, 74.17 µg/ml for E. faecalis) can be directly interpreted through the lens of our material’s characteristics:
Unlike metallic Ag⁰, our Ag₂O/Ag₂CO₃ composite possesses a semiconductor surface. The dissolution kinetics of Ag⁺ ions from such an oxide/salt matrix are likely slower and more controlled than the rapid release from highly reactive metallic nanoscale silver [32, 33]. This necessitates a higher total mass to achieve the critical intracellular Ag⁺ concentration required for biocidal action.
DLS and FESEM data indicated aggregation, leading to a larger effective hydrodynamic size. Aggregation reduces the total surface area-to-volume ratio, a key determinant of Ag-NP activity. Consequently, the concentration of “bioavailable” nanoparticles or ion release sites at the microbial interface is lower than for well-dispersed, monodisperse systems, explaining the need for higher mass concentrations [33].
The citrate capping, evidenced by FTIR, ensures colloidal stability but also forms a physical and electrostatic barrier. This layer must be compromised via ion exchange or biomolecular adsorption before Ag⁺ release or direct contact can occur efficiently, potentially delaying the onset of antimicrobial action [34].
The spectrum of activity, with Gram-negative E. coli and the fungus T. asperellum being most susceptible, aligns with general trends for Ag-NPs but also hints at specific interactions. The superior sensitivity of E. coli may be attributed to its thinner peptidoglycan layer, facilitating faster penetration of Ag⁺ ions or ROS. The relative resilience of E. faecalis could be due to its robust cell wall structure and inherent tolerance mechanisms.
A critical interpretation of our results lies in the relationship between the MICs and the IC₅₀ (~9.9 µg/ml) against HaCaT cells. This reveals a narrow in vitro therapeutic window, particularly for the more resistant strains like E. faecalis (MIC 74.17 µg/ml), where the antimicrobial concentration overlaps with the cytotoxic range. This is not an anomalous finding but a common challenge for many potent, non-selective antimicrobial agents, including silver. The shared mechanism induction of oxidative stress via ROS and Ag⁺ ionsexplain this parallel toxicity in prokaryotic and eukaryotic cells [35]. For translational applications (e. g., wound dressings or coatings), this necessitates formulations that localize the antimicrobial effect, such as through controlled release from a polymer matrix, to protect host tissues while maintaining efficacy at the infection site.
The observed stability in refrigerated storage, with minimal variation in size and PDI over six months, is a significant practical strength of the citrate-capped nanocomposite. This contrasts with reports of rapid oxidation or aggregation in less-stabilized Ag-NP suspensions [36]. The stability can be attributed to the electrostatic repulsion provided by the negative zeta potential from the citrate layer and the potentially passivating nature of the oxide/silver carbonate surface itself. This indicates that the material would retain its physicochemical, and by extension, its functional properties during shelf storage, a vital consideration for real-world applications.
LIMITATIONS
While this study provides valuable insights, it is not without limitations. The primary limitation is the lack of a direct mechanistic investigation into the ionic release kinetics of the Ag-NPs. Correlating the Ag⁺ ion release profile with the MIC data would have provided a more direct explanation for the antimicrobial efficacy. Furthermore, the study is limited to in vitro models, and the translation of these findings to in vivo or clinical scenarios requires further investigation. The stability of the positively charged F-3 formulation in complex biological fluids also remains an open question. Future work will focus on quantifying Ag⁺ release, performing more detailed surface characterization (e. g., XPS) to confirm the composition of the F-3 surface, and evaluating the most promising formulations in advanced infection models.
CONCLUSION
Microbe management and treatment have grown to be a costly and difficult task. As a result, antibacterial Ag-NPs have lately drawn attention as essential nanoparticle properties. Consequently, our results showed that spherical, cationic, and stable Ag-NPs may be efficiently produced using trisodium citrate. As demonstrated by the MIC and NIC, the Ag-NPs exhibited strong antibacterial activity with reduced toxicity to HaCaT cells. The presence of metallic silver nanoparticles is linked to the distinct UV–VIS absorption peaks at around 407 nm. The complexation between Ag-NPs and NO3 ions was demonstrated by chemical shifts seen in the FTIR bands at various wave numbers. The zeta potential measurements demonstrated the great stability of the produced Ag-NPs. MIC and NIC values, which show the strength of potential antimicrobial actions, were recorded during the investigation. Lastly, this approach stays away from the use of hazardous and potent reducing agents, which offer stability over the long run. Consequently, preventing or lowering the expense of therapy and patient morbidity from bacterial infections associated with surgical wounds.
FUNDING
Nil
AUTHORS CONTRIBUTIONS
SB prepared the manuscript; SB, DS, RD, SN, SD, and SS reviewed the manuscript.
CONFLICT OF INTERESTS
Declared none
REFERENCES
SB, Prakash S. Green synthesis of marine sponge silver nanoparticles and its antioxidant cytotoxic activity. Int J Pharm Pharm Sci. 2024;6(2):1-7. doi: 10.33545/26647222.2024.v6.i2a.116.
MS S, Prakash S. Biogenic synthesis of Cleoma viscosa ethanolic extract silver nanoparticles and its antioxidant and in vitro anticancer activity. Int J Pharm Pharm Sci. 2025;7(2):201-8. doi: 10.33545/26647222.2025.v7.i2c.211.
Joshi V, Sulthana F, Ramadas D. Oral delivery of silver nanoparticles a review. Asian J Pharm Clin Res. 2021;14(11):9-14. doi: 10.22159/ajpcr.2021.v14i11.42986.
PPG. A mini review on preparation characterization and applications of silver iodide nanoparticles. Asian J Pharm Clin Res. 2022;15(2):11-7. doi: 10.22159/ajpcr.2022.v15i2.43054.
Harika MNL C, Radhika P. Phytosynthesis and characterization of silver nanoparticles from Ruellia tuberosa (L.): effect of physicochemical parameters. Asian J Pharm Clin Res. 2021;14(12):31–8. doi: 10.22159/ajpcr.2021.v14i12.42020.
Gupta M. Biosynthesized silver nanoparticles using Catharanthus roseus and their antibacterial efficacy in synergy with antibiotics; a future advancement in nanomedicine. Asian J Pharm Clin Res. 2021;14(2):116-24. doi: 10.22159/ajpcr.2021.v14i2.39856.
Nieves LM, Mossburg K, Hsu JC, Maidment AD, Cormode DP. Silver chalcogenide nanoparticles: a review of their biomedical applications. Nanoscale. 2021;13(46):19306-23. doi: 10.1039/d0nr03872e, PMID 34783806.
Singh M, Thakur V, Kumar V, Raj M, Gupta S, Devi N. Silver nanoparticles and its mechanistic insight for chronic wound healing: review on recent progress. Molecules. 2022;27(17):5587. doi: 10.3390/molecules27175587, PMID 36080353.
Mathur P, Jha S, Ramteke S, Jain NK. Pharmaceutical aspects of silver nanoparticles. Artif Cells Nanomed Biotechnol. 2018;46(Suppl 1):115-26. doi: 10.1080/21691401.2017.1414825, PMID 29231755.
Dos Santos CA, Seckler MM, Ingle AP, Gupta I, Galdiero S, Galdiero M. Silver nanoparticles: therapeutical uses toxicity and safety issues. J Pharm Sci. 2014;103(7):1931-44. doi: 10.1002/jps.24001, PMID 24824033.
Patil SM, Tandon R, Tandon N. Recent developments in silver nanoparticles utilized for cancer treatment and diagnosis: a patent review. Pharm Pat Anal. 2022;11(6):175-86. doi: 10.4155/ppa-2022-0010, PMID 36475455.
Sable SV, Kawade S, Ranade S, Joshi S. Bioreduction mechanism of silver nanoparticles. Mater Sci Eng C Mater Biol Appl. 2020;107:110299. doi: 10.1016/j.msec.2019.110299, PMID 31761186.
Bhattacharjee S, Sarkar D, Dayaramani R, Naskar S, Sharma S, Sarkhel S. Development and characterization of Ag-NPs coated silk sutures: a novel approach to inhibit surgical site infections. J Drug Target. 2025;33(10):1966-78. doi: 10.1080/1061186X.2025.2534176, PMID 40668735.
Elarabi NI, Abdel Rahman AA, Abdel Haleem H, Abdel Hakeem M. Silver and zinc oxide nanoparticles disrupt essential parasitism neuropeptidergic and expansion-like proteins genes in Meloidogyneincognita. Exp Parasitol. 2022;243:108402. doi: 10.1016/j.exppara.2022.108402, PMID 36220396.
De Lima R, Seabra AB, Duran N. Silver nanoparticles: a brief review of cytotoxicity and genotoxicity of chemically and biogenically synthesized nanoparticles. J Appl Toxicol. 2012;32(11):867-79. doi: 10.1002/jat.2780, PMID 22696476.
Tawfeeq A. Pulsed laser ablation synthesized silver nanoparticles induce apoptosis in human glioblastoma cell lines and possess minimal defect in mice brains. Iraqi J Biotechnol. 2013;12(2):92-106.
Turkevich J, Stevenson PC, Hillier J. A study of the nucleation and growth processes in the synthesis of colloidal gold. Discuss Faraday Soc. 1951;11:55-75. doi: 10.1039/DF9511100055.
Dasaradhudu Y, Arunachalam Srinivasan M. Synthesis and characterization of silver nano particles using co-precipitation method. Mater Today Proc. 2020;33:720-3. doi: 10.1016/j.matpr.2020.06.029.
Fowler PW, Wright C, Spiers H, Zhu T, Baeten EM, Hoosdally SW. A crowd of bash the bug volunteers reproducibly and accurately measure the minimum inhibitory concentrations of 13 antitubercular drugs from photographs of 96-well broth microdilution plates. eLife. 2022;11:e75046. doi: 10.7554/eLife.75046, PMID 35588296.
Loc NH, Huy ND, Quang HT, Lan TT, Thu Ha TT. Characterisation and antifungal activity of extracellular chitinase from a biocontrol fungus Trichoderma asperellum PQ34. Mycology. 2019;11(1):38-48. doi: 10.1080/21501203.2019.1703839, PMID 32128280, PMCID PMC7033689.
Kumar P, Nagarajan A, Uchil PD. Analysis of cell viability by the MTT assay. Cold Spring Harb Protoc. 2018;2018(6):pdb.prot095505. doi: 10.1101/pdb.prot095505.
Van Meerloo J, Kaspers GJ, Cloos J. Cell sensitivity assays: the MTT assay. Methods Mol Biol. 2011;731:237-45. doi: 10.1007/978-1-61779-080-5_20, PMID 21516412.
Fotakis G, Timbrell JA. In vitro cytotoxicity assays: comparison of LDH, neutral red MTT and protein assay in hepatoma cell lines following exposure to cadmium chloride. Toxicol Lett. 2006 Jan 5;160(2):171-7. doi: 10.1016/j.toxlet.2005.07.001, PMID 16111842.
Tihauan B, Berca LM, Adascalului M, Sanmartin AM, Nica S, Cimponeriu D. Experimental in vitro cytotoxicity evaluation of plant bioactive compounds and phytoagents: a review. Rom Biotechnol Lett. 2020;25:1832-42. doi: 10.25083/rbl/25.4/1832.1842.
Chutrakulwong F, Thamaphat K, Intarasawang M. Investigating UV-irradiation parameters in the green synthesis of silver nanoparticles from water hyacinth leaf extract: optimization for future sensor applications. Nanomaterials (Basel). 2024;14(12):1018. doi: 10.3390/nano14121018, PMID 38921894.
Dong Y, Zhu H, Shen Y, Zhang W, Zhang L. Antibacterial activity of silver nanoparticles of different particle size against vibrio natriegens. PLOS One. 2019;14(9):e0222322. doi: 10.1371/journal.pone.0222322, PMID 31518380.
Birca AC, Gherasim O, Niculescu AG, Grumezescu AM, Vasile BS, Mihaiescu DE. Infection-free and enhanced wound healing potential of alginate gels incorporating silver and tannylated calcium peroxide nanoparticles. Int J Mol Sci. 2024;25(10):5196. doi: 10.3390/ijms25105196, PMID 38791232.
Abdelmoneim HM, Taha TH, Elnouby MS, AbuShady HM. Extracellular biosynthesis OVAT/statistical optimization and characterization of silver nanoparticles (AgNPs) using Leclercia adecarboxylata THHM and its antimicrobial activity. Microb Cell Fact. 2022;21(1):277. doi: 10.1186/s12934-022-01998-9, PMID 36581886.
Kowalczyk P, Szymczak M, Maciejewska M, Laskowski L, Laskowska M, Ostaszewski R. All that glitters is not silver-a new look at microbiological and medical applications of silver nanoparticles. Int J Mol Sci. 2021;22(2):854. doi: 10.3390/ijms22020854, PMID 33467032.
Bhatia D, Mittal A, Malik DK. Antimicrobial potential and in vitro cytotoxicity study of polyvinyl pyrollidone-stabilised silver nanoparticles synthesised from Lysinibacillus boronitolerans. IET Nanobiotechnol. 2021;15(4):427-40. doi: 10.1049/nbt2.12054, PMID 34694715.
Ghavam M. Antibacterial potential of biosynthesized silver nanoparticles using Nepeta sessilifolia Bunge and Salvia hydrangea DC. ex Benth. extracts from the natural habitats of Iran’s rangelands. BMC Complement Med Ther. 2023;23(1):299. doi: 10.1186/s12906-023-04101-w, PMID 37620931.
Morones JR, Elechiguerra JL, Camacho A, Holt K, Kouri JB, Ramirez JT. The bactericidal effect of silver nanoparticles. Nanotechnology. 2005;16(10):2346-53. doi: 10.1088/0957-4484/16/10/059, PMID 20818017.
Reidy B, Haase A, Luch A, Dawson KA, Lynch I. Mechanisms of silver nanoparticle release transformation and toxicity: a critical review of current knowledge and recommendations for future studies and applications. Materials (Basel). 2013;6(6):2295-350. doi: 10.3390/ma6062295, PMID 28809275.
Kittler S, Greulich C, Diendorf J, Koller M, Epple M. Toxicity of silver nanoparticles increases during storage because of slow dissolution under release of silver ions. Chem Mater. 2010;22(16):4548-54. doi: 10.1021/cm100023p.
Kim JS, Kuk E, Yu KN, Kim JH, Park SJ, Lee HJ. Antimicrobial effects of silver nanoparticles. Nanomedicine. 2007;3(1):95-101. doi: 10.1016/j.nano.2006.12.001, PMID 17379174.
El Badawy AM, Luxton TP, Silva RG, Scheckel KG, Suidan MT, Tolaymat TM. Impact of environmental conditions (pH, ionic strength and electrolyte type) on the surface charge and aggregation of silver nanoparticles suspensions. Environ Sci Technol. 2010;44(4):1260-6. doi: 10.1021/es902240k, PMID 20099802.