
Int J App Pharm, Vol 18, Issue 1, 2026, 625-636Original Article
DEVELOPMENT AND EVALUATION OF TITANIUM DIOXIDE-FREE FILM-COATED TABLETS CONTAINING DROTAVERINE HYDROCHLORIDE
MIROSLAW STROZIK1, MAGDALENA STRZEBONSKA2*, KATARZYNA GRYCHOWSKA1,3, KATARZYNA SKIBA1, PAWEL ZAJDEL3, WIKTOR TATARA1
1F1 Pharma S. A. Prof. M. Bobrzyńskiego Str. 14, 30-348 Krakow, Poland. 2Department of Environmental Protection, Faculty of Geology, Geophysics and Environmental Protection, AGH University of Kraków, Al. Mickiewicza 30, Kraków 30-059, Poland.. 3Faculty of Pharmacy Jagiellonian University Medical College, 9 Medyczna Str., 30-688 Kraków, Poland
*Corresponding author: Magdalena Strzebonska; *Email: mstrzebo@agh.edu.pl
Received: 03 Sep 2025, Revised and Accepted: 05 Dec 2025
ABSTRACT
Objective: Drotaverine is a spasmolytic drug commonly used for the symptomatic relief of smooth muscle contractions associated with gastrointestinal disorders, biliary dyskinesia and renal colic. In light of the anticipated prohibition of titanium dioxide (TiO2) in pharmaceutical coatings within the European Union, this study aimed to develop 80 mg drotaverine hydrochloride tablets employing an alternative titanium-free coating and to establish a validated analytical method for the determination and characterization of impurities in accordance with regulatory guidelines.
Methods: Two tablet prototypes containing drotaverine hydrochloride were manufactured in laboratory scale. A new high-performance liquid chromatography (HPLC) method for impurity determination in titanium-free coated drotaverine hydrochloride tablets was developed and validated according to ICH Q2(R2) guidelines. Stability studies were conducted, and emerging unknown impurity was analyzed using ultra-performance liquid chromatography coupled with mass spectrometry (UPLC–MS) and nuclear magnetic resonance (¹H and ¹³C NMR).
Results: During stability testing, an impurity with a relative retention time (RRT) of 2.05 was detected, exceeding the 0.2% threshold set by ICH Q3B(R2) for unidentified impurities. This impurity was identified as 6,7-diethoxy-1-(3,4-diethoxybenzoyl)isoquinoline (perparaldine). Based on its structural characterization, the reporting and qualification threshold for this impurity was proposed to be extended to 0.5%, ensuring acceptable product quality over at least two years of storage.
Conclusion: This work demonstrates an innovative approach by combining titanium-free formulation development with advanced analytical elucidation of novel impurities. Moreover, the validated HPLC method ensures regulatory compliance, reliable routine analysis, and robust quality control and stability assessment of this novel dosage form.
Keywords: Drotaverine, Drotaveraldine, Perparaldine, Titanium dioxide, Impurity profiling
© 2026 The Authors. Published by Innovare Academic Sciences Pvt Ltd. This is an open access article under the CC BY license (https://creativecommons.org/licenses/by/4.0/)
DOI: https://dx.doi.org/10.22159/ijap.2026v18i1.56749 Journal homepage: https://innovareacademics.in/journals/index.php/ijap
INTRODUCTION
Titanium dioxide (TiO2, E171) has been widely used as an excipient in pharmaceutical film coatings, primarily due to its high opacity, providing a bright white appearance to tablets and its ability to prevent UV-induced degradation of the active ingredients. However, recent findings from genotoxicity studies have raised concerns regarding the carcinogenic potential of TiO2 nanoparticles [1-3]. As a result, European Food Safety Authority (EFSA) published an opinion that TiO2 could “no longer be considered safe when used as a food additive” [4] and the European Commission prohibited its use as a food additive in 2022 [5]. Since TiO2 is included in more than 90,000 drug products registered in the EU, the anticipated extension of this regulation on pharmaceutical industry would necessitate extensive efforts to reformulate and adapt already marketed drugs [6, 7]. Given the number of the affected products, the entire process must be carefully planned and gradually implemented to ensure the continued availability of drugs.
Drotaverine (1-(3,4-diethoxybenzylidene)-6,7-diethoxy-1,2,3,4-tetrahydroisoquinoline) is an spasmolytic drug which behaves as phosphodiesterase type 4 (PDE4) inhibitor. Blockade of PDE4 and resulting increase of cyclic adenosine monophosphate results in the inactivation of myosin light chain kinase leading to the smooth muscles relaxation. The efficacy and safety profile of drotaverine has been approved in Central and Eastern Europe (Poland, Hungary, Estonia, Lithuania and Latvia) and in part of Asia (India, Thailand) for the symptomatic treatment of various spastic conditions, including gastrointestinal disorders, biliary dyskinesia and renal colic pain.
Drotaverine is administered orally as the most common route, although parenteral forms (intramuscular and intravenous) are also available for acute symptom management. The literature survey identifies nine impurities which may be detected in drotaverine-containing products (fig. 1 and fig. 2) [8, 9]. Among these, specific impurities resulting from the synthetic pathway of drotaverine include the so-called drotaverine amine (2-(3,4-diethoxyphenyl)ethan-1-amine, 1), drotaverine acid (2-(3,4-diethoxyphenyl)acetic acid, 2), drotaverine amide (2-(3,4-diethoxyphenyl)acetamide, 3) and N-(3,4-diethoxyphenethyl)-2-(3,4-diethoxyphenyl)acetamide, 4) (fig. 1).
Conversely, impurities associated with the degradation of active pharmaceutical ingredient (API), include products of the oxidation of the isoquinoline moiety (perparine, 1-(3,4-diethoxybenzyl)-6,7-diethoxyisoquinoline, 5), oxidation of the methylene linker (drotaveraldine, (6,7-diethoxy-3,4-dihydroisoquinolin-1-yl)(3,4-diethoxyphenyl)methanone, 6) or combination of both (perparaldine, (6,7-diethoxyisoquinolin-1-yl)(3,4-diethoxyphenyl)methanone, 7) and (6,7-diethoxyisoquinolin-1-yl)(3,4-diethoxyphenyl)methanol, 8). An additional degradant impurity is represented by a pentacyclic compound containing a fused imidazolium ion 9) (fig. 2).
The widespread use of drotaverine, combined with regulatory restrictions on TiO2, prompted us to develop new tablets formulated with drotaverine hydrochloride as the active substance and a coating free of TiO2. To the best of our knowledge, no product with such composition has been introduced to the market so far. Herein we describe the results of our efforts on the elaboration of drotaverine-containing tablets with Ti-free coating, supported by stress and short time-stability studies.
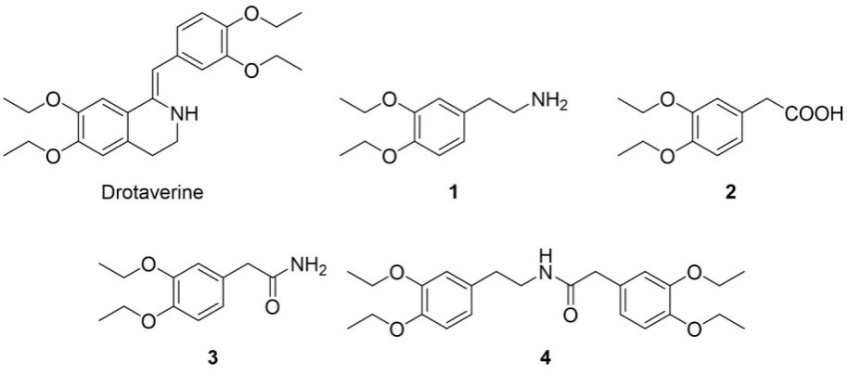
Fig. 1: Structure of drotaverine and its specific impurities
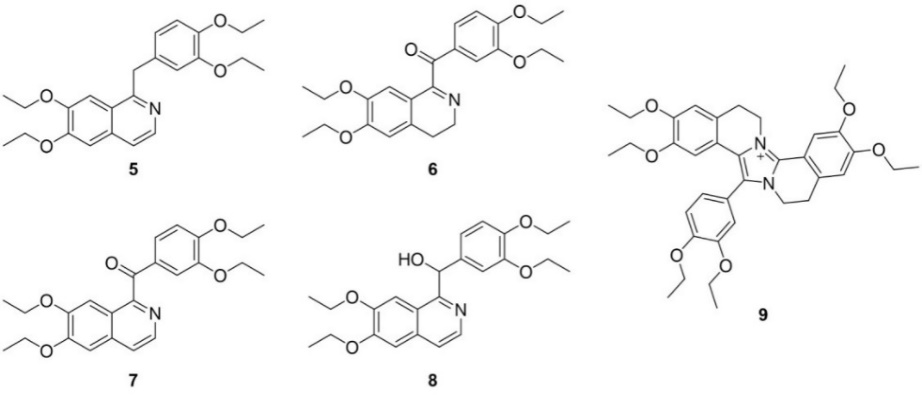
Fig. 2: Products of degradation of drotaverine
MATERIALS AND METHODS
Materials and chemicals
Drotaverine hydrochloride (substance), drotaverine hydrochloride (working standard), drotaverine amine (working standard), drotaverine acid (working standard), drotaverine amide (working standard) and drotaveraldine (working standard) were obtained from RA Chem Pharma Ltd (India). Potassium dihydrogen phosphate, (analytical pure KH2PO4), orthophosphoric acid 85% (analytical pure, H3PO4), hydrogen peroxide 30% (analytical pure, H2O2), sodium hydroxide (analytical pure, NaOH), ammonia solution 25%, ethanol, diethyl ether, dichloromethane, naphthyl ether and ethyl acetate (reagent grade) were obtained from Chempur (Poland), acetonitrile (HPLC grade) was obtained from Supelco (Merck Life Science Sp. z o. o, Poland), hydrochloric acid 35-38% (analytical pure, HCl) was obtained from Stanlab (Poland).
Instruments
High performance liquid chromatography (HPLC)
HPLC analysis for the determination of related substances in tablets containing drotaverine hydrochloride, was performed on Hitachi Primaide MERCK and Hitachi Elite LaChrom, MERCK liquid chromatographs with DAD detector using Chromolith High Resolution RP-18 endcapped column (100 × 4.6 mm) and a flow rate 1.0 ml/min.
Ultraperformance liquid chromatography coupled with mass spectrometer (UPLC-MS)
The UPLC-MS analyses for the identification of related substances in tablets containing drotaverine hydrochloride were obtained on Waters ACQUITY I-Class PLUS™ SYNAPT XS High Resolution Mass Spectrometer (Waters, Milford, CT, USA) with the MS-Q-TOF detector and UV-Vis-DAD eλ detector. The ACQUITY UPLC BEH C18, 1.7 μm (2.1 × 100 mm) column was used with the VanGuardAcquity UPLC BEH C18, 1.7 μm (2.1 × 5 mm) (Waters, Milford, CT, USA). Conditions applied were as follows: eluent A (water/0.1% HCOOH), eluent B (acetonitrile/0.1% HCOOH), a flow rate of 0.3 ml/min, a gradient of 5–100% B over 13 min, and an injection volume of 1 μl.
Nuclear magnetic resonance (NMR)
Proton nuclear magnetic resonance (1H NMR) and carbon nuclear magnetic resonance (13C NMR) spectra were recorded using JEOL JNM-ECZR 500 RS1 (ECZR version) at 500 and 126 MHz, respectively and are reported in ppm using deuterated chloroform (CDCl3) for calibration. The J values are given in Hertz (Hz).
HPLC method for determination of related substances in tablets containing drotaverine hydrochloride (80 mg)
HPLC working conditions
Chromatography working conditions included: wavelength 230 nm, autosampler temperature 20 °C, column temperature 25 °C, injection volume 10 µl, time analysis 27 min for standard solution, 37 min for sample solution, mobile phase a (0.02M KH2PO4 buffer solution pH 3.0), mobile phase B (acetonitrile). For the preparation of sample and standard solutions, the following solvents were used: diluent 1 (buffer solution pH 3.0 with acetonitrile in a volumetric ratio of 78:22) and diluent 2 (water with acetonitrile in a volumetric ratio of 50:50 (v/v)). Analysis of the standard solution was performed in gradient program according to table 1.
Table 1: Gradient program: standard solution.
| Time (min) | Mobile phase A (buffer pH 3.0)[%] | Mobile phase B (acetonitrile) [%] |
| 0.0 | 78 | 22 |
| 20.0 | 55 | 45 |
| 20.1 | 78 | 22 |
| 27.0 | 78 | 22 |
Analysis of the sample solution was performed in gradient program according to table 2.
Table 2: Gradient program: sample solution
| Time (min) | Mobile phase A (buffer pH 3.0) [%] | Mobile phase B (acetonitrile) [%] |
| 0.0 | 78 | 22 |
| 20.0 | 55 | 45 |
| 30.0 | 55 | 45 |
| 30.1 | 78 | 22 |
| 37.0 | 78 | 22 |
Standard solution preparation
About 40 mg of drotaverine hydrochloride working standard was accurately weighted and quantitatively transferred into a 50 ml volumetric flask. Diluent 1 was added and dissolved for 10 min using ultrasonic bath, made up to the volume with diluent 1-stock standard solution [A]. Then 2.0 ml of stock standard solution [A] was transferred into a 20 ml volumetric flask, made up to the volume with diluent 2-standard solution [B]. Next, 1.0 ml of solution [B] was transferred to a 50 ml volumetric flask and made up to the volume with diluent 2-standard solution [C]. The final concentration of drotaverine hydrochloride in solution [C] is 0.0016 mg/ml (corresponding to 0.2 % of impurity in relation to drotaverine hydrochloride assay in sample solution). The chromatogram of standard solution is shown in the fig. 3.
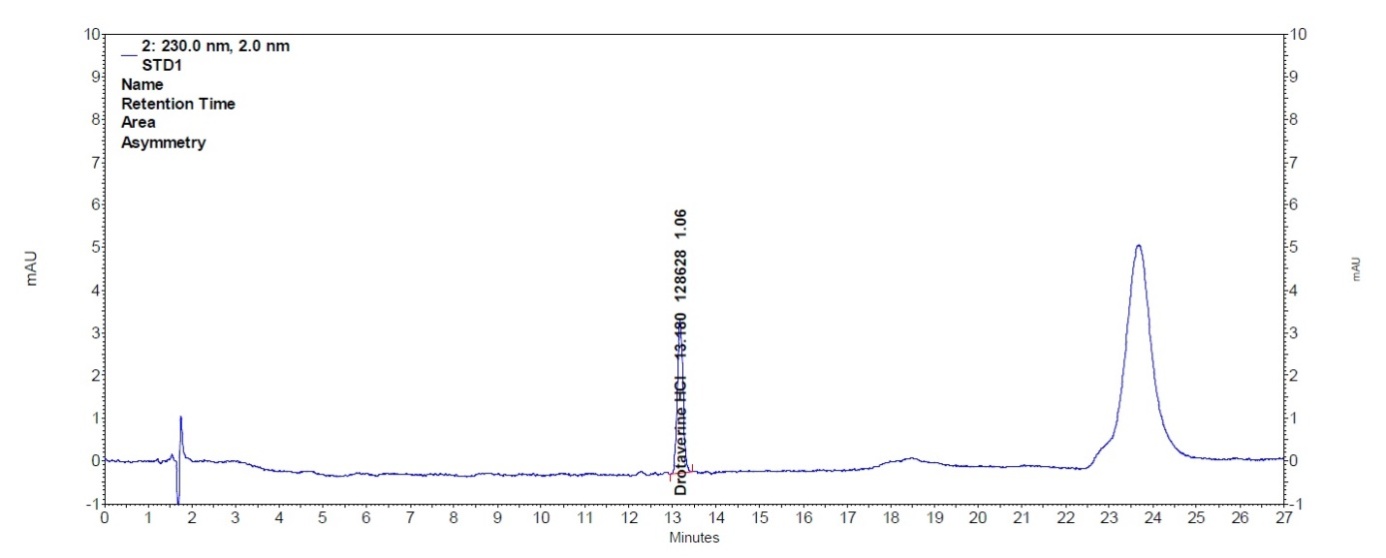
Fig. 3: Chromatogram of standard solution
Sample solution preparation
Randomly selected 20 tablets were weighted and average tablet mass was determined. The tablets were powdered thoroughly. The powdered tablets were weighted in amount equal to average tablet mass and transferred to a 100 ml volumetric flask. Then diluent 2 was added and dissolved using ultrasonic bath for 15 min. The solution was made up to the volume with diluent 2 and filtered through 0.45 µm syringe filters. The chromatogram of sample solution is shown in the fig. 4. The final concentration of drotaverine hydrochloride in solution [C] is 0.8 mg/ml.
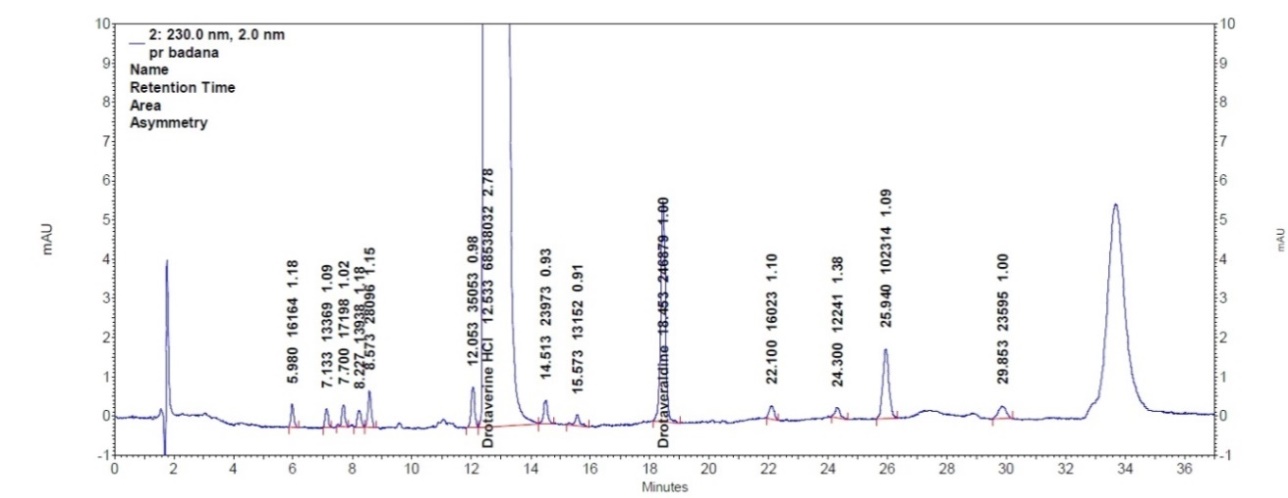
Fig. 4: Chromatogram of sample solution
Synthesis conditions of drotaveraldine and perparaldine
Drotaveraldine ((6,7-Diethoxy-3,4-dihydroisoquinolin-1-yl)(3,4-diethoxyphenyl)-methanone,6). Drotaverine hydrochloride (750 mg, 1.7 mmol) was suspended in dichloromethane and 25% solution of NH3 was added to adjust the pH to 9. The solution was washed three times with water and once with saturated solution of NaCl. The organic phase was dried over Na2SO4 and evaporated under reduced pressure. The obtained free base was suspended in diethyl ether and stirred under air supply over 8h. The solvent was evaporated under reduced pressure. The spectral data are in agreement with the literature [10].
Perparaldine ((6,7-diethoxyisoquinolin-1-yl)(3,4-diethoxyphenyl)methanone),7)
Drotaveraldine (250 mg, 0.6 mmol) was suspended in ethanol (10 ml) and 1M NaOH was added (4 ml). The mixture was stirred at 60 °C for 18h. After cooling the mixture was extracted three times with dichloromethane. The organic phase was washed with saturated NaCl, dried over Na2SO4 and evaporated under reduced pressure. The obtained crude product was purified by column chromatography using ethyl acetate/naphthyl ether (1/1) as a developing solvent. The spectral data are in accordance with literature [10].
White solid, Yield 85%, tR= 26.21 min, C24H27NO5, MW = 409.48, Monoisotopic Mass = 409.19, [M+H]+= 410.2 (theoretical [M+H]+for C24H28NO5+= 410.2). 1H NMR(500 MHz, CDCl3) δ ppm 1.44–1.49 (m, 9H), 1.55 (t, J = 7.0 Hz, 3H), 4.10–4.19 (m, 6H), 4.24 (q, J = 7.0 Hz, 2H), 6.82 (d, J = 8.6 Hz, 1H), 7.10 (s, 1H), 7.36 (dd, J = 8.4, 2.1 Hz, 1H), 7.49 (s, 1H), 7.58 (d, J = 5.4 Hz, 1H), 7.67 (d, J = 1.9 Hz, 1H), 8.41 (d, J = 5.6 Hz, 1H). 13C NMR (126 MHz, CDCl3) δ ppm 14.6, 14.7, 14.8, 64.6, 64.7, 105.1, 105.7, 111.3, 113.8, 121.2, 122.9, 126.9, 129.8, 133.9, 140.0, 148.6, 150.6, 152.8, 153.7, 153.9, 194.2.
RESULTS
Although numerous methods for determining the content of drotaverine hydrochloride have been described in the literature, including coulometric [11], potentiometric [12], spectrophotometric [13-16] and chromatographic techniques [17-19], HPLC is the most commonly used method for determining its impurity profile [20, 21]. To assess the compatibility of excipients with drotaverine hydrochloride and to study the stability of the tested formulations, we elaborated the HPLC method for the determination of related substances in tablets containing drotaverine hydrochloride. To ensure that the method is optimal for the application in the developed product and will meet the validation requirements, the prevalidation process assessing method specificity, linearity and limit of quantification (LOQ) was performed.
The method was found to be specific. The limit of quantification (LOQ) for drotaverine hydrochloride was set at 0.05%. The method was linear in a range from LOQ to 200% of the acceptable impurity level of 0.2%.
Further studies on the compatibility and stability of the product were carried out each time using two independent test samples. The analyses were performed with reference to two separately prepared standard solutions, and all results were calculated against these standards to ensure the accuracy and reliability of the method.
Compatibility studies
Compatibility of drotaverine hydrochloride and magnesium stearate
Drotaveraldine constitutes the most common impurity detected in drotaverine samples. Its formation is triggered or accelerated by certain basic excipients, including magnesium stearate, which is widely utilized as a lubricant in tablets and capsules [22, 23]. Differential scanning calorimetry (DSC) analysis of 1:1 mixture of drotaverine and magnesium stearate revealed potential incompatibilities between two substances. Although changes observed on the thermograms could suggest chemical reaction, such effect might also result from physical incompatibility and formation of eutectic mixture (fig. 5).
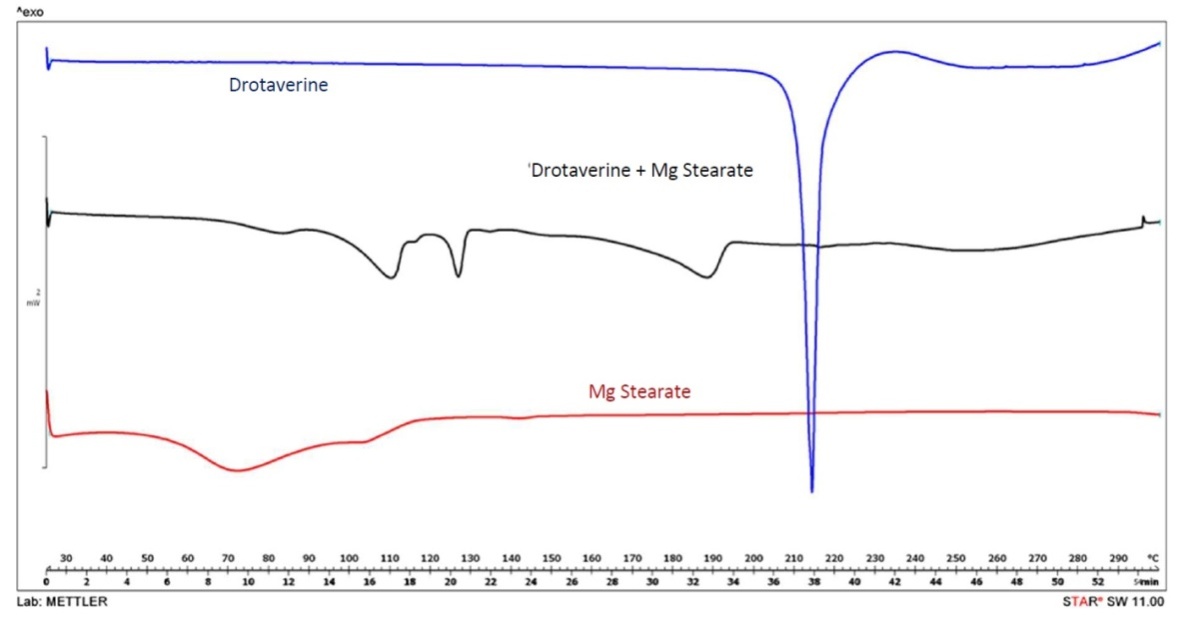
Fig. 5: DSC curves for drotaverine substance (blue), magnesium stearate (red) and their 1:1 mixture (black)
Further compatibility study, which involved storage of 1:1 mixture of drotaverine hydrochloride and magnesium stearate under accelerated conditions for two weeks, confirmed the impact of this excipient on the stability of the active substance. As revealed by HPLC analysis, an increase of the unknown impurity at RRT=0.36 and drotaveraldine (RRT=1.45 min) was observed (fig. 6).
Compatibility of drotaverine hydrochloride and stearic acid
Considering its unfavorable effects on the stability of drotaverine in the tablet formulation, magnesium stearate was replaced with stearic acid. To assess the compatibility of API and stearic acid, a mixture of both substances in a 1:1 ratio was prepared and stored under accelerated conditions for one week (fig. 7).
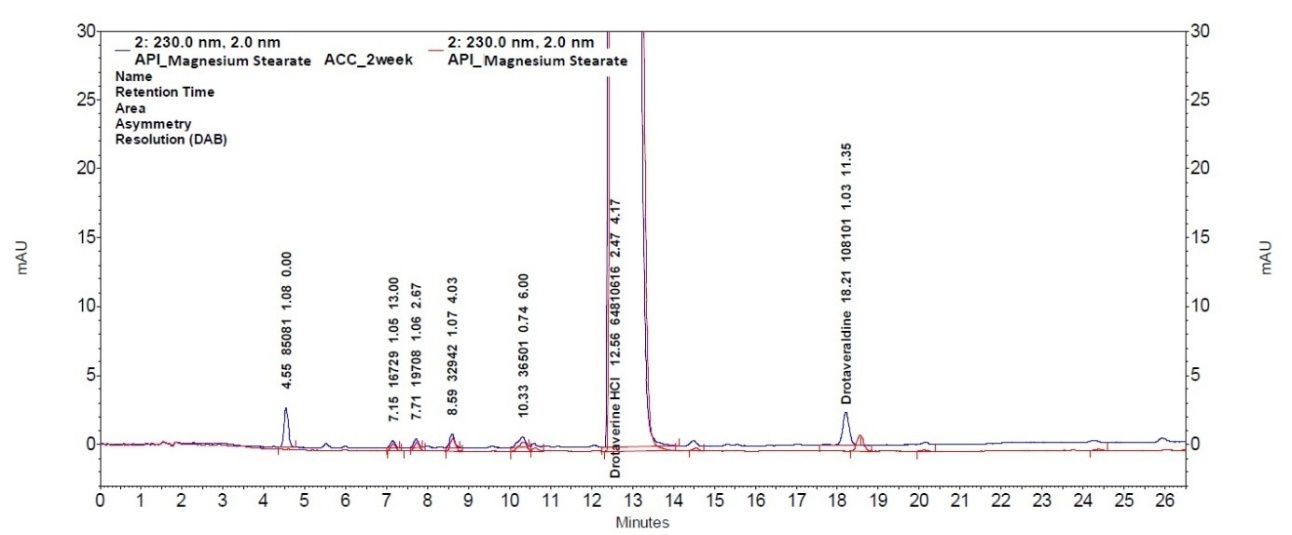
Fig. 6: Chromatograms of 1:1 mixture of drotaverine and magnesium stearate and 1:1 mixture of drotaverine and magnesium stearate after 2 w in accelerated conditions
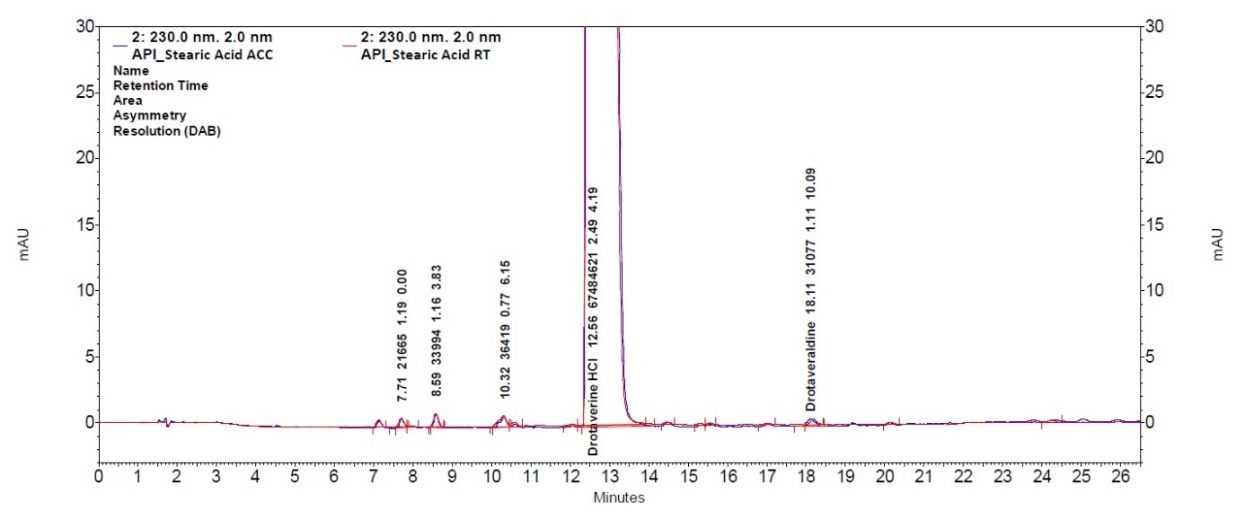
Fig. 7: Chromatograms of 1:1 mixture of drotaverine and stearic acid and 1:1 mixture of drotaverine hydrochloride and magnesium stearate after 1 w in accelerated conditions
Subsequent HPLC analysis revealed no increase in the impurities other than those already present in the API. The highest individual impurity detected was 0.07%, and the total impurity level reached 0.12%. Accordingly, the formulation containing magnesium stearate instead of stearic acid was selected for further studies.
Compatibility of drotaverine with tablet coating
To assess the compatibility of API with tablet coatings, three tablet coatings, designated as “white,” “green,” and “beige” were evaluated. These coatings differed in composition, with the “white” coating containing TiO2, and the “green” and “beige” coatings including iron oxides. The coated tablets underwent compatibility studies that included long-term, intermediate, and accelerated storage for one week, followed by HPLC analysis.
Under long-term and intermediate conditions, no increase of impurities was observed when compared to the initial analysis, performed before compatibility studies. However, in accelerated conditions, in tablets with green coating, an increase of drotaveraldine level (from 0.02% in initial analysis to 0.35%) was observed along with the appearance of impurities with RRT 2.05 (from<LOD to 0.27%) and RRT 2.36 (from<LOD to 0.1%) (table 3).
Table 3: Results of compatibility studies of green, white and beige coating with API in accelerated conditions
| Coating | Drotaveraldine | Imp. RRT 2.05 | Imp. RRT 2.36 | |||
| start | 1 w | start | 1 w | start | 1 w | |
| White | 0.03% | 0.26% | <LOD | 0.04% | <LOD | <LOD |
| Green | 0.02% | 0.35% | <LOD | 0.27% | <LOD | 0.10% |
| Beige | 0.06% | 0.21% | <LOD | 0.03% | <LOD | <LOD |
In contrast, tablets with white and beige coatings exhibited significantly lower levels of drotaveraldine (0.26% and 0.21% vs 0.35%, respectively) and the impurity at RRT 2.05 compared to the green-coated tablets (0.04% and 0.03% vs 0.27%, respectively). Furthermore, the impurity at RRT 2.36 was not detected in either the white or beige-coated tablets. Among the formulations tested, those with the beige and white coatings demonstrated more favorable impurity profile than green one and were therefore selected for further studies involving stability testing.
Prototype tablet formulation
Two tablet prototypes containing drotaverine hydrochloride were manufactured in laboratory scale. The qualitative composition of the tablets is presented in table 4.
Table 4: Tablet composition
| Batch | F1A | F1B |
| Active substance | Drotaverine HCl 80 mg | Drotaverine HCl 80 mg |
| Core | Cellulose Crospovidone Aerosil Stearic acid Talc |
Cellulose Crospovidone Aerosil Stearic acid - |
| Coat | “white” containing TiO2 | “beige” containing iron oxides |
Formulation F1A was coated with a white film containing TiO2, whereas formulation F1B was coated with a beige film that included iron oxides. The core of both formulations comprised cellulose, crospovidone, aerosil (colloidal silicon dioxide) and stearic acid. Talc, commonly used as a lubricant and anti-adherent, was excluded from formulation B due to its basic properties, which, as demonstrated with magnesium stearate, can catalyze the degradation of drotaverine to drotaveraldine. The tablets were packed inpolyvinyl chloride/polyvinylidene chloride (PVC/PVdC) blisters.
Stability studies
Evaluation of the impact of various environmental conditions such as temperature, humidity and light, which affect the stability of API, is crucial for determining the appropriate storage conditions, retest periods and shelf life of the drug product. Therefore, two batches of the final product (F1A and F1B) were packed in blisters and subjected to stability studies under accelerated (ACC 40 °C/75%), intermediate (INT 30 °C/65%) and long-term conditions (LT 25 °C/60%).
According to ICH guidelines, for drug substances with a proposed re-test period of at least 12 mo, long-term stability testing should be conducted at three-month intervals during the first year of studies [24]. Nevertheless, to obtain more comprehensive data, we increased the testing frequency by introducing additional time points at one, two, and three weeks, with further analysis scheduled after two, three, and six months of storage. The results of the stability studies for both batches are presented in fig. 8.
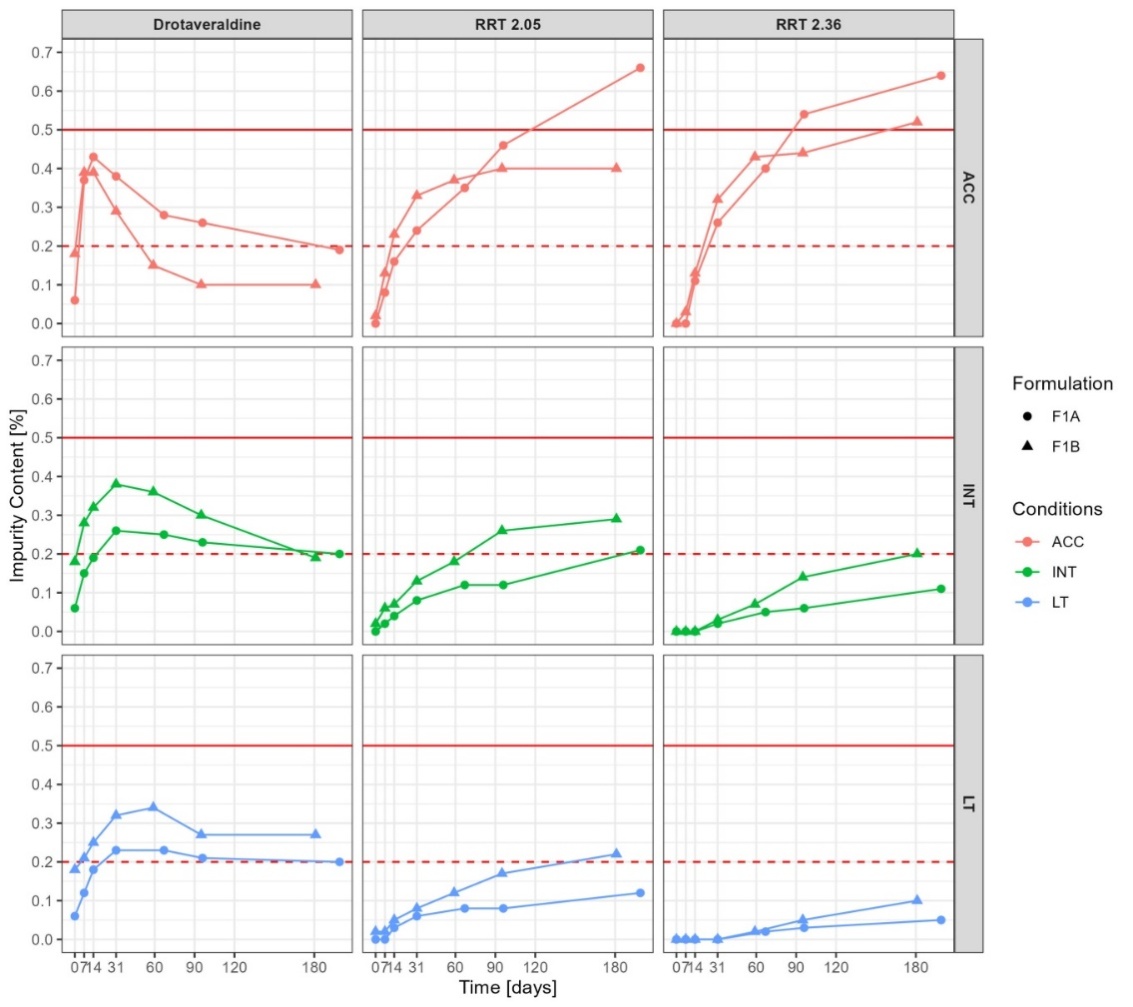
Fig. 8: Comparison of stability studies for F1A and F1B formulations, ACC-accelerated, INT-intermediate, LT-long-term conditions
The impurity profiles were comparable for F1A and F1B formulations across all tested conditions. Drotaveraldine was the main degradant in both formulations. Under accelerated conditions, the level of drotaveraldine reached maximum after two and three weeks for F1B and F1A formulations, respectively. The subsequent decrease of drotaveraldine level was associated with the increase of two impurities with RRT 2.05 and 2.36.
In F1B formulation, after 6 mo of storage under long long-term conditions, the level of drotaveraldine stabilized at 0.27%, remaining below the acceptable limit for known impurities (0.5%). In the same time, the impurity levels for compounds with RRT of approximately 2.05 and 2.36 were 0.22% and 0.10%, respectively (fig. 8). Under accelerated conditions the degradation of API in F1B series, particularly to drotaveraldine, reached a maximum level of 0.39% after two weeks of storage and subsequently decreased to 0.10% after six months. The impurities with RRT of 2.05 and 2.36 were detected at concentrations of 0.23% and 0.13% respectively, after two weeks and 0.40% and 0.52% after 6 mo of storage under accelerated conditions (fig. 9).
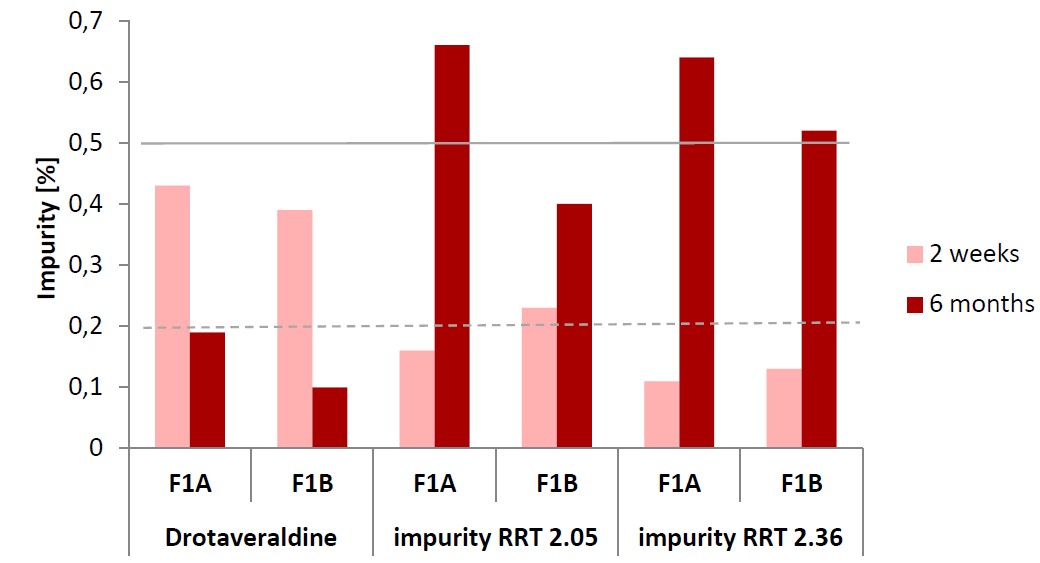
Fig. 9: Impurity levels for drotaveraldine and impurities at RRT 2.05 and 2.36 after 2 w and 6 mo of storage under ACC conditions
It is worth to emphasize that impurity at RRT 2.05 was detected in all tested conditions, and its level consistently exceeded the acceptable threshold of 0.2% for unknown impurities, based on the drotaverine hydrochloride content in the tested solution. In contrast, the impurity with an RRT of 2.36 exceeded the 0.2% threshold only under accelerated storage conditions.
Although the impurity profiles of both series were comparable under corresponding conditions, the F1B formulation was selected for further evaluation because of the absence of TiO2.
Formulation F1B, which did not contain TiO2 in the coating composition, was selected based on the results of the six-month stability studies. For this formulation, the HPLC analytical method for the determination of impurities in tablets containing drotaverine hydrochloride was validated according to the requirements of the European Commission and ICH guidelines [25].
Validation parameters included: specificity and selectivity, system precision, linearity, precision, accuracy, limit of detection (LOD), limit of quantification (LOQ), stability of standard and sample solutions and range. Moreover, the forced degradation study was performed to identify the potential impurities and API degradation pathways.
Validation results of the analytical method
Specificity and selectivity
The method was demonstrated to be specific, as no peaks corresponding to drotaverine or its known impurities (drotaverine amine, drotaverine acid, drotaveraldine and drotaverine amide) were observed on the chromatogram of diluent and placebo solutions. Additionally, all peaks of API, placebo, and impurities were well resolved (fig. 10).
System precision
To determine system precision six injections of standard solutions of drotaverine hydrochloride at the acceptable level of individual impurity were made (0.00025 mg/ml). Test results and statistic evaluation are presented in table 5.
Linearity
In order to determine linearity of the method, the analyses were performed in the range from LOQ to 500% in relation to the acceptable level 0.2% for impurity. At each tested level, solutions of drotaverine hydrochloride were prepared from weights of standard substances and diluted to appropriate concentration levels. The correlation coefficient value (0.999983) confirmed the linearity of method being validated (fig. 11).
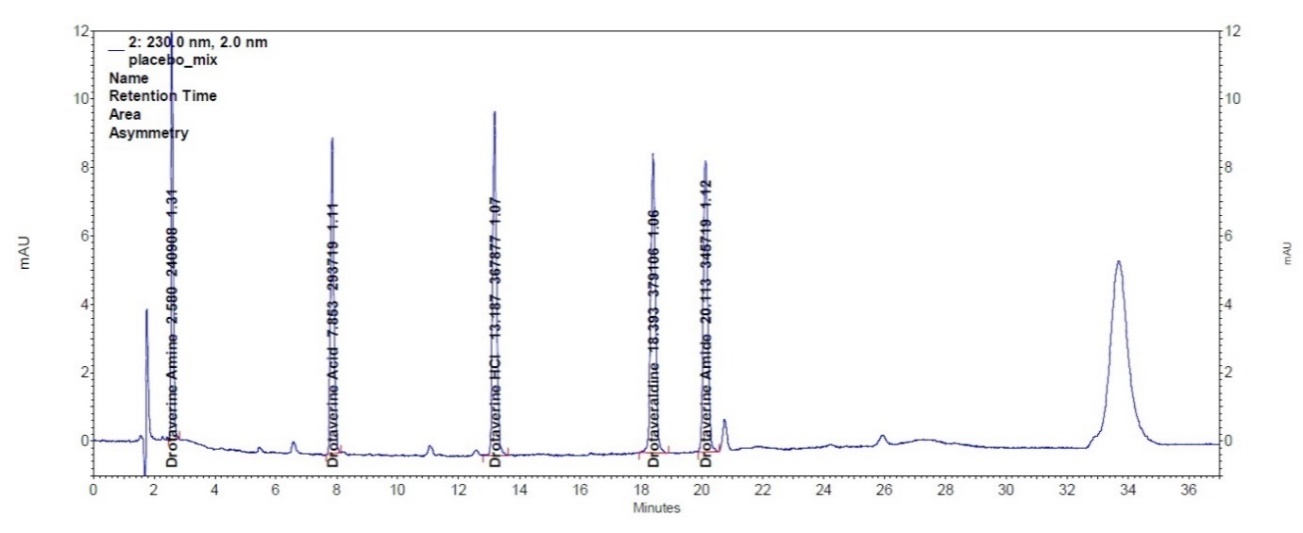
Fig. 10: Chromatogram of placebo spiked with API and known impurities (drotaverine amine, drotaverine acid, drotaveraldine and drotaverine amide) at 0.5% level relative to the API concentration
Table 5: Results of method system precision obtained for tablets containing 80 mg of drotaverine hydrochloride (Formulation F1B)
| Injection no | Area |
| 1 | 129029 |
| 2 | 129902 |
| 3 | 129150 |
| 4 | 130089 |
| 5 | 128542 |
| 6 | 128925 |
| Average | 129273 |
| RSD [%]a | 0.46 |
| RSD limit | NMT 5.0% |
aRSD – relative standard deviation. The calculated relative standard deviation (RSD) for peak areas met the acceptance criteria (NMT 5%).
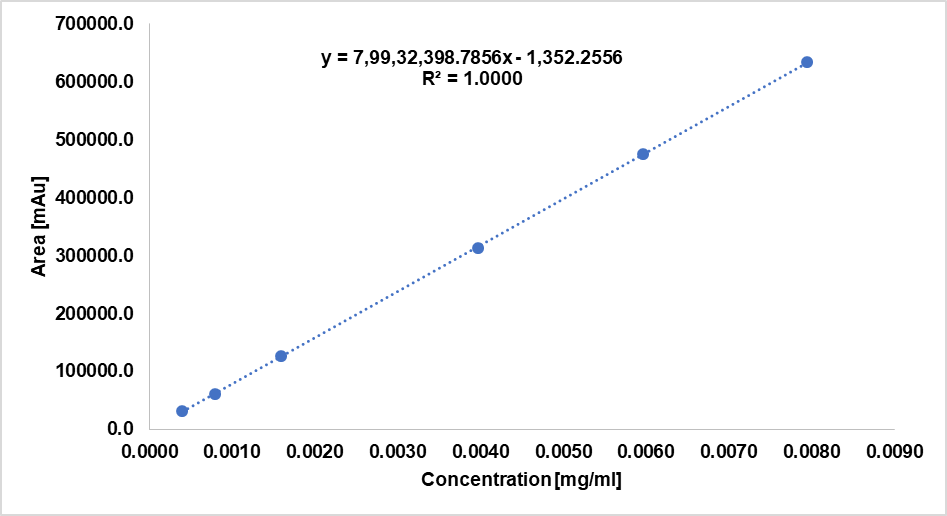
Fig. 11: Linearity plot for drotaverine hydrochloride
Precision (repeatability and intermediate precision)
The repeatability of the proposed analytical method was verified by performing six chromatographic purity tests of tablets containing 80 mg of drotaverine hydrochloride (formulation F1B, storage conditions 3 mo/25 °C/60% RH). The intermediate precision of the proposed analytical method was verified by performing six chromatographic purity tests for the same sample, carried out by another analyst, using other apparatus, reagents and column from another batch. Impurity profiles obtained for method precision and intermediate precision were comparable (table 6).
The comparability of impurity profiles was confirmed, as follows: for impurities at the LOQ level, the RSD did not exceed 25%; for impurities in the range from LOQ to 0.1%, the RSD was not higher than 15%; and for impurities above 0.1%, the RSD remained below 10%. The relative differences between results for all individual quantified impurities were within acceptance criteria for impurities between LOQ and 0.1%, the difference did not exceed 60%, while for impurities above 0.1%, the difference was within 40%. The detailed data on the method precision and intermediate precision is presented in the SI (table 4-SI and table 5-SI).
Table 6: Results of method precision (repeatability and intermediate precision) obtained for tablets containing 80 mg of drotaverine hydrochloride (Formulation F1B)
| Name of impurity | Repeatability study (First analyst) (n=6) |
Intermediate precision (Second analyst) (n=6) |
RSD [%] Repeatability and intermediate precision (n=12) | Relative difference of average values [%] |
| Mean [%]±SD | ||||
| Unknown imp. (RRT≈0.68) | 0.042 ±0.0009 (<LOQ)a | 0.042 ±0.0021 (<LOQ) | 3.72 | 0.0 |
| Unknown imp. (RRT≈0.96) | 0.058±0.0008 | 0.058±0.0010 | 1.54 | 0.0 |
| Drotaveraldine (RRT ≈1.49) | 0.269±0.0046 | 0.263±0.0039 | 1.89 | 2.0 |
| Max. unk. imp. (RRT ≈2.05) | 0.169±0.0015 | 0.165±0.0015 | 1.74 | 2.9 |
| Unknown imp. (RRT ≈2.36) | 0.049±0.0026 | 0.038±0.0013 (<LOQ) | 14.03 | 26.0 |
| Total impurities | 0.545±0.0053 | 0.486±0.0044 | 6.08 | 9.9 |
aLOQ for Drotaverine HCl and known impurities: 0.05 %.
Accuracy
In order to determine accuracy of the method three solutions of placebo with addition of drotaverine hydrochloride standard substance on each level (LOQ, 0.2 % and 1.0%) were prepared. The sample solutions were prepared using mixture of placebo and standard substance following sample solution preparation procedure. Furthermore, the method proved to be accurate, as the recovery of API concentration in solutions of placebo with addition of API standards at concentration levels of LOQ, 100%, 200%, and 500% of the acceptable impurity level was 100.7%, 100.4%, 101.4%, and 100.4%, respectively.
Detection limit and quantitation limit
Detector response factor (RRF)
RRFs were determined for the known impurities. The related substances of drotaverine HCl exhibit similar detector responses at 230 nm: drotaverine amine 0.87, drotaverine acid 0.93, drotaverine 1.27, and drotaverine amide 1.06. Therefore, the LOD and LOQ values were considered the same for all impurities, as the small variations in detector response do not significantly affect the method’s sensitivity.
LOD
Noise levels were calculated based on the blank test chromatograms (diluent). Theoretical limit of detection for drotaverine hydrochloride equivalent to the signal-to-noise ratio equal to 3 was then calculated and six injections of the standard solution of drotaverine hydrochloride at the concentration level corresponding to that limit were made. LOD for drotaverine hydrochloride and known impurities (drotaverine amine, drotaverine acid, drotaveraldine and drotaverine amide) were equal to 1.6∙10-4 mg/ml (which corresponds to 0.02% content of impurity).
LOQ
Noise levels were calculated based on the blank test chromatograms (diluent). Theoretical limits of quantification for drotaverine hydrochloride equivalent to the signal-to-noise ratio 10 were then calculated and six injections of the standard solutions of drotaverine hydrochloride at the concentration level corresponding to the limits were made. LOQ for drotaverine hydrochloride and known impurities (drotaverine amine, drotaverine acid, drotaveraldine and drotaverine amide) were equal to 4.0∙10-4 mg/ml, which corresponds to 0.05% content of impurity.
Stability of solutions
The standard solutions are stable up to 21 days when stored at temperature 2-8 °C and at ambient temperature. The sample solutions are stable up to 48 h when stored at temperature 2-8 °C ambient temperature.
Range
The validated method demonstrates satisfactory precision, accuracy and linearity, in the range from quantification limit to 500% of specified level of individual impurities.
Forced degradation study
Forced degradation studies (stress testing) are a mandatory aspect of the drug development process, facilitating the identification of potential degradation products, decomposition pathways, and the validation of stability-indicating analytical procedures [24]. These experiments assess the impact of various physicochemical factors on the chemical stability of the active substance. Samples of drotaverine hydrochloride containing tablets (formulation F1B) were treated with 0.5M HCl, 0.5M NaOH, 10% H2O2, exposed to UV/Vis irradiation according to ICH guidelines and exposed to elevated temperature (60 °C) for 7 days and 40 °C/75% RH for 3 mo.
The results of the degradation study for the known impurities and selected unknown ones that showed a significant increase compared to their initial levels is presented in table 7. Detailed results of the tablet degradation study are provided in the Supplementary Materials.
Table 7: Summary of the results of the degradation study
Name of impurity |
RRT | Impurity [%] | |||||||
| Control sample | 0.5M HCl 2h/60 °C |
0.5M NaOH 2h/60 °C |
10% H2O2 20 min |
10% H2O2 120 min |
UV/Vis | 60 °C 7 d |
40 °C 75% RH 3 mo | ||
| Amine | 0.20 | NDa | <LODb | 0.09 | ND | ND | ND | ND | ND |
| Unk. imp. | 0.47 | <LOQc | 0.06 | 0.73 | 0.05 | 0.08 | 0.05 | 0.06 | 0.07 |
| Acid | 0.62 | ND | ND | ND | ND | ND | ND | ND | ND |
| Unk. imp. | 0.86 | ND | 0.14 | 0.70 | <LOD | <LOQ | ND | ND | ND |
| Unk. imp. | 0.88 | <LOQ | <LOQ | 0.75 | <LOD | <LOD | <LOQ | <LOQ | <LOQ |
| Unk. imp. | 0.96 | 0,06 | 0.11 | 0.22 | 0.07 | 0.07 | 0.06 | 0.40 | 0.20 |
| Drotaveraldine | 1.47 | 0.32 | 1.82 | 5.11 | 0.31 | 0.31 | 0.22 | 0.15 | 0.08 |
| Amide | 1.60 | ND | ND | ND | ND | ND | ND | ND | ND |
| Unk. imp. | 2.05 | 0.19 | 0.27 | 0.73 | 0.20 | 0.20 | 0.19 | 0.59 | 0.40 |
| Unk. imp. | 2.36 | 0.05 | 0.05 | 0.07 | 0.05 | 0.05 | 0.05 | 0.15 | 0.44 |
aND – not detected. bLOD for Drotaverine HCl and known impurities: 0.02 %. cLOQ for Drotaverine HCl and known impurities: 0.05 %.
Under acidic conditions, drotaveraldine was the main degradant (RRT 1.47, 1.82%), accompanied by unknown impurity at RRT 2.05 (0.27%). On the other hand, basic hydrolysis lead to the formation of drotaveraldine (RRT 1.47, 5.11%) along with additional degradation products: RRT 0.88 (0.75%), RRT 0.47 (0.73%) and RRT 2.05 (0.73%), RRT 0.86 (0.70%), RRT 0.96 (0.22%). Under oxidative conditions drotaveraldine (0.31%) and impurity at RRT 2.05 (0.20%) were the most common impurities detected. During the storage of tablets at elevated temperature (60 °C) the impurity with an RRT of 2.05 was consistently observed (0.59%). Storage in accelerated conditions (accelerated, 40 °C/75%) for 3 mo led to the formation of the impurities with RRTs of 2.05and 2.36, which reached levels of 0.40% and 0.44%, respectively.
The conducted stress studies demonstrated that drotaveraldine and the impurity detected at RRT 2.05 are the principal degradation products, formed under acidic/basic and multiple stress conditions, respectively. In addition, under accelerated conditions, another impurity with RRT of 2.36 was observed, reaching a level of 0.44% after three months. These results confirm the stability-indicating capability of the method and emphasize the significance of the identified degradation products.
According to the of ICH Q3B(R2) guideline “Impurities in New Drug Products”, the maximum level for an unknown impurity is established at 0.2%. However, identification of the impurity allows for extension of this level to no more than 0.5%. Because the level of impurity with RRT 2.05 exceeded 0.2%, further studies aimed at elucidation of its structure.
Identification of perparaldine
UPLC-MS analysis performed for degraded sample of tablets containing drotaverine, indicated [M+H]+equaling 410.2 for the peak with RRT 2.05, which could correspond to perparaldine (compound 7, fig. 2). Although perparaldine has been previously identified as an impurity of drotaverine, its standard for HPLC analysis is not commercially available. In order to confirm the identity of the impurity with RRT 2.05, we synthetized and isolated this compound for further characterization.
Considering that the level of impurity at RRT 2.05 was correlated with the level of drotaveraldine in stability studies, our strategy involved isolation of perparaldine (7) from the hydrolyzed drotaveraldine (6) sample (Scheme 1).
Further analyses using 1H NMR and 13C NMR methods were in line with the spectra reported in the literature and thus confirmed the structure of perparaldine (fig. 12 and fig. 13) [10]. A series of triplet and quartet signals appearing in the ranges of 1.44–1.55 and 4.10–4.24 ppm in the 1H NMR spectrum were assigned to the methyl and methylene protons of four ethoxy substituents. A pair of doublets at 7.58 and 8.41 ppm was attributed to two mutually coupled aromatic protons of the isoquinoline moiety. Two singlets observed in the aromatic region at 7.10 and 7.49 ppm are consistent with isolated protons on the diethoxy-substituted ring of the isoquinoline core. Finally, one doublet of doublets at 7.36 ppm and two doublets at 6.82 and 7.67 ppm were assigned to the benzoyl fragment with a 1,3,4-trisubstituted benzene ring. The 13C NMR spectrum further supported the structural assignment, showing signals for ethoxy carbons at 14.6–14.8 and 64.6–64.7 ppm, a set of aromatic carbons between 105–141 ppm, and oxygenated aromatic carbons in the 148–154 ppm range. A distinct carbonyl signal at 194.2 ppm confirmed the presence of the benzoyl group.
Scheme 1: Reagents and conditions: (i) air, diethyl ether, rt, 7h, (ii) 1M NaOH, ethanol, 60 °C, 18h
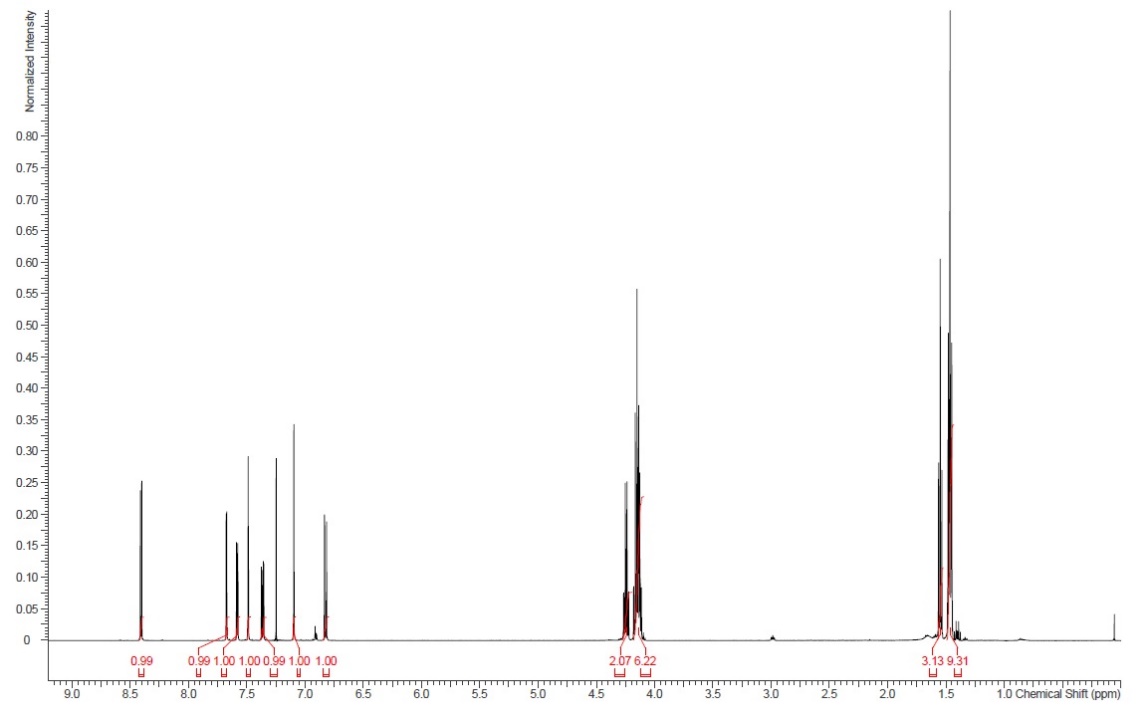
Fig. 12: 1H NMR spectra of perparaldine
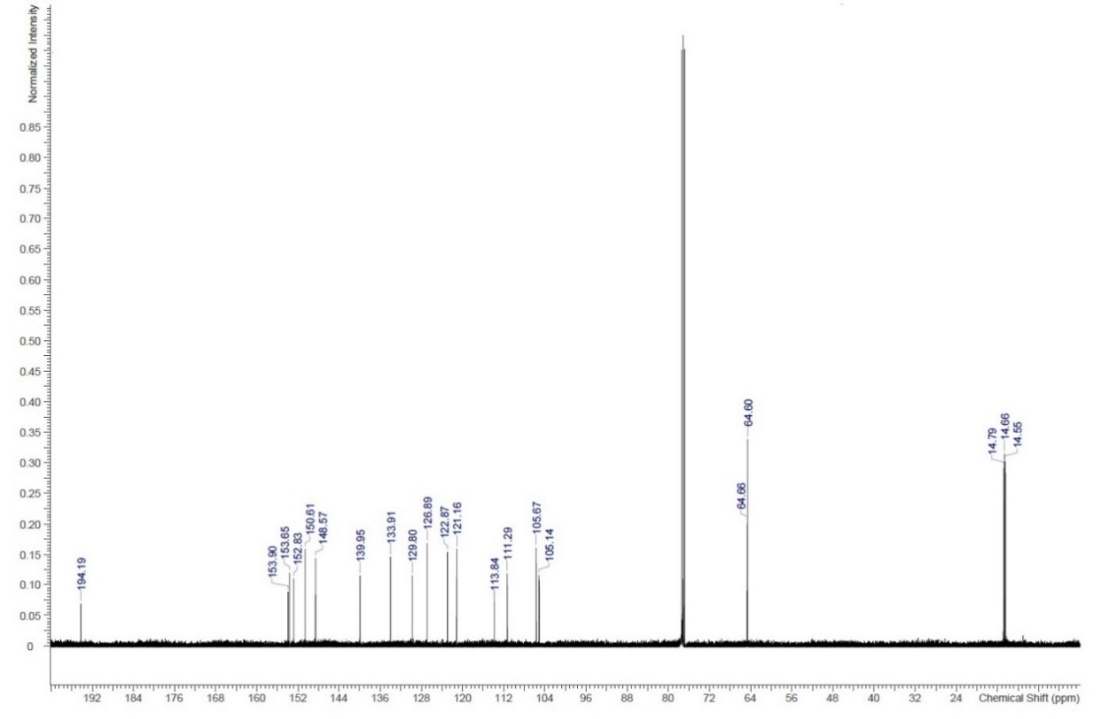
Fig. 13: 13C NMR spectra of perparaldine
DISCUSSION
On May 6, 2021, the European Food Safety Authority published a scientific opinion raising genotoxicity concerns related to TiO2 as a food additive [4]. Consequently, the use of TiO2 in food products became prohibited [5]. Shortly thereafter, the European Medicines Agency (EMA) evaluated the use of TiO2 in medicinal products. To prevent potential drug shortages, the European Commission temporarily retained TiO2 on the list of approved excipients until suitable and safe alternatives are identified.
In response to this need, we made the attempt to develop drotaverine hydrochloride-containing tablets (80 mg) with TiO2-free film coating. Based on previous studies, it has been demonstrated that the presence of magnesium stearate in tablet formulations can promote oxidative degradation processes [23, 26]. In particular, the decomposition of drotaverine hydrochloride was found to accelerate in formulations containing both magnesium stearate and talc. The primary degradation pathway was identified as oxidation leading to the formation of drotaveraldine, while the addition of acidic excipients or antioxidants was reported to suppress this reaction. These findings were further confirmed by compatibility studies conducted by F1 Pharma, in which magnesium stearate, commonly used in drotaverine hydrochloride tablets was replaced with stearic acid to minimize oxidative degradation and improve formulation stability. To assess the compatibility of API with tablet film coatings, three coating variants were evaluated: white, green, and beige. Based on the HPLC analysis of the levels of generated impurities, the formulations with the white and beige coatings were selected for further studies.
Two laboratory-scale tablet prototypes containing drotaverine hydrochloride were produced and packaged in PVC/PVdC blisters. Both formulations contained 80 mg of drotaverine hydrochloride, along with cellulose, crospovidone, silica and stearic acid. Formulation F1A additionally contained talk in the tablet core and was coated with a white film containing TiO2. On the other hand, formulation F1B was coated with a beige film, in which TiO2 was replaced by iron oxides.
To assess whether the TiO2-free coating is suitable for the pilot-scale manufacturing, both formulations F1A and F1B underwent a 6-month stability study under long-term, intermediate, and accelerated storage conditions, followed by impurity evaluation. HPLC analysis demonstrated that impurity levels and profiles were comparable for both formulations across all tested conditions. These results indicate that TiO2 is not critical to the formulation's stability and can be successfully replaced with iron oxides without compromising the quality or shelf-life of the product. Studies conducted by Kawakita et al. demonstrated that even low concentrations of red or yellow iron oxides provide substantial photoprotection, supporting the use of TiO2-free beige coatings as a viable alternative without compromising the chemical stability of the active pharmaceutical ingredient [27].
The main degradant detected in both formulations was drotaveraldine, which is consistent with observations reported in patent EP 3 749 286 B1 [28]. In both formulations, the level of drotaveraldine stabilized below the acceptable limit for known impurities (0.5%) irrespective of the storage conditions tested. In addition, impurities with RRT values of 2.05 and 2.36 were detected under all storage conditions.
According to the of ICH Q3B(R2) guideline “Impurities in New Drug Products”, the maximum level for an unknown impurity is established at 0.2% of the API content in tested formulation. However, identification of the impurity allows for extension of this level to no more than 0.5%.
The impurity with an RRT of 2.36 exceeded the acceptable limit under accelerated (ACC) conditions. As observed for other drotaverine-containing products available on the market, it would therefore be advisable to establish storage conditions for the developed tablets at temperatures below 25 °C to ensure product stability and maintain impurity levels within the specified limits. On the other hand, the level of impurity with an RRT of 2.05 exceeded the regulatory threshold of 0.2% for unknown impurities, under both long-term and accelerated storage conditions. Therefore, further studies aimed at elucidation of its structure.
Degradation of drotaverine to drotaveraldine followed by basic hydrolysis allowed for obtaining impurity at RRT 2.05, which was isolated from the reaction mixture and purified using column chromatography. Subsequent identification was confirmed by UPLC-MS, 1H NMR, and 13C NMR analyses, which unequivocally validated the structure of perparaldine. These results were supportive to increase its impurity qualification threshold.
Although several HPLC methods for the determination of drotaverine hydrochloride in pharmaceutical formulations have been reported in the literature, few studies have addressed the determination of drotaverine-related impurities, particularly perparaldine, largely because drotaverine hydrochloride is not included in any pharmacopeial monograph. Thummala et al. reported on the development of a stability-indicating method which involves four impurities, however it does not include perparaldine [8]. Similar studies by Kumar et al. on oral dosage forms containing drotaverine and ibuprofen also address only four impurities [20].
In view of the limited analytical data available, a robust and validated HPLC method was developed for the determination of drotaverine hydrochloride related substances in the newly formulated dosage form, in accordance with the ICH Q2(R2) guideline. The method demonstrated to be specific, selective, linear, precise and accurate, thereby enabling the chromatographic quantification of drotaverine-related substances in tablets containing 80 mg of drotaverine hydrochloride.
A key advantage of this method is its ability of detecting and quantifying all impurities of drotaverine, including those generated under long-term, intermediate and accelerated storage condition. This comprehensive approach ensures a thorough evaluation of the drug product's quality by enabling the identification of both known impurities and degradation products that may emerge during stability studies, such as perparaldine. These findings confirm the suitability of the developed method for routine quality control and stability testing of drotaverine formulations.
CONCLUSION
In our efforts to develop tablets containing drotaverine hydrochloride, we formulated a novel film-coated tablets (F1B) that excludes TiO2. Following a 6-month stability study conducted under long-term, intermediate, and accelerated conditions, the impurity profile of formulation F1B was found to be comparable to that of the TiO2-containing formulation (F1A). These results suggest that TiO2 can be successfully replaced by iron oxides in the film coating without adversely affecting the product's stability.
After 6 mo of accelerated storage, drotaveraldine, the main degradation product of drotaverine, was detected at 0.3%, well below the 0.5% limit for known impurities. Additional impurities with RRTs of 2.05 and 2.36 were observed; notably, the 2.05 impurity stabilized at 0.2% under long-term storage, reaching the upper limit for unknown impurities. UPLC-MS and NMR analyses identified this impurity as perparaldine, justifying extension of its specification limit to ≤0.5% in line with ICH Q3B(R2), ensuring product quality over the two-year shelf life [29].
In order to determine drotaverine hydrochloride-related substances in the developed formulation new HPLC method was elaborated and validated. The method was found to be specific, precise, accurate, linear and robust. It allows for the quantification of all impurities arising during stability studies. Therefore, it is suitable for testing the purity of the drug product.
The presented studies enabled the preparation of formulation of drotaverine hydrochloride containing tablets (80 mg) with TiO2-free coating for the pilot batch production.
ACKNOWLEDGEMENT
The study was financially supported from the Małopolska Centre of Entrepreneurship Grant No RPMP.01.02.01-12-0400/17-00 and by the Faculty of Geology, Geophysics and Environmental Protection at the AGH University of Krakow, Poland (No. 16.16.140.315).
AUTHORS CONTRIBUTIONS
Conceptualization: MSb, MS, WT; Data curation: MSb, KS, WT; Formal analysis: MSb, WT; Funding acquisition: MSb, MS; Investigation: MSb, KG, KS, WT; Methodology: MSb, KS, WT; Project administration: MS; Resources: MS, PZ; Supervision MS; Validation: MSb, KS; Roles/Writing-original draft: MSb, KG; Writing-review and editing: PZ, MS.
CONFLICT OF INTERESTS
Declared none
REFERENCES
Shabbir S, Kulyar MF, Bhutta ZA, Boruah P, Asif M. Toxicological consequences of titanium dioxide nanoparticles (TiO2NPs) and their jeopardy to human population. BioNano Science. 2021;11(2):621-32. doi: 10.1007/s12668-021-00836-3, PMID 33520589.
Shi J, Han S, Zhang J, Liu Y, Chen Z, Jia G. Advances in genotoxicity of titanium dioxide nanoparticles in vivo and in vitro. Nano Impact. 2022;25:100377. doi: 10.1016/j.impact.2021.100377, PMID 35559883.
Chen Z, Wang Y, Ba T, Li Y, Pu J, Chen T. Genotoxic evaluation of titanium dioxide nanoparticles in vivo and in vitro. Toxicol Lett. 2014;226(3):314-9. doi: 10.1016/j.toxlet.2014.02.020, PMID 24594277.
European Food Safety Authority. Safety assessment of titanium dioxide (E171) as a food additive. EFSA J. 2021;19(5):e06301. doi: 10.2903/j.efsa.2021.06301.
European Union. Commission Regulation (EU) 2022/63 of 14 January 2022 amending Annexes II and III to Regulation (EC) No 1333/2008 of the European Parliament and of the Council as regards the food additive titanium dioxide (E171). Official Journal of the European Union. 2022 Jan 14;L13:1‑3.
Schoneker DR. Why would the EU want to ban titanium dioxide in pharmaceutical products? What would be the potential impact on patients? J Excipients Food Chem. 2022;13:94-8.
Blundell R, Butterworth P, Charlier A, Daurio D, Degenhardt M, Harris D. The role of titanium dioxide (E171) and the requirements for replacement materials in oral solid dosage forms: an IQ consortium working group review. J Pharm Sci. 2022;111(11):2943-54. doi: 10.1016/j.xphs.2022.08.011, PMID 35973604.
Thummala VR, Tharlapu SS, Rekulapalli VK, Ivaturi MR, Nittala SR. Development and validation of a stability-indicating RP-HPLC method for the estimation of drotaverine impurities in API and pharmaceutical formulation. Sci Pharm. 2013;82(1):99-115. doi: 10.3797/scipharm.1309-06, PMID 24634845.
Vitanyine Morvai M, Kovacs P, Kalmanne Mathe I, Jakab B, Vegeli. Paracetamol and drotaverine-containing composition. E. WO2001007024A2-1; 2001.
Pavel IZ, Heller L, Sommerwerk S, Loesche A, Al Harrasi A, Csuk R. Drotaverine a concealed cytostatic! Arch Pharm (Weinheim). 2017;350(1):e1700053. doi: 10.1002/ardp.201600289, PMID 27879007.
Ziyatdinova GK, Samigullin AI, Abdullina SG, Budnikov GK. Quantitative estimation of benzylisoquinoline derivatives by coulometric titration. Pharm Chem J. 2008;42(2):98-101. doi: 10.1007/s11094-008-0068-z.
Rele RV, Pratamesh P, Tiwatane P. A Non-aqueous potentiometric titration method for validation of imatinib mesylate from pharmaceutical dosages. Asia Jour Rese Chem. 2019;12(6):307-10. doi: 10.5958/0974-4150.2019.00056.7.
Rele RV. UV spectrophotometric estimation of drotaverine hydrochloride by zero order and area under curve methods in bulk and pharmaceutical dosage form. Res J Pharm Technol. 2018;11(12):5576-80. doi: 10.5958/0974-360X.2018.01014.4.
Abdallah O, Rashed N, El Olemy A, Hosam Eldin A. UV spectrophotometric determination of paracetamol in presence of drotaverine hydrochloride. J Adv Pharm Res. 2017;1(2):89-95. doi: 10.21608/aprh.2017.1977.
Padmavathi P, Das P, Krunal P, Subrahmanyam EV. Analytical method devlopment and validation for estimation of drotaverin Hcl in bulk and tablet formulation. Asian Journal of Biomedical and Pharmaceutical Sciences. 2013;3(22):75-8.
Mehmood Y, Mahmood RK, Akram W. Development and validation of UV-spectrophotometric meth-ods for quantitative estimation of drotaverine HCl injection. Pharm Methods. 2017;8(1):31-5.
Balan P, Carolin Nimila I, Chundi S, Movva VR, Rajasekar S. A validated RP-HPLC method for estimation of drotaverine HCL in pharmaceutical tablet dosage form. Int J Pharm Pharm Sci. 2011;3(4):77-80.
Azhlwar S, Ravi TK. Stability-indicating HPLC method for simultaneous determination of drotaverine and aceclofenac. Int J Pharm Pharm Sci. 2011;3(1):245-50.
Sahani S, Jain V. A novel reversed-phase high-performance liquid chromatography method for simultaneous estimation of drotaverine hydrochloride ethamsylate and tranexamic acid in tablet dosage form. Asian J Pharm Clin Res. 2018;11(6):121-5. doi: 10.22159/ajpcr.2018.v11i6.24777.
Vijay Kumar R, Rao VU, Anil Kumar N, Venkata Subbaiah B. A novel rapid and validated stability-indicating UPLC method for the estimation of drotaverine hydrochloride and ibuprofen impurities in oral solid dosage form. Sci Pharm. 2015;83(4):567-81. doi: 10.3797/scipharm.1503-02, PMID 26839839.
Tawfik SA, El Ragehy NA, Hegazy MA, Sedik GA. A reversed-phase-high performance liquid chromatography method for simultaneous determination of paracetamol caffeine drotaverine HCl and their related impurities with dissolution profiling of their tablets and greenness profile assessment. Biomed Chromatogr. 2023;37(2):e5539. doi: 10.1002/bmc.5539, PMID 36287616.
Koo OM. Pharmaceutical excipients: properties functionality and applications in research and industry. Hoboken, NJ: John Wiley & Sons; 2016.
Pawelczyk E, Opielewicz M. Kinetyka rozkladu lekow. XLIX. Kinetyka samoutlenienia chlorowodorku drotaweryny w fazie stalej. Acta Pol Pharm. 1978;35(3):311-9. PMID 696363.
European Medicines Agency. ICH Q1A(R2): Stability Testing of New Drug Substances and Products. London: European Medicines Agency; 2003. Available from: https://www.ema.europa.eu/en/ich-q1a-r2-stability-testing-new-drug-substances-drug-products-scientific-guideline. [Last accessed on 22 Dec 2025].
European Medicines Agency. ICH Q2(R2) Validation of Analytical Procedures Scientific guideline. Amsterdam: European Medicines Agency; 2023. Available from: https://www.ema.europa.eu/en/ich-q2r2-validation-analytical-procedures-scientific-guideline. [Last accessed on 22 Dec 2025].
Li J, Wu Y. Lubricants in pharmaceutical solid dosage forms. Lubricants. 2014;2(1):21-43. doi: 10.3390/lubricants2010021.
Kawakita R, Sperger D, Chal B, Fogarty J, Mc Cormick M, To D. Using response surface methodology to quantify iron oxide levels needed to protect photolabile active pharmaceutical ingredients in oral solid dosage forms. J Pharm Sci. 2025;114(6):103778. doi: 10.1016/j.xphs.2025.103778, PMID 40164306.
Niemczyk K, Cieplucha A. A pharmaceutical composition comprising metamizole, drotaverine and caffeine. EP003749286B1; 2006.
International Council for Harmonisation of Technical Requirements for Pharmaceuticals for Human Use (ICH). ICH Q3B(R2) Impurities in New Drug Products. Step 4 version; 2006 June 2. Geneva: ICH; 2006. Available from: https://database.ich.org/sites/default/files/Q3B%28R2%29%20Guideline.pdf. [Last accessed on 22 Dec 2025].