
Int J App Pharm, Vol 18, Issue 2, 2026, 472-483Original Article
EXPERIMENTAL SOLID DISPERSION APPROACH TO ENHANCE THE SOLUBILITY AND THERAPEUTIC PERFORMANCE OF DOLUTEGRAVIR
SUNITHA SAMPATHI1, LAKSHMI DEVI GOTTEMUKKULA2*, SUJATHA DODOALA3, VIJAYA KUCHANA4
1Department of Pharmacy, Vishwakarma University, Pune-411048, Maharashtra, India. 2Joginpally B. R. Pharmacy College, Moinabad, R. R. District, Hyderabad, Telangana-500075, India. 3Institute of Pharmaceutical Technology, Sri Padmavathi Mahila Visvavidyalayam, Tirupati-517501, Andhra Pradesh, India. 4Teegala Krishna Reddy College of Pharmacy, Meerpet, Hyderabad, Telangana-500097, India
*Corresponding author: Lakshmi Devi Gottemukkula; *Email: lakshmidevi.gottemukkula@gmail.com
Received: 11 Sep 2025, Revised and Accepted: 07 Jan 2026
ABSTRACT
Objective: Dolutegravir (DTG), an HIV-1 integrase strand transfer inhibitor (INSTI), shows poor aqueous solubility (~15 µg/ml), limiting its therapeutic performance. This study aimed to enhance DTG solubility and oral bioavailability using various solid dispersion techniques.
Methods: Solid dispersions (SDs) were prepared by five methods-physical mixing, co-grinding, kneading, rota solvent evaporation, and lyophilization-using nine carriers: mannitol, PEG 4000 (polyethylene glycol 4000), PVP K90 (polyvinylpyrrolidone), HPMC E5LV (hydroxypropyl methylcellulose), Captisol®, Gelucire 44/14, Poloxamer 188, Poloxamer 407, and Soluplus® at drug-to-carrier ratios of 1:1–1:4 (w/w). Formulations were evaluated for solubility, dissolution, and in vivo pharmacokinetics in New Zealand white (NZW) rabbits using validated HPLC methods.
Results: Among 24 formulations, Lyophilization with Soluplus® and Captisol yielded the highest dissolution rates, with 89.14±1.17% and 77.14±1.63% drug release after 2 h. This marked improvement over pure DTG (14.63±0.72% release) was attributed to the effective conversion of the crystalline drug to an amorphous state and the formation of a homogeneous dispersion. Soluplus® demonstrated superior performance in enhancing DTG solubility and dissolution rate compared to Captisol. The solid dispersion formulation demonstrated superior pharmacokinetic properties compared to both the Dolutegravir and the marketed formulation. At 2 h post-administration, the mean plasma concentration for the F24 was 3236.71±461.42 ng/ml, compared to 1457.42±221.54 ng/ml for Dolutegravir and 2465.85 ±456.23 ng/ml for the marketed formulation.
Conclusion: Lyophilization with Soluplus® significantly enhanced solubility, dissolution, and oral bioavailability of DTG, providing a promising strategy for improved oral delivery. The experimental results collectively confirm that lyophilization with Soluplus® is a reproducible and scalable approach for solubility enhancement of dolutegravir.
Keywords: Dolutegravir, Soluplus®, Captisol®, Lyophilization, Solid dispersion
© 2026 The Authors.Published by Innovare Academic Sciences Pvt Ltd. This is an open access article under the CC BY license (https://creativecommons.org/licenses/by/4.0/)
DOI: https://dx.doi.org/10.22159/ijap.2026v18i2.56835 Journal homepage: https://innovareacademics.in/journals/index.php/ijap
INTRODUCTION
Dolutegravir (DTG) is a second-generation HIV integrase strand transfer inhibitor (INSTI) [1, 2]. That has demonstrated high efficacy in preventing the integration of viral DNA into host cell DNA, a crucial step in the HIV lifecycle. Approved by the FDA in 2013 [3], DTG has become an essential component of first-line antiretroviral therapy (ART) due to its once-daily dosing, high genetic barrier to resistance, and fewer drug-drug interactions compared to other antiretrovirals [4].
Despite its therapeutic advantages, DTG faces significant biopharmaceutical challenges. As a Biopharmaceutics Classification System (BCS) Class II drug, DTG exhibits low aqueous solubility (approximately 15 mg/l at 25 °C) and high permeability [4]. This low solubility limits its dissolution rate upon oral administration, potentially reducing its bioavailability and, consequently, its therapeutic efficacy. Moreover, drug-metabolizing enzymes and efflux transporters further compromise DTG's bioavailability in cellular and tissue reservoirs, leading to rapid clearance and limited permeability [2]. Various formulation strategies have been explored to overcome this challenge, including surface modification, complexation, nanoformulation, and solid dispersion techniques. Among these, solid dispersion has emerged as a simple, convenient, and cost-effective approach to enhance poorly soluble drugs' solubility and dissolution rate. Solid dispersion involves dispersing one or more active ingredients in an inert carrier or matrix in the solid state [5, 6]. This technique can enhance drug solubility through several mechanisms, including particle size reduction, improved wettability, and conversion of the crystalline drug to an amorphous state [7, 8]. Enhancing the solubility of poorly soluble components is essential for enhancing their clinical efficacy. Solubility improvement approaches contribute to developing more effective and patient-friendly drug formulations by enhancing bioavailability, therapeutic efficacy, patient compliance, and formulation flexibility. The choice of carrier and preparation method significantly influences the performance of solid dispersions.
In recent years, novel carriers have been developed to address the limitations of traditional solid dispersion systems. Soluplus®, a graft copolymer of polyvinyl caprolactam-polyvinyl acetate-polyethylene glycol, has shown promise in enhancing the solubility of poorly soluble drugs due to its amphiphilic nature and ability to form micelles in aqueous media [9]. Captisol, a chemically modified cyclodextrin, offers advantages in terms of complexation efficiency and safety profile compared to traditional cyclodextrins [10]. This study aims to systematically investigate the potential of Soluplus® and Captisol-based solid dispersions in enhancing the solubility and dissolution rate of DTG. The main objective of this work is to identify the most effective approach for improving DTG's biopharmaceutical properties by comparing various preparation methods, including physical mixing, co-grinding, kneading, rota solvent evaporation, and lyophilization.
MATERIALS AND METHODS
Materials
Dolutegravir (DTG) was received as a gift sample from Natco Pharma, Hyderabad, India. Poloxamer 188, 407, and Soluplus® were obtained as gift samples from BASF, INDIA Ltd. Other materials used in this study included hydroxy propyl methyl cellulose E5LV (HPMCE5LV), Tween 80, Captisol® (sulfobutylether-β-cyclodextrin), Polyvinyl Pyrrolidone K90 (PVPK90), Sodium Lauryl Sulphate (SLS), Mannitol, Polyethylene Glycol (PEG-4000), and Gelucire 44/14. All other chemicals and solvents used were of analytical grade and purchased from Asian Scientific Chemicals, Hyderabad, India. Freeze-dryer for lyophilization process purpose precise temperature and pressure control are provided from the NIPER, Hyderabad.
Methods
Construction of standard calibration curve
UV-visible spectrophotometry was utilized to construct the standard calibration curve for dolutegravir. The drug was precisely weighed, and 0.1N HCl was used to dissolve it to create a stock solution of dolutegravir. A series of standard solutions with concentrations ranging from 10 to 50 μg/ml were generated using this stock solution in calibrated volumetric flasks. To prepare for any background interference, 0.1N HCl was used to blank the UV-visible spectrophotometer(UV 1700, Shimadzu, Japan) before each standard solution was examined at 260 nm [11]. Absorbance values for each concentration were recorded. The calibration curve was constructed by plotting the recorded absorbance values against their corresponding concentrations. Linear regression analysis was performed on the calibration curve data to establish the relationship between absorbance and concentration, determining the slope, intercept, and correlation coefficient (R²) [12].
Phase solubility study
Phase solubility studies were conducted with various carriers, including mannitol, PEG 4000, PVPK90, Poloxamer 188 and 407, Gelucire 44/14, Soluplus®, β-cyclodextrins (Captisol), and HPMC E5 lV to determine the best carrier for dolutegravir [13, 14]. Solutions of various concentrations of carriers were prepared in distilled water. Excess dolutegravir was added to each carrier solution in glass vials, which were then shaken for 72 h at room temperature in a biological shaker (Orbital shaker SI 300, Jeio Tech, Korea). The contents were centrifuged at 4000 rpm for 15 min and filtered through a 0.45 μm membrane filter. Solubility was assessed using the UV-visible spectrophotometry method, as described in the earlier section [15].
Preparation of dolutegravir solid dispersions
Five different methods were used for the preparation of solid dispersions. The methods are as follows:
Physical mixing technique
Accurately weigh the drug and polymer, thoroughly mix them with a spatula, and pass through a no.100 sieve. The table 1 details the ratios of the drug and polymers used to prepare solid dispersions.
Co-grinding technique
The carrier and drug were combined in a mortar with weighed amounts, co-ground for 20 min, and then sifted through a sieve. no 100
Kneading technique
The required amount of API and carrier was weighed, placed in a mortar, and kneaded with 70% v/v methanol (1.5 times by w/v) for 20 minutes. The final product was crushed, dried at 40 °C, and sieved using a 100 no.
Solvent evaporation by rota evaporator
Drug and polymer were accurately weighed in the following proportions: In a mortar and pestle, 1:1, 1:2, 1:3, and 1:4 were thoroughly blended. After that, the mixture was properly dissolved in methanol to produce a clear, transparent solution. The solution was then moved to a rotary evaporator and vacuum dried between 45-50 °C, and 60 revolutions per minute. The dried mass was scraped off, and the solid dispersions were collected and kept in a desiccator until needed.
Lyophilization method
Solid dispersions of DLG and carriers (sulfobutylether-β-cyclodextrin (Captisol) and soluplus®) were prepared in drug: carrier ratios of 1 1, 1:2,1:3, and 1:4 using the lyophilization method. Dolutegravir dissolves in 1 ml of methanol, whereas β-cyclodextrin and soluplus® were separately dissolved in 20 ml of distilled water. The solution is mixed on a magnetic stirrer and homogenized separately using β-cyclodextrin and soluplus® aqueous solutions. Once homogeneous, the mixture is dried using a freeze dryer (FD5508, Skadi, Europe), and freeze-dried solid dispersions are stored in a sealed container and put in a desiccator until further use [16].
Table 1: Formulation of dolutegravir solid dispersions
| S. No. | Polymer name | Method name | API+polymer ratio | formulation codes |
| 1. | Sulfobutylether-β-cyclodextrin | Physical mixing method | 1:1 | F1 |
| 1:2 | F2 | |||
| 1:3 | F3 | |||
| 1:4 | F4 | |||
| Co-grinding method | 1:1 | F5 | ||
| 1:2 | F6 | |||
| 1:3 | F7 | |||
| 1:4 | F8 | |||
| Kneading method | 1:1 | F9 | ||
| 1:2 | F10 | |||
| 1:3 | F11 | |||
| 1:4 | F12 | |||
| Rota evaporation method | 1:1 | F13 | ||
| 1:2 | F14 | |||
| 1:3 | F15 | |||
| 1:4 | F16 | |||
| Lyophilization method | 1:1 | F17 | ||
| 1:2 | F18 | |||
| 1:3 | F19 | |||
| 1:4 | F20 | |||
| 2. | Soluplus® | Lyophilization method | 1:1 | F21 |
| 1:2 | F22 | |||
| 1:3 | F23 | |||
| 1:4 | F24 |
The solution was then vacuum dried in a rotary evaporator at 45-50 °C and 60 rpm. The dried mass was scraped off and collected [17, 18]. The preparation methods are illustrated in fig. 1. Drug: carrier ratios of 1:1, 1:2, 1:3, and 1:4 were prepared for the lyophilization method. Dolutegravir was dissolved in 1 ml of methanol, while β-cyclodextrin and Soluplus® were dissolved separately in 20 ml of distilled water. The solutions were combined on a magnetic stirrer, homogenized, and dried using a freeze dryer (FD5508, Skadi, Europe).
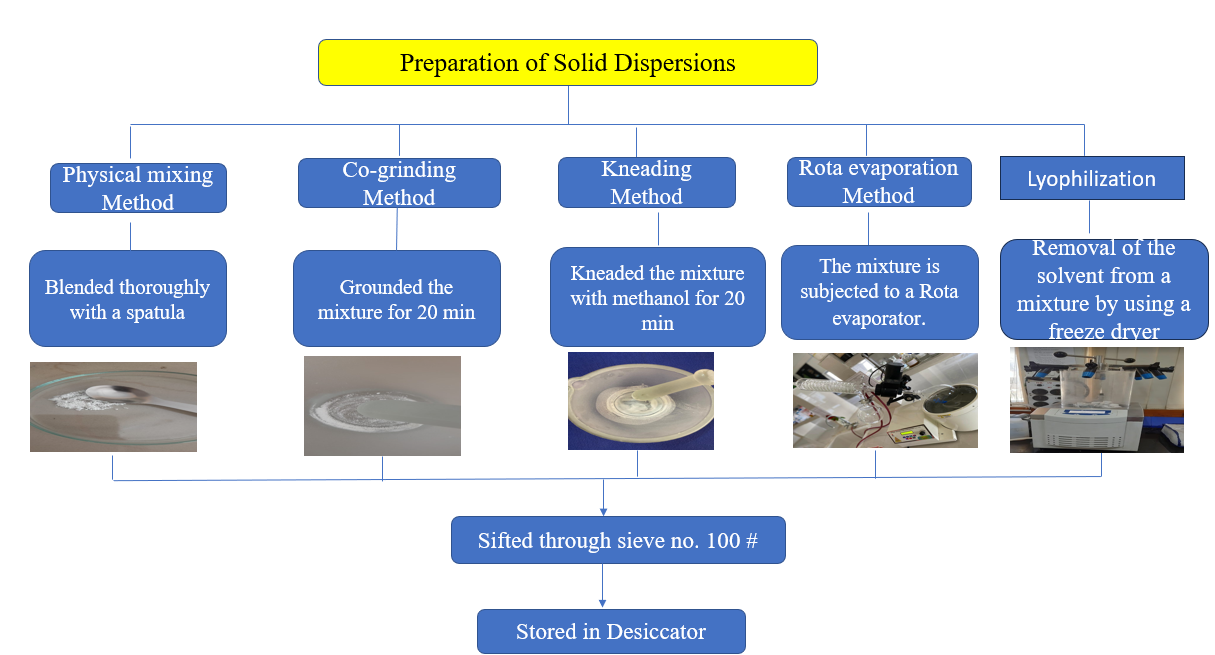
Fig. 1: Methodology for preparation of solid dispersions
Characterization of solid dispersions
Drug content determination
A sample equivalent to 50 mg of DTG was precisely weighed and transferred to a 100 ml volumetric flask. To ensure complete solubilization of DTG, 1 ml of methanol was added to the flask. This step is crucial as DTG has limited aqueous solubility, and methanol acts as a co-solvent to facilitate complete dissolution [19]. The volume was then made up to 100 ml using pH 6.8 phosphate buffer, which mimics the intestinal pH where drug absorption primarily occurs. The resulting solution was thoroughly mixed to ensure homogeneity. The concentration of DTG in this solution was then determined using a UV-visible spectrophotometer at a wavelength of 260 nm, which corresponds to the maximum absorption (λmax) of DTG. The absorbance values were compared against a pre-established calibration curve to calculate the drug content. This method accurately determines drug loading efficiency in the solid dispersion formulations and ensures batch-to-batch consistency.
Solubility studies
The saturation solubility studies were conducted to evaluate the solubility profile of DTG across a range of physiologically relevant pH conditions, from highly acidic (pH 1.2, simulating gastric conditions) to neutral (pH 7.4, simulating intestinal conditions). An excess amount of DTG was added to 3 ml of the respective medium for each pH condition in 5 ml glass vials. The use of excess drug ensures that a saturated solution is achieved. The vials were then subjected to continuous shaking at 50 rpm in a temperature-controlled environment of 37±0.5 °C for 48 h. After the 48 h, the samples were filtered to remove undissolved drug particles [13, 20]. The filtrate was then analyzed using a UV-visible spectrophotometer to determine the concentration of dissolved DTG. The absorbance values were measured at 260 nm and compared against a calibration curve specific to each pH condition to account for any pH-dependent shifts in absorption maxima.
Thermogravimetric analysis
Thermogravimetric Analysis (TGA) was performed using TA instruments, TGA5500, TRIOS Software version 5.5.0323. The weight change of the sample was measured concerning temperature under N2 environment. Differential Scanning Calorimetry (DSC) was conducted using TA instruments, DSC2500, TRIOS Software version 5.5.0323, measuring the heat change rate of the sample concerning temperature under N2 environment [21].
Fourier transform infrared spectroscopy
Fourier Transform Infrared Spectroscopy (FTIR) was recorded using an Agilent Cary 630 FTIR (Shimadzu, Japan) in the 400 to 4000 cm-1 range. Samples were ground with KBr and pressed into discs for measurement [22].
X-ray powder diffraction
X-Ray Powder Diffraction (XRPD) patterns were obtained using a high-resolution X-ray diffractometer (Malvern analytical empyrean 3), with a scanning angle of 0-40° of 2θ at 40 kV with Cu Kα radiation [23].
Scanning electron microscopy
Scanning Electron Microscopy (SEM) was employed to study the surface morphology and shape of the samples using a scanning electron microscope (FEI Quanta FEG 250, Netherlands). Samples were mounted on aluminum studs with double-sided adhesive tape and gold sputter-coated prior to analysis [6].
In vitro dissolution studies
In vitro dissolution studies utilised a USP Type II (model DS 8000, Lab India, Mumbai, India) paddle-type dissolution test apparatus. A 50 mg equivalent of dolutegravir solid dispersion was enclosed in a capsule and placed in 900 ml of pH 6.8 phosphate buffer. Aliquots were withdrawn periodically and replaced with fresh buffer to maintain sink conditions [5, 17]. The samples were filtered using 0.45 μm filter paper and analyzed using a UV-visible spectrophotometer (UV 1700, Shimadzu, Japan) at 260 nm.
Stability studies
Stability studies were conducted on the optimized Dolutegravir solid dispersion formulations F16, F20, and F24. These formulations were packed in High-density polyethylene (HDPE) bottles with child-resistant caps (CRC) and induction-sealed. These bottles are heat-resistant and food-grade approved bottles. Because of these reasons, these bottles are used for stability studies. The bottles were then subjected to accelerated stability conditions at 40 °C and 75% relative humidity [24]. The UV-visible spectrophotometer (UV 1700, Shimadzu, Japan) was used to periodically assess the samples for drug and assay percentage at three and six months.
Pharmacokinetic studies
6 w old and 2500g New Zealand white (NZW) rabbits were housed in a breeding room under strict environmental control. Three randomly generated groups of six rabbits each and equally divided [25]. Before the experiment, the animals were starved for a whole night. 50 mg/kg body weight was the single intragastric dose at which the samples were taken orally. The dosage was established by doing exploratory trials and according to the literature. Using a sterile capillary tube, 0.4 ml of blood plasma were drawn from the ocular veins before delivery and at 0.083, 0.25, 0.5, 0.75, 1, 2, 3, 4, 6, 8, 12, and 24 h after the injection. Every blood sample was immediately centrifuged at 13000 speed and continued for 15 min. After aspirating, the supernatants were kept at-80 °C for later examination. Plasma drug concentration at various time periods was determined by using the trapezoidal rule method. Pharmacokinetic parameters Cmax, T max, and AUC parameters are determined by Using the PK Solutions 2.0 pharmacokinetic software.
RESULTS
Standard calibration curve
The standard calibration curve for Dolutegravir in 0.1N HCl at 260 nm demonstrated a linear relationship between drug concentration and absorbance within the range of 10 to 50 μg/ml. The linear regression analysis of the calibration curve yielded the equation y = 0.0189x+0.0021, where y represents the absorbance and x represents the concentration in μg/ml. The correlation coefficient (R²) was found to be 0.9997, indicating an excellent fit [26] of the data points to the linear regression line (fig. 2) This high R² value suggests that 99.97% of the variability in the absorbance can be attributed to the variability in the concentration of Dolutegravir. The linearity of the calibration curve within the concentration range of 10 to 50 μg/ml demonstrates the reliability and accuracy of the UV spectrophotometric method for quantifying Dolutegravir in 0.1N HCl.
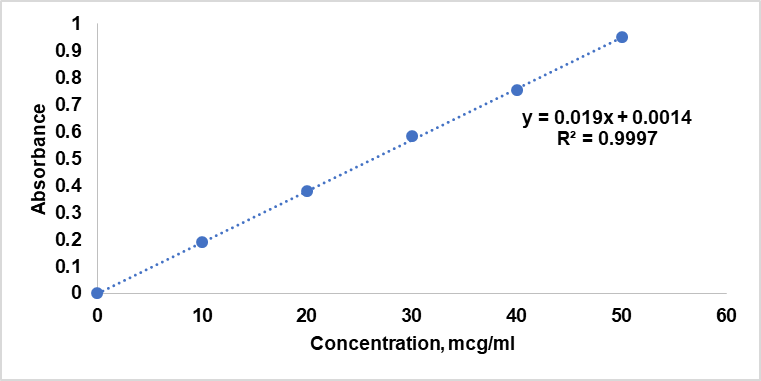
Fig. 2: Standard calibration curve
Phase solubility study
The phase solubility study was conducted to determine the best carrier for enhancing the solubility of dolutegravir (DTG). Various carriers including mannitol, PEG 4000, PVPK90, Poloxamer 188 and 407, Gelucire 44/14, Soluplus®, β-cyclodextrins (captisol), and HPMC E5 lV were evaluated [27, 28]. The results showed improved solubility (table 2) of DTG with certain carriers, particularly Soluplus® and captisol, and hence these were selected for further studies.
Table 2: Solubility (mg/ml) of dolutegravir with selected carriers at various concentrations
| Type of carrier | Carrier concentration* | ||
| 2% w/v | 5% w/v | 10% w/v | |
| Mannitol | 336.16±12 | 794.56±20 | 1359.92±21 |
| Polyvinyl pyrrolidine (PVPK90) | 290.32±15 | 641.76±19 | 1207.12±12 |
| Polyethylene Glycol (PEG 4000) | 488.96±10 | 855.68±08 | 1451.6±15 |
| Hydroxy Propyl Methylcellulose (HPMCE5LV) | 244.48±21 | 595.92±14 | 1100.16±19 |
| Soluplus® | 4889.6±20 | 5959.20±15 | 68760±14 |
| Gelucire 44/14 | 213.92±12 | 397.28±06 | 886.24±11 |
| Sulfobutylether-β-cyclodextrin (Captisol) | 2750.4±21 | 3361.6±19 | 4584±15 |
| Poloxamer 188 | 1451.6±12 | 2842.08±19 | 3972.8±21 |
| Poloxamer 407 | 1757.2±22 | 3132.4±15 | 4247.84±14 |
*Data are given as mean±SD, n =3
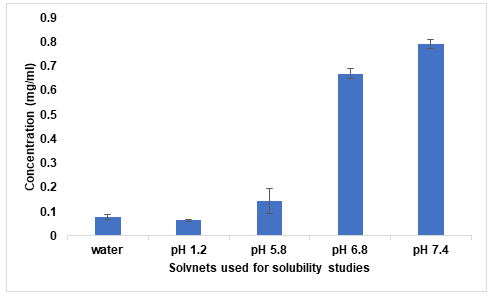
Fig. 3: Saturation solubility of dolutegravir
Saturation solubility study
The saturation solubility study demonstrated that DTG exhibits pH-dependent solubility. It was observed that solubility increased with increasing pH with very low solubility in pH 1.2 buffer. Solubility in distilled water was lower than in pH 5.8 buffer (fig. 3). This pH-dependent solubility profile is important for understanding the drug's behavior in different physiological environments and highlights the need for solubility enhancement strategies [29].
Drug content
All formulations show drug content values within the range of 97.6% to 100.2%, which is well within the typically accepted range of 90-110% for solid dispersions, as shown in table 3. The lowest drug content was observed in F5 (97.6%), while the highest was in F24 (100.2%). Formulations prepared by freeze-drying (F21-F24) and rota solvent evaporation (F16-F20) showed slightly higher drug content values, ranging from 99.2% to 100.2% [30, 31]. This could be attributed to the more controlled nature of these preparation techniques, which may result in less drug loss during the formulation process. Interestingly, even the formulations prepared by simpler methods like physical mixing (F1-F5), co-grinding (F6-F10), and kneading method (F11-F15) showed good drug content values, ranging from 97.6% to 99.5%.
Table 3: Results of drug content
| Formulation | Drug content (%)±SD | Formulation | Drug content (%)±SD |
| F1 | 98.5±0.31 | F13 | 99.3±0.27 |
| F2 | 97.8±0.46 | F14 | 98.6±0.34 |
| F3 | 99.2±0.25 | F15 | 99.7±0.13 |
| F4 | 98.9±0.35 | F16 | 99.9±0.15 |
| F5 | 97.6±0.58 | F17 | 99.5±0.27 |
| F6 | 99.5±0.22 | F18 | 99.2±0.22 |
| F7 | 98.7±0.39 | F19 | 99.8±0.14 |
| F8 | 99.1±0.27 | F20 | 100.1±0.16 |
| F9 | 98.3±0.46 | F21 | 99.4±0.28 |
| F10 | 99.4±0.22 | F22 | 99.6±0.22 |
| F11 | 99.8±0.12 | F23 | 99.9±0.15 |
| F12 | 98.9±0.38 | F24 | 100.2±0.13 |
Data are given as mean±SD, n =3
Thermogravimetric analysis (TGA)
The TGA results for pure Dolutegravir showed an onset of degradation at 280 °C, with a minimal weight loss of 2% up to 250 °C, followed by a major weight loss of 65% between 280 °C and 400 °C. Thermogram of pure drug spectra depicted in fig. 4. are In contrast, formulation F16, prepared by the rota evaporation method, exhibited an earlier onset of degradation at 245 °C, with a 4% weight loss up to 200 °C and a major weight loss of 75% between 245-380 °C. Formulation F20, also prepared by rota evaporation, showed a slightly lower onset of degradation at 240 °C, with a 4.5% weight loss up to 200 °C and a major weight loss of 78% between 240-375 °C. Lastly, formulation F24, prepared by the freeze-drying method, demonstrated the lowest onset of degradation at 235 °C, with a 5% weight loss up to 200 °C, and the highest major weight loss of 80% between 235 °C and 370 °C. The pure drug shows the highest thermal stability, with degradation starting at 280 °C. All solid dispersions (F16, F20, F24) show lower onset of degradation (245 °C, 240 °C, 235 °C respectively), indicating drug-carrier interactions. F24 shows the lowest onset of degradation and the highest total weight loss, suggesting the most intimate drug-carrier interaction. Initial weight loss (up to 200 °C) increases from pure drug (2%) to F24 (5%), indicating increased hygroscopicity in the solid dispersions [32].
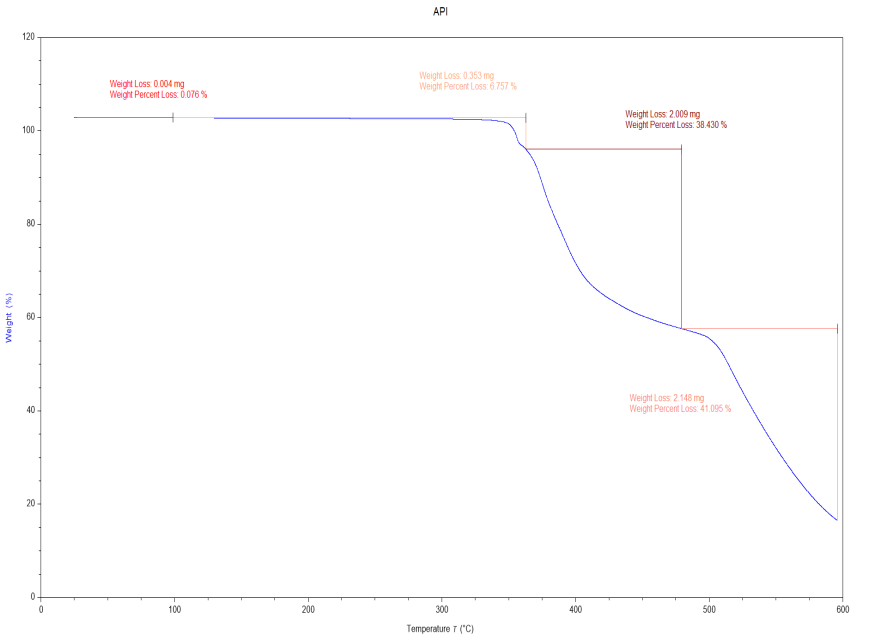
Fig. 4: Thermogram of pure drug
Differential scanning calorimetry (DSC)
The DSC thermogram of pure Dolutegravir (fig. 5a) revealed a sharp endothermic peak at 242 °C, corresponding to its melting point, with no significant peaks observed below 242 °C. Formulation F16 (fig. 5b) showed a broad endothermic peak at 141.8 °C attributed to water loss, a glass transition temperature (Tg) at 130 °C, and a small endothermic peak at 200 °C likely due to carrier melting, with notably no Dolutegravir melting peak present. Similarly, formulation F20 (fig. 5c) exhibited a broad endothermic peak at 164 °C for water loss, a slightly higher Tg at 140 °C. Formulation F24 (fig. 5d) displayed a broad endothermic peak at 150 °C for water loss, the highest Tg among the formulations at 165 °C, also lacking the characteristic Dolutegravir melting peak [33, 34].
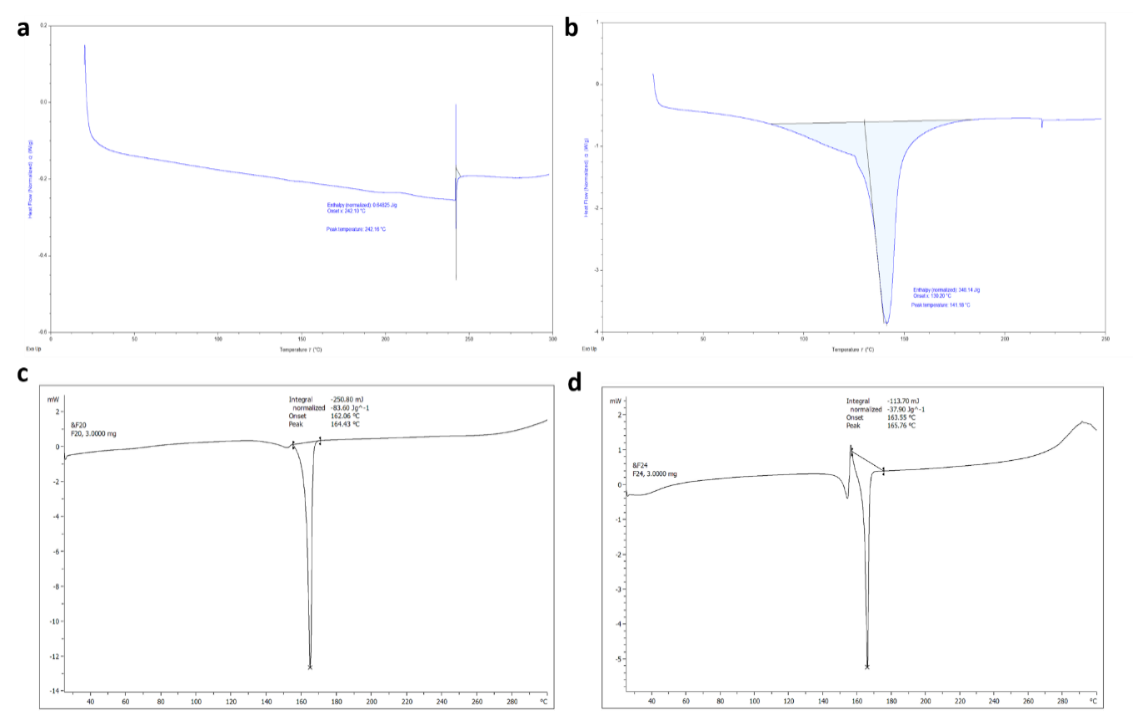
Fig. 5: DSC thermograms of a. Pure drug b. F16 c. F20 and d. F24
The pure drug exhibits a sharp melting peak at 242 °C, characteristic of its crystalline nature. All solid dispersions (F16, F20, F24) show the absence of the Dolutegravir melting peak, suggesting successful amorphization of the drug. The presence of a single Tg in each solid dispersion (130 °C, 140 °C, 165 °C respectively) further confirms the formation of a homogeneous amorphous system. The Tg increases slightly from F16 to F24, possibly indicating stronger drug-carrier interactions or higher polymer concentration in F24. The intensity of the carrier melting peak decreases from F16 to F24, suggesting more complete incorporation of the carrier into the amorphous matrix in F24.
FTIR analysis
The spectrum of pure Dolutegravir (fig. 6a) exhibited characteristic peaks at 3264 cm-1 (N-H stretching), 3057 cm-1 (aromatic C-H stretching), 1650 cm-1 (C=O stretching), 1542 cm-1 and 1507 cm-1 (C=C aromatic ring stretching), 1319 cm-1 (C-F stretching), and 1203 cm-1 (C-O stretching). A sharp peak at 3057 cm-1 was also observed, attributed to aliphatic C-H stretching. In formulation F16 (fig. 6b), prepared by the rota evaporation method, the N-H stretching peak shifted to 3259 cm-1 and broadened, while the C=O stretching peak moved to 1650 cm-1. New peaks appeared, likely due to the carrier, including a broad peak at 3400-3200 cm-1 (O-H stretching) and at 2353 cm-1 (C-H stretching). The intensity of Dolutegravir peaks decreased, indicating dilution in the carrier matrix [4].
Formulation F20 (fig. 6c), also prepared by rota evaporation, showed further alterations in the Dolutegravir peaks. The N-H stretching peak shifted to 3310 cm-1, and the C=O stretching to 1625 cm-1. Carrier peaks became more prominent, with a broader O-H stretching peak around 3400-3200 cm-1. The C-F stretching peak of Dolutegravir slightly shifted to 1375 cm-1. Some peaks appeared less distinct, suggesting increased drug-polymer interactions. The most significant changes were observed in formulation F24 (fig. 6d), prepared by freeze-drying. The N-H stretching peak of Dolutegravir shifted to 3300 cm-1 and became very broad. The C=O stretching moved to 1620 cm-1. Carrier peaks were highly prominent, with a very broad O-H stretching peak from 3400-3100 cm-1. The aromatic C=C stretching peaks of Dolutegravir (1580 cm-1 and 1510 cm-1) became less distinct and merged into a broader peak. The C-F stretching shifted to 1370 cm-1 [34, 41].
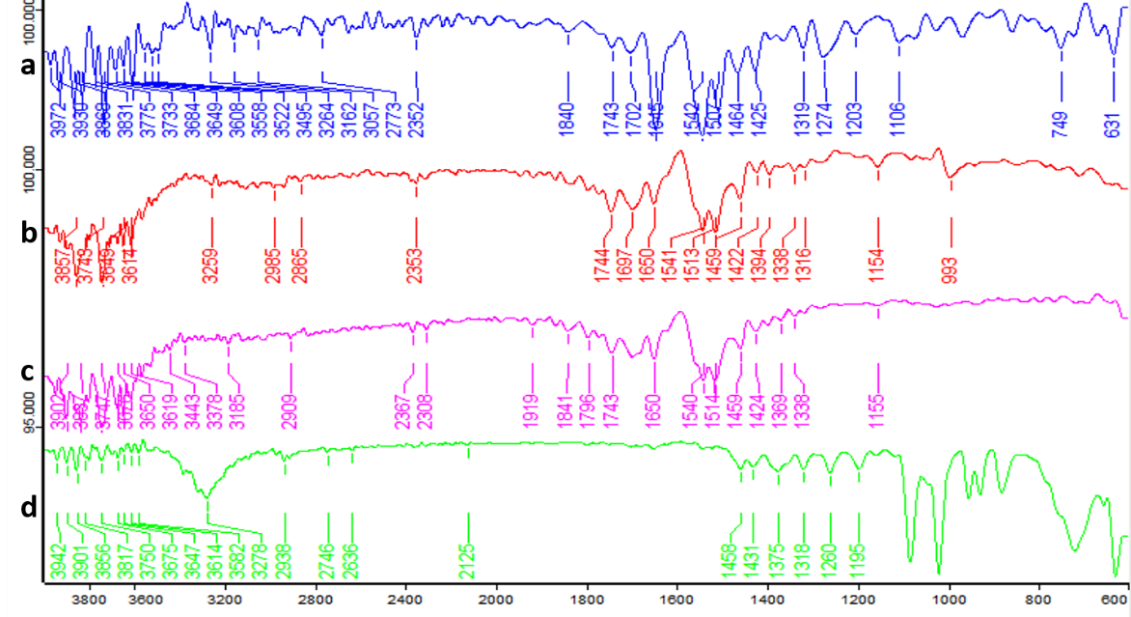
Fig. 6: FTIR spectrum of a. pure drug b. F16, c. F20, and d. F24
X-ray powder diffraction (XRPD)
The XRPD pattern of pure Dolutegravir exhibited sharp, intense peaks at approximately 2θ values of 9.5°, 14.8°, 18.2°, 21.6°, 25.3° and 28.1°, characteristic of its crystalline nature. These distinct peaks indicate a highly ordered crystal structure of the pure drug. In contrast, formulation F16 showed a significant reduction in peak intensity, with the major peaks at 12.5° and 19.6° becoming less pronounced and broader. Some crystalline character was still evident, suggesting incomplete amorphization. Formulation F20 demonstrated further reduction in peak intensities, with prominent peaks visible at 18.5° and 19.6°. The overall pattern showed a more prominent amorphous halo [35, 36], indicating a higher degree of amorphization compared to F16.
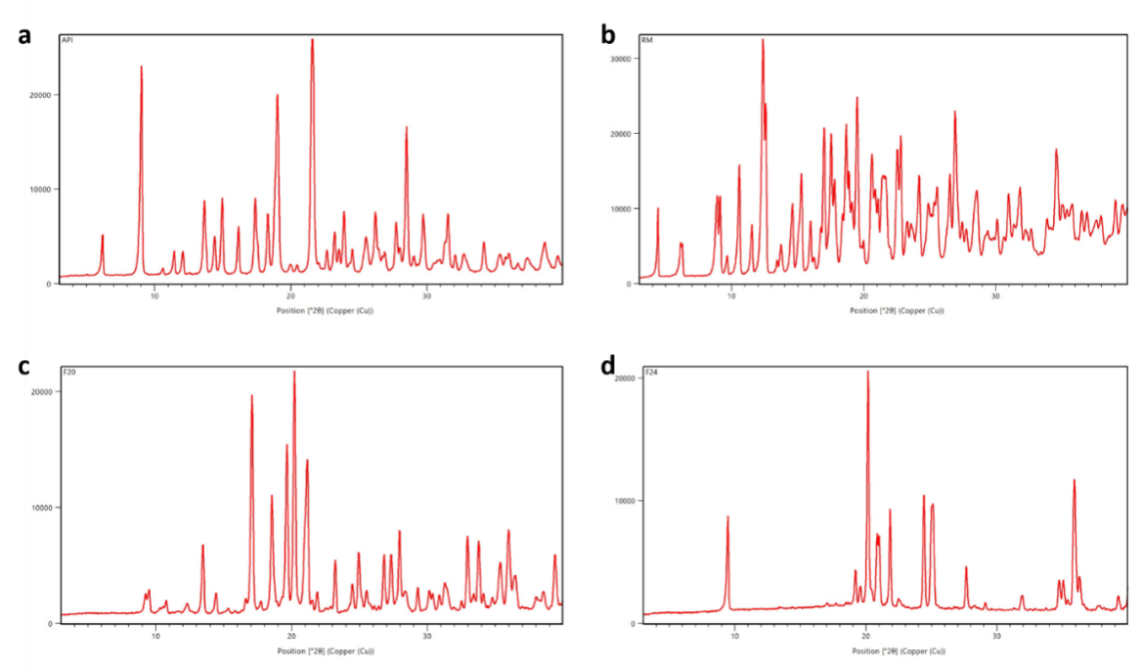
Fig. 7: XRPD pattern of a. pure dolutegravir b. F16 c. F20 and d. F24
Notably, the XRPD pattern of formulation F24 revealed a complete absence of sharp diffraction peaks. Instead, a broad, diffuse halo was observed in the 2θ range of 20-25°, characteristic of an amorphous material. This pattern strongly suggests the successful conversion of crystalline Dolutegravir to an amorphous state in F24. Optimised formulation spectra are represented in fig. 7.
Scanning electron microscopy (SEM)
SEM micrographs of pure Dolutegravir (fig. 8a) revealed irregularly shaped, crystalline particles with sharp edges and a rough surface texture. The particle size ranged from approximately 5-20 μm. In contrast, formulation F16 (fig. 8b) showed smaller, more rounded particles with less defined edges, ranging from 2-10 μm in size. The surface appeared smoother compared to the pure drug, indicating some degree of particle reformation during the rota evaporation process. Formulation F20 (fig. 8c) exhibited even smaller particles, predominantly in the range of 1-5 μm, with a more uniform, spherical shape. The surface texture appeared significantly smoother than both pure Dolutegravir and F16, suggesting more complete incorporation of the drug into the carrier matrix. Formulation F24 (fig. 8d), prepared by freeze-drying, showed a markedly different morphology. The particles appeared as thin, flaky structures with a highly porous surface. Individual particle boundaries were less distinct, forming a network-like structure. This unique morphology, characteristic of lyophilized products, presented a significantly larger surface area compared to the other formulations, which could explain its superior dissolution performance [37, 42]. In all solid dispersion formulations (F16, F20, and F24), the distinct crystalline features of pure Dolutegravir were no longer visible, supporting the XRPD results indicating amorphization.
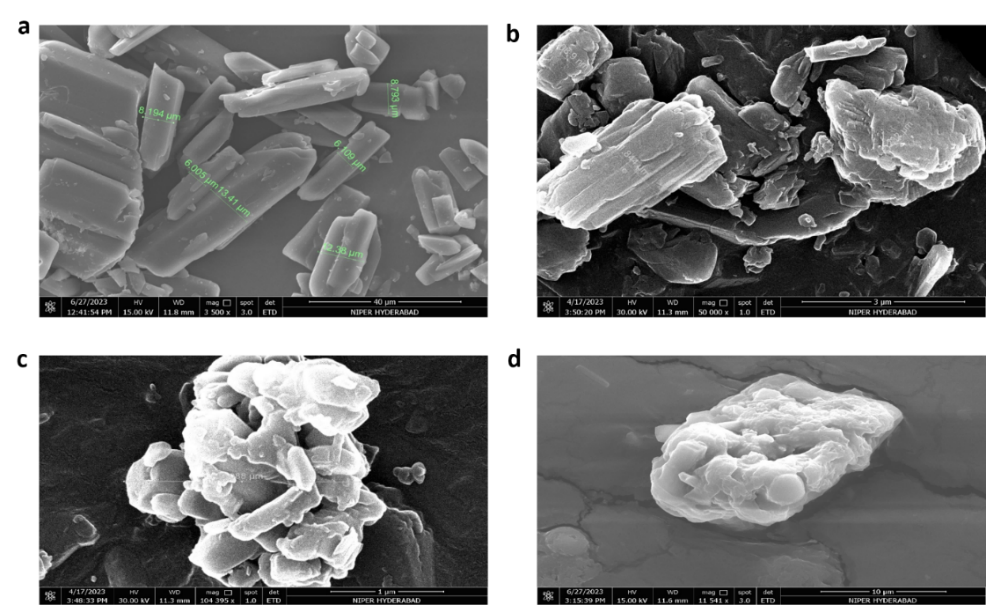
Fig. 8: SEM micrographs of a. Pure drug b. F16 c. F20 and d. F24
In vitro dissolution studies
The in vitro dissolution study of Dolutegravir solid dispersions revealed significant improvements in drug release compared to the pure drug. The pure drug exhibited a slow dissolution profile, with only 14.63% release after 120 min. Tables 4 to 9 describe the percentage of drug release at various time intervals. In contrast, the formulations showed varying degrees of enhancement in dissolution rate. Among the formulations, F24 demonstrated the most significant improvement, achieving 89.14% drug release at 120 min. This represents a six-fold increase compared to the pure drug. F24 also showed rapid initial dissolution, with 7.9% release within the first 5 min, compared to only 0.93% for the pure drug. The dissolution profile of F24 exhibited a steady increase throughout the study period, indicating sustained and enhanced drug release [17, 18]. Other notable formulations include F20 and F23, both achieving over 70% drug release at 120 min (77.14% and 70.53%, respectively). These formulations also showed rapid initial dissolution, with about 8% release in the first 5 min. F16 and F19 also performed well, with 71% and 70.53% release at 120 min, respectively. Interestingly, formulations F1 to F15 showed moderate improvements in dissolution rate compared to the pure drug, but their performance was considerably lower than the top-performing formulations. For instance, F15 achieved 65.52% release at 120 min, while F1 only reached 15.36% release (fig. 9a). The dissolution profiles of all formulations showed a general trend of rapid initial release followed by a more gradual increase over time. However, the extent and rate of release varied significantly among formulations. This variability could be attributed to differences in composition, preparation methods, or carrier ratios used in the solid dispersions. It is observed that formulations F16, F20, and F24 achieved over 50% drug release within 45-60 min, indicating their potential for rapid onset of action. The solid dispersions prepared by various methods showed marked improvements in dissolution rate compared to the pure drug. Among the preparation methods, freeze-drying (lyophilization) is found to be the most effective technique, followed by the rota solvent evaporation method, kneading method, co-grinding, and physical mixing. Formulations F21-F24 were prepared using the freeze-drying method, and they consistently showed the highest dissolution rates. F24 exhibited the best performance with 89.14% drug release at 120 min, followed by F22 (58.21%), F23 (70.53%), and F21 (49.78%). This method proved superior in enhancing the dissolution rate of Dolutegravir.
Table 4: In vitro dissolution data by using the physical mixing method
| Time in min | Pure drug | F1 | F2 | F3 | F4 |
| 5 | 0.93±1.32 | 1.6±1.20 | 2±0.14 | 2.5±1.08 | 2.6±1.88 |
| 10 | 1.64±1.78 | 3.99±1.87 | 4.53±0.25 | 6.54±1.08 | 5.95±1.40 |
| 15 | 1.98±0.15 | 6.98±0.64 | 7.72±2.01 | 8.76±1.22 | 8.97±2.04 |
| 20 | 2.78±2.07 | 7.59±0.33 | 9.24±1.28 | 11.98±1.66 | 13.82±1.69 |
| 25 | 3.61±1.07 | 7.99±1.96 | 12.21±0.61 | 13.63±2.05 | 15.94±1.08 |
| 30 | 4.01±1.88 | 8.82±1.14 | 13.12±1.81 | 15.97±1.81 | 17.91±2.04 |
| 45 | 5.12±1.64 | 9.91±1.01 | 15.78±0.34 | 13.94±1.11 | 20.67±0.48 |
| 50 | 6.79±0.42 | 9.64±1.56 | 16.09±2.14 | 16.83±1.77 | 20.73±0.23 |
| 60 | 8.12±1.35 | 12.34±1.32 | 17.53±1.55 | 18.45±1.03 | 21.86±1.26 |
| 120 | 13.63±1.04 | 15.36±1.05 | 18.32±0.19 | 22.01±1.81 | 24.27±1.09 |
Data are given as mean±SD, n =3
Table 5: In vitro dissolution data by using the co-grinding method
| Time in min | Pure drug | F5 | F6 | F7 | F8 |
| 5 | 0.93±1.17 | 1.06±1.01 | 2.3±1.78 | 2.42±0.25 | 3.57±1.08 |
| 10 | 1.64±1.78 | 2.34±1.14 | 3.62±0.15 | 4.97±0.86 | 4.79±1.69 |
| 15 | 1.98±0.15 | 5.01±1.96 | 6.62±1.88 | 7.71±1.03 | 9.73±2.04 |
| 20 | 2.78±2.07 | 6.38±0.33 | 7.92±1.64 | 9.91±1.66 | 11.91±0.48 |
| 25 | 3.61±1.07 | 7.49±1.64 | 8.34±1.96 | 11.09±2.05 | 13.99±0.23 |
| 30 | 4.01±1.88 | 7.99±1.20 | 8.96±1.14 | 13.5±1.81 | 15.89±1.26 |
| 45 | 6.12±1.64 | 8.96±1.78 | 10.56±1.01 | 16.59±1.11 | 18.69±1.09 |
| 50 | 6.79±1.01 | 10.24±1.36 | 11.93±0.33 | 17.82±1.64 | 19.92±1.81 |
| 60 | 8.12±1.14 | 13.23±0.24 | 15.02±1.20 | 20.15±1.82 | 22.69±1.11 |
| 120 | 14.63±1.96 | 19.68±1.17 | 20.89±1.64 | 23.63±1.04 | 26.86±1.66 |
Data are given as mean±SD, n =3
Table 6: In vitro dissolution data by using the kneading method
| Time in min | Pure drug | F9 | F10 | F11 | F12 |
| 5 | 0.73±1.34 | 2.9±1.62 | 4.2±1.47 | 6.4±1.12 | 7.8±1.37 |
| 10 | 1.04±1.09 | 5.16±1.27 | 7.34±1.81 | 8.62±0.28 | 9.89±1.91 |
| 15 | 1.98±0.15 | 7.2±1.72 | 10.67±0.61 | 11.98±1.81 | 12.2±0.52 |
| 20 | 2.48±1.03 | 11.76±1.26 | 13.99±0.82 | 14.9±1.46 | 16.1±0.71 |
| 25 | 3.61±1.79 | 13.54±0.14 | 15.84±1.26 | 17.56±0.38 | 18.9±0.82 |
| 30 | 3.82±0.36 | 15.38±0.29 | 17.97±1.62 | 18.45±1.13 | 20.64±0.70 |
| 45 | 5.12±1.42 | 17.94±1.56 | 19.31±0.67 | 23.79±1.31 | 25.42±1.22 |
| 50 | 6.79±1.06 | 18.02±0.63 | 19.79±0.71 | 24.81±0.93 | 25.93±0.84 |
| 60 | 8.12±0.56 | 19.89±1.12 | 22.84±1.34 | 26.53±0.78 | 28.12±0.83 |
| 120 | 13.63±0.72 | 24.02±0.64 | 27.83±1.53 | 30.75±0.21 | 35.12±0.07 |
*Data are given as mean±SD, n =3
Pharmacokinetic studies
The plasma concentration of dolutegravir was determined at each time point for the three rabbits, and the mean concentration was calculated. The results showed a rapid absorption of dolutegravir, with peak plasma concentrations (Cmax) observed at 2 h post-administration for all formulations tested (API, marketed formulation, and F24). Peak plasma concentration vs time profile responses are represented in fig. 10. The solid dispersion formulation demonstrated superior pharmacokinetic properties compared to both the API and the marketed formulation, depicted in fig. 10. At 2 h post-administration, the mean plasma concentration for the F24 was 3236.71±461.42 ng/ml, compared to 1457.42±221.54 ng/ml for Dolutegravir and 2465.85 ±456.23 ng/ml for the marketed formulation [38].
Table 7: In vitro dissolution data by using the Rota solvent evaporation method
| Time in min | Pure drug | F13 | F14 | F15 | F16 |
| 5 | 0.93±1.12 | 2.67±1.35 | 3.83±0.69 | 4.2±0.80 | 7.8±0.01 |
| 10 | 1.64±1.13 | 2.78±1.24 | 4.67±1.36 | 6.91±1.47 | 12.99±1.82 |
| 15 | 1.98±0.91 | 7.62±0.83 | 7.83±0.72 | 9.29±1.64 | 19.2±1.52 |
| 20 | 2.78±1.31 | 9.53±1.42 | 11.56±0.56 | 14.89±0.93 | 26.53±0.85 |
| 25 | 3.61±0.76 | 11.39±0.62 | 14.29±0.54 | 19.67±1.49 | 38.2±1.82 |
| 30 | 4.01±1.18 | 14.58±1.04 | 17.82±0.59 | 26.9±0.62 | 44.62±0.58 |
| 45 | 6.12±1.38 | 19.63±1.11 | 22.48±1.26 | 35.8±1.37 | 56.8±1.63 |
| 50 | 6.79±1.02 | 22.51±1.58 | 26.7±1.39 | 39.92±0.27 | 59.9±1.48 |
| 60 | 8.12±0.27 | 26.28±1.48 | 32.89±1.31 | 48.93±1.62 | 62.12±0.83 |
| 120 | 14.63±0.42 | 29.01±1.39 | 42.58±1.41 | 65.52±1.19 | 71±1.03 |
Data are given as mean±SD, n =3
Table 8: In vitro dissolution data by using the Lyophilization method
| Time in min | Pure drug | F17 | F18 | F19 | F20 |
| 5 | 0.93±1.20 | 2.02±1.80 | 2.32±1.80 | 4.92±1.71 | 7.9±1.80 |
| 10 | 1.64±1.87 | 4.41±1.40 | 9.34±1.96 | 9.79±1.87 | 16.99±1.96 |
| 15 | 1.98±0.64 | 8.69±2.23 | 11.63±2.40 | 14.85±0.51 | 25.2±2.40 |
| 20 | 2.78±0.33 | 11.56±0.56 | 13.73±1.48 | 19.93±2.70 | 32.85±0.84 |
| 25 | 3.61±1.96 | 14.83±0.13 | 19.2±1.23 | 21.65±1.78 | 38.69±0.32 |
| 30 | 4.01±1.14 | 16.23±1.24 | 18.31±1.62 | 25.45±1.78 | 44.91±1.62 |
| 45 | 6.12±1.46 | 26.42±1.47 | 28.86±1.90 | 38.89±2.72 | 56.83±1.90 |
| 50 | 6.79±1.18 | 29.08±1.90 | 32.31±1.14 | 44.23±1.46 | 61.24±1.32 |
| 60 | 8.12±1.70 | 37.67±1.62 | 44.45±1.43 | 52.43±1.80 | 66.41±1.18 |
| 120 | 14.63±2.70 | 49.78±1.96 | 58.21±1.26 | 70.53±1.75 | 77.14±1.63 |
*Data are given as mean±SD, n =3
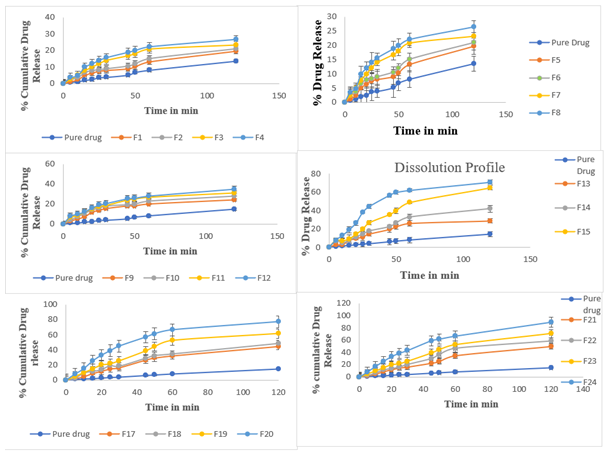
Fig. 9: In vitro drug release profile of formulations in comparison with pure drug a. F1-F4, b. F5-F8, c. F9-F12, d. F13-F16, e. F17 to F20, f. F21 to F24, Data are given as mean±SD, n =3
Table 9: In vitro dissolution data of Soluplus® based solid dispersions by using Lyophilization method
| Time in min | Pure drug | F21 | F22 | F23 | F24 |
| 5 | 0.93±1.09 | 2.02±1.22 | 2.32±0.23 | 4.92±2.31 | 7.9±1.69 |
| 10 | 1.64±1.11 | 4.41±0.85 | 6.34±2.05 | 9.79±0.61 | 16.99±0.86 |
| 15 | 1.98±1.77 | 8.69±0.34 | 11.63±0.31 | 14.85±0.33 | 25.2±1.40 |
| 20 | 2.78±1.04 | 11.56±1.14 | 13.73±0.47 | 19.93±2.07 | 32.85±1.55 |
| 25 | 3.61±2.14 | 14.83±1.88 | 16.2±1.81 | 21.65±2.04 | 38.69±2.01 |
| 30 | 4.01±1.01 | 16.23±0.23 | 20.31±1.96 | 25.45±1.03 | 42.91±1.87 |
| 45 | 6.12±1.64 | 22.42±2.05 | 29.86±1.07 | 38.89±2.11 | 58.95±1.78 |
| 50 | 6.79±1.26 | 25.08±0.31 | 36.31±0.48 | 44.23±0.19 | 61.46±1.08 |
| 60 | 8.12±1.81 | 34.67±0.47 | 46.45±1.66 | 52.43±1.28 | 66.41±1.88 |
| 120 | 14.63±1.22 | 49.78±1.81 | 58.21±0.65 | 70.53±0.64 | 89.14±1.17 |
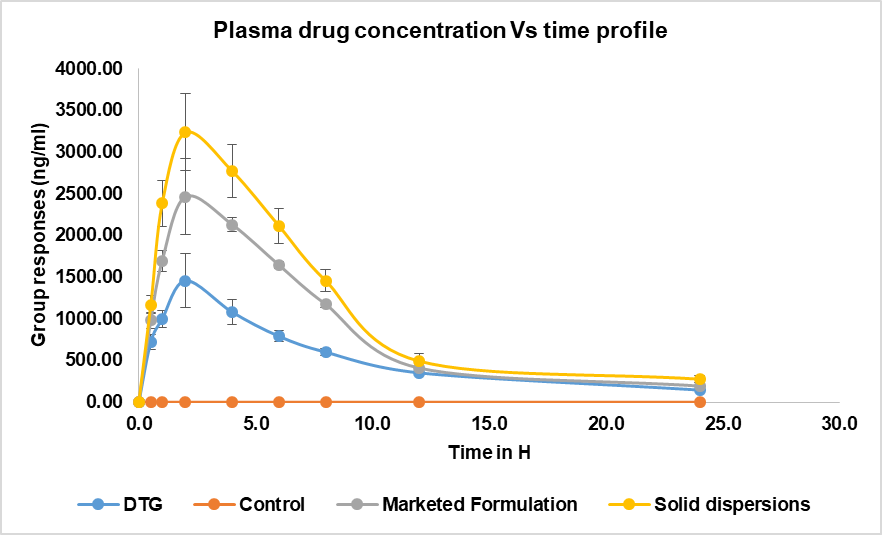
Fig. 10: Comparison of mean plasma concentrations of pure drug, control, marketed formulation versus optimized formulation (F24)
Table 10: Results of stability studies
| % Cumulative drug release | ||||||||||
| F16 | F20 | F24 | ||||||||
Time (in min) |
Pure drug | Initial | 3 Mo | 6 Mo | Initial | 3 Mo | 6 Mo | Initial | 3 Mo | 6 Mo |
| 0 | 0±0 | 0±0 | 0±0 | 0±0 | 0 | 0 | 0 | 0±0 | 0±0 | 0±0 |
| 5 | 0.93±1.09 | 7.8±0.01 | 7.3±1.32 | 6.89±1.64 | 7.9±1.80 | 6.92±1.71 | 5.78±1.80 | 7.9±1.69 | 6.92±1.09 | 5.78±1.32 |
| 10 | 1.64±1.11 | 12.99±1.82 | 11.9±1.64 | 10.99±1.54 | 16.99±1.96 | 15.58±1.87 | 13.67±1.9 | 16.99±0.8 | 15.58±1.1 | 13.67±1.6 |
| 15 | 1.98±1.77 | 19.2±1.52 | 19.1±1.54 | 18.06±1.11 | 25.2±2.40 | 24.84±0.51 | 23.58±2.40 | 25.2±1.40 | 24.84±1.77 | 23.58±1.54 |
| 20 | 2.78±1.04 | 26.53±0.85 | 26.23±1.23 | 25.89±1.7 | 32.85±0.84 | 31.53±2.70 | 29.42±1.48 | 32.85±1.5 | 31.53±1.0 | 29.42±1.2 |
| 25 | 3.61±2.14 | 38.2±1.82 | 37.82±1.1 | 36.34±1.04 | 38.69±0.32 | 37.44±1.78 | 35.38±1.23 | 38.69±2.0 | 37.44±1.5 | 35.38±1.1 |
| 30 | 4.01±1.01 | 44.62±0.58 | 42.65±1.9 | 40.45±1.01 | 44.91±1.62 | 42.82±2.72 | 41.9±1.62 | 42.91±1.8 | 42.82±1.6 | 41.9±1.9 |
| 45 | 6.12±1.64 | 56.8±1.63 | 55.33±1.7 | 53.78±1.64 | 56.83±1.90 | 54.99±1.46 | 52.68±1.90 | 58.95±1.7 | 54.99±1.0 | 52.68±1.7 |
| 50 | 6.79±1.26 | 59.9±1.48 | 60.4±1.1 | 59.26±1.81 | 61.24±1.32 | 56.42±1.80 | 54.95±1.14 | 61.46±1.0 | 56.42±1.5 | 54.95±1.1 |
| 60 | 8.12±1.81 | 62.12±0.83 | 65.11±1.56 | 64.31±1.22 | 66.41±1.18 | 64.89±1.75 | 63.83±1.43 | 66.41±1.8 | 64.89±1.3 | 63.83±1.5 |
| 120 | 14.63±1.22 | 71±1.03 | 70.3±1.86 | 69.34±1.4 | 77.14±1.63 | 75.42±3.75 | 73.99±1.26 | 89.14±1.1 | 88.42±1.5 | 87.99±1.8 |
Data are given as mean±SD, n =3
The solid dispersion maintained higher plasma concentrations throughout the 24 h period, indicating improved bioavailability. These results suggest that the solid dispersion formulation significantly enhanced the oral bioavailability of dolutegravir compared to both the pure API and the marketed formulation. This improvement can be attributed to the increased solubility and dissolution rate of dolutegravir in the solid dispersion form, leading to enhanced absorption and higher plasma concentrations over an extended period. This improvement can reduce the dose strength, improve tolerability, and have fewer side effects.
Stability studies
The physical evaluation results of the optimized formulations are presented in table 10. Throughout the 6-month study period, the colour of the solid dispersions remained consistent, appearing whitish to pale yellow at all time points [39]. This consistency in appearance suggests that the formulations exhibit good physical stability under the tested conditions. Assay results showed minimal degradation throughout the study. The initial assay value was 99.12%. After 3 mo of storage at accelerated conditions, the assay value decreased slightly to 99.02%, indicating a minimal loss of 0.02%. At the 6-month time point, the assay value was 98.55%, representing a 0.57% decrease from the initial value. These results demonstrate the good chemical stability of dolutegravir in the solid dispersion formulations, with only minor degradation observed over a 6 mo period under accelerated conditions.
DISCUSSION
The results collectively demonstrate that the solid dispersion approach, particularly using the lyophilization method with Soluplus® as the carrier, significantly enhanced the solubility and dissolution rate of DTG [29, 40, 41]. The superior performance of lyophilization, as evidenced in formulation F24, can be attributed to its ability to rapidly solidify the drug-carrier solution, trapping the drug in a high-energy amorphous state and creating a highly porous structure that facilitates rapid dissolution. This is supported by the SEM results, which showed a unique flaky, network-like structure with high porosity for F24, in contrast to the more compact particles observed in F16 and F20. The pH-dependent solubility of DTG highlights the challenges in its oral delivery, especially in the acidic environment of the stomach. The solid dispersion approach effectively addresses this issue by improving solubility across different pH conditions. For instance, the solubility of pure DTG increased from approximately 0.1 mg/ml at pH 1.2 to 0.3 mg/ml at pH 6.8, while F24 showed a remarkable increase from 0.8 mg/ml at pH 1.2 to 2.5 mg/ml at pH 6.8, representing an 8-fold and 8.3-fold increase, respectively.
The characterization studies (DSC, XRPD, FTIR, and SEM) collectively support the hypothesis that the enhanced dissolution is due to the conversion of crystalline DTG to an amorphous state, reduction in particle size, improved wettability, and possibly molecular-level interactions with the hydrophilic carriers [7]. The DSC results showed the disappearance of the sharp DTG melting peak at 330 °C in all formulations, with F24 exhibiting the highest glass transition temperature (Tg) of 145 °C, indicating the most stable amorphous form. XRPD patterns confirmed this amorphization, with F24 showing a complete absence of crystalline peaks and a characteristic amorphous halo in the 2θ range of 10-30°. FTIR spectroscopy revealed significant peak shifts, such as the N-H stretching moving from 3340 cm-1 in pure DTG to 3300 cm-1 in F24, suggesting strong hydrogen bonding between the drug and carrier.
The study demonstrates that Soluplus®, a third-generation solid dispersion carrier, outperforms the second-generation carrier Captisol (β-cyclodextrin derivative). This can be attributed to the amphiphilic structure of Soluplus® that provides both solubilization and stabilization effects. The superior performance is evident in the dissolution profiles, where F24 (containing Soluplus®) achieved 89% drug release within 120 min, compared to 75% for F20 and 71% for F16 (containing Captisol) in the same timeframe [14, 15]. Furthermore, the TGA results support the enhanced stability of the Soluplus®-based formulation, with F24 showing a slightly lower onset of degradation (235 °C) compared to F16 (245 °C) and F20 (240 °C), but exhibiting the highest total weight loss (80%) between 235-370 °C, indicating more complete incorporation of the drug into the carrier matrix. This is consistent with the FTIR results, which showed the most significant peak shifts and broadening for F24, suggesting the strongest drug-carrier interactions [13, 34].
CONCLUSION
This study successfully enhanced dolutegravir's solubility and dissolution rate by developing solid dispersions using Soluplus® and Captisol as carriers. Among the various preparation methods evaluated, lyophilization proved the most effective, significantly improving the drug's dissolution profile. The optimized formulation with Soluplus® achieved remarkably increased drug release, from 14.63% for pure dolutegravir to 89.14% after 2 h. Characterization studies confirmed the conversion of crystalline dolutegravir to an amorphous state, explaining the observed solubility enhancement. These findings suggest that the developed solid dispersion formulation can potentially improve the bioavailability and therapeutic efficacy of dolutegravir in HIV treatment. HIV replication is suppressed by antiretroviral therapy (ART). The limitations of modern antiretroviral therapy necessitate lifetime medication compliance, as HIV cannot be cured. Drug resistance can gradually develop along with side effects. Scientists are developing vaccinations and other therapies that may be able to eradicate HIV. Further future designing experiments will be attempted by combining drugs and various antiretrovirals that prevent the virus from killing the immune system.
ETHICS APPROVAL
Healthy male New Zealand White rabbits were used in the study, with license number 1250/PO/RcBi/S/21/CPCSEA.
ACKNOWLEDGMENT
The authors acknowledge the Joginpally B. R. Pharmacy College, Hyderabad, for providing the facilities and support that enabled them to complete this research work.
FUNDING
None to declare
AUTHORS CONTRIBUTIONS
Gottemukkula Lakshmi Devi designed the experiment and developed the formulations, and Sujatha Dodoala analyzed the results. Sunita Sampathi and Vijaya Kuchana reviewed the manuscript and gave valuable suggestions to complete this research work.
CONFLICT OF INTERESTS
The authors declare that they have no conflict of interest.
REFERENCES
De Clercq E, Li G. Approved antiviral drugs over the past 50 Y. Clin Microbiol Rev. 2016;29(3):695-747. doi: 10.1128/CMR.00102-15, PMID 27281742.
Castellino S, Moss L, Wagner D, Borland J, Song I, Chen S. Metabolism excretion and mass balance of the HIV-1 integrase inhibitor dolutegravir in humans. Antimicrob Agents Chemother. 2013 Aug;57(8):3536-46. doi: 10.1128/AAC.00292-13, PMID 23669385.
Rathbun RC, Lockhart SM, Miller MM, Liedtke MD. Dolutegravir a second-generation integrase inhibitor for the treatment of HIV-1 infection. Ann Pharmacother. 2014 Mar;48(3):395-403. doi: 10.1177/1060028013513558, PMID 24259658.
Bhairam M, Pandey RK, Shukla SS, Gidwani B. Preparation optimization and evaluation of dolutegravir nanosuspension: in vitro and in vivo characterization. J Pharm Innov. 2023 Jul 27;18(4):1798-811. doi: 10.1007/s12247-023-09756-z.
Baird JA, Taylor LS. Evaluation of amorphous solid dispersion properties using thermal analysis techniques. Adv Drug Deliv Rev. 2012;64(5):396-421. doi: 10.1016/j.addr.2011.07.009, PMID 21843564.
Betageri G. Enhancement of dissolution of glyburide by solid dispersion and lyophilization techniques. Int J Pharm. 1995;126(1-2):155-60. doi: 10.1016/0378-5173(95)04114-1.
Kaur J, Aggarwal G, Singh G, Rana AC. Improvement of drug solubility using solid dispersion. Int J Pharm Pharm Sci. 2012;4(2):47-53.
Luhadiya A, Jain P, Dubey PK. A review on solid dispersion. Int J Adv Res Pharm Biosci. 2012;1(3):202-13.
Liu P, Zhou JY, Chang JH, Liu XG, Xue HF, Wang RX. Soluplus-mediated diosgenin amorphous solid dispersion with high solubility and high stability: development characterization and oral bioavailability. Drug Des Devel Ther. 2020 Jul;14:2959-75. doi: 10.2147/DDDT.S253405, PMID 32801637.
Kfoury M, Pipkin JD, Antle V, Fourmentin S. Captisol®: an efficient carrier and solubilizing agent for essential oils and their components. Flavour Fragr J. 2017 Sep;32(5):340-6. doi: 10.1002/ffj.3395.
Rathod SM, Patel NC, Patel PU. Simultaneous determination of emtricitabine tenofovir alafenamide fumarate and dolutegravir sodium by validated stability-indicating RP-HPLC-DAD method. Ann Pharm Fr. 2023 Jan;81(1):94-106. doi: 10.1016/j.pharma.2022.08.006, PMID 36037931.
Bhardwaj SK, Dwivedia K, Agarwala DD. A review: HPLC method development and validation. Int J Anal Bioanal Chem. 2015;5(4):76-81.
Beig A, Agbaria R, Dahan A. The use of captisol (SBE7-β-CD) in oral solubility-enabling formulations: comparison to HPβCD and the solubility–permeability interplay. Eur J Pharm Sci. 2015;77:73-8. doi: 10.1016/j.ejps.2015.05.024, PMID 26006306.
Mir KB, Khan NA. Solid dispersion: overview of the technology. Int J Pharm Sci Res. 2017;8(6):2378-87.
Mishra DK, Dhote V, Bhargava A, Jain DK, Mishra PK. Amorphous solid dispersion technique for improved drug delivery: basics to clinical applications. Drug Deliv Transl Res. 2015 Dec;5(6):552-65. doi: 10.1007/s13346-015-0256-9, PMID 26306524.
Rouchotas C, Cassidy OE, Rowley G. Comparison of surface modification and solid dispersion techniques for drug dissolution. Int J Pharm. 2000;195(1-2):1-6. doi: 10.1016/S0378-5173(99)00350-6, PMID 10675674.
Sinha S, Baboota S, Ali M, Kumar A, Ali J. Solid dispersion: an alternative technique for bioavailability enhancement of poorly soluble drugs. J Dispers Sci Technol. 2009 Nov 4;30(10):1458-73. doi: 10.1080/01932690903120136.
Singh S, Baghel RS, Yadav L. A review on solid dispersion. Int J Pharm Life Sci. 2011;2(9):1078–95.
Younis MA. Solid dispersion technology a contemporary overview on a well established technique. UJPR. 2017;2(3):15-9. doi: 10.22270/ujpr.v2i3.RW1.
Das SK, Kahali N, Bose A, Khanam J. Physicochemical characterization and in vitro dissolution performance of ibuprofen-Captisol® (sulfobutylether sodium salt of β-CD) inclusion complexes. J Mol Liq. 2018;261:239-49. doi: 10.1016/j.molliq.2018.04.007.
Fukuda M, Miller DA, Peppas NA, McGinity JW. Influence of sulfobutyl ether β-cyclodextrin (Captisol®) on the dissolution properties of a poorly soluble drug from extrudates prepared by hot-melt extrusion. Int J Pharm. 2008;350(1-2):188-96. doi: 10.1016/j.ijpharm.2007.08.038, PMID 17920217.
Faix O. Practical uses of FTIR spectroscopy in wood science and technology. Mikrochim Acta. 1988;94(1-6):21-5. doi: 10.1007/BF01205830.
Chauhan A. Powder XRD technique and its applications in science and technology. J Anal Bioanal Tech. 2014;5(6):1-5. doi: 10.4172/2155-9872.1000212.
Alshahrani SM, Lu W, Park JB, Morott JT, Alsulays BB, Majumdar S. Stability-enhanced hot-melt extruded amorphous solid dispersions via combinations of Soluplus® and HPMCAS-HF. AAPS PharmSciTech. 2015 Aug;16(4):824-34. doi: 10.1208/s12249-014-0269-6, PMID 25567525.
Buxton IL. Pharmacokinetics and pharmacodynamics: the dynamics of drug absorption distribution action and elimination. In: Goodman and Gilman’s: the pharmacological basis of therapeutics. 11th ed. New York: McGraw-Hill; 2006.
Breaux J, Jones K, Boulas P. Analytical methods development and validation. Pharm Technol. 2003;1:6-13.
Arora A, Aggarwal G, Singh TG, Singh M, Arora G, Nagpal M. Inclusion complexes of atorvastatin calcium–sulfobutyl ether β cyclodextrin with enhanced hypolipidemic activity. JAPS. 2019;9(11):60-8. doi: 10.7324/JAPS.2019.91108.
Zi P, Zhang C, Ju C, Su Z, Bao Y, Gao J. Solubility and bioavailability enhancement study of lopinavir solid dispersion matrixed with a polymeric surfactant soluplus. Eur J Pharm Sci. 2019;134:233-45. doi: 10.1016/j.ejps.2019.04.022, PMID 31028820.
Hughey JR, Keen JM, Miller DA, Kolter K, Langley N, McGinity JW. The use of inorganic salts to improve the dissolution characteristics of tablets containing soluplus®-based solid dispersions. Eur J Pharm Sci. 2013;48(4-5):758-66. doi: 10.1016/j.ejps.2013.01.004, PMID 23348153.
Fule RA, Meer TS, Sav AR, Amin PD. Artemether-soluplus hot-melt extrudate solid dispersion systems for solubility and dissolution rate enhancement with amorphous state characteristics. J Pharm (Cairo). 2013;2013:151432. doi: 10.1155/2013/151432, PMID 26555968.
Djuris J, Nikolakakis I, Ibric S, Djuric Z, Kachrimanis K. Preparation of carbamazepine-soluplus solid dispersions by hot-melt extrusion and prediction of drug-polymer miscibility by thermodynamic model fitting. Eur J Pharm Biopharm. 2013;84(1):228-37. doi: 10.1016/j.ejpb.2012.12.018, PMID 23333900.
Davis MT, Potter CB, Mohammadpour M, Albadarin AB, Walker GM. Design of spray dried ternary solid dispersions comprising itraconazole soluplus and HPMCP: effect of constituent compositions. Int J Pharm. 2017;519(1-2):365-72. doi: 10.1016/j.ijpharm.2017.01.043, PMID 28131850.
Guleli M, Issever S, Caliskan C, Ozbek M. Determination of the amount of simethicone in different drug formulations by the gravimetric method and comparison with the ftir method by chemometric methods. Asian J Pharm Anal. 2021;11(1):17-21. doi: 10.5958/2231-5675.2021.00003.X.
Chadha R, Bhandari S. Drug–excipient compatibility screening role of thermoanalytical and spectroscopic techniques. J Pharm Biomed Anal. 2014;87:82-97. doi: 10.1016/j.jpba.2013.06.016, PMID 23845418.
Kulkarni JA, Avachat AM, Avachat CM, Pradhan R, Suryawanshi TS, Khan EM. Preferential formulation of second generation antipsychotic asenapine as inclusion complex with sulphobutylether-βCD (Captisol): in vitro and in vivo evaluation. Curr Drug Deliv. 2018;15(4):520-31. doi: 10.2174/1567201814666171120121217, PMID 29165075.
Kulkarni AD, Belgamwar VS. Inclusion complex of chrysin with sulfobutyl ether-β-cyclodextrin (Captisol®): preparation characterization molecular modelling and in vitro anticancer activity. J Mol Struct. 2017;1128:563-71. doi: 10.1016/j.molstruc.2016.09.025.
Hajare AA, More HN, Walekar PS, Hajare DA. Optimization of freeze drying cycle protocol using real time microscopy and integrated differential thermal analysis-electrical impedance. Res J Pharm Technol. 2012;5(7):985-91.
Debnath S, Kumar TH. An overview on pharmacokinetics and pharmacokinetic modeling. Asian J Res Pharm Sci. 2020;10(2):124. doi: 10.5958/2231-5659.2020.00023.5.
Fonte P, Soares S, Costa A, Andrade JC, Seabra V, Reis S. Effect of cryoprotectants on the porosity and stability of insulin-loaded PLGA nanoparticles after freeze-drying. Biomatter. 2012;2(4):329-39. doi: 10.4161/biom.23246, PMID 23507897.
Lian X, Dong J, Zhang J, Teng Y, Lin Q, Fu Y. Soluplus(®) based 9-nitrocamptothecin solid dispersion for peroral administration: preparation characterization in vitro and in vivo evaluation. Int J Pharm. 2014;477(1-2):399-407. doi: 10.1016/j.ijpharm.2014.10.055, PMID 25445521.
Iyan S, Muhammad R, Soraya R, Meywan H. Increasing solution in the drug simvastatin with solid dispersion technique using polymer soluplus. IJPPS. 2023,15(4):161-5. doi: 10.22159/ijap.2023v15i4.48293.
Ruba M, Suleiman A, Jumana T. Unlocking the potential: enhancing solubility and bioavailability of acyclovir through solid dispersion formulations. IJAP.2024,16(5):111-8.