
Int J App Pharm, Vol 18, Issue 2, 2026, 112-125Original Article
SOLUBILITY ENHANCEMENT, FORMULATION DEVELOPMENT AND EVALUATION OF EXTENDED-RELEASE TABLETS OF BCS CLASS IV DRUGS TICAGRELOR
MAHESH INAMDAR*, RAOSAHEB SHENDGE
Department of Pharmaceutics, Sanjivani College of Pharmaceutical Education and Research, At-Sahajanand Nagar, Shinganapur, Kopargaon, Maharashtra, India
*Corresponding author: Mahesh Inamdar; *Email: mninamdar@gmail.com
Received: 16 Sep 2025, Revised and Accepted: 06 Feb 2026
ABSTRACT
Objective: The study was done to make extended-release tablets of Ticagrelor, a BCS Class IV drug that has low solubility and poor bioavailability. The goal was to improve solubility using hydrotropic solid dispersions and to achieve sustained release for longer drug action.
Methods: A ternary mixture of nicotinamide, sodium salicylate and resorcinol in 1:1:2 ratio was used to increase solubility. Solid dispersions were prepared by solvent evaporation and compressed into tablets with HPMC K100M and ethyl cellulose. A 3² factorial design was used for optimization, with hardness and 12-hour drug release as the main responses.
Results: Solubility of Ticagrelor in water was 9.43 µg/ml, while the ternary hydrotrope gave 225.8±11.4 µg/ml (23.94 times higher). The optimized batch TF5 with 75 mg HPMC K100M and 35 mg ethyl cellulose showed hardness of 8.6±0.3 kg/cm² and 95.8±3.7% release at 12 h. Model predictions were close to experimental values with prediction errors of+1.06% for hardness and+0.23% for drug release. Stability studies for 6 mo showed no major changes in hardness, friability, drug content or dissolution.
Conclusion: The optimized tablets improved solubility and gave controlled release for 12 h. This may help in reducing dosing frequency and improving patient compliance in cardiovascular therapy. Further in vivo studies are required to confirm the effect.
Keywords: Ticagrelor, Hydrotropy, Solid dispersion, Extended release, Factorial design, Cardiovascular
© 2026 The Authors.Published by Innovare Academic Sciences Pvt Ltd. This is an open access article under the CC BY license (https://creativecommons.org/licenses/by/4.0/)
DOI: https://dx.doi.org/10.22159/ijap.2026v18i2.56905 Journal homepage: https://innovareacademics.in/journals/index.php/ijap
INTRODUCTION
Cardiovascular diseases (CVDs) remain the top cause of death worldwide, taking about 17.9 million lives each year [1]. Many of these deaths involve thrombosis, so antiplatelet therapy is a mainstay of prevention. Ticagrelor, a cyclopentyl-triazolopyrimidine, is an oral P2Y12 receptor blocker used in acute coronary syndrome (ACS) and for secondary prevention [2]. It belongs in BCS Class IV, with poor aqueous solubility and low intestinal permeability, leaving bioavailability at approximately 36% and showing high person-to-person variability [3]. That often pushes dosing higher, which can increase side effects and compromises adherence. The immediate-release form also needs twice-daily dosing, and over months that schedule becomes hard to keep. So the critical need is to raise exposure while cutting dosing burden for ticagrelor and similar drugs [4]. Recent progress with extended-release designs demonstrates promis, offering ways to improve bioavailability, smooth the pharmacokinetic profile, and make regimens simpler without changing the core mechanism of action. These are practical, pharmacy-friendly options for real-world use [5].
Ticagrelor is a selective, reversible blocker of the platelet ADP P2Y12 receptor. The drug has a triazolopyrimidine core and bulky lipophilic side chains, which helps target the receptor but also makes it poorly soluble in water [6]. By stopping ADP-driven activation of the glycoprotein IIb/IIIa complex, it slows fibrinogen cross-linking and limits clot growth [7]. Unlike thienopyridines such as clopidogrel, it isn’t a prodrug and doesn’t need hepatic activation, so the effect starts quickly. Even with strong clinical results in PLATO, the molecule still is limited by its physicochemical properties: low solubility, limited permeability, and fast metabolism keep exposure uneven and below what would be ideal [8]. Researchers have tried to address this challenge with solid dispersions, nanosizing, and cyclodextrin complexes; these help, but they do not adequately maintain levels over time [9]. A well-designed extended-release version one that improves apparent solubility at the absorption site while stretching the release window could smooth plasma profiles and make day-to-day control more consistent in CVD care [10].
To tackle these limits, this study aimed to develop a extended-release tablet that first helps ticagrelor dissolve, then lets it out at a steady rate [11]. The the formulation employs a solid dispersion with hydrophilic carriers, plus small amounts of solubilizers, pH modifiers, or surfactants to keep the drug wet and dissolving in the gut [12]. For the slow-release part, the core is a polymer matrix, typically HPMC or ethyl cellulose that sets the release pace and keeps the tablet in the GI tract a bit longer. Compared with standard tablets, this formulation approach should reduce dosing frequency to fewer times per day, hold plasma levels in a tighter band, and smooth out peak–trough swings [13]. We can build it with hot-melt extrusion, spray drying, or co-processed blends to optimize the release curve. The design will follow QbD: pick critical materials and process settings, map their ranges, and establish a robust window. The goal is simple overcome poor solubility and quick clearance at the same time so exposure improves and patients have an easier, more consistent regimen [14].
Goal is to develop and fine-tune an extended-release tablet of Ticagrelor that first boosts dissolution and then releases the drug at a steady pace. Solid dispersions with simple hydrophilic carriers raise apparent solubility; these dispersions are compressed into polymer-matrix tablets for controlled release. Each batch is checked for basics flow, hardness, friability, assay, and content uniformity and then run through in vitro release tests with straightforward kinetic fits. The top candidate goes to pharmacokinetic testing to compare Cmax, Tmax, AUC, and fluctuation against a reference tablet. Target outcome: higher oral bioavailability and a steadier, sustained effect over the dosing interval.
MATERIALS AND METHODS
Materials
Ticagrelor (API, purity ≥99%, molecular weight 522.6 g/mol) was procured from Sciquaint Innovations Pvt. Ltd. (Pune, India). Hydroxypropyl methylcellulose K100M (pharma grade, viscosity ~100,000 mPa·s) and ethyl cellulose (pharma grade, viscosity 20 mPa·s) were obtained from Sciquaint Chemicals (Pune, India). Nicotinamide (analytical grade, MW 122.12 g/mol), sodium salicylate (analytical grade, MW 160.1 g/mol), and resorcinol (analytical grade, MW 110.1 g/mol) were supplied by Neeta Chemicals (Pune, India). Magnesium stearate (pharma grade, USP specification) and talc (pharma grade, particle size<45 µm) were procured from Research Lab Fine Chem Industries (Mumbai, India). All other solvents and reagents used in this study were of analytical grade and employed as received without further purification.
Methods
Calibration curve determination
The calibration curve for Ticagrelor was set up on a double-beam UV–Visible spectrophotometer (UV-1800, Shimadzu, Kyoto, Japan). A 100 µg/ml stock was prepared in 0.2% w/v Polysorbate 80 (water) and serially diluted to 4–24 µg/ml. The stock was scanned from 200–400 nm to locate λmax, which appeared at 295 nm. Standards were read at 295 nm in 1 cm quartz cuvettes using the same solvent as blank. All readings were taken at 25±2 °C in triplicate (n = 3), and mean absorbance was plotted against concentration. Linear regression yielded the calibration equation and R². The method followed ICH Q2(R1) and showed good linearity across the tested range [15–17].
Solubility study
To screen a suitable medium, excess ticagrelor was added to 10 ml of each solvent distilled water, phosphate buffer (pH 6.8, 0.05 M), DMSO, and dichloromethane in sealed glass vials. Vials were shaken on an orbital shaker (REMI, Mumbai, India) at 37±0.5 °C and 100 rpm for 24 h. Suspensions were then centrifuged at 3000 rpm for 15 min, and the supernatants were passed through 0.45 µm membrane filters. Filtrates were diluted as needed and read at 295 nm on a UV–Visible spectrophotometer (UV-1800, Shimadzu, Kyoto, Japan) using the matching solvent as blank. All measurements were performed in triplicate (n = 3), and solubility was reported as mean concentration (µg/ml) [18, 19].
Preliminary batches for selection of hydrotropic agents
Eight hydrotropic agents were screened for their ability to improve ticagrelor solubility. Fresh 10–40% w/v solutions were prepared in distilled water, and ticagrelor (50 mg) was added to 10 ml of each in capped conical flasks. The flasks were placed on a rotary shaker (RS-12R, Remi, Mumbai, India) at 100 rpm for 72 h at 25±2 °C to reach equilibrium. Afterward, samples were filtered through Whatman No. 41 paper, diluted as required, and analyzed at 295 nm on a UV–Visible spectrophotometer (UV-1800, Shimadzu, Kyoto, Japan) using the corresponding solution as blank. Tests were performed in triplicate (n = 3), and solubility was reported as mean concentration (µg/ml) [20].
Combination studies of selected hydrotropic agents for solubility enhancement
From the single-agent screen, nicotinamide, sodium salicylate, and resorcinol showed the strongest effect and were taken forward for combination testing. Binary blends (1:1, 1:2, 2:1) and ternary sets (1:1:1, 1:1:2, 1:2:1) were prepared with total hydrotrope fixed at 15–25% w/v. Excess ticagrelor (50 mg) was added to 10 ml of each solution, and flasks were placed on a rotary shaker (RS-12R, Remi, Mumbai, India) at 100 rpm and 25±2 °C for 72 h to reach equilibrium. Samples were filtered through Whatman No. 41 paper, diluted as needed, and read at 295 nm on a UV–Visible spectrophotometer (UV-1800, Shimadzu, Kyoto, Japan) using the matching solution as blank. Each condition ran in triplicate (n = 3), and solubility was reported as mean concentration (µg/ml) [21].
Preparation of hydrotropic solid dispersions
Hydrotropic solid dispersions of ticagrelor were prepared by solvent evaporation using a ternary mix of nicotinamide, sodium salicylate, and resorcinol (1:1:2). Ticagrelor (100 mg) and hydrotropes (2.8 g total) were dissolved in methanol (15 ml) under magnetic stirring at 300 rpm for 30 min at room temperature (Model 2MLH, Remi, Mumbai, India). A clear solution formed, which was cast into glass petri dishes and dried in a hot-air oven at 40±2 °C for 24 h (Model NSW-173, Narang Scientific Works Pvt. Ltd., Delhi, India). The dried films were scraped, gently milled, and passed through a #80 mesh sieve to obtain uniform particles. Samples were stored in amber glass vials under desiccated conditions. All preparations were performed in triplicate (n = 3) [22, 23].
Characterization of ticagrelor hydrotropic solid dispersions
Drug loading and process yield
The drug loading in the final solid dispersion was 3.45% w/w, calculated from the mass ratio of ticagrelor (100 mg) to total solid dispersion (2.9 g). The practical yield of the solvent evaporation process was 92.4±2.1% (n=3), indicating efficient recovery with minimal loss during the drying and collection process [24].
Differential scanning calorimetry (DSC)
Differential scanning calorimetry (DSC) characterized the thermal behavior of pure Ticagrelor, the individual hydrotropes, their physical mixture, and the solid dispersions (DSC 8000, PerkinElmer, Waltham, USA). Accurately weighed samples (3–5 mg) were sealed in standard aluminum pans and scanned from 30 to 200 °C at 10 °C/min under nitrogen (20 ml/min); an empty sealed pan served as the reference. Thermograms were examined for melting endotherms, glass-transition events (Tg), and any signs of drug–excipient interaction. All measurements were performed in triplicate (n = 3) to confirm repeatability [25].
Fourier transform infrared spectroscopy (FTIR) analysis
Fourier-transform infrared (FTIR) spectra were recorded to probe possible molecular interactions among pure ticagrelor, the selected hydrotropes, their physical mixture, and the prepared solid dispersions. Measurements were taken on an Alpha-T spectrophotometer (Bruker, Billerica, USA). Each sample was blended with dry KBr at 1:100 (w/w), compressed into transparent pellets with a hydraulic press at 10 tons for 2 min, and scanned from 4000 to 400 cm⁻¹ at 4 cm⁻¹ resolution. Baseline correction and peak evaluation were carried out in OPUS software, comparing characteristic functional group bands for any shifts or broadening indicative of drug–excipient interactions. All runs were performed in triplicate (n = 3) [26, 27].
X-Ray powder diffraction (XRD) analysis
The crystalline nature and possible polymorphic transitions of pure Ticagrelor, individual hydrotropic agents, and prepared solid dispersions were examined using an X-Ray Diffractometer (Model MiniFlex 600, Rigaku Corporation, Tokyo, Japan). Powdered samples were carefully placed on the sample holder and scanned over a 2θ range of 5–50° with a step size of 0.02° and a scan speed of 2°/min, employing Cu-Kα radiation (λ = 1.5406 Å) at 40 kV and 15 mA. The obtained diffraction patterns were analyzed for characteristic peaks, changes in crystallinity, and possible amorphization or polymorphic modifications. All measurements were conducted in triplicate (n = 3) to ensure reproducibility [28, 29].
Scanning electron microscopy (SEM) analysis
Scanning electron microscopy (SEM) was used to assess surface morphology and particle attributes of pure ticagrelor, physical mixtures, and hydrotropic solid dispersions. Samples were affixed to aluminum stubs with double-sided carbon tape and sputter-coated with a thin gold layer under vacuum for 3 min to ensure conductivity. Imaging was carried out on a JSM-6380LA (JEOL Ltd., Tokyo, Japan) at magnifications of 100×, 500×, 1000×, and 5000×, with an accelerating voltage of 15 kV and a working distance of 10 mm. Micrographs were examined for particle size, shape, surface texture, and signs of agglomeration [30, 31].
Solubility studies
Equilibrium solubility was measured by the shake-flask method. Excess sample (equivalent to 50 mg ticagrelor) was added to 25 ml distilled water in amber-colored conical flasks, sealed, and shaken on a rotary shaker (RS-12R, Remi, Mumbai, India) at 100 rpm for 72 h at 25±2 °C to reach equilibrium. The mixtures were filtered through 0.45 µm membrane filters, appropriately diluted, and quantified at 295 nm using a UV–Visible spectrophotometer (UV-1800, Shimadzu, Kyoto, Japan). Solubility (µg/ml) was calculated from the calibration curve, and the solubility-enhancement ratio was obtained by normalizing to the pure-drug value. All measurements were performed in triplicate (n = 3) [32, 33].
Experimental design
A 3² full factorial experimental design was employed to systematically investigate the influence of polymer concentrations on the performance of Ticagrelor extended-release tablets. Two formulation variables were selected as independent factors: HPMC K100M concentration (X₁) and ethyl cellulose concentration (X₂). Each factor was evaluated at three levels, defined as low (50 mg and 20 mg), medium (75 mg and 35 mg), and high (100 mg and 50 mg), respectively. The selected response variables were drug release at 12 h (Y₁), which was set as the maximization goal to ensure sustained therapeutic efficacy, and tablet hardness (Y₂), which was targeted for optimization to achieve appropriate mechanical strength without compromising release characteristics. The independent and dependent variables with their respective levels are presented in table 1.
Y=b0+b1X1+b2X2+b11X12+b22X22+b12X1X2
Where: Y = Response variable, b₀ = Intercept, b₁, b₂ = Linear coefficients, b₁₁, b₂₂ = Quadratic coefficients, b₁₂ = Interaction coefficient, X₁ = HPMC K100M concentration, X₂ = Ethyl cellulose concentration [34–36].
Table 1: Independent and dependent variables for 3² factorial design
| Variables | Symbol | Low level (-1) | Medium level (0) | High level (+1) |
| Independent variables | ||||
| HPMC K100M concentration (mg) | X₁ | 50 | 75 | 100 |
| Ethyl cellulose concentration (mg) | X₂ | 20 | 35 | 50 |
| Dependent variables | Goals | |||
| Y₁: Drug release at 12 h | Maximize | |||
| Y₂: Tablet hardness | Optimize |
Preparation of tablet
Extended-release ticagrelor tablets were made by direct compression using a solid-dispersion portion equivalent to 90 mg drug per tablet. All excipients were weighed on an analytical balance, sifted through #40 mesh to keep particle size consistent, and blended in a double-cone blender (FBC-150, Cadmach, Ahmedabad) at 20 rpm for 15 min. Talc (glidant) and magnesium stearate (lubricant) were added last and tumbled for 5 min. The final blend was compressed on a 16-station rotary press (CMD-4, Cadmach) with 12 mm round concave punches at 8–10 kN and a turret speed of 30 rpm. Target tablet weight was 291.0±2.9 mg with thickness held at 6–7 mm. Batches of 100 tablets were packed in HDPE containers with desiccant for later testing, and three batches were produced (n = 3) to check reproducibility. Table 2 lists the exact composition [37].
Table 2: Formulation composition for extended-release tablets
| Batch | X₁ (HPMC K100M) | X₂ (Ethyl cellulose) | Solid dispersion | Lactose (Diluent) | Magnesium stearate | Talc | Total weight |
| TF1 | 50 | 20 | 450 | 74 | 3 | 3 | 600 |
| TF2 | 50 | 35 | 450 | 59 | 3 | 3 | 600 |
| TF3 | 50 | 50 | 450 | 44 | 3 | 3 | 600 |
| TF4 | 75 | 20 | 450 | 49 | 3 | 3 | 600 |
| TF5 | 75 | 35 | 450 | 34 | 3 | 3 | 600 |
| TF6 | 75 | 50 | 450 | 19 | 3 | 3 | 600 |
| TF7 | 100 | 20 | 450 | 24 | 3 | 3 | 600 |
| TF8 | 100 | 35 | 450 | 9 | 3 | 3 | 600 |
| TF9 | 100 | 50 | 450 | 44 | 3 | 3 | 600 |
Pre-compression evaluation of tablet blends
Pre-compression flow and compressibility were checked on the granule blends. Bulk density was taken from the untapped volume of 25 g in a 50 ml graduated cylinder; tapped density was measured on a tapped density tester (ETD-1020, Electrolab, Mumbai) for 100 taps at 250 taps/min. Carr’s index (%) and Hausner’s ratio were calculated from these values to judge packability and flow (Carr’s index<15% = excellent;>25% = poor; Hausner’s ratio<1.25 = good;>1.40 = poor). Flow was also gauged by angle of repose: 10 g of blend was allowed to pass through a fixed funnel (10 mm stem) set 2 cm above a flat surface, and the cone angle was recorded (<30° = excellent;>40° = poor). All tests were run in triplicate (n = 3) as per standard pharmacopeial procedures [38, 39].
Post-compression evaluation of tablets
Twenty tablets from each batch were randomly selected and weighed individually on an analytical balance (AUW220D, Shimadzu Corporation, Kyoto, Japan). The mean weight was calculated, and the percent deviation for each tablet was computed as:
According to Indian Pharmacopoeia (IP) specifications, for tablets with an average weight of 600 mg, the acceptable variation should not exceed ±5%. All measurements were performed in triplicate (n = 3) to ensure accuracy and compliance with pharmacopeial limits [40].
Tablet thickness and diameter
Tablet dimensions were checked for uniformity. Thickness was measured on ten randomly selected tablets using Vernier calipers (CD-6" CSX, Mitutoyo, Kawasaki, Japan; ±0.01 mm accuracy). The same instrument was used to record diameter at the widest point. For both parameters, mean and standard deviation were calculated (mm). Measurements were performed in triplicate (n = 3) to confirm reproducibility and pharmacopeial compliance [41].
Hardness test
Tablet hardness was checked on a HT-300 hardness tester (Campbell Electronics, Mumbai, India). Ten tablets per batch were compressed diametrically until they broke, and the breaking force was recorded as hardness in kg/cm². Measurements were run in triplicate (n = 3), targeting 4–10 kg/cm² to keep tablets sturdy for handling without making them so hard that drug release slows [42].
Friability test
Friability was checked on a Roche friabilator (EF-2W, Electrolab India Pvt. Ltd., Mumbai, India) to gauge tablet strength and abrasion resistance. Twenty tablets from each batch were weighed, placed in the drum, and rotated at 25 rpm for 4 min (100 revolutions). After the run, the tablets were removed, dedusted, reweighed, and the percent weight loss was calculated using the formula:
According to pharmacopeial standards, friability values less than 1% are considered acceptable. All measurements were performed in triplicate (n = 3) to ensure reproducibility [43, 44].
Content uniformity test
Content uniformity was checked by UV–Visible spectrophotometry. Ten tablets from each batch were randomly selected, crushed, dissolved in a suitable solvent, filtered, and appropriately diluted. Each solution was read at 295 nm, and drug content was calculated as a percent of the label claim using:
As per pharmacopeial specifications, acceptable limits for drug content are 85–115% of the label claim with a relative standard deviation (RSD) not exceeding 6%. All determinations were carried out in triplicate (n = 3) to ensure reproducibility [45].
Accelerated stability study
Accelerated stability was carried out per ICH Q1A(R2). Optimized extended-release tablets were packed in HDPE bottles with desiccant, sealed, and kept in a calibrated stability chamber (Heratherm, Thermo Scientific, Waltham, USA) at 40±2 °C/75±5% RH for 6 mo. Samples were pulled at 0, 1, 3, and 6 mo and checked for appearance, hardness, friability, and disintegration time. Drug content was measured by UV at 295 nm, and in vitro release was run in phosphate buffer (pH 6.8) on a USP Type II apparatus using the same settings across all time points. Results (mean±SD, n = 3) were trended over time to spot any meaningful shifts in quality and to estimate shelf-life [46].
Statistical analysis
Data are reported as mean±standard deviation (SD) from triplicate runs (n = 3). Differences between formulations were tested by one-way ANOVA; when the overall test was significant, post-hoc comparisons were applied. A p<0.05 was taken as statistically significant. Factorial design setup, regression modeling, and response-surface plots were generated in Design-Expert Version 13.0 (Stat-Ease Inc., Minneapolis, USA) [47].
RESULTS AND DISCUSSION
Calibration curve determination
The calibration curve for Ticagrelor in 0.2% w/v Polysorbate 80 showed a clear linear relation between absorbance and concentration from 4–24 µg/ml (fig. 1). Linear regression gave y = 0.0163x+0.0033 with R² = 0.9981, indicating excellent linearity across the range. This near-unity fit supports reliable quantitation for solubility, dissolution, and content uniformity studies. The method meets ICH Q2(R1) and is suitable for further experiments.
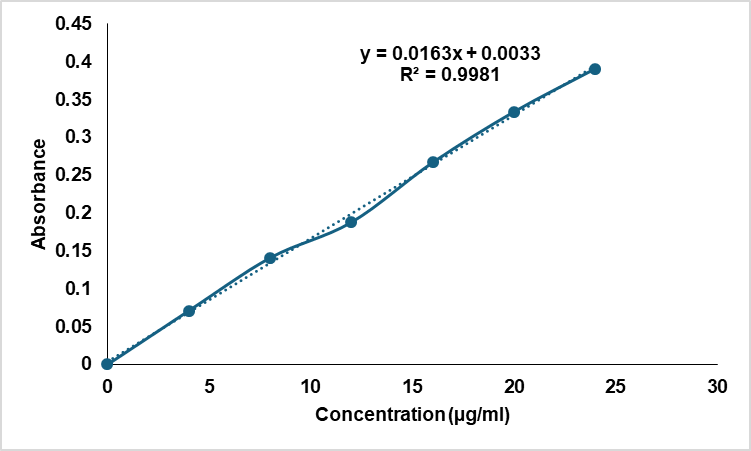
Fig. 1: Calibration curve of ticagrelor in 0.2% w/v polysorbate 80 in water
Solubility determination
Solubility testing confirmed Ticagrelor’s poor solubility in all media evaluated (table 3). The drug dissolved slightly better in DMSO (10.43±0.76 µg/ml) and water (9.43±0.21 µg/ml) than in dichloromethane (7.34±0.87 µg/ml) or phosphate buffer pH 6.8 (2.90±0.12 µg/ml), but in every case remained in the “practically insoluble” range. These results underscore the need for solubility-enhancing approaches such as hydrotropy or solid dispersion to improve dissolution and, in turn, oral bioavailability.
Table 3: Solubility of ticagrelor in different solvents
| Solvents | Solubility (µg/ml) | Observation/Inference |
| Water | 9.43±0.21 | Practically Insoluble |
| DMSO | 10.43±0.76 | Practically Insoluble |
| Dichloromethane | 7.34±0.87 | Practically Insoluble |
| Phosphate Buffer pH 6.8 | 2.9±0.12 | Practically Insoluble |
Data were expressed in mean±SD (n=3)
Solubility of ticagrelor in individual hydrotropic agents and drug loading and process yield
The solubility evaluation of Ticagrelor in individual hydrotropic agents showed a significant improvement compared to water, with enhancement ratios ranging between 5.60 and 16.58 (table 4). Nicotinamide demonstrated the maximum solubility of 156.4±7.8 µg/ml, followed by sodium salicylate (134.8±6.3 µg/ml) and resorcinol (118.9±5.4 µg/ml), indicating their superior solubilizing efficiency. Moderate enhancement was observed with sodium citrate and sodium benzoate, while agents like urea, sodium acetate, and sodium caprylate were less effective. These results highlight nicotinamide, sodium salicylate, and resorcinol as the most promising hydrotropes. The 23.94-fold solubility enhancement (225.8 µg/ml) is superior to other reported techniques for ticagrelor. Cyclodextrin complexation typically achieves 8-15 fold enhancement but suffers from high cost and limited drug loading. Nanosuspensions provide 10-20 fold improvement but face stability and scalability challenges. Our hydrotropic approach offers comparable enhancement with simpler, cost-effective manufacturing suitable for industrial scale-up. The achieved solubility (225.8 µg/ml) significantly exceeds the dose/solubility ratio requirement: for a 90 mg dose in 250 ml gastric fluid, only 360 µg/ml is needed for complete dissolution, suggesting our formulation can achieve near-complete drug solubilization in vivo, potentially improving bioavailability beyond the reported 36%.
Table 4: Solubility of ticagrelor in individual hydrotropic agents
| Batch No. | hydrotropic agent | Concentration (% w/v) | Solubility (µg/ml) | Enhancement ratio |
| H1 | Sodium benzoate | 20 | 87.2±4.1 | 9.24 |
| H2 | Sodium salicylate | 20 | 134.8±6.3 | 14.29 |
| H3 | Urea | 30 | 63.7±3.2 | 6.75 |
| H4 | Sodium citrate | 25 | 95.3±4.7 | 10.11 |
| H5 | Nicotinamide | 25 | 156.4±7.8 | 16.58 |
| H6 | Sodium acetate | 30 | 52.8±2.9 | 5.60 |
| H7 | Resorcinol | 15 | 118.9±5.4 | 12.61 |
| H8 | Sodium caprylate | 20 | 71.6±3.8 | 7.59 |
Value are expressed as mean±SD (n=3) Enhancement ratio = Solubility in hydrotropic solution/Solubility in water (9.43 µg/ml).
The solid dispersion formulation achieved a drug loading of 3.45% w/w with a high carrier-to-drug ratio (28:1), which was necessary to achieve maximum solubilization of ticagrelor given its extremely poor aqueous solubility (9.43 µg/ml), and to maintain the drug in a molecularly dispersed amorphous state. The practical yield of 92.4±2.1% demonstrates efficient recovery and manufacturing feasibility, while the DSC and XRD analyses confirmed successful transformation to the amorphous form, which explains the 23.94-fold solubility enhancement achieve.
Solubility of ticagrelor in combination of hydrotropic agents
The solubility study using combinations of hydrotropic agents showed a remarkable synergistic effect, with all mixtures providing higher solubility than individual agents (table 5). The ternary combination of nicotinamide, sodium salicylate, and resorcinol in a 1:1:2 ratio (HC7) exhibited the highest solubility of 225.8±11.4 µg/ml with an enhancement ratio of 23.94. Other ternary mixtures (HC6 and HC8) also produced excellent solubilization, exceeding 200 µg/ml. Binary combinations displayed moderate improvement, with HC4 showing the best among them. These results confirm that ternary systems maximize solubility enhancement.
Differential scanning calorimetry (DSC) analysis
The DSC thermograms of pure ticagrelor and hydrotropic solid dispersion are presented in fig. 2. Pure ticagrelor displayed a sharp endothermic peak at 138.92 °C, corresponding to its melting point and confirming its crystalline nature (fig. 2A). The sharpness of the peak reflects high crystallinity, while the absence of additional peaks rules out polymorphic transitions within the scanned range. In contrast, the hydrotropic solid dispersion exhibited a significantly shifted and reduced melting endotherm at 121.97 °C (fig. 2B), representing a depression of 16.95 °C. This substantial reduction in melting point, along with decreased peak intensity and broadening, indicates considerable loss of crystallinity and transformation toward an amorphous state due to molecular-level dispersion of ticagrelor within the hydrotropic carrier matrix. The melting point depression suggests strong drug-carrier interactions through hydrogen bonding, which disrupts the drug's crystalline lattice and enhances solubility.
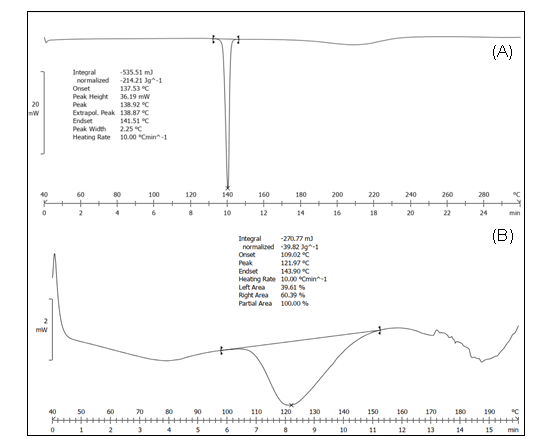
Fig. 2: DSC spectra of (A) pure Ticagrelor [peak 138.92] (B) Solid dispersion [121.97]
Table 5: Solubility of ticagrelor in combination of hydrotropic agents
| Batch No. | Hydrotropic agent combination | Ratio | Total conc. (% w/v) | Solubility (µg/ml) | Enhancement ratio |
| HC1 | Nicotinamide+Sodium salicylate | 1:1 | 20 | 178.3±8.2 | 18.90 |
| HC2 | Nicotinamide+Resorcinol | 1:1 | 18 | 162.9±7.1 | 17.27 |
| HC3 | Sodium salicylate+Resorcinol | 1:1 | 16 | 151.4±6.8 | 16.05 |
| HC4 | Nicotinamide+Sodium salicylate | 1:2 | 22 | 189.7±9.1 | 20.11 |
| HC5 | Nicotinamide+Resorcinol | 2:1 | 19 | 171.8±7.9 | 18.21 |
| HC6 | Nicotinamide+Sodium salicylate+Resorcinol | 1:1:1 | 20 | 201.5±9.8 | 21.36 |
| HC7 | Nicotinamide+Sodium salicylate+Resorcinol | 1:1:2 | 22 | 225.8±11.4 | 23.94 |
| HC8 | Nicotinamide+Sodium salicylate+Resorcinol | 1:2:1 | 21 | 213.6±10.2 | 22.65 |
Value are expressed as mean±SD (n=3)
FTIR analysis
The FTIR spectra of pure ticagrelor and hydrotropic solid dispersion are presented in fig. 3. Pure ticagrelor (fig. 3A) displayed characteristic absorption bands at 3321 cm⁻¹ (N–H stretching), 3089 cm⁻¹ (aromatic C–H stretching), 1682 cm⁻¹ (C=O stretching), 1589 cm⁻¹ and 1534 cm⁻¹ (aromatic C=C stretching), and 1234 cm⁻¹ (C–N stretching). The hydrotropic solid dispersion (fig. 3B) retained all characteristic peaks of ticagrelor, with additional bands from hydrotropes at 3367 cm⁻¹ (O–H stretch), 1655 cm⁻¹ (C=O stretch), and 1585 cm⁻¹ (COO⁻ stretch). Notably, slight broadening and minor shifts were observed in the N–H (3321 cm⁻¹) and C=O (1682 cm⁻¹) regions of the solid dispersion, suggesting intermolecular hydrogen bonding between ticagrelor and hydrotropes. However, no new peaks appeared and no major peaks disappeared, confirming the absence of chemical incompatibility. The hydrogen bonding interactions indicate molecular-level dispersion that stabilizes the amorphous form without causing drug degradation.
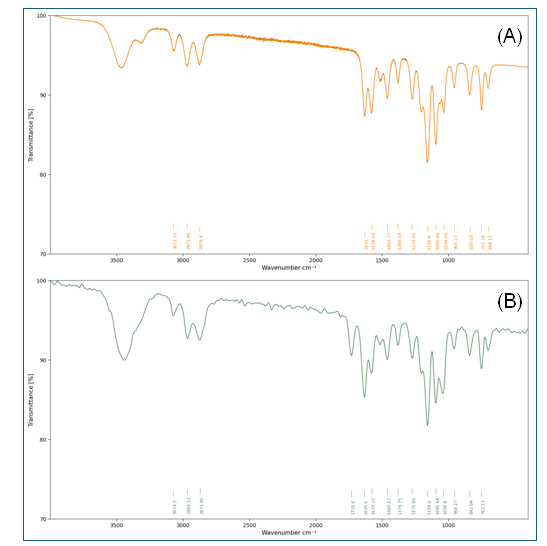
Fig. 3: FTIR spectra of (A) Pure ticagrelor and (B) Hydrotropic solid dispersion
XRD analysis
The XRD diffractogram of pure Ticagrelor (fig. 4A) exhibited sharp and intense peaks at specific 2θ values, confirming its crystalline nature. In contrast, the hydrotropic solid dispersion (fig. 4B) showed a marked reduction in peak intensity and broadening of signals, indicating a significant loss of crystallinity and partial conversion into an amorphous form. This transformation suggests enhanced molecular dispersion of the drug within the hydrotropic carrier matrix, which is favorable for improving solubility and dissolution performance.
SEM analysis
The SEM micrograph of the hydrotropic solid dispersion (fig. 5) revealed distinct morphological changes compared to crystalline Ticagrelor. The image showed irregularly shaped, fragmented particles with rough surfaces and reduced crystallinity, suggesting successful transformation of the drug into a more amorphous form. The absence of well-defined crystalline structures supports the findings from XRD, indicating improved molecular dispersion. Such morphological modifications are expected to enhance the surface area available for dissolution, thereby contributing to solubility and dissolution rate improvement.
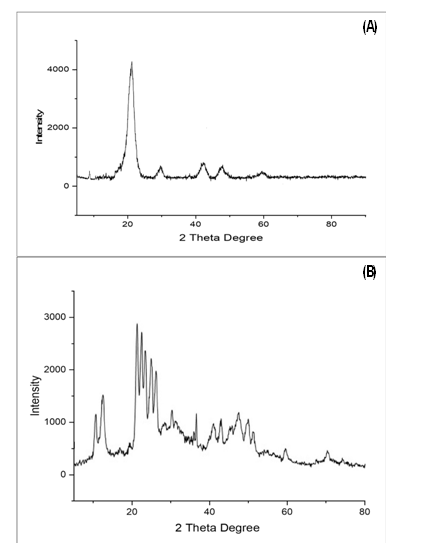
Fig. 4: XRD spectra of (A) Ticagrelor and (B) Hydrotropic solid dispersions
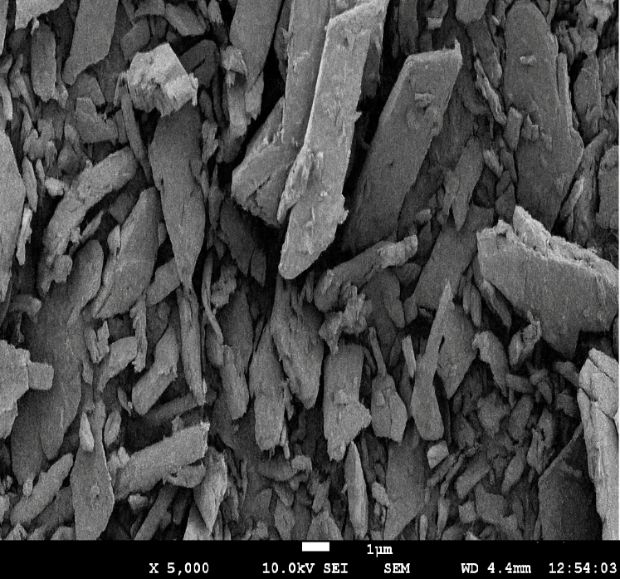
Fig. 5: SEM image of hydrotropic solid dispersions
Results and evaluation of ticagrelor extended-release tablets
The flow and compressibility studies of Ticagrelor tablet blends demonstrated acceptable characteristics across most formulations, with notable variation in performance based on polymer concentration (table 6). Batches TF1 and TF2 showed good flow properties, reflected by lower Carr’s index values (15.5–16.2%) and Hausner’s ratios close to 1.18–1.19, along with angles of repose below 30°. Intermediate batches (TF3–TF7) displayed fair flow with slightly higher compressibility indices (17–18.9%) and angles of repose between 31–34°. In contrast, TF8 and TF9 exhibited poorer flow, with Carr’s index exceeding 19%, Hausner’s ratio ≥1.24, and higher angles of repose, indicating reduced blend flowability at elevated polymer levels.
Post-compression evaluation
The post-compression evaluation of Ticagrelor extended-release tablets confirmed uniform physical and mechanical quality across all batches, with tablet weights maintained around 600 mg and minimal deviation in thickness and diameter (table 7). Hardness values ranged from 6.2 to 11.1 kg/cm², indicating increasing strength with higher polymer levels, while friability remained below 1% for all formulations, confirming adequate mechanical resistance.
Table 6: Flow and compressibility characteristics of tablet blends
| Batch No. | Bulk Density (g/ml) | Tapped density (g/ml) | Carr's index (%) | Hausner's ratio | Angle of repose (°) | Flow property |
| TF1 | 0.485±0.008 | 0.574±0.012 | 15.5±0.8 | 1.18±0.02 | 28.4±1.2 | Good |
| TF2 | 0.472±0.009 | 0.563±0.011 | 16.2±0.9 | 1.19±0.02 | 29.7±1.4 | Good |
| TF3 | 0.461±0.007 | 0.558±0.013 | 17.4±1.1 | 1.21±0.03 | 31.2±1.6 | Fair |
| TF4 | 0.451±0.006 | 0.544±0.010 | 17.1±0.7 | 1.21±0.02 | 30.8±1.3 | Fair |
| TF5 | 0.438±0.008 | 0.532±0.012 | 17.7±1.0 | 1.21±0.02 | 32.1±1.5 | Fair |
| TF6 | 0.425±0.007 | 0.521±0.009 | 18.4±0.8 | 1.23±0.02 | 33.6±1.7 | Fair |
| TF7 | 0.412±0.009 | 0.508±0.011 | 18.9±1.2 | 1.23±0.03 | 34.2±1.8 | Fair |
| TF8 | 0.398±0.006 | 0.495±0.008 | 19.6±0.9 | 1.24±0.02 | 35.7±1.9 | Poor |
| TF9 | 0.384±0.008 | 0.481±0.010 | 20.2±1.1 | 1.25±0.03 | 37.3±2.1 | Poor |
Value are expressed as mean±SD (n=3)
In vitro drug release study
The in vitro drug release study of Ticagrelor extended-release tablets showed sustained and controlled release patterns over 12 h, with cumulative release values ranging from 76.8% to 95.8% across the formulations (table 8, fig. 6). Initial release at 1 hour varied between 15.2% and 26.3%, gradually increasing with time, indicating effective polymer modulation of dissolution. Among all batches, TF5 achieved the highest release of 95.8±3.7% at 12 h, closely followed by TF4 and TF8, while TF3 and TF9 demonstrated comparatively slower release. These findings highlight the impact of polymer concentration on drug release kinetics.
Release kinetics results
The in vitro dissolution data were fitted to various kinetic models to understand the release mechanism (fig. 7). First-order kinetics showed the best fit (R² = 0.9972), indicating concentration-dependent release, while excellent correlations with Higuchi (R² = 0.9837) and Hixson-Crowell (R² = 0.9898) models confirm that drug release occurs through a combined mechanism of diffusion through the hydrated HPMC gel layer and gradual matrix erosion. One-way ANOVA demonstrated significant differences among formulations (F = 11.23, p<0.0001), with Tukey's post-hoc test revealing that TF5 achieved significantly superior 12 h release (95.8±3.7%) compared to formulations with higher ethyl cellulose content (TF3, TF9; p<0.05), while showing no significant difference from TF4 and TF8 (p>0.05). This statistical validation confirms TF5 as the optimized formulation with ideal polymer balance for sustained ticagrelor delivery. The developed factorial design model provides a robust framework for process scale-up. The identified design space (HPMC K100M 70-80 mg, ethyl cellulose 30-40 mg) offers flexibility during manufacturing while maintaining quality. The model's predictive accuracy (errors<2%) enables process optimization without extensive trial batches, reducing development time and cost. This mathematical understanding is critical for technology transfer to pilot and commercial scales.
Table 7: Physical and mechanical properties of compressed tablets
| Batch No. | Weight (mg) | Thickness (mm) | Diameter (mm) | Hardness (kg/cm²) | Friability (%) |
| TF1 | 598.7±4.2 | 6.23±0.08 | 11.98±0.02 | 6.2±0.3 | 0.42±0.03 |
| TF2 | 601.3±3.8 | 6.31±0.09 | 11.97±0.03 | 7.8±0.4 | 0.38±0.02 |
| TF3 | 599.8±4.1 | 6.38±0.07 | 11.99±0.02 | 9.1±0.3 | 0.35±0.03 |
| TF4 | 600.2±3.9 | 6.41±0.08 | 11.98±0.03 | 6.9±0.4 | 0.36±0.02 |
| TF5 | 598.9±4.3 | 6.49±0.09 | 11.97±0.02 | 8.6±0.3 | 0.32±0.03 |
| TF6 | 601.1±3.7 | 6.56±0.08 | 11.99±0.03 | 10.2±0.4 | 0.29±0.02 |
| TF7 | 599.6±4.0 | 6.62±0.07 | 11.98±0.02 | 7.3±0.3 | 0.31±0.03 |
| TF8 | 600.4±3.8 | 6.68±0.09 | 11.97±0.03 | 9.4±0.4 | 0.27±0.02 |
| TF9 | 598.8±4.2 | 6.75±0.08 | 11.99±0.02 | 11.1±0.3 | 0.24±0.03 |
Value are expressed as mean±SD (n=3)
Table 8: In vitro drug release profile of extended release tablets with statistical analysis
| Time (h) | TF1 | TF2 | TF3 | TF4 | TF5 | TF6 | TF7 | TF8 | TF9 |
| 1 | 22.4±1.3 | 19.8±1.2 | 15.2±0.9 | 24.1±1.4 | 26.3±1.5 | 20.6±1.2 | 21.7±1.3 | 23.9±1.4 | 18.1±1.1 |
| 2 | 38.7±1.8 | 34.2±1.6 | 27.8±1.4 | 41.3±1.9 | 44.6±2.1 | 36.1±1.7 | 37.9±1.8 | 40.8±1.9 | 31.4±1.5 |
| 4 | 56.8±2.3 | 51.3±2.1 | 42.1±1.9 | 59.7±2.4 | 63.9±2.6 | 53.8±2.2 | 55.6±2.3 | 58.9±2.4 | 47.2±2.0 |
| 6 | 71.2±2.7 | 65.4±2.5 | 54.8±2.3 | 74.1±2.8 | 78.4±3.0 | 67.9±2.6 | 70.1±2.7 | 73.8±2.8 | 60.7±2.4 |
| 8 | 82.9±3.1 | 77.6±2.9 | 66.3±2.6 | 85.7±3.2 | 89.1±3.4 | 79.4±3.0 | 81.8±3.1 | 85.2±3.2 | 71.8±2.7 |
| 10 | 87.8±3.3 | 84.1±3.1 | 73.2±2.8 | 91.6±3.4 | 93.7±3.5 | 85.3±3.2 | 87.1±3.3 | 89.9±3.4 | 79.4±3.0 |
| 12 | 89.4±3.5 | 86.7±3.3 | 76.8±3.0 | 94.3±3.6 | 95.8±3.7 | 87.1±3.4 | 88.9±3.5 | 91.4±3.6 | 82.6±3.2 |
Value are expressed as cumulative % drug release±SD
Fig. 6: In vitro drug release profile of extended-release tablets showing cumulative drug release (%) over time (h). Data expressed as mean±SD (n=3)
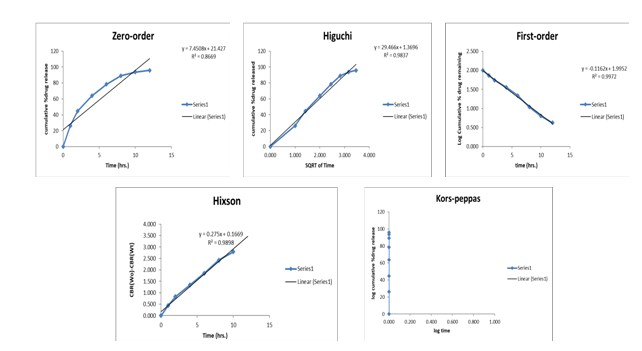
Fig. 7: Drug release kinetics modeling of optimized ticagrelor extended-release tablets (TF5) fitted to various mathematical models: Zero-order (R² = 0.8669), Higuchi (R² = 0.9837), First-order (R² = 0.9972), Hixson-Crowell (R² = 0.9898), and Korsmeyer-Peppas models
Optimization of ticagrelor extended-release tablets
Hardness (Y₁) response analysis
The quadratic model for tablet hardness demonstrated exceptional statistical significance with an F-value of 589.98 and p-value<0.0001, confirming the model's validity for prediction purposes (table 10). The coefficient of determination (R²) value of 0.9972 indicated that 99.72% of the variation in hardness could be explained by the model variables, while the adjusted R² (0.9955) and predicted R² (0.9820) values demonstrated excellent model fit and predictive capability (table 9). The adequate precision ratio of 68.2104, substantially exceeding the minimum requirement of 4.0, confirmed adequate signal-to-noise ratio for navigation in the design space. ANOVA results revealed that ethyl cellulose concentration (Factor B) was the most significant factor affecting hardness with an F-value of 1435.41 (p<0.0001), followed by HPMC K100M concentration (Factor A) with an F-value of 317.08 (p<0.0001). The interaction term AB showed moderate significance with an F-value of 17.44 (p = 0.0087), indicating synergistic effects between the two polymers on tablet mechanical strength.
Hardness (Y₁) =+8.5111+0.7833A+1.6667B+0.225AB
The polynomial equation revealed that ethyl cellulose had the highest positive coefficient (1.6667), indicating its dominant role in enhancing tablet hardness, while HPMC K100M showed a moderate positive effect (0.7833). The interaction coefficient (0.225) suggested additive strengthening effects when both polymers were present at higher concentrations. Contour plots (fig. 8A) and 3D response surface plots (fig. 8B) demonstrated a linear increase in hardness with increasing polymer concentrations, with the highest hardness values observed at maximum levels of both factors. The predicted versus actual plot showed excellent correlation between experimental and predicted values, with points closely aligned along the diagonal line. Perturbation plots confirmed that ethyl cellulose concentration had a steeper slope compared to HPMC K100M, validating its greater influence on tablet hardness as indicated by the regression coefficients.
In vitro drug release at 12h (Y₂) response analysis
The quadratic model for in vitro drug release at 12 h exhibited significant model validity with an F-value of 50.55 and p-value of 0.0043, demonstrating adequate model fit for optimization purposes (table 9). The R² value of 0.9883 indicated that 98.83% of the variability in drug release could be attributed to the model factors, while the adjusted R² (0.9687) and predicted R² (0.8588) values confirmed good model adequacy and predictive capability (table 10). The adequate precision value of 22.3437 exceeded the threshold of 4.0, ensuring sufficient signal-to-noise ratio for design space navigation. ANOVA analysis identified ethyl cellulose concentration (Factor B) as the most influential factor with an F-value of 106.82 (p = 0.0019), followed by the quadratic term A² with an F-value of 77.88 (p = 0.0031). HPMC K100M concentration showed moderate significance (F-value = 15.68, p = 0.0288), while the quadratic term B² demonstrated significant curvature effects (F-value = 43.05, p = 0.0072). The interaction term AB approached significance (F-value = 9.34, p = 0.0552), suggesting potential synergistic effects between the polymer concentrations.
In vitro drug release 12h (Y₂) =+95.5889+1.6667A − 4.35B+1.575AB − 6.4333A² − 4.7833B² (Equation 3)
The regression equation revealed a complex relationship with significant quadratic terms, indicating non-linear response behavior. The negative coefficient for ethyl cellulose (-4.35) demonstrated its retarding effect on drug release, while HPMC K100M showed a positive linear coefficient (1.6667). The negative quadratic coefficients for both A² (-6.4333) and B² (-4.7833) indicated maximum response at intermediate factor levels, characteristic of optimization problems. Contour plots (fig. 8A) and 3D response surface plots (fig. 8B) displayed a distinct maximum region at moderate polymer concentrations, confirming the quadratic nature of the response. The predicted versus actual plot showed satisfactory correlation between experimental and model-predicted values, with minor deviations at extreme conditions. Perturbation plots illustrated the curvature effects, with both factors showing optimal regions rather than monotonic trends, validating the significance of quadratic terms in the model equation.
Table 9: Model fit summary of hardness and in vitro drug release at 12 h
| Hardness | |||
| Std. Dev. | 0.1078 | R² | 0.9972 |
| Mean | 8.51 | Adjusted R² | 0.9955 |
| C. V. % | 1.27 | Predicted R² | 0.9820 |
| Adeq Precision | 68.2104 | ||
| In vitro drug release | |||
| Std. Dev. | 1.03 | R² | 0.9883 |
| Mean | 88.11 | Adjusted R² | 0.9687 |
| C. V. % | 1.17 | Predicted R² | 0.8588 |
| Adeq Precision | 22.3437 |
Table 10: ANOVA for quadratic model for hardness and in vitro drug release at 12 h
| Source | Sum of squares | df | mean square | F-value | p-value | |
| Hardness | ||||||
| Model | 20.55 | 3 | 6.85 | 589.98 | <0.0001 | significant |
| A-HPMC K100M | 3.68 | 1 | 3.68 | 317.08 | <0.0001 | |
| B-Ethyl cellulose | 16.67 | 1 | 16.67 | 1435.41 | <0.0001 | |
| AB | 0.2025 | 1 | 0.2025 | 17.44 | 0.0087 | |
| Residual | 0.0581 | 5 | 0.0116 | |||
| Cor Total | 20.61 | 8 | ||||
| In vitro drug release at 12 h | ||||||
| Model | 268.66 | 5 | 53.73 | 50.55 | 0.0043 | significant |
| A-HPMC K100M | 16.67 | 1 | 16.67 | 15.68 | 0.0288 | |
| B-Ethyl cellulose | 113.54 | 1 | 113.54 | 106.82 | 0.0019 | |
| AB | 9.92 | 1 | 9.92 | 9.34 | 0.0552 | |
| A² | 82.78 | 1 | 82.78 | 77.88 | 0.0031 | |
| B² | 45.76 | 1 | 45.76 | 43.05 | 0.0072 | |
| Residual | 3.19 | 3 | 1.06 | |||
| Cor Total | 271.85 | 8 |
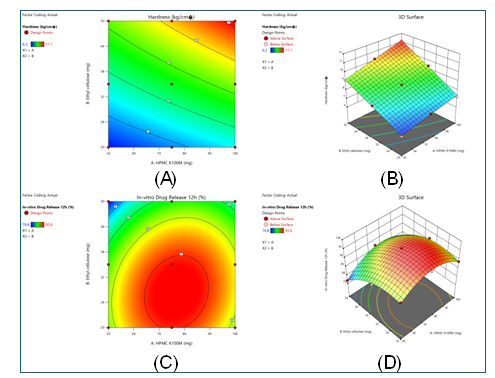
Fig. 8: (A) Contour plot illustrating the effect of HPMC K100M and ethyl cellulose concentrations on tablet hardness, showing a progressive increase in hardness with higher polymer levels. (B) 3D surface plot of hardness confirming the synergistic contribution of both polymers to mechanical strength. (C) Contour plot depicting in vitro drug release at 12 h, where optimal release was observed at intermediate polymer concentrations with clear interaction effects. (D) 3D surface plot of drug release demonstrating the curvature of the response surface, indicating that both HPMC K100M and ethyl cellulose levels significantly influenced sustained release behaviour
Validation of statistical model
The statistical model validation confirmed excellent agreement between predicted and experimental outcomes for the optimized batch TF5 (table 11). The predicted hardness value of 8.51 kg/cm² closely matched the experimental result of 8.6±0.3 kg/cm², with only a 1.06% error. Similarly, the predicted 12 h drug release of 95.58% was almost identical to the observed value of 95.8±3.7%, showing a minimal error of 0.23%. The desirability function achieved a perfect score of 1.000, confirming the robustness and reliability of the developed model for optimization.
Table 11: Predicted vs experimental results for model validation
| Parameter | Predicted values | Experimental values (TF5) | Percentage error (%) |
| Formulation variables | |||
| HPMC K100M (mg) | 75.00 | 75.00 | 0.00 |
| Ethyl cellulose (mg) | 35.00 | 35.00 | 0.00 |
| Response variables | |||
| Hardness (kg/cm²) | 8.51 | 8.6±0.3 | +1.06 |
| In vitro Drug Release 12h (%) | 95.58 | 95.8±3.7 | +0.23 |
| Model statistics | |||
| Desirability | 1.000 | - | - |
Accelerated stability study
The accelerated stability study of the optimized formulation TF5 demonstrated that the tablets maintained their physical integrity and performance over six months under stress conditions (table 12). No changes in appearance were observed throughout the study period, while hardness values showed only a slight decline from 8.6±0.3 to 8.1±0.4 kg/cm². Friability remained within acceptable limits, and drug content decreased marginally from 98.7% to 97.1%, indicating good chemical stability. In vitro drug release at 12 h reduced slightly to 94.2±4.1% but remained consistent with initial values, confirming stability of the formulation. Although lactose (a reducing sugar) poses theoretical risk of Maillard reaction with ticagrelor's amine groups, the stability data showed minimal drug degradation (1.6% loss over 6 mo), confirming negligible incompatibility. Lactose was chosen for its superior compressibility and cost-effectiveness over mannitol. The molecular protection provided by hydrotropes and alkaline pH from sodium salicylate likely suppress any potential degradation reactions. The minor decrease in drug release (95.8% to 94.2%) over 6 mo is not statistically significant (p>0.05) and falls within ICH acceptance criteria (±5%). This trend could result from progressive recrystallization of the amorphous drug or increased matrix cross-linking under stress conditions. However, the absence of visual changes and minimal drug content loss suggests negligible recrystallization, likely due to molecular stabilization by hydrogen bonding with hydrotropes. Long-term studies at 25 °C/60% RH are recommended to confirm extended shelf-life.
Table 12: Accelerated stability study results for optimized tablets (TF5)
| Time point | Physical appearance | Hardness (kg/cm²) | Friability (%) | Drug content (%) | In vitro drug release 12h (%) |
| Initial (0 mo) | White, round, smooth surface | 8.6±0.3 | 0.32±0.03 | 98.7±2.1 | 95.8±3.7 |
| 1 mo | No change | 8.4±0.4 | 0.34±0.04 | 98.2±2.3 | 95.3±3.9 |
| 3 mo | No change | 8.2±0.3 | 0.36±0.03 | 97.8±2.0 | 94.9±3.8 |
| 6 mo | No change | 8.1±0.4 | 0.38±0.04 | 97.1±2.4 | 94.2±4.1 |
Value are expressed as mean±SD (n=3), Storage conditions: 40±2 °C/75±5% RH
DISCUSSION
Ticagrelor presents two linked challenges low solubility and low intestinal permeability so exposure varies and dosing has to be frequent. This work set out to fix both by improving dissolution and building a extended-release tablet that holds levels steady over time, aiming for better efficacy and easier use [48]. A practical, stepwise plan was used: hydrotropic solubilization, solid dispersion, a 3² factorial design to study key excipients, and full physicochemical and release testing. This integrated approach allows formulation-driven improvements in biopharmaceutical performance to be understood mechanistically rather than empirically.
The results point to clear levers for optimization. First, the UV method was nailed down so measurements were trustworthy: in 0.2% Polysorbate 80, 4–24 µg/ml gave a straight line (y = 0.0163x+0.0033; R² = 0.9981). With that calibration in place, solubility, dissolution, and content uniformity could be quantified consistently. The method met ICH Q2(R1), which adds confidence to the data used across the study [49]. Establishing analytical reliability at the outset ensures that observed formulation effects reflect true performance differences rather than methodological variability.
Solubility tests in common media confirmed ticagrelor’s core problem: it stays “practically insoluble,” with values between 2.9 and 10.43 µg/ml in water, pH 6.8 buffer, dichloromethane, and DMSO [50]. To push it higher without changing the molecule, hydrotropy was tried because it’s simple and generally safe. Single-agent screening showed clear gains, and three hydrotropes stood out: nicotinamide, sodium salicylate, and resorcinol with nicotinamide giving the best solubility (156.4 µg/ml; enhancement ratio 16.58) [51]. Mixing them worked even better: binary and ternary blends outperformed the individuals, with the 1:1:2 combo of nicotinamide: sodium salicylate: resorcinol reaching 225.8 µg/ml (enhancement ratio 23.94). This synergistic enhancement suggests that multiple, complementary solubilization mechanisms operate simultaneously in mixed hydrotropic systems. The likely reason is that each hydrotrope helps in a slightly different way improving drug–water interactions and easing the crystal lattice so together they deliver a bigger overall boost [52].
Solid dispersions made with the optimized nicotinamide–sodium salicylate–resorcinol blend were put through DSC, FTIR, XRD, and SEM. Pure ticagrelor showed a sharp melt at 138.92 °C; in the dispersions that peak was absent or broadened, which signals partial amorphization [53]. FTIR kept the expected functional bands in both physical mixes and dispersions, so no new chemical bonds were formed and the excipients look compatible. XRD peaks that were sharp for the crystalline drug dropped in intensity, again pointing to a more amorphous phase. SEM images showed irregular, fragmented, rough-surfaced particles, which should increase surface area and help dissolution. Collectively, these findings indicate that dissolution enhancement arises primarily from physical state modification rather than chemical interaction. Overall, the hydrotropic solid dispersions were successfully prepared and show real promise for improving dissolution and, by extension, bioavailability [54].
Those dispersions were then built into extended-release matrix tablets using HPMC K100M and ethyl cellulose. Pre-compression data indicated mostly good-to-fair flow; Carr’s index and Hausner’s ratio stayed in acceptable ranges, though the high-polymer blends (TF8, TF9) flowed worse [55]. After compression, tablet weight, thickness, and diameter were consistent across batches. Hardness climbed with polymer content (6.2–11.1 kg/cm²), while friability stayed well below 1% for every batch, showing strong resistance to abrasion [56]. These trends reflect the structural role of polymer concentration in governing both manufacturability and mechanical stability.
In vitro profiles showed clear, controlled release. At 12 h, cumulative drug release ranged from 76.8% to 95.8%, with TF5 giving the best balance 95.8% by 12 h with extended release rather than a burst. Formulations richer in ethyl cellulose (TF3, TF9) released more slowly, consistent with the polymer’s hydrophobic, retarding effect. Using tuned levels of HPMC and ethyl cellulose produced a steady, sustained pattern with a smaller initial burst and fewer ups-and-downs in the curve [57]. This controlled release behavior directly supports the goal of minimizing plasma concentration fluctuations associated with immediate-release ticagrelor. The near-complete, sustained release from TF5 indicates the kinetics were successfully moderated, addressing issues seen with conventional tablets. Design analysis backed this up. Tablet hardness depended most on ethyl cellulose, then HPMC, and the two showed a clear synergistic interaction; the quadratic model for hardness fit extremely well (R² = 0.9972). For drug release, ethyl cellulose again dominated as a retarder, while HPMC pushed release upward. The release model (R² = 0.9883) captured both linear and quadratic terms, reflecting the non-linear response to polymer levels. Contour and 3D surfaces made these trends easy to read and helped define the optimal window [58, 59].
Validation of the statistical model using batch TF5 confirmed the predictive accuracy of the design, with minimal deviation between predicted and experimental values for hardness (1.06% error) and drug release (0.23% error). The desirability value of 1.000 further emphasized the robustness of the optimization strategy. Accelerated stability studies over six months confirmed the stability of the optimized formulation, with negligible changes in physical appearance, hardness, friability, drug content, and dissolution profile, thereby ensuring consistent performance under stressed conditions [60]. This confirms the practical feasibility of the formulation for long-term storage and clinical use.
CONCLUSION
The present study successfully developed and optimized hydrotropic solid dispersion–based extended-release tablets of Ticagrelor to overcome its poor solubility and limited bioavailability. Among the formulations, TF5 demonstrated optimal characteristics, achieving 95.8% drug release at 12 h, appropriate mechanical strength, and excellent stability under accelerated conditions. The combination of nicotinamide, sodium salicylate, and resorcinol proved highly effective in enhancing solubility, while the polymeric matrix ensured sustained release. These findings suggest that the optimized formulation could improve clinical outcomes by maintaining consistent plasma levels, reducing dosing frequency, and enhancing patient compliance in long-term cardiovascular therapy. While in vitro data are promising, in vivo pharmacokinetic studies are essential to confirm that enhanced solubility translates to improved bioavailability and therapeutic outcomes in cardiovascular patients. Future work should evaluate absorption kinetics, plasma concentration-time profiles, and antiplatelet efficacy in animal models before clinical translation. To fully establish its therapeutic potential, further in vivo pharmacokinetic and pharmacodynamic studies are warranted, which will provide critical insights into translating this formulation into clinical application.
ABBREVIATIONS
ANOVA: analysis of variance; FTIR: fourier transform infrared spectroscopy; UV: ultraviolet spectroscopy; DSC: differential scanning calorimetry; XRD: x-ray diffraction; SEM: scanning electron microscopy; HPMC: hydroxypropyl methylcellulose; SD: standard deviation; HDPE: high-density polyethylene; QbD: quality by design; ICH: international council for harmonisation; RH: relative humidity; API: active pharmaceutical ingredient; USP: united states pharmacopeia; KBr: potassium bromide; rpm: revolutions per minute; PVA: polyvinyl alcohol; IP: indian pharmacopoeia; µm: micrometer; λmax: maximum wavelength; R²: correlation coefficient; DF: degree of freedom; C. V.: coefficient of variation; n: number of samples; BCS: biopharmaceutics classification system; CVD: cardiovascular disease; ACS: acute coronary syndrome; MR: modified release.
FUNDING
Nil
AUTHORS CONTRIBUTIONS
All authors have contributed equally
CONFLICT OF INTERESTS
Declared none
REFERENCES
Gaziano TA. Cardiovascular diseases worldwide. In: public health approach to cardiovascular disease prevention and management. CRC Press; 2022. p. 8-18. doi: 10.1201/b23266-2.
Naveed A, Atique R, Saeed HA, Sharif J, Nadeem A, Samad A. Cardiovascular diseases: understanding the leading cause of death worldwide. GJMDSA. 2024;1(1):100-10. doi: 10.70445/gjmdsa.1.1.2024.100-110.
Naeem A, Abbas SH, Yousaf M, Ishtiaq A, Murtaza I. Global impact and strategies to reduce the mortality from cardiovascular diseases. In: Rezaei N, editor. Integrated Science for Sustainable Development Goal 3: Empowering Global Wellness Initiatives. Berlin: Springer Nature; 2024. p. 283-306. doi: 10.1007/978-3-031-64288-3_12.
Hussain MM, Rafi U, Imran A, Rehman MU, Abbas SK. Risk factors associated with cardiovascular disorders: risk factors associated with cardiovascular disorders. PBMJ. 2024;7(2):3-10. doi: 10.54393/pbmj.v7i02.1034.
Alanzi SS, Almayouf SM, Alotaibi KM, Alanazi AO, Alsahli GH. Global burden risk factors and evidence-based strategies for cardiovascular disease prevention: a comprehensive systematic review. J Angiotherapy. 2025;9(1):1-20. doi: 10.25163/angiotherapy.9110348.
Kabil MF, Abo Dena AS, El-Sherbiny IM. Ticagrelor. Profiles Drug Subst Excip Relat Methodol. 2022;47:91-111. doi: 10.1016/bs.podrm.2021.10.003, PMID 35396017.
Sanderson NC, Parker WA, Storey RF. Ticagrelor: clinical development and future potential. Rev Cardiovasc Med. 2021;22(2):373-94. doi: 10.31083/j.rcm2202044, PMID 34258905.
Akkaif MA, Ng ML, Sk Abdul Kader MA, Daud NA, Sha’aban A, Ibrahim B. A review of the effects of ticagrelor on adenosine concentration and its clinical significance. Pharmacol Rep. 2021;73(6):1551-64. doi: 10.1007/s43440-021-00309-0, PMID 34283374.
Wang Y, Meng X, Wang A, Xie X, Pan Y, Johnston SC. Ticagrelor versus clopidogrel in CYP2C19 loss-of-function carriers with stroke or TIA. N Engl J Med. 2021;385(27):2520-30. doi: 10.1056/NEJMoa2111749, PMID 34708996.
Ge Z, Kan J, Gao X, Raza A, Zhang JJ, Mohydin BS. Ticagrelor alone versus ticagrelor plus aspirin from month 1 to month 12 after percutaneous coronary intervention in patients with acute coronary syndromes (ULTIMATE-DAPT): a randomised placebo-controlled double-blind clinical trial. Lancet. 2024;403(10439):1866-78. doi: 10.1016/S0140-6736(24)00473-2, PMID 38599220.
Shukla S, Chauhan V, Kaushik R. Optimization and characterization of meloxicam orodispersible tablets using mixed hydrotropy for enhanced water solubility. J App Pharm Sci Res. 2023;6(1):41-9. doi: 10.31069/japsr.v6i1.06.
Khan AD, Tabish M, Kaushik R, Saxena V, Kesharwani P, Gupta S. Hydrotropy: recent advancements in enhancement of drug solubility and formulation development. Int J Drug Deliv Technol. 2021;11(3):1092-102. doi: 10.25258/ijddt.11.3.47.
Kazi M, Gandhi SM, Barse R, Jagtap V. Formulation and evaluation of glimepiride tablet by improving aqueous solubility of drug using hydrotropy technique. World J Pharm Pharm Sci. 2023 Mar 23;12(6):1041-54.
Soni K, Sharma K. Green and cost-effective spectrophotometric analysis of diclofenac sodium using mixed hydrotropy. Pharm Fronts. 2025;7(2):e137-41. doi: 10.1055/a-2567-9542.
Sharma P, Shivhare P, Jain V. Hydrotropy as a tool for enhancing mefenamic acid solubility: a comprehensive study. Ind J Pharm Edu Res. 2025;59(1s):s52-62. doi: 10.5530/ijper.20250092.
Patil MR, Ganorkar SB, Patil AS, Shirkhedkar AA, Surana SJ. A converged pharmaceutical analysis supported with hydrotropy and DoE with dual HPTLC and stress studies for estimation of tolvaptan. Microchem J. 2021;167:106328. doi: 10.1016/j.microc.2021.106328.
Siddheshwar SS, Kale VR, Mankar SD, Ghorpade AC, Gawali PS. Development and fabrication of ozenoxacin-loaded thermosensitive in situ gel for impetigo. BioNanoSci. 2025;15(3):518. doi: 10.1007/s12668-025-02140-w.
Patil MR, Ganorkar SB, Patil AS, Shirkhedkar AA, Surana SJ. Hydrotropic solubilization in pharmaceutical analysis: origin evolution, cumulative trend and precise applications. Crit Rev Anal Chem. 2021;51(3):278-88. doi: 10.1080/10408347.2020.1718484, PMID 32000510.
Jassim ZE. Investigating the effect of mixed hydrotropy approach on solubility enhancement of felodipine. Int J Pharm Investig. 2024;14(4):1291-8. doi: 10.5530/ijpi.14.4.143.
Abdullah Ali H, Kamal Omer H. Solubility enhancement of a poorly water-soluble drug using hydrotropy and mixed hydrotropy-based solid dispersion techniques. Adv Pharmacol Pharm Sci. 2022;2022(1):7161660. doi: 10.1155/2022/7161660, PMID 36479276.
Gulia R, Singh S, Arora S, Sharma N. Development and optimization of hydrotropic solid dispersion of dexlansoprazole using central composite design approach. J Integr Sci Technol. 2023;11(4):59.
Saharawat A, Deepali NN, Nainwal N. Natural plus synthetic hydrotropic solubilization using response surface methodology to optimize the solid dispersion of hydrochlorothiazide. Comb Chem High Throughput Screen. 2022;25(2):307-23. doi: 10.2174/1386207323666201218115149, PMID 33353534.
K Maheshwari R, Pathak S, Sahu P. Ecofriendly application of mixed hydrotropy for titrimetric analysis of ibuprofen tablets. IJSR. 2021;10(5):954-6. doi: 10.21275/SR21516180651.
Hiew TN, Zemlyanov DY, Taylor LS. Balancing solid-state stability and dissolution performance of lumefantrine amorphous solid dispersions: the role of polymer choice and drug–polymer interactions. Mol Pharm. 2022;19(2):392-413. doi: 10.1021/acs.molpharmaceut.1c00481, PMID 34494842.
Natarajan A, Neduvel Annal U, Elakiyaasokan VK, Nagarajan NG. Hydrotrope dynamics: unraveling solubility pattern and correlation of benzimidazole using response surface methodology expert system. J Dispers Sci Technol. 2025;46(8):1216-26. doi: 10.1080/01932691.2024.2319872.
Abdullah Ali H, Kamal Omer H. Solubility enhancement of a poorly water-soluble drug using hydrotropy and mixed hydrotropy-based solid dispersion techniques. Adv Pharmacol Pharm Sci. 2022;2022(1):7161660. doi: 10.1155/2022/7161660, PMID 36479276.
Siddheshwar SS, Kale VR, Mankar SD, Ghorpade AC, Gawali PS. Development and fabrication of ozenoxacin-loaded thermosensitive in-situ gel for impetigo. BioNanoScience. 2025 Sep;15(3):518. doi: 10.1007/s12668-025-02140-w.
Eltobshi AA, Sultan AA, El Maghraby GM. Hydrotropy and co-crystallization for synergistic enhancement of dissolution rate and in vivo anti-inflammatory efficacy of ebastine. J Drug Deliv Sci Technol. 2025;104:106498. doi: 10.1016/j.jddst.2024.106498.
Siddheshwar SS, Jadhav MrAM, Mankar SD, Ghorpade AC, Bhalerao P. Development and optimization of avanafil cocrystals: in silico molecular docking approach for enhanced aqueous solubility and dissolution rate. Journal of Molecular Structure 2026;1351:144281. doi: 10.1016/j.molstruc.2025.144281.
Renuka G, Venkatesh K, Lavanya B. Formulation development of aqueous injection of poorly soluble drug using mixed hydrotropic solubilization concept and its evaluation. Indo-Am J Pharm Bio Sci. 2022;20:135-41.
Siddheshwar SS, Jagtap D, Mankar SD, Ghorpade AC, Dighe SB, Bhawar S. Development and optimization of myricetin-loaded inhalable microsphere to treat COPD. Pharm Res. 2025;42(11):2063-78. doi: 10.1007/s11095-025-03973-6, PMID 41219567.
Kumar A, Singh BK, Padiyar RS. Formulation and development of olmesartan medoxomil mouth dissolving tablet using solid dispersion technique. Asian Reson. 2018;7(5):42-7.
Siddheshwar SS, Changdev G, Mankar SD, Dighe S. Development and characterization of baricitinib nanoemulgel with antiarthritic effect in rats. BioNanoScience. 2025 Jun;15;15(2):297.
Bajwa N, Singh M, Naryal S, Mahal S, Mehta S, Madan J. Formulation development and assessment of solid dispersion and hydrotropy for BCS Class II drug solubility enhancement. Lett Drug Des Discov. 2024;21(2):305-19. doi: 10.2174/1570180819666220822115049.
Sarkar P, Biswas Majee S. Formulation development and in vitro characterization of ternary hydrotropic solid dispersions of aceclofenac. Asian J Pharm Clin Res. 2022;15(9):174-9. doi: 10.22159/ajpcr.2022.v15i9.45158.
Siddheshwar SS, Jadhav S, Mankar SD, Ghorpade AC. Development and fabrication of emodin-loaded patches using geraniol as a penetration enhancer for transdermal delivery. Assay Drug Dev Technol. 2025;23(3):251-61. doi: 10.1089/adt.2025.010, PMID 40354140.
Alburyhi MM, Mohamed YA, Saif AA, Noman MA, Abdullah JH, Yahya TA. Recent innovations of novel drug delivery systems for formulation development and evaluation of amlodipine and furosemide orodispersible tablets. World J Pharm Med Res. 2025;11(5):358-78.
Nigusse B, Gebre Mariam T, Belete A. Design development and optimization of sustained release floating bioadhesive and swellable matrix tablet of ranitidine hydrochloride. PLOS One. 2021;16(6):e0253391. doi: 10.1371/journal.pone.0253391, PMID 34170952.
Gowthami B, Krishna SV, Rao DS. Formulation of tablets in capsule system: statistical optimization for chronotherapeutic drug delivery of propranolol hydrochloride. J Drug Deliv Sci Technol. 2021;63:102398. doi: 10.1016/j.jddst.2021.102398.
Algahtani MS, Mohammed AA, Ahmad J, Abdullah MM, Saleh E. 3D printing of dapagliflozin containing self-nanoemulsifying tablets: formulation design and in vitro characterization. Pharmaceutics. 2021;13(7):993. doi: 10.3390/pharmaceutics13070993, PMID 34209066.
Tafere C, Yilma Z, Abrha S, Yehualaw A. Formulation in vitro characterization and optimization of taste-masked orally disintegrating co-trimoxazole tablet by direct compression. PLOS One. 2021;16(3):e0246648. doi: 10.1371/journal.pone.0246648, PMID 33725014.
Canh Pham E, Vo Van L, Viet Nguyen C, Nguyen Duong NT, Le Thi TV. Formulation development, optimization in vivo antidiabetic effect and acute toxicity of directly compressible herbal tablets containing Merremia tridentata (L.) extract. J Drug Deliv Sci Technol. 2023;84:104445. doi: 10.1016/j.jddst.2023.104445.
Naman S, Madhavi N, Singh B, Madan J, Baldi A. Implementing risk-based quality by design for development and optimization of flavored oral disintegrating mini tablets. J Drug Deliv Sci Technol. 2021;66:102799. doi: 10.1016/j.jddst.2021.102799.
Suksaeree J, Monton C, Charoenchai L, Chankana N, Wunnakup T. Optimization of process and formulation variables for Semha–pinas extract effervescent tablets using the box–behnken design. AAPS PharmSciTech. 2023;24(1):52. doi: 10.1208/s12249-023-02514-x, PMID 36703088.
Naman S, Madhavi N, Singh B, Madan J, Baldi A. Implementing risk-based quality by design for development and optimization of flavored oral disintegrating mini tablets. J Drug Deliv Sci Technol. 2021 Dec 1;66:102799. doi: 10.1016/j.jddst.2021.102799.
AlAli AS, Aldawsari MF, Alalaiwe A, Almutairy BK, Al-Shdefat R, Walbi IA. Exploitation of design-of-experiment approach for design and optimization of fast-disintegrating tablets for sublingual delivery of sildenafil citrate with enhanced bioavailability using the fluid-bed granulation technique. Pharmaceutics. 2021;13(6):870. doi: 10.3390/pharmaceutics13060870, PMID 34204781.
Ibrahim AH, Ibrahim HM, Elbahwy IA, Afouna MI, Tagami T, Ozeki T. Lyophilized tablets of felodipine-loaded polymeric nanocapsules to enhance aqueous solubility: formulation and optimization. J Drug Deliv Sci Technol. 2022;70:103172. doi: 10.1016/j.jddst.2022.103172.
Ramadhan SA, Omer HK. The development of ternary and quaternary solid dispersion-based hydrotropic blends of atorvastatin calcium. Zanco J Med Sci. 2024;28(1):95-110. doi: 10.15218/zjms.2024.010.
Lakumalla D, Podichety N, Maddali R. Design and characterization of glimepiride hydrotropic solid dispersion to enhance the solubility and dissolution. J Appl Pharm Res. 2024;12(2):68-78. doi: 10.18231/j.joapr.2024.12.2.68.78.
Jena D, Mishra K. Hydrotropic technique-assisted UV-spectrophotometric method development and validation for linagliptin in bulk and pharmaceutical dosage form. Res J Pharm Life Sci. 2024 May;5(2):116-21.
Krishnan V, Dhandapani TS, Seenivasan R, Sarvesh R, Sukeshan MP, Saravana Kumar CA. Solubility enhancement of atazanavir by hydrotropic solubilization technique. Int J App Pharm. 2024;16(2):139-45. doi: 10.22159/ijap.2024v16i2.49884.
Sonawane V, Wagh DI, Bhamare SP, Surana KR, Sonawane DD, Mahajan SK. Enhancing water solubility of a BCS CLASS II drug using hydrotropy, mixed solvency, cosolvency and nanosuspension techniques. Prospect Pharm Sci. 2025;23(4):134–41. doi: 10.56782/pps.500.
Qader HL, Abdula TA, Omer HK. Dissolution enhancement of meloxicam tablets from the synergistic effect of hydrotropic and sublimating agent. Polytechnic J. 2021;11(2):100-8. doi: 10.25156/ptj.v11n2y2021.pp100-108.
Rathore UB, Goyal PK. Novel UV spectrophotometer methods for quantitative estimation of empagliflozin (EMPA) and linagliptin (Lina) using mixed hydrotropy solubilization. J Pharm Res Int. 2021;33(58A):620-7. doi: 10.9734/jpri/2021/v33i58A34159.
Patidar M, Maheshwari RK, Agrawal S. Solubility enhancement of indomethacin by forming solid dispersion using mixed hydrotropy. World J Pharm Res. 2022;11(1):1040–7. doi: 10.20959/wjpr20221-22567.
Vlad RA, Pintea A, Coaicea M, Antonoaea P, Redai EM, Todoran N. Preparation and evaluation of caffeine orodispersible films: the influence of hydrotropic substances and film-forming agent concentration on film properties. Polymers. 2023;15(9):2034. doi: 10.3390/polym15092034, PMID 37177181.
Sokac K, Prebeg T, Barbaric J, Zizek K. Improving the release rate of lurasidone hydrochloride from fast disintegrating tablets using green solvent evaporation technique. J Dispers Sci Technol. 2024;45(11):2083-92. doi: 10.1080/01932691.2023.2244591.
Gupta MK, Gupta A, Sharma V, Sharma A, Jaiswal P. Formulation evaluation and optimization of granulating agents on the tablets containing poorly water-soluble anti-HIV drug. Int J Toxicol Pharmacol Res. 2021;11(1):1-8.
Shah N. Solubility and dissolution rate enhancement of poorly soluble telmisartan using hydrotropy method. Asian J Pharm. 2024;18(1). doi: 10.22377/ajp.v18i01.5272.
Ali I, Dubey BK, Basedia DK, Jain PK, Shah S, Thakur VS. Eco-friendly method development and validation for the estimation of fenofibrate and atorvastatin in marketed formulation. Curr Res Pharm Sci. 2024;13(4):167-71. doi: 10.24092/CRPS.2023.130402.