
Int J App Pharm, Vol 18, Issue 2, 2026, 484-493Original Article
QUALITY BY DESIGN-GUIDED WHITE AND GREEN HPLC METHOD FOR THE DETERMINATION OF PROCESS-RELATED IMPURITIES OF ELACESTRANT IN BULK DRUG AND PHARMACEUTICAL FORMULATIONS
VENKATA SAI SURESH KUMAR SISTA, ANJALI JHA*, VLNSH HARI HARAN A.
Department of Chemistry, Institute of Science, GITAM University, Visakhapatnam-530045, (Andhra Pradesh), India
*Corresponding author: Anjali Jha; *Email: ajhamani@gitam.edu
Received: 25 Sep 2025, Revised and Accepted: 11 Dec 2025
ABSTRACT
Objective: The quality by design (QbD) guided, robust, and environmentally sustainable HPLC method was developed for the simultaneous quantification of elacestrant and its process-related impurities.
Methods: The method optimisation uses organic solvent composition, mobile phase pH, and flow rate as critical method parameters. Based on structural features and pKa values of the analytes, separation was achieved on a hypersilgold C18 (250×4.6 mm, 5 µm) column using a green mobile phase of ethanol and 0.1% aqueous formic acid (65:35, v/v) at pH 3.4 at a 0.7 ml/min flow rate, achieving baseline resolution between elacestrant and its close eluting dihydrochloride impurity ( = 3.1) with good symmetry (tailing factor ~1.1) and a total run time of 13 min.
Results: The method validation demonstrates excellent linearity (r²>0.999), accuracy (recoveries 99–101%), precision (RSD<1.5%), and sensitivity (LOQs 0.1–0.2 µg/ml for impurities). The sustainability assessment confirms the strong environmental and operational profile of the method. The AGREE evaluation yields a score of 0.78, whereas the GAPI pictogram displays predominantly green fields, confirming the strong alignment of the proposed method with green analytical chemistry principles. Further, the RGB12 model demonstrates favourable scores of 73.2% (redness), 75.8% (greenness), and 86.7% (blueness) with an integrated whiteness score of 78.3%. These results classify the proposed method as a white analytical procedure.
Conclusion: Collectively, these outcomes confirm that the developed method was not only analytically reliable but also environmentally responsible and economically feasible. Hence, the method was highly suitable for routine impurity profiling and sustainable quality control of elacestrant in pharmaceutical formulations.
Keywords: Elacestrant, Process-related impurities, Green analytical method, QbD approach, RGB profile
© 2026 The Authors.Published by Innovare Academic Sciences Pvt Ltd. This is an open access article under the CC BY license (https://creativecommons.org/licenses/by/4.0/)
DOI: https://dx.doi.org/10.22159/ijap.2026v18i2.56991 Journal homepage: https://innovareacademics.in/journals/index.php/ijap
INTRODUCTION
Elacestrant fig. 1 is a novel, orally bioavailable selective estrogen receptor degrader drug approved for the treatment of estrogen receptor-positive, HER2-negative breast cancer [1]. It exhibitsa unique mechanism of action by promoting degradation of the estrogen receptor and thereby overcoming the resistance mechanisms that often limit the effectiveness of aromatase inhibitors and selective estrogen receptor modulators [2,3]. The commonly reported side effects of elacestrant include nausea, vomiting, constipation, diarrhoea, appetite loss, fatigue, headache, hot flushes, joint pain, and back pain [4]. The therapeutic significance of elacestrant has placed increasing emphasis ondevelopingrobust, reliable, and sustainable analytical methods to ensure its safety, efficacy, and quality in both bulk drug and pharmaceutical formulations.
Process-related impurities, which may arise during drug synthesis, purification, or storage, significantly affect the quality of pharmaceutical products [5]. The regulatory agencies, such as the International Council for harmonisation (ICH), emphasize stringent impurity profiling, particularly for oncology drugs, because these impurities, even at trace levels, can exhibit potential toxicological implications [6]. Hence, the development of a sensitive, accurate, and validated analytical method for the detection and quantification of such impurities was crucial not only for regulatory compliance but also for patient safety [7].
HPLC remains the most widely adopted analytical tool to profile impurities in pharmaceutical compounds due to its versatility, sensitivity, and reproducibility. The conventional HPLC methods rely on hazardous organic solvents that are consumed in large volumes [8]. Their use raises environmental and occupational safety concerns. In recent years, the integration of green analytical chemistry principles into method development has gained momentum, and these methods minimize the ecological footprint of analytical practices without compromising the method performance [9]. The green HPLC method involves the judicious selection of eco-friendly solvents, reduction of solvent consumption, and energy-efficient operational strategies that align with the growing global emphasis on sustainability in pharmaceutical sciences [10].
The application of QbD principles in analytical method development has brought a revolution in pharmaceutical analysis. The QbD offers a systematic, science-and risk-based framework to design a robust analytical method with well-defined objectives and a comprehensive understanding of critical method parameters (CMPs) and critical quality attributes (CQAs). The integration of QbD with green analytical chemistry offers a powerful paradigm to develop a sustainable, high-performance analytical method that meets regulatory expectations that support environmental stewardship [11, 12].
The literature reports the presence of one LC-MS/MS [13] method for quantification of elacestrant. No comprehensive studies combine QbD-based design with green chemistry principles to quantify process-related impurities in both bulk drug and pharmaceutical formulations. This study aimed to address this gap and planned to develop a QbD-driven green HPLC method for the sensitive quantification of elacestrant-related process impurities. The study not only provides a reliable analytical tool for impurity profiling of elacestrantbut also contributes toward sustainable pharmaceutical analysis that ensures compliance, patient safety, and therapeutic efficacy. This is the first QbD-guided HPLC method integrating AGREE, GAPI, and RGB12 tools for elacestrant impurity profiling. The structural details of elacestrant and its process-related impurities selected in the study based on availability were given in fig. 1.
Elacestrant IUPAC Name: (R)-6-(2-(Ethyl(4-(2-(ethylamino)ethyl)benzyl)amino)-4-methoxyphenyl)-5,6,7,8-tetrahydronaphthalen-2-ol |
Amide impurity IUPAC Name: (R)-N-Ethyl-2-(4-((ethyl(2-(6-hydroxy-1,2,3,4-tetrahydronaphthalen-2-yl)-5-methoxyphenyl)amino)methyl)phenyl)acetamide |
Dihydrochloride impurity IUPAC Name: (R)-6-(2-(Ethyl(4-(2-(ethylamino)ethyl)benzyl)amino)4-methoxyphenyl)-5,6,7,8-tetrahydronaphthalen-2-ol dihydrochloride |
Methyl impurity IUPAC Name: (R)-6-(2-(ethyl(4-(2-(ethyl(methyl)amino)ethyl)benzyl)amino)-4-methoxyphenyl)-5,6,7,8-tetrahydronaphthalen-2-ol |
Ethyl impurity IUPAC Name: (R)-6-(2-((4-(2-(diethylamino)ethyl)benzyl)(ethyl)amino)-4-methoxyphenyl)-5,6,7,8-tetrahydronaphthalen-2-ol |
Desethyl impurity IUPAC Name: (R)-6-(2-((4-(2-(ethylamino)ethyl)benzyl)amino)-4-methoxyphenyl)-5,6,7,8-tetrahydronaphthalen-2-ol |
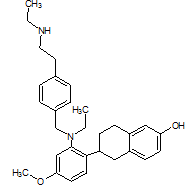
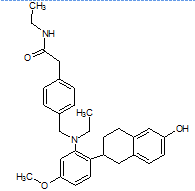
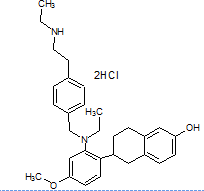
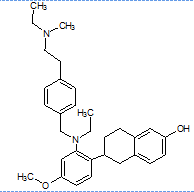
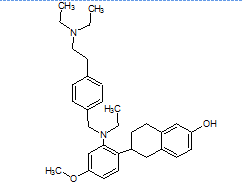
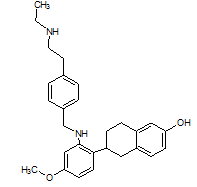
Fig. 1: Structure of elacestrant and impurities in the study
MATERIALS AND METHODS
Reagents and chemicals
The active pharmaceutical ingredient of elacestrant with a purity of 98.75 %, along with its process-related impurities in the study, such as amide, dihydrochloride, methyl, ethyl, and desethyl impurities, as well as the formulation (Orserdu 86 mg), was supplied by enanti labs, Visakhapatnam, India, and was utilized without further purification. The HPLC LiChropur™ grade formic acid and ethanol were purchased from Merck chemicals, Mumbai, India. The purified water utilized in the study was obtained from the Millipore Direct-Q 3UV water purification system [14].
Instrumentation
The chromatographic analysis was performed using a Shimadzu HPLC system (Shimadzu, Kyoto, Japan). This HPLC instrument was equipped with an on-line degasser (DGU-20S5), a binary pump (LC-20AT), a communication bus module (CBM-20A), an autosampler (SIL-20A), a column oven (CTO-10ASVP), and a UV detector (SPD 10Avp) capable of scanning in the range of 190–800 nm. The data acquisition, system control, and processing were carried out through LC Solutions software (version 1.21 SP1).
Chromatographic conditions
The green analytical principles were followed to optimize the method for the reliable resolution of elacestrant along with its process-related impurities. The analysis was performed on Hypersil GOLD C18 (250×4.6 mm, 5 µm) at 25±2 °C temperature. The detection was performed using a UV detector, and chromatograms were recorded at 237 nm. The isocratic elution mode of the mobile phase at 0.7 ml/min was utilized as the mobile phase, which consists of ethanol and 0.1% aqueous formic acid in 65:35 (v/v). The pH of the aqueous solvent phase was adjusted to 3.4 using ammonium acetate (20 mmol). The injection volume was fixed at 10 µl** for all analyses, and the analysis was completed within a13 min run time (including 3 min re-equilibration).
Preparation of standard dilutions
The stock solutions of elacestrant and its impurities were separately prepared at 1000 µg/ml concentration by dissolving 25 mg of each reference standard in 25 ml of ethanol separately. The stability of prepared solutions was ensured by preserving themin a refrigerator at 0 °C. The working solutions were prepared by diluting the stock with deionized water to obtain concentrations in the range of 20 to 140 µg/ml for elacestrant and 0.20 to 1.40 µg/ml for impurities. The calibration standards were made by combining equal volumes of each concentration level separately. Then 10 µl** of each was injected into the HPLC system under the finalized chromatographic conditions. Each concentration level was analyzed in triplicate. The peak areas were plotted against corresponding concentrations to construct calibration curves and regression equations for quantification of analytes in samples.
Preparation of test solution
Twenty tablets of Orserdu (each containing 86 mg of elacestrant) were weighed and were finely powdered with the help of a sterile mortar and pestle. An amount of powder equivalent to one tablet was transferred into a 100 ml volumetric flask containing approximately 70 ml of diluent (ethanol: water, 30:70 v/v). The flask was sonicated for 15 min to dissolve the drug completely in the diluent. The volume in the flask was made up to the mark with the same diluent, and the solution was filtered through a 0.45 µm membrane filter to obtain the test solution. The filtered solution was further diluted to 100 % concentration (86 µg/ml) with the same diluent and was preserved for further analysis.
The impurity-spiked formulation solution was also prepared to assess the effectiveness of the method to resolve and quantify the impurities of elacestrant. In this, known amounts of elacestrant process-related impurities were added to the tablet test solution at the target concentration of 100 % level concentration and were prepared in the same manner as above. The impurities in the unspiked and spiked solutions were analyzed using the proposed method.
Method development
The initial stage of method development involves preliminary checks to establish the solubility, UV absorbance, and basic chromatographic behavior of elacestrants and their process-related impurities. The UV spectral scans in the range of 200-400 nm wavelength were recorded to determine the optimum detection wavelength for the detection of elacestrant and its impurities. The column selection was then performed by performing experiments with different reverse-phase stationary phases at a temperature of 25-35 °C. The mobile phase composition was optimized using ethanol as the organic modifier in accordance with green analytical chemistry principles. The aqueous component of 0.1% formic acid or ammonium formate buffer with a wide pH range was tested to ensure compatibility with analyte stability and column performance.
QbD approach in analytical method development
The accurate and robust quantification of elacestrant and its process-related impurities in bulk drug and pharmaceutical formulations was treated as an analytical target profile (ATP) in the study. The primary objective in the method development was to achieve baseline separation of all impurities with a minimum resolution ( 2) with the possible shortest analysis run time under green analytical conditions. The peak elution time, resolution between analytes, and symmetry were considered as Critical Quality Attributes (CQAs), whereas composition, buffer strength, and column temperature were treated as Critical Method Parameters (CMPs)
Risk assessment
The risk assessment was performed to identify the parameters that affect method performance. The Ishikawa fishbone diagram was utilized to map potential risks, including solvent selection, buffer choice, stationary phase, sample preparation, and detector wavelength. These risks were systematically assessed during method development to minimize variability and ensure robustness.
Screening of CMPs using design of experiments (DoE)
A D-optimal design was employed to screen buffer systems and mobile phase compositions. The green solvents in replacement of conventional acetonitrile and methanol were utilized. The variables such as mobile phase ratio, pH, and temperature (25–40 °C) were assessed. A Hypersil GOLD C18 column (250×4.6 mm, 5 µm) was used for all experiments based on results observed in preliminary screening. The 100 % level standard solution of elacestrant and its known impurities was analyzed to evaluate separation efficiency.
Optimization using response surface methodology (RSM)
The critical factors identified during screening were optimized using a Central Composite Design (CCD). The goal was to maximize resolution between the elacestrant and its structurally similar impurities with minimum run time and solvent consumption. The conditions that exhibit robust method performance were defined by establishing the method operable design region (MODR).
Method validation
The method specificity was established by injecting a100 % level solution of elacestrant and its known impurities into the HPLC system. This test ensures that all peaks were well resolved without interference from excipients. The method linearity was evaluated by preparing various concentration levels for elacestrant contains 1 % of each impurity. The analytical range that exhibits good correlation between peak area and concentration was treated as analytical range of the method. The method precision was assessed through intra-day and inter-day studies at a single concentration in triplicate and the result was expressed as %RSD. The method accuracy was checked by performing recovery studies at three concentration levels (50%, 100%, and 150% of target concentration) using spiked samples of elacestrant and its impurities. The method sensitivity was assessed in terms of limit of detection (LOD) and limit of quantification (LOQ) based on signal-to-noise ratio under the optimized chromatographic conditions. The method robustness was proved by making small deliberate changes in flow rate, detection wavelength and composition of mobile phase. The standard solution of elacestrant with its known impurities was analyzed in this study to ensure consistency of results. The method applicability was assessed by injecting the formulation solution without impurities spiked and with impurities spiked in the proposed method. The resultant chromatograms and chromatographic results were verified to ensure the applicability of method for the quantification of elacestrant and its impurities.
Assessment of method greenness
The environmental impact and sustainability of method proposed for the analysis of elacestrant and its known impurities was assessed by adopting two widely recognized tools, such as Analytical GREEnness (AGREE) metric and the Green Analytical Procedure Index (GAPI). The AGREE tool evaluates compliance with the twelve principles of green analytical chemistry. This tool provides score between 0.00 and 1.00 at the center of a radar chart. The score above 0.75 was treated as highly sustainable, whereas the score between 0.50 and 0.75 indicates acceptable performance and the score of less than 0.50 suggest that the method need significant improvement. Similarly, the GAPI tool assess different aspects of the method, such as sample preparation, solvent and reagent use, energy demand, waste generation, and overall environmental footprint. This test result represents a color-coded pentagonal diagram in which green represents low impact, whereas yellow indicates moderate concerns and red highlights the areas that requires further optimization. The summary of these evaluations provides a comprehensive view of the method greenness and confirms its suitability as a sustainable analytical approach [15].
Assessment of method whiteness
The overall method sustainability was further assessed through RGB 12 algorithm. This algorithm combines three key dimensions of an analytical procedure such as red that deals with analytical performance of method, green for environmental impact, and blue for practical and economic efficiency of method. This tool considers the twelve criteria, such as method simplicity, speed, cost, energy use, waste generation, safety of solvents, and overall analytical reliability. This tool gives score for each parameter and the combination of these results are presented in a three-color (RGB) profile. The integration of these three scores provides a single "whiteness" score. This score reflects the balance between analytical efficiency, environmental friendliness, and practical applicability. The algorithm was applied to the optimized method conditions, and the whiteness value was obtained to support the greenness evaluation results from AGREE and GAPI [16, 19].
RESULTS
The structural features and pKa values of elacestrant and its impurities were considered while selecting the stationary phase for resolution of these compounds. All analytes contain basic nitrogenous functionality with pKa value in the range of 5.76–7.60. Hence the acidic mobile phase pH was chosen for the study because in acid pH, the basic analytes exhibit reduced hydrophobicity and increased polar character. The resolution of these compounds requires a column that balances hydrophobic retention with minimal secondary silanol interactions was required. The reversed-phase, end-capped Hypersil GOLD C18 (250×4.6 mm, 5 µm) was therefore selected. The long C18 chain provides sufficient hydrophobic retention to separate the more nonpolar methyl and ethyl analogues, whereas the end-capping suppresses undesirable ionic interactions with residual silanols that would otherwise broaden peak for protonated analytes.
The analytes possess a narrow pKa range, which suggests that the analytes could undergo partial ionization under neutral conditions. This ionization reduces the retention and cause peak tailing on a C18 stationary phase. In order to overcome this, the aqueous component of the mobile phase was acidified and buffered at pH 3.4 using 20 mmol ammonium acetate with 0.1% formic acid. This ensures the complete protonation of the basic moieties and thereby improves peak symmetry and minimizes the secondary interactions with residual silanol groups. The ethanol was chosen as the organic modifier instead of acetonitrile or methanol because ethanol is a greener solvent with reduced toxicity and satisfactory elution strength. The composition of ethanol and aqueous buffer displays an optimal balance between analyte retention and resolution of closely eluting impurities. The flow rate was optimized at 0.7 ml/min to achieve suitable run time without excessive backpressure and ensures efficient mass transfer and sharp peak shapes. The summary of method optimization study was tabulated in table 1 and corresponding optimization chromatograms were presented in fig. 2.
Table 1: Method optimization performed for the analysis of elacestrant and its impurities
| S. No. | Method condition | Result observed | Method status |
| 1 | Equal volume of ethanol and 0.1 % formic acid at 1.0 ml/min, Kromasil C18 (150 mm) column and 237 nm wavelength | There is no proper resolution of analytes was noticed in this condition and the chromatogram display only three peaks correspond to elacestrant and its impurities in the study (fig. 2A) | Rejected |
| 2 | Equal volume of ethanol and 0.1 % formic acid at 1.0 ml/min, Kromasil C18 (250 mm) column and 237 nm wavelength | The increase of column length doesn’t influence the separation of analytes. Chromatographic response was noticed to be similar to the 100 mm column. | Rejected |
| 3 | Ethanol and 0.1 % formic acid in 75:25 (v/v) at 1.0 ml/min, Prontosil C18 (250 mm) column and 237 nm wavelength | The change in column configuration and mobile phase composition doesn’t influence the separation of analytes and proper resolution was not observed in this condition. | Rejected |
| 4 | Ethanol and 0.1 % formic acid in 75:25 (v/v) at 0.7 ml/min, Hypersil GOLD C18 (250 mm) column and 237 nm wavelength | The resolution of analytes was observed in this condition. Only single peaks observed for dihydrochloride impurity and standard. The resolution between desethyl and amide impurity peaks was noticed to be very less (fig. 2B) | Rejected |
| 5 | Ethanol and 0.1 % formic acid at pH 2.5 in 25:75 (v/v) at 0.7 ml/min, Hypersil GOLD C18 (250 mm) column and 237 nm wavelength | The pH variation in mobile phase greatly influences the resolution of analytes. In this, peaks correspond to all analytes was noticed but the peak intensity and area response of identified peaks was noticed to be very poor (fig. 2C) | Rejected |
| 6 | Equal volume of ethanol and 0.1 % formic acid at pH 3.0 at 0.7 ml/min, Hypersil GOLD C18 (250 mm) column and 237 nm wavelength | This condition produces well-resolved and retained peaks for elacestrant and its impurities. Broad peaks with poor symmetry were noticed for the peak corresponds to dihydrochloride impurity suggest that this method needs further improvement fig. 2D | Accepted and further utilized for software-based method optimization |
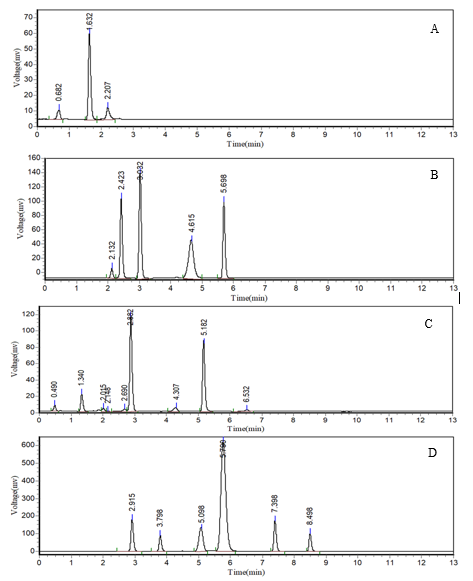
Fig. 2: Chromatograms obtained during the optimization steps of the HPLC method for the analysis of elacestrant and its process-related impurities
QbDaided method optimization
The method optimization for elacestrant and its process-related impurities was further performed by utilizing QbD framework and the study was performed on Design-Expert® software (version 11). A central composite design (CCD) that comprises of 20 experimental runs (8 factorial points, 6 axial points, and 6 center points) was employed to evaluate the influence of three independent factors on the chromatographic responses. The quadratic model was constructed to evaluate the effects of CMPs such as organic solvent composition, mobile phase pH, and flow rate on CQAs such as the resolution between elacestrant and its dihydrochloride impurity and the tailing factor of the dihydrochloride impurity. The experimental factors and their corresponding low and high levels used in the DoE study are summarized in table 2. The model display statistically significant (F = 2.95, p = 0.0483) response for resolution confirms that the selected factors had a measurable influence on chromatographic performance. The Low residual error of 0.0800 was noticed with an absence of pure error indicate that the experimental design was adequate and produce reliable predictions.
Table 2: Factors and their corresponding levels for method optimization utilized in the DoE study
| Factor | Name | Units | Type | Minimum | Maximum | Coded low | Coded high | Mean | Std. Dev. |
| A | Organic solvent composition | ml | Numeric | 60.00 | 70.00 | -1 ↔ 60.00 | +1 ↔ 70.00 | 65.00 | 3.63 |
| B | pH of mobile phase | Numeric | 3.00 | 3.80 | -1 ↔ 3.00 | +1 ↔ 3.80 | 3.40 | 0.2902 | |
| C | Flow rate of mobile phase | ml/min | Numeric | 0.5000 | 0.9000 | -1 ↔ 0.50 | +1 ↔ 0.90 | 0.7000 | 0.1451 |
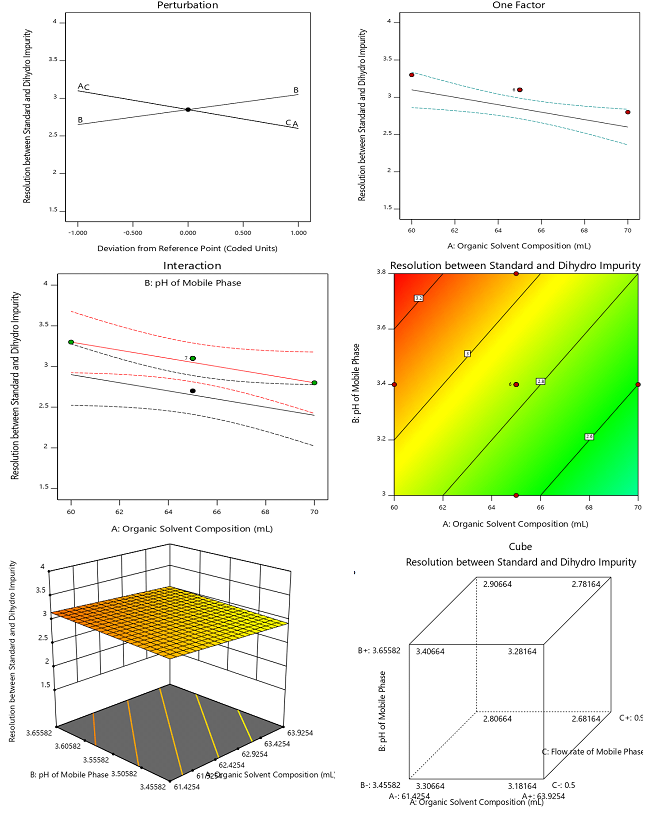
Fig. 3: DoE-based evaluation of chromatographic resolution between elacestrant and its dihydrochloride impurity, A) Perturbation plot shows the relative effect of organic solvent composition (A), mobile phase pH (B), and flow rate (C) on resolution; B) One-factor plot illustrates the influence of organic solvent composition on resolution; C) Interaction plot shows the combined effect of organic solvent composition and mobile phase pH; Contour plot (D), 3D surface plot (E) and Cube graph that represents the effect of solvent composition and pH on resolution, highlighting the optimal region
The graphing results suggest that the composition of organic solvent (Factor A) significantly affects the resolution (p = 0.0162). The increasing in organic solvent ethanol content beyond 65% decreases the resolution due to faster elution and reduced interaction with the stationary phase. The reduction in organic phase improves the resolution but negatively impacts the peak symmetry. The mobile phase pH (Factor B) also significant (p = 0.0451) with resolution deterioration at lower pH (~3.0)and higher pH (~3.8) values. The optimum performance was observed at pH 3.4 and provides the best compromise between separation and peak shape. The flow rate (Factor C) also exerts a similar significant influence (p = 0.0162). The reduction in flow rate improves resolution due to longer analyte-stationary phase interaction but this compromises the peak symmetry as well as elution time. The increase in flow rate to 0.9 ml/min causes partial co-elution. The optimal flow rate of 0.7 ml/min balances the separation efficiency and analysis throughput. The interaction terms (AB, AC, BC) were statistically insignificant and indicates that each factor influences the resolution independently. Fig. 3 presents the results observed during the DoE-based evaluation of chromatographic resolution between elacestrant and its dihydrochloride impurity.
The quadratic model for the resolution response demonstrates an  of 0.912 and an adjusted of 0.893. These values indicate that the model explains the majority of variability in the experimental data. The predicted of 0.856 suggests strong predictive capability for new observations confirms that the model reliably represents the relationship between CMPs and the resolution. Furthermore, the adequate precision value of 15.3, well above the threshold of 4, indicates a robust signal-to-noise ratio, demonstrating that the model can be confidently used to navigate the design space and optimize chromatographic performance.
The ANOVA results observed for the influence of CMPs (organic solvent composition, mobile phase pH, and flow rate) on CQAs such as the tailing factor of dihydrochloride impurity indicate that pH is the most critical determinant (p = 0.0159) than solvent composition and flow rate. The graphical outputs corroborated these findings as the perturbation plot demonstrates the steepest slope for pH conform its dominant role. The solvent composition and flow rate contribute modestly. The interaction terms were insignificant and were in alignment with the independence observed in resolution outcomes. The one-factor and interaction plots confirm that tailing was decreased with higher ethanol concentrations. The contour and surface plots prove that 65–68% ethanol composition at pH 3.0–3.2 was optimal to produce best symmetry with tailing factor very close to 1.0. Fig. 4 presents the results observed during the DoE-based evaluation of chromatographic tailing response of dihydrochloride impurity of elacestrant.
The quadratic model for the tailing factor response of the dihydrochloride impurity demonstrates an of 0.897 and an adjusted of 0.874. This result indicates that the model accounts for a high proportion of variability in the data. The predicted of 0.842 confirms strong predictive capability suggest that the model can reliably estimate tailing factor outcomes for new experimental conditions. Additionally, the adequate precision value of 14.6, well above the threshold of 4, reflects a robust signal-to-noise ratio and ensures that the model is suitable for exploring the design space and optimizing chromatographic conditions to achieve acceptable peak symmetry.
In summary, the DoE study demonstrates that resolution was reported to be best optimized under conditions of 65% ethanol, pH 3.4, and 0.7 ml/min. This condition ensures a resolution of 3.1 and symmetry within ICH acceptance criteria (tailing<2.0). This study establishes a robust MODR and ensures compliance with green analytical chemistry principles through the use of ethanol-based mobile phases.
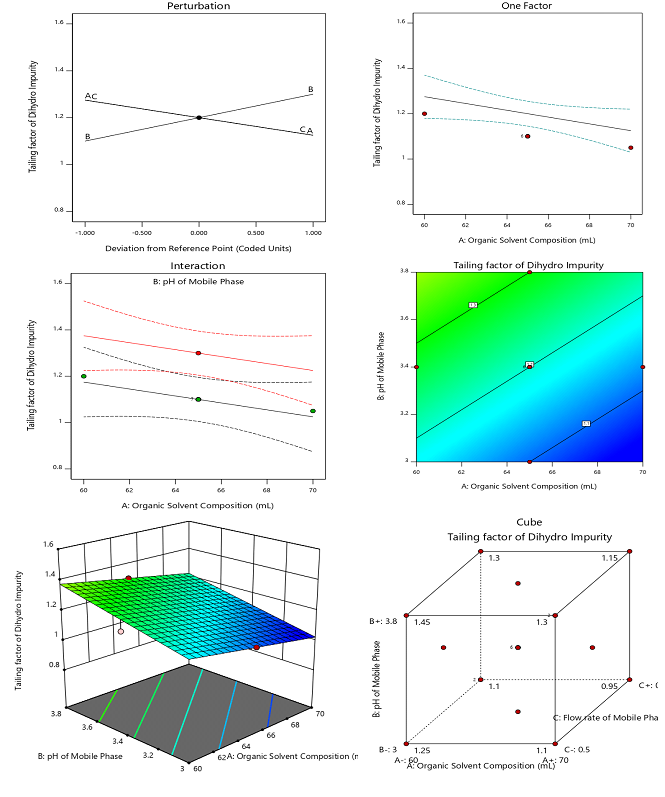
Fig. 4: DoE-based evaluation of chromatographic tailing factor of dihydrochlorideimpurity of elacestrant in the study, A) Perturbation plot shows the relative effect of organic solvent composition (A), mobile phase pH (B), and flow rate (C) on tailing of dihydrochloride impurity; B) One-factor plot illustrates the influence of organic solvent composition on tailing of dihydrochloride impurity; C) Interaction plot shows the combined effect of organic solvent composition and mobile phase pH ontailing of dihydrochloride impurity; The contour plot (D), 3D surface plot (E) and Cube graph that represents the effect of solvent composition and pH on tailing of dihydrochloride impurity
The developed and optimized green chromatographic method for the analysis of elacestrant and its process-related impurities demonstrates satisfactory separation and analytical performance. The elacestrant was elutes at a retention time (RT) of 5.7 min whereas its impurities were well resolves with an RT of 3.7 min for the amide impurity (RRT = 0.65), 5.2 min for the dihydrochloride impurity (RRT = 0.91), 7.3 min for the methyl impurity (RRT = 1.28), 8.4 min for the ethyl impurity (RRT = 1.47), and 2.8 min for the desethyl impurity (RRT = 0.49). The absence of these peaks’ blank chromatograms (fig. 5) confirms the method’s specificity. The system suitability evaluation demonstrates that the method display consistent performance of the chromatographic system with theoretical plate counts exceeds 4000 for all analytes and this reflects the good column efficiency. The tailing factor for elacestrant and its impurities was observed to be less than 1.5 indicate the acceptable peak symmetry, whereas the resolution between elacestrant and its nearest eluting impurities was consistently greater than 2.0 confirm that the method exhibit adequate separation and reliability of quantification under the selected conditions.
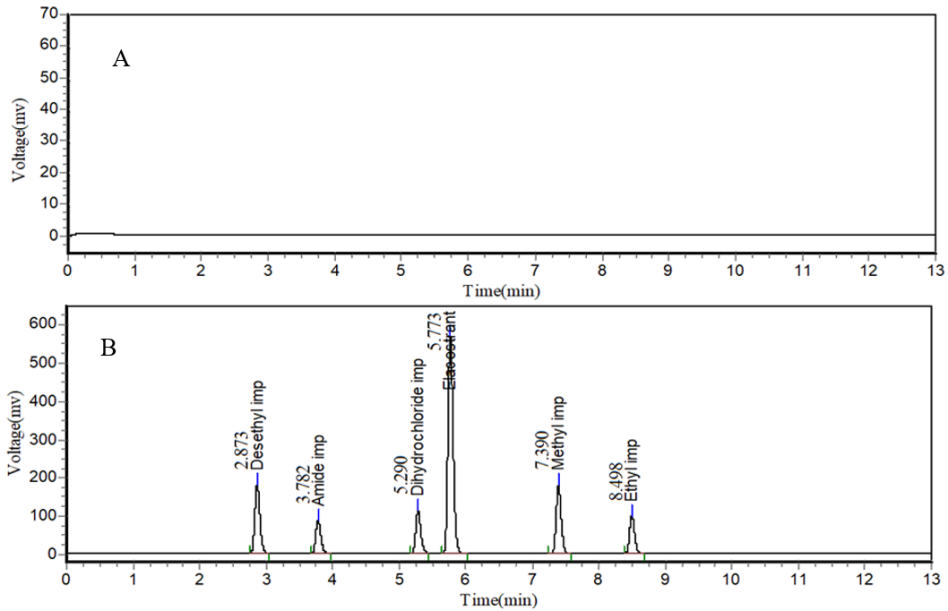
Fig. 5: Representative HPLC chromatograms of elacestrant and its process-related impurities under optimized conditions, A) Blank chromatogram of elacestrant and its process-related impurities in the optimized chromatogram that doesn’t display any chromatographic detection; B) standard chromatogram of elacestrant and its process-related impurities under optimized HPLC conditions shows baseline separation and acceptable peak symmetry
Method validation
The method demonstrates excellent linearity for elacestrant and its process-related impurities across the studied concentration range. The elacestrant shows linearity between 20-140 µg/ml, whereas its impurities exhibit linear responses over 0.2-1.4 µg/ml concentration range. The correlation coefficients () were greater than 0.999 for all analytes indicates that the method produce highly reliable calibration curves. The slope and intercept of achieved linear curves was consistent with the expected response confirms that the method exhibit enough sensitivity and linear proportionality of detector response against concentration of analyte. The precision was evaluated in terms of repeatability (intra-day), intermediate precision (inter-day), and ruggedness. The intra-day precision (%RSD) values were consistently below 1.0% in the range of 0.23% to 0.60% for impurities and 0.55% for elacestrant. These result excellent repeatability of proposed method. The inter-day precision values were also observed to be in the level of 0.18% to 0.83%, with elacestrant at 1.33%, confirms the method reproducibility across days. The ruggedness results display %RSD values of less than 1.0% (0.17–0.69%). This result indicates that the method was consistency under varied conditions such as different analysts. The method robustness was proved by deliberately varying critical method parameters such as organic solvent composition ( 2%), detector wavelength (2 nm), and flow rate (0.1 ml/min). The results tabulated in table 3 prove that the minor changes did not produce any significant variation in retention time, resolution, or tailing factor. The result indicates that indicating that the method performance remains consistent under slightly altered conditions.
Table 3: Robustness observed for method developed for the analysis of elacestrant and its impurities
| S. No. | Robustness condition | % change in peak area of elacestrant | RT of elacestrant | Resolution between dihydrochloride impurity and elacestrant | Tailing factor of dihydrochloride impurity |
| 1 | +change in % organic solvent in mobile phase | 0.04 | 5.790 | 3.12 | 1.11 |
| 2 | -change in % organic solvent in mobile phase | 0.14 | 5.791 | 3.07 | 1.10 |
| 3 | +change in wavelength | 0.28 | 5.798 | 3.08 | 1.09 |
| 4 | -change in wavelength | 0.36 | 5.782 | 3.09 | 1.11 |
| 5 | +change in flow rate | 0.45 | 5.745 | 3.08 | 1.09 |
| 6 | -change in flow rate | 0.54 | 5.782 | 3.09 | 1.10 |
The method accuracy was established by performing recovery studies at 50%, 100%, and 150% spiking levels. The % recoveries in the range of 99.57%-100.20% was noticed at 50% level, whereas in 100 % level the range was noticed from 99.93% to 100.28%, and at the 150% level, recoveries varies in between 99.90% and 101.37%. The recoveries of all analytes in three studied levels were observed to be within the acceptable range of 98–102%. The low standard deviations observed in all recovery studies further confirm the method reliability. The method demonstrates high sensitivity for the detection of impurities. The LOD was observed as 0.030 µg/ml for desethyl and ethyl impurities, 0.045 µg/ml for methyl impurity, and 0.060 µg/ml for amide and dihydrochloride impurities. The LOQ was calculated as 0.100 µg/ml for desethyl and ethyl impurities, 0.150 µg/ml for methyl impurity, and 0.200 µg/ml for amide and dihydrochloride impurities. These values confirm that the method possesses enough capability to detect and quantify trace levels of impurities with high reliability. The summary of validation results was tabulated in table 4.
The solution stability study was conducted to verify the stability of stock and working solutions of elacestrant and its process-related impurities under laboratory conditions. The stock and working solutions were stored at room temperature (25±2 °C) and refrigerated conditions (4±2 °C) and were analysed immediately after preparation (0 H), after 24 h, and 48 h. The percentage change in peak area was calculated by comparing the response at each interval with the initial response (0 h). The results shows that the percentage change in analyte peak area was within 2% for elacestrant and all impurities under both storage conditions confirms that there no significant degradation or loss in response. Hence solutions were found to be stable for at least 48 h for routine analytical use.
The applicability of the developed HPLC method was further assessed by performing the formulation analysis using elacestrant tablets. The chromatogram of the formulation sample displays a single, sharp peak corresponds to elacestrant at its expected retention time, with no additional interfering peaks. The assay of the formulation was calculated to be greater than 98% of the labelled claim indicates that the method was accurate and reliable for routine potency determination. The capability of method to detect impurities was further assesses by spiking the formulation solution with known process-related impurities. The chromatogram observed for spiked solution shows well-resolved peaks for each impurity at their respective retention times, with satisfactory separation from the main drug peak. These findings confirm that the method was suitable not only to quantify elacestrant but also suitable to resolve and detect its related impurities in commercial formulations.
Table 4: Summary of validation results observed for method developed for the analysis of elacestrant and its impurities
| S. No. | Test | Parameter | Results observed |
| Elacestrant | |||
| 1 | Linearity | Range (µg/ml) | 20-140 |
| 2 | Slope | 38306 | |
| 3 | Intercept | 31352 | |
| 4 | Correlation coefficient | 0.9997 | |
| 5 | Repeatability (% RSD)a |
Intra-day precision | 0.55 |
| 6 | Intermediate Precision (% RSD)a | Inter-day precision | 1.33 |
| 7 | Ruggedness | 0.33 | |
| 8 | Recovery/Accuracy (% recovery)b | 50 % spiked level | 100.20±0.240 |
| 9 | 100 % spiked level | 100.28±0.562 | |
| 10 | 150 % spiked level | 101.37±0.577 | |
| 11 | Sensitivity (µg/ml) | LOD | --- |
| 12 | LOQ | --- |
Results presented as average of n=6 (a) replicate experiments and average±standard deviation of n=3 (b) replicate experiments
A B
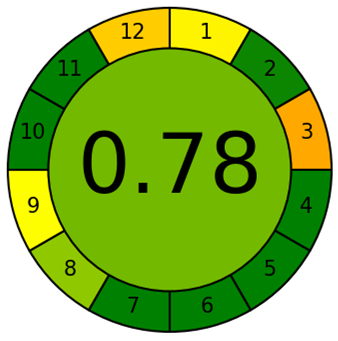
Fig. 6: The greenness evaluation of the proposed HPLC method for elacestrant and its process-related impurities using complementary tools, AGREE pictogram (A) shows an overall score of 0.78 and this indicates high compliance with the principles of green analytical chemistry whereas GAPI pictogram (B) highlights predominantly green fields with a few yellow zones confirms the environmental acceptability of the method
Assessment of method greenness
The greenness of proposed HPLC method was assessed using the AGREE evaluation tool and this tool yields an overall score of 0.78 fig. 6A This value reflects a high level of compliance with the principles of Green Analytical Chemistry and confirms that the method is significantly more sustainable than conventional approaches that relay on acetonitrile or methanol. The use of ethanol as a greener organic solvent, short analysis time, minimal sample preparation, and energy-efficient UV detection supports the high green score of the proposed method. However, it is important to acknowledge that ethanol, while environmentally benign and renewable, is inherently flammable and poses minor occupational safety risks. Adequate laboratory precautions, such as proper ventilation and prevent exposure to ignition sources, are therefore essential during routine analysis. The limitations such as solvent waste generation inherent due to isocratic HPLC pump, energy consumption of LC system and flammability of ethanol contribute the slight reduction in the overall score. Similarly, the GAPI evaluate 15 criteria across the entire analytical workflow and produce result in the form of pictogram. The pictogram fig. 6B display predominantly green fields with only a few yellow zones suggest the compliance of method greenness. In summary, the GAPI and AGREE results demonstrate that the proposed method achieves a favorable balance between analytical performance and environmental sustainability that makes it suitable for routine quality control of elacestrant and its impurities under green chemistry guidelines.
Assessment of method whiteness
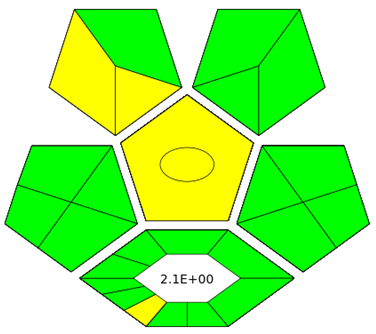
The sustainability of proposed method was further comprehensively assessed through RGB12 model. This model integrates the analytical performance (redness), environmental and safety aspects (greenness), and practical efficiency (blueness) of the developed method. This RGB12 algorithm quantifies each dimension using defined numerical criteria scuh as precision, accuracy, linearity, sensitivity in analytical performance (redness), solvent toxicity, waste volume, energy demand, and operator safety in environmental impact (greenness), and analysis time, sample consumption, and operational cost in practical efficiency (blueness). The method demonstrates excellent analytical performance with high precision (RSD 0.53%), accuracy (RSD 0.54%), and linearity (= 0.9997). This impressive analytical performance collectively produces a redness score of 73.2%. The greenness evaluation, based on solvent use (350 ml), waste generation (290 ml), and absence of occupational hazards, yields green score of 75.8%. This green score supports the AGREE score of 0.78 and the GAPI pictogram. The practical and economic efficiency was also favourable with acceptable sample consumption and results of the blueness score is 86.7%. The integration of these three dimensions produces a final whiteness score of 78.3% and the score qualify the method as a “White” analytical method fig. 7 the result confirms that the method effectively balances analytical reliability, environmental responsibility, and cost-effectiveness. The strong correlation between RGB12, AGREE, and GAPI outcomes demonstrates that the method is not only green but also white and reinforces its suitability for sustainable routine analysis of elacestrant and its impurities.
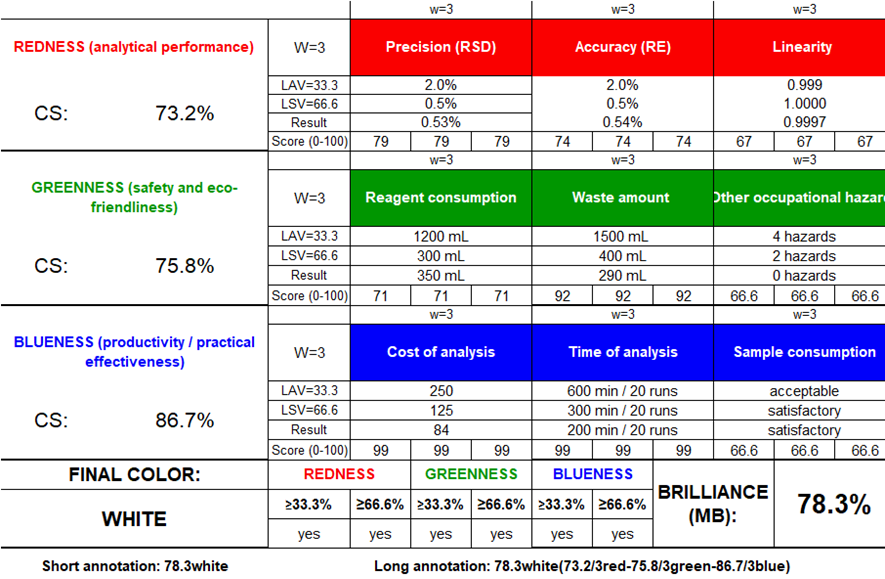
Fig. 7: RGB12 whiteness evaluation of the proposed HPLC method for elacestrant and its process-related impurities
DISCUSSION
This study successfully established a rapid, robust, and eco-friendly HPLC method for the simultaneous determination of elacestrant and its process-related impurities in bulk drug and formulations. The method development was guided by the ionization behaviour of the analytes and the acidic pH was proved to be essential for the resolution of analytes. The Hypersil GOLD C18 column with ethanol–buffer mobile phase at pH 3.4 was observed to be optimal for the best retention, peak symmetry, and baseline resolution of analytes. The flow rate of 0.7 ml/min offers best balance between analysis time, peak shape, and system pressure. The QbD-assisted optimization further strengthens the reliability of method. The CCD model produce strong predictability (R² = 0.912; predicted R² = 0.856) proves that organic solvent composition, pH, and flow rate were the critical determinants of chromatographic resolution. All impurities were consistently resolved with Rs>2.0 and high theoretical plate counts and excellent peak symmetry.
The method validation confirms the high analytical performance. The method exhibits excellent linearity (R²>0.999), precision (RSD<1%), accuracy (98–102% recovery). The low LOD/lOQ values were observed for the impurities in the proposed method that enables the trace-level impurity quantification. The method application to commercial tablets yields an assay of more than>98% with no interference. The spiked impurities were well resolved in formulation solution proves the suitability of method for routine QC analysis.
The environmental assessment shows that the method was not only analytically strong but also highly sustainable. The AGREE score of 0.78 and GAPI pictogram with predominantly green zones highlights the compliance of method with GAC principles. The RGB12 evaluation further confirms the strong performance with redness (73.2%), greenness (75.8%), and blueness (86.7%) scores. The resultant whiteness score of 78.3% classifies the method as a “white” analytical method.
In comparison, only one analytical method was reported by Subhashini et al., 2025 [13] for the quantification of elacestrant using UPLC-MS/MS. However, no chromatographic method reported for the separation or quantification of elacestrant process-related impurities in bulk drug or formulations. In comparison to reported UPLC-MS/MS procedure [13], this study offers several significant advantages such that this method provides the first comprehensive impurity-profiling method for elacestrant by employing green ethanol-based mobile phase instead of acetonitrile or methanol. Further, the integration of QbD-based optimization, detailed validation, and green-chemistry assessment positions this method as a more holistic and sustainable analytical approach than the limited plasma-analysis method available in literature.
CONCLUSION
A QbD-based strategy was successfully utilised to create a reliable, accurate, and environmentally friendly HPLC method for quantifying elacestrant and its process related impurities. The method used a Hypersil GOLD C18 column (250×4.6 mm, 5 µm) with 65% ethanol and 0.1% formic acid (pH 3.4) as the mobile phase at 0.7 ml/min. It got baseline resolution ( = 3.1) in 13 min at 237 nm. Validation results showed that the method had great linearity (
 >0.999), accuracy (99–101%), precision (RSD<1.5%), and sensitivity (LOQ 0.1–0.2 µg/ml). The greenness assessment indicated robust sustainability, evidenced by an AGREE score of 0.78, predominantly green GAPI zones, and a high RGB12 whiteness score of 78.3%. So, the method that was created is not only legal for impurity profiling of elacestrant, but it is also a model for green and QbD-based analytical developments.
FUNDING
There is no finding for the work
AUTHORS CONTRIBUTIONS
VSSKSK: Conceptualization, data acquisition, analysis, interpretation, writing-original draft; Data alignments and design of the fig. and table of the paper; AJ: Overall Supervision, Critical evaluation, Review and editing; VHHA: Helped to analyse and collect data for the paper.
CONFLICT OF INTERESTS
There is no conflict of interest
REFERENCES
Valenza C, Trapani D, Bidard FC, Gligorov J, Cortes J, Turner N. Elacestrant in ESR1-mutant endocrine-responsive metastatic breast cancer: should health authorities consider post hoc data to inform priority access? ESMO Open. 2024;9(9):103701. doi: 10.1016/j.esmoop.2024.103701, PMID 39232441.
Lloyd MR, Wander SA, Hamilton E, Razavi P, Bardia A. Next-generation selective estrogen receptor degraders and other novel endocrine therapies for management of metastatic hormone receptor-positive breast cancer: current and emerging role. Ther Adv Med Oncol. 2022;14:17588359221113694. doi: 10.1177/17588359221113694, PMID 35923930.
Bihani T, Patel HK, Arlt H, Tao N, Jiang H, Brown JL. Elacestrant (RAD1901), a selective estrogen receptor degrader (SERD), has antitumor activity in multiple ER+ breast cancer patient-derived xenograft models. Clin Cancer Res. 2017;23(16):4793-804. doi: 10.1158/1078-0432.CCR-16-2561, PMID 28473534.
Garner F, Shomali M, Paquin D, Lyttle CR, Hattersley G. RAD1901: a novel orally bioavailable selective estrogen receptor degrader that demonstrates antitumor activity in breast cancer xenograft models. Anti-Cancer Drugs. 2015;26(9):948-56. doi: 10.1097/cad.0000000000000271, PMID 26164151.
Lakshmana Prabu S, Suriyaprakash TN. Impurities and its importance in pharmacy. Int J Pharm Sci Rev Res. 2010;3(2):66-71.
ICH Guideline Q3C (R5) guideline for residual solvents impurities. EMA/CHMP/ICH/82260/2006; 2011.
Nanda BP, Rani P, Bhatia R. Unexplored drug combinations for analytical method development by HPLC. J Chromatogr Open. 2024;5:100123. doi: 10.1016/j.jcoa.2024.100123.
Ravinder B, Hemant KT, Vijay Srinivas P, Likhitha A, Sambasiva Rao T, Naveena G. Analytical quality by design approach in RP-HPLC method development for the quantification of mirabegron and solifenacin succinate in pharmaceutical formulation. Lett Appl Nanobiosci. 2024;14(1):1-12. doi: 10.33263/lIANBS141.048.
Wu J, Yu H, Cao N, Zhang J, Khan J, lee D. Ecological footprint analysis as a tool for advancing sustainable development goals (SDGs): evidence from China. Ecol Indic. 2025;176:113653. doi: 10.1016/j.ecolind.2025.113653.
Cahide TEL-Inci Kazkayasi Gokçen TELLI B. Higher alpha-synuclein aggregate density does not lead to more severe dopaminergic cell loss in the aav-mediated over-expression model of parkinson’s disease: a time-course study. JRP. 2021;25(3):352-8. doi: 10.29228/jrp.25.
Prasad SS, Kasimala BB, Anna VR. QbD based analytical method development and validation for the separation and quantification of agomelatine and its impurities in solid oral dosage forms using HPLC. RJC. 2021;14(4):2183-90. doi: 10.31788/RJC.2021.1446426.
Saini S, Kaur R, Kaur R, Gulati M, Singh B, Hussain A. QbD and green metric based HPLC method development and validation of bromocriptine mesylate in bulk product and biological samples. J Chromatogr B. 2025;1258:124566. doi: 10.1016/j.jchromb.2025.124566.
Subhashini K, Giri Prasad G, Rudraraju Ramesh R, Musunuri S. Quantitative analysis of Elacestrantin pharmaceutical dosage forms by ultra-performance liquid chromatography-mass spectrometry with emphasis on stability assessment. Asian J Pharm Clin Res. 2025;18(7):185-97. doi: 10.22159/ajpcr.2025v18i7.54496.
Tummala SR, Amgoth KP. Development of GC-MS/MS method for simultaneous estimation of four nitrosoamine genotoxic impurities in valsartan. Turk J Pharm Sci. 2022;19(4):455-61. doi: 10.4274/tjps.galenos.2021.17702, PMID 36047600.
Bhupatiraju RV, Peddi P, Edla S, Rekha K, Kasimala BB. Green analytical approach for HPLC method development for quantification of sorafenib and its pharmacopeia impurities: LC–MS/MS characterization and toxicity prediction of stress degradation products. Sep Sci Plus. 2024;7(9):e202400106. doi: 10.1002/sscp.202400106.
Veerendra YV, Brahman PK, Mankumare SD, Ch J, C VK. Evaluation of analytical greenness metric for an eco-friendly method developed through the integration of green chemistry and quality-by-design for the simultaneous determination of nebivolol hydrochloride telmisartan valsartan and amlodipine besylate. Heliyon. 2024;10(16):e35376. doi: 10.1016/j.heliyon.2024.e35376, PMID 39220975.
Nowak PM, Wietecha Posluszny R, Pawliszyn J. White analytical chemistry: an approach to reconcile the principles of green analytical chemistry and functionality. TrAC Trends Anal Chem. 2021;138:116223. doi: 10.1016/j.trac.2021.116223.
Charyulu KV, Charyulu RN, Chandran SP, Patil P, Jose J. Quality by design (QBD) approach for optimization of mangiferin-loaded nanoparticles for the safe and effective treatment of breast cancer. Int J Appl Pharm. 2025;17(5):146-58. doi: 10.22159/ijap.2025v17i5.54215.
Yalla K, Pawar AK, Manda K. A greenness evaluated bioanalytical method for quantification of sparsentan in rat plasma and its application to pharmacokinetic studies by LC-MS. Int J Appl Pharm. 2025;17(5):168-80. doi: 10.22159/ijap.2025v17i5.54341.