
Int J App Pharm, Vol 18, Issue 2, 2026, 200-210Original Article
COMPARATIVE STUDY OF ETHOSOMES AND PHARMACOSOMES AS A PROMISING APPROACH FOR IMPROVING DAPSONE AND CLOXACILLINE TRANSDERMAL ANTI-LEPROTIC ACTIVITY: IN VITRO AND IN VIVO STUDIES
PRIYANKA MAURYA*, TAPASVI GUPTA, RITU GILHOTRA
Suresh Gyan Vihar University, Jaipur, Rajasthan, India
*Corresponding author: Priyanka Maurya; *Email: priyankamauryapharma@gmail.com
Received: 27 Oct 2025, Revised and Accepted: 22 Dec 2025
ABSTRACT
Objective: This study aimed to develop and evaluate a vesicular gel system for the topical delivery of dapsone and cloxacillin with the goal of enhancing drug permeation, sustaining release within the skin, and improving wound healing efficacy.
Methods: Gel were prepared and characterized for particle size, (PDI) Polydispersity index, zeta potential, and encapsulation efficiency. Optimized formulations F3 and P5 were further subjected to (FTIR) Fourier transform infrared spectroscopy, (SEM) Scanning electron microscopy, and (TEM) Transmission electron microscopy analyses to confirm FTIR and vesicle morphology. In vitro drug release of G3 and G5, skin irritation testing, stability studies, and in vivo wound healing evaluations were performed.
Results: F3 and P5 showed favorable Nano scale vesicle characteristics (116.3 nm and 110.6 nm; PDI: 0.32 and 0.36; zeta potential: –21.7 mV and –30.6 mV; encapsulation efficiency: 71.91% and 73.95%). The gels G3 and G5 demonstrated desirable physicochemical properties (pH ~7.0, high drug content of 76.88% and 83.54%, viscosity 45.223 cps and 40.154 cps, and superior spreadability). In vitro release studies confirmed biphasic sustained release, with G3 showing the highest cumulative release (88.68% over 24 h). Stability studies indicated no changes in physicochemical properties after 3 mo. Skin irritation tests confirmed biocompatibility, and in vivo experiments demonstrated superior wound healing with ethosomal gels, particularly G3, as evidenced by morphological and histological studies.
Conclusion: The ethosomal gel system, especially G3, offers significant potential as a topical carrier for dapsone and cloxacilline, with enhanced penetration, sustained release, stability, safety, and superior wound healing efficacy compared to conventional formulations.
Keywords: Vesicles, Transdermal delivery, Ethosomal gel, Encapsulation studies, Drug diffuse study, Stability
© 2026 The Authors.Published by Innovare Academic Sciences Pvt Ltd. This is an open access article under the CC BY license (https://creativecommons.org/licenses/by/4.0/)
DOI: https://dx.doi.org/10.22159/ijap.2026v18i2.57081 Journal homepage: https://innovareacademics.in/journals/index.php/ijap
INTRODUCTION
Leprosy, also a well-known as a skin disease, poses a global challenge, ranging from tuberculosis to lepromatous leprosy, which correlates with the host's opposing response, varying from paucibacillary to multibacillary illness, this cause by Mycobacterium leprae and impacts on outer skin, ensuing in skin wounds, eye pain, vision defeat, muscle weak point, and numbness [1]. Judgment typically relies on a grouping of skin biopsy, smear, and bodily assessment findings [2]. Disease possibly accompanied by type 1 (reversal) and type 2 immunologic reactions, which can happen before, during, or after treatment initiation. During these periods, the disease can exacerbate significantly, necessitating the continuation of antibacterial therapy [2]. Dapsone has been the preferred drug for treating leprosy due to its bacteriostatic effect on Mycobacterium leprae. It achieves by reducing manufacturing of folic acid through opposition with p-aminobenzoate to dihydropteroate synthase [3]. Efficacies of drug, less solubility of Dapsone inside water leads to reduced bioavailability plus promotemicrobe’s resistance [4]. Many of Dapsone adverse effects are linked to metabolite production. In the liver, Dapsone cause acetylation, and produce monoacetyl dapsone. Subsequent enzymatic hydroxylation results in the production of Dapsone hydroxylamine, and this is responsible for adverse effects of the drug [5]. Most infection occurs by (Gram+)bacteria can typically be effectively cure with a limited variety of antibiotics, namely Penicillin, Cloxacilline and erythromycin, which should suffice for approximately 90% of Gram-positive infections [6]. These medications should encourage prescribers to use them judiciously, alongside thorough bacteriological investigations, for the effective treatment of the drug without any side effects or adverse effect [7]. The primary objective of the research is to achieve optimal drug concentration at the targeted site of action over a sustained duration to induce the desired therapeutic response. Vesicular formulations containing cloxacilline, dapsone along with carbomer 934 were developed to its efficacy, availability, and decrease the unwanted effect and toxicity with two anti-leprotic drugs [8]. In these treatments, the use of dapsone produce gastric difficulties and severe hematological affects [9]. The dapsone and cloxacilline were used in the Nano sized vesicular formulation to avoid side effects of the drug and improve the efficacy of the formulation. Vesicular gel provided the synergistic effect of the drug and helps to reduce the skin lesion [10].
MATERIALSAND METHODS
Materials
Dapsone and cloxacillin both were purchased from Yarrow Chem Products in Mumbai, India. Cholesterol and Soy Lecithin were purchased from Central Drug House, New Delhi. Polypropylene glycol (PPG), Polyethylene glycol (PEG 400), Carbopol 934, Isopropyle myristate, Triethenolamine Ethanol and Ether were purchased from SD Fine Mumbai. Distilled water was prepared by our lab.
Selection of independent and dependent variables
The independent variables in the present investigation selected were the concentration of propylene glycol and the stirring. The dependent variables were the particle size and entrapment efficiency of the resulting vesicular gel. Humectants are essential for maintaining the vesicular gel in its Nano-sized form. Stirring reduces particle size. Therefore, it is essential to ascertain the optimal concentration of humectants and the stirring is used for the development of a vesicular formulation [37].
Optimization
A 32 factorial design was used for optimization purpose. The formulation of vesicles involves determining the outcome of two independent variables: the amount of humectant (X1) and the stirring (X2) at three levels. Total of 9 formulations will be considered for the optimization. These nine formulations will undergo screening to determine their size of particle (Y1) and % entrapment efficiency (Y2) as dependent variables. Vesicles that produce the best outcomes will be considered as optimized, and subsequent investigations will be conducted using the optimized vesicles.
Formulation of dapsone+cloxacilline loaded vesicles
Dapsone-cloxacillin-loaded ethosomes were prepared by the “hot method” followed by sonication [11]. An organic phase was processed by dissolving 50 mg of Dapsone in calculative amount of ethanol. A hot lipid mixture of phospholipid and cholesterol, as detailed in table 1, was combined with the organic phase under continuous stirring at given revolutions per minute (RPM) at 40 °C. Propylene glycol in given concentration, table 1 was added to the above organic-lipid mixture under continuous stirring. On the other side, the aqueous phase is processed by dissolving 50 mg of Cloxacilline in water according to table 1. Then aqueous phase is slowly introduced to the hot organic-lipid phase, with continuous mixing until an ethosomal suspension formed. This suspension was ultrasonicated for 3 min to reduce ethosome size and allowed to stabilize for 30 min. The formulation was stored at 4-8 °C for later use. In the preparation of Pharmacosomes vesicles these were formulated by using ether injection method [12]. An organic phase was prepared by dissolving 50 mg of Dapsone in calculative amount of ether and the aqueous phase was prepared by dissolving 50 mg of Cloxacilline in calculative amount of water. A lipid mixture of phospholipid, as detailed in table 1, was combined with the organic phase under continuous stirring at 60 °C. Propylene glycol in given concentration, table 1 was added to the above organic-lipid mixture under continuous stirring. Then aqueous phase is slowly introduced to the hot organic-lipid phase, with continuous mixing at given RPM. After pouring of organic phase the suspension is stirred for 15 min.
Table 1: 32Optimization of vesicular formulation
| S. No. | F. code | Ingredients | |||||||||
| Ethanol (ml) | Ether (ml) |
Propylene Glycol (ml) |
Cholesterol (mg) | Phospholipid (mg) | Water (for 20 ml) |
DAP | CLXS | Stirring RPM |
Sonication time | ||
| 1. | F1 | 7.5 | - | 3 | 25 | 100 | Q. S. | 50 | 50 | 700 | 5 |
| 2. | F2 | 7.5 | - | 2 | 25 | 100 | Q. S. | 50 | 50 | 700 | 10 |
| 3. | F3 | 7.5 | - | 1 | 25 | 100 | Q. S. | 50 | 50 | 700 | 15 |
| 4. | P4 | - | 7.5 | - | - | 100 | Q. S. | 50 | 50 | 700 | - |
| 5. | P5 | - | 7.5 | - | - | 100 | Q. S. | 50 | 50 | 700 | - |
| 6. | P6 | - | 7.5 | - | - | 100 | Q. S. | 50 | 50 | 700 | - |
Physicochemical characterization of vesicular formulation
Drug-excipient compatibility analysis
The infrared range is imperative evidence which provide an adequate data about the structural compatibility with the compound [13]. During analysis, physical mixture was placed under probe, FTIR spectrum was recorded to analyze for the changes in peaks. The FTIR study was done by using Perkin Elmer Spectrum and the range was fixed in this limit of 400-4000 cm-1 at 20 C-25 °C.
Droplet size, PDI, and Zeta potential
The vesicular suspension was diluted in distilled water (1:10v/v) and evaluated for droplet size, PDI and Zeta potential using (Nano-ZS, Malvern instrument, Malvern, U. K.). Before loading the cell into the instrument, cautiously wipe the estimating windows with lens paper, it was recommended to keep running in manual mode and started at a low voltage [14, 36].
Entrapment efficiency study
The entrapment efficiency was evaluated through the centrifugation technique.10 ml of vesicular dispersion was transferred into a cold centrifuge (R-4 °C, Remi centrifuge, Vasai, India) at 15,000 rpm for 60 min at 4 °C. The un trapped drug is separated, and supernatant liquid is obtained. The amount of entrapped vesicles was examined at 295 by U. V Spectroscopy (Pharma spec 1700, Shimadzu, Japan) and was calculated by using this equation [15].

In vitro drug release study
A Diffusion cell (Dinesh scientific, New Delhi) was used in this study, with egg membrane for the release profile [16]. 1 ml of suspension was applied to the membrane, and the donor compartment was filled with 15 ml 6.8 pH buffer. The setup was placed on a magnetic stirrer (Bharat Electrical Industries, Varanasi), where the solution6.8 pH buffer is filled in the receptor compartment at 50 rpm, at 37 °C±5 C temperature. 1 ml sample was withdrawn and exchanged with fresh buffer solution. The drug concentration of aliquot was withdrawn at different time durations of 0, 0.25, 0.5, 1, 2upto 24h and analyzed at 295 nm by using simultaneous estimation of Dapsone+Cloxacilline via UV (Pharma spec 1700, Shimadzu, Japan) [17, 18].
Vesicular morphology determination
The optimized samples were visualized by SEM (JEOL Jsm–6490LV, Japan) to give 3D image of the globules.
Formulation of Dapsone+Cloxacillin-loaded vesicular gel
Optimized vesicle F3 and P5 is used for formulation of a gel by using dispersion method [19]. 30 mg Carbopol 934 is add into10 ml of water with continuous stirring at 25 °C followed by the addition of 1 mlisopropyl myristate with continuous stirring at 500rpm with care to escape encapsulation. The pH was maintained by adding triethanolamine [20]. After that, the calculative amount of PEG 400 was added with continuous stirring. All formulation design was prepared as given in table 2.
Evaluation of vesicular gel formulation
Drug content of vesicular gel
100 mg of optimized vesicular gel is dispersed in a 10 ml of methanol by using probe sonicator (Hicon Products India Private Limited) until complete solubility was not reached [21]. The solution was then filtered and analyzed using a UV. (Pharma spec 1700, Shimadzu, Japan) at 295 nm.
Spreadiblity
The spreadibility of gel is calculated by take 1g of the optimized vesicular gel is placed between two glass plates, and a weight is applied to one of the plates to simulate pressure. The spreadability is determined by measuring the area covered by the gel after applying a 1 gm force [21].
pH
pH can be measured with the help of a digital pH meter (Hicon, Grover Enterprises, New Delhi). 1g optimized vesicular gel is dissolved in buffer solution 5.5pH, and the pH of the resulting solution is measured [19].
Viscosity
The viscosity of prepared formulations was prepared carried out by Brookfield Viscometer (Synchro Electric Viscometer). 10g of sample was taken in appropriate container, and spindle groove no. 4was dipped and rotated at 0.3 rpm for a predetermined duration of 3 min. The spindle was moved in this gel until a constant reading was shown. Repeat this method for obtained the average values [22, 23].
Table 2: Formulation design of gel formulation
F. Code |
F3 Formulation (100 mg~0.1 ml) |
P5 Formulation ((100 mg~0.1 ml) |
Carbopol 934 (mg) |
PEG 400 (ml) |
Isopropyl myristate (ml) |
Triethenolamine (0.5 ml q. s) |
Water (10 ml q. s) |
G1 |
100 |
- |
30 |
1.25 |
1 |
Q. S. |
Q. S. |
G2 |
100 |
- |
30 |
2.5 |
1 |
Q. S. |
Q. S. |
G3 |
100 |
- |
30 |
5.0 |
1 |
Q. S. |
Q. S. |
G4 |
- |
100 |
30 |
1.25 |
1 |
Q. S. |
Q. S. |
G5 |
- |
100 |
30 |
2.5 |
1 |
Q. S. |
Q. S. |
G6 |
- |
100 |
30 |
5.0 |
1 |
Q. S. |
Q. S. |
In vitro study of vesicular gel
The study was carried out using a franz diffusion cell [24]. The egg membrane was sandwiched in between the donor and receptor compartment. 10 mg optimized vesicular gel was placed on the egg membrane. The reservoir compartment was filled with 15 ml of 6.8 pH buffer. The study was done at 37± 1 °C at 50 rpm for 24 h. Samples were withdrawn from reservoir compartment at periodic interval for 24 h. Solution was replaced with fresh buffer to maintain the volume. The content was analyzed spectrophotometrically at 295 nm.
Stability studies
Vesicles were stored in a glass vial under static conditions 40 °C±3 °C at 75% RH in glass bottle over a period of 0, 1, 2 and 3 mo. The samples were collected and evaluated for PDI, Particle size, Zeta potential and %EE (Entrapment Efficiency) [25].
FTIR spectral analysis
The FTIR of pure drug, physical mixture and optimized formulation was carried out to ascertain identify of drugs. The 10 mg of the optimized sample was placed on the NaCl plate, and the FTIR spectrum was recorded to analyze the changes. The sample was scanned between wave number 400-4000 cm-1 at room temperature, using perkin elmer spectrum and.
TEM analysis
The morphology was determined by using TEM (Tecnai20, Philips, and Eindhoven, Netherlands). TEM provides detailed, high magnification quality and stability of vesicular drug delivery systems, helping to ensure their efficacy to examine the surface morphology, size and shape.
Ex-vivo permeation studies of vesicular gel
Ex vivo study was done with the help of diffusion cell. Conventional gel was used as reference to study the effect of vesicular formulation on drug diffusion. The abdominal skin of pig was pre-equilibrated in PBS (pH 7.4) for 30 min. The skin was sandwich in between the two compartments (Doner and Receptor), then optimized vesicular formulation was applied. 15 ml of PBS (pH 6.8) phosphate-buffered was filled in the receptor compartment, and 1% PEG 400 to maintain sink conditions. It was agitated continuously at 700 rpm at 37 ±2ºC throughout the experiment. The sample (~50 mg drug) was placed in donor compartment, at specific time interval, withdrawn and replacement with fresh buffer. The drug content of samples was analyzed at 295 nm using UV spectrophotometry [26].
Skin irritation study
This study was conducted in accordance with the ethical guidelines Institutional Animal Ethics Committee (IAEC). The study was approved by the committee under approval number (Reg No.18/PO/ReBi/S/1999/CPCSEA), ensuring that all procedures followed ethical standards for the use of animals in research.
The acute dermal irritation study was performed in accordance with the OECD Guidelines 404 “Acute dermal irritation/corrosion [27]. To test the irritancy potential of experimental rats were used; the selected test gel G5 and PG3 were applied to the shaved skin on the rats.
The selection of albino rats for this study is described as follows. Rats were randomly divided into four groups and each group have 2 rates, Approximately 24 hr.(s) before the testing, for both the sides of the dorsal surface of the trunk of each test animal was removed carefully. Approximately 1 cm area was marked on the hair free area of every test animal [28, 29].
The animals were treated as follows:
Group I-Disease group
Group II-Control group
Group III-Treated with standard formulation
Group IV-Treated with Ethosomal gel
Group V-Treated with Pharmacosomal gel
100 mg of the test formulation was applied to the marked area in each group. The treated area was covered with a gauze patch, which is held in place with non-irritating tape. At the end of 24 h exposure period, the residual formulation on the skin was removed carefully with purified water. Observations were made at 0, 24, 48, and 72 h, and the dermal reactions (erythema and edema) were scored between 0-4:
For erythema and eschar formation
I. Score 0, no erythema;
II. Score 1, very slight erythema (barely perceptible);
III. Score 2, well-defined erythema;
IV. Score 3, moderate to severe erythema;
V. Score 4, severe erythema (beef redness) to es char formation, preventing grading of erythema.
For edema formation
VI. Score 0: no edema;
VII. Score 1: very slight edema (barely perceptible);
VIII. Score 2: slight edema (edges of area well defined by definite raising);
IX. Score 3: moderate edema (raised approximately 1 mm); and
X. Score 4: severe edema (raised more than 1 mm and extending beyond area of exposure).
The scores for erythema and edema were summed up for all the rats at 1, 24, 48, and 72 h.
The primary irritation was calculated by using this equation:

In vivo lesion healing study
Wister rat of either sex n=30, weighing 150-200 gm., 6-10 w Clipping of hairs and clean the site by using the hair removal cream at dorsal side of the rats body. Clean area with antiseptic povidone-iodine. The bacteria was Inoculated into the rats under strict biosafety conditions. Leprosy has a long incubation period. Clinical signs include swelling, nerve damage, and histopathological changes [30].
Group division
Group I-Disease group
Group II-Control group
Group III-Treated with standard formulation
Group IV-Treated with Ethosomal gel
Group V-Treated with Pharmacosomal gel
Histopathological examination of lesion tissue
The histopathological study was performed using skin punch biopsies (0.5 cm × 0.5 cm) collected from representative lesions and preserved in 10% formalin. After fixation for 12–24 h, tissues were processed, embedded in paraffin, and sectioned into 4–5 µm slices. These sections were stained with Hematoxylin and Eosin for histopathological assessment and with AFB stain for bacilli identification. The AFB staining procedure involved staining the slides with carbol fuchsine for five minutes, rinsing with water, decolorizing with 5% sulfuric acid for 3–5 seconds, washing again, counterstaining with methylene blue for three minutes, rinsing thoroughly, and finally air drying the slides before microscopic evaluation [31].
RESULTS AND DISCUSSION
Compatibility study
The compatibility study was confirmed with the help of FTIR. Individual samples of drug and excipient and a combination of physical mixture, were prepared and analysed for interaction. In fig. 1, the FTIR spectra indicated no chemical interaction between the drug and excipients as illustrated.
Optimization of vesicles
32 factorial strategies were followed for the optimization of Dapsone+Cloxacilline vesicles. For the formulation of optimized vesicles, the concentration of Humectant as well stirring was selected as independent variables at three different levels while particle size and % entrapment efficiency were selected as dependent variables. This resulted in the formulation of a total of 9 formulations. The results obtained from the optimization study are indicated in table 3.
The droplet size and entrapment result of F1-F3and P4-P6were studied and depicted in table 3 and fig. 2, ranging from 110.2 to 116.3 nm for F1 to F3 and 110.6 to 126.8 for P4 to P6. The result revealed that as the propylene glycol concentration in ethosomes increases from 1 to 3 ml, the droplet size initially decreases, leading to the slight enlargement of vesicle and a significant reduction in % entrapment efficiency. The encapsulation of the vesicles is shown in table 3, and by comparison of all vesicular formulation find out the P5 shows the higher entrapment (61.43%-73.95%).
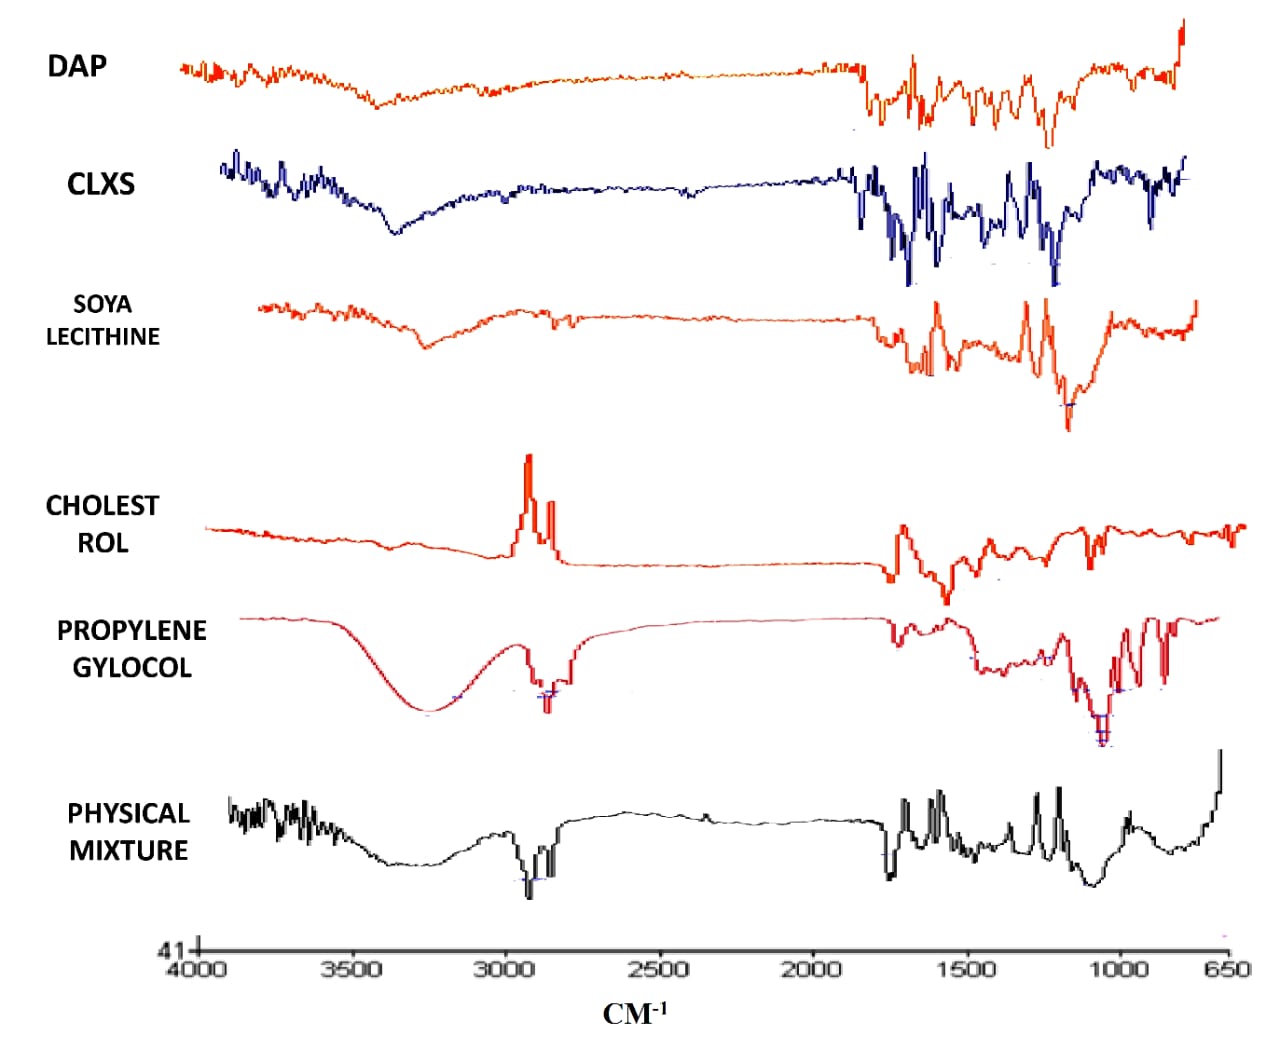
Fig. 1: Drug-excipient compatibility analysis by FTIR spectra
Table 3: Observed results of 32 factorial designs for vesicles
| F1 | F2 | F3 | P4 | P5 | P6 | |
| Size (nm) | 116.3 | 176.7 | 110.2 | 126.8 | 110.6 | 119.8 |
| %EE | 61.43 | 65.29 | 71.91 | 70.51 | 73.95 | 68.58 |
PDI, Zeta potential, pH correlation
The droplet size, distribution and zeta potential’s result of F1-F3 and P4-P6 were studied and depicted in table 4 and fig. 2, The phospholipid concentration 100 mg in ethosomes, observed that good entrapment efficiency compared to Pharmacosomes. All vesicular formulations displayed PDI of 0.3 or below, indicating narrow vesicle size distribution and good homogeneity. Owing to the ethanol and ether system, the vesicular charge shifted from positive to negative, with zeta potential values measured at – 20.3,-17.9,-21.7mV and-25.9,-30.5,-21.2. Owing to low PDI, zeta potential lower than-30Mv or equal, in the vesicle with F3 and P5 was chosen for further development.
Table 4: Entrapment, vesicle size and zeta potential value of all formulations
| F1 | F2 | F3 | P4 | P5 | P6 | |
| PDI | 0.25 | 0.25 | 0.32 | 0.28 | 0.36 | 0.30 |
| ZP(mv) | -20.3 | -17.9 | -21.7 | -25.9 | -30.6 | -21.2 |
| pH | 4.7 | 5.6 | 4.2 | 6.2 | 6.8 | 7.0 |
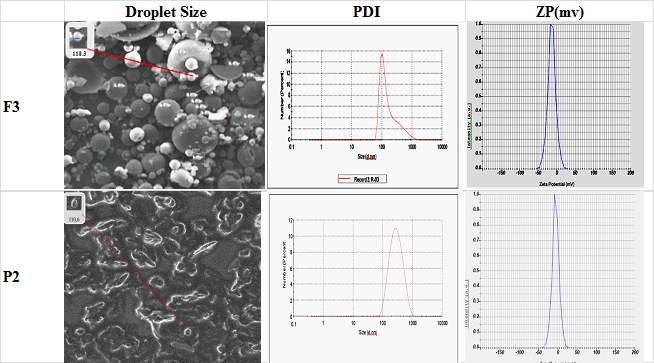
Fig. 2: SEM, Particle size, PDI and ZP of optimised vesicle (F3 and P5)
In vitro drug release study
The in vitro drug release profiles of Dapsone+Cloxacilline from the optimized batches (F3 and P5) at pH 6.8 were measured by plotting the cumulative percentage of drug released over time, as shown in the fig. 3. The study showed an initial burst release of approximately 20.58% and 34.75% in F3 and P5, respectively, within the first hour. This was followed by a sustained release, with the maximum drug release observed over 24 h. On the basis of results, F3 showed best results.
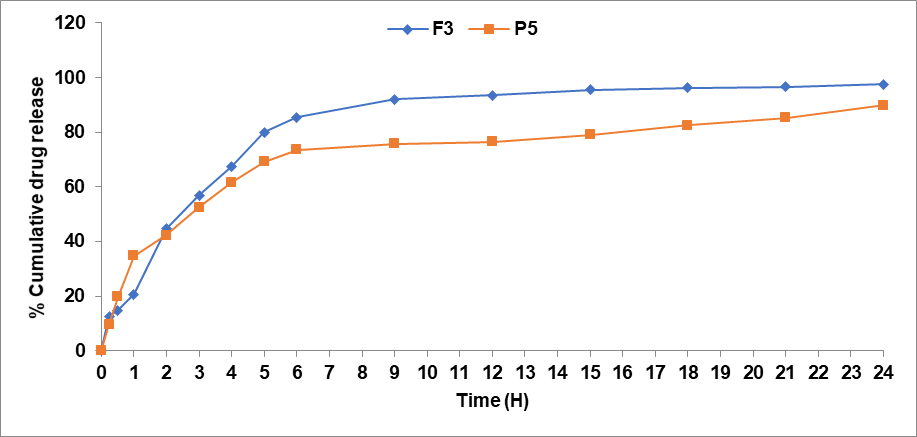
Fig. 3: In vitro drug release study of all vesicular formulations
Vesicular morphology
Scanning electron microscopy of ethosome and pharmacosomes was shown in fig. 2, was spherical in shape with gnarled surface. By comparing all the vesicle sizes, we observed that F3 showed the smallest particle size, having a diameter in 110.2±4.87 nm. This confirms the existence of vesicular structure at 7.5 ml ethanolic concentration. However, ethanolic concentration with phospholipid interpenetrates the lipid bilayer leading to thinner of membranes. The analysis also confirms the smooth surface of the vesicles indicating uniformity and stability.
Characterization of vesicular gel
The vesicular gel was formulated by using Carbopol 934 as a polymer, and the resulting gel displayed remarkably smooth texture, free from visible imperfections or roughness as presented in table 4. The consistent texture enhances the overall appearance and indicates that the material has been carefully processed to achieve a refined, even finish. It was characterized by measuring % drug content, pH, viscosity, and spreadability, shown in table 5. These values fall within the normal physiological pH range of the skin (3.0–9.0), indicating that the vesicular gels are non-irritating and safe for topical application. The drug content plays a vital role in determining the effectiveness and performance of drug-loaded particles. It directly impacts the therapeutic potential and stability of the formulation. The drug content of the prepared formulation was found to be greater than 70% which revealed a uniform distribution of drugs throughout the formulation, and the drug loss during the gel formulation was minimal. From the results, it was observed that spreadability decreases (8.68g/cm2to 12.68g/cm2) with an increase in carbopol concentration (10-50 mg). This indicates that Carbopol provided spreadable gels by shearing force of low magnitude. The gel prepared by 30 mg Carbopol (G1-G6) showed a viscosity of in between 35758±1.11-45223±1.13 cps while those prepared by 5 ml PEG shows high viscosity. However, an increase in PEG concentration leads to more concentrated gel.
Table 5: Evaluation parameter of vesicular-loaded gels
| S. No. | Formulation code | Visual inspaction | Drug content (%) | Spreadability (g/cm2) | pH | Viscosity (cp) |
| 1. | G1 | Smooth Texture | 72.04 | 10.78 | 7.0 | 35758 |
| 2. | G2 | Smooth Texture | 76.51 | 12.05 | 7.4 | 34158 |
| 3. | G3 | Smooth Texture | 79.88 | 12.68 | 7.0 | 45223 |
| 4. | G4 | Smooth Texture | 79.51 | 08.95 | 6.7 | 39453 |
| 5. | G5 | Smooth Texture | 83.54 | 09.12 | 6.8 | 40154 |
| 6. | G6 | Smooth Texture | 80.14 | 09.45 | 6.8 | 41264 |
In vitro drug release study of gel
The drug release profiles of the optimized formulations (G3 and G5) were evaluated to predict their in vitro performance. Increased drug permeation indicates greater vesicular penetration due to the presence of ethanol and ether in the core, which solubilizes the lipid. Ethanol in the ethosomal system imparts flexibility, enhancing membrane diffusion and reducing the hydration layer around the vesicles, thus facilitating drug permeation. Fig. 4 illustrates the release profiles of the optimized vesicular gel, showing the cumulative percentage of drug release from different formulations G3 and G5 is 88.68±5.56% and 80.41±9.14%. The results indicate that the ethosomal gel release its maximum drug concentration compare to the pharmacosomal gel. This may accelerate release due to better arrangement, stability, and sustained leakage from the prepared vesicles.
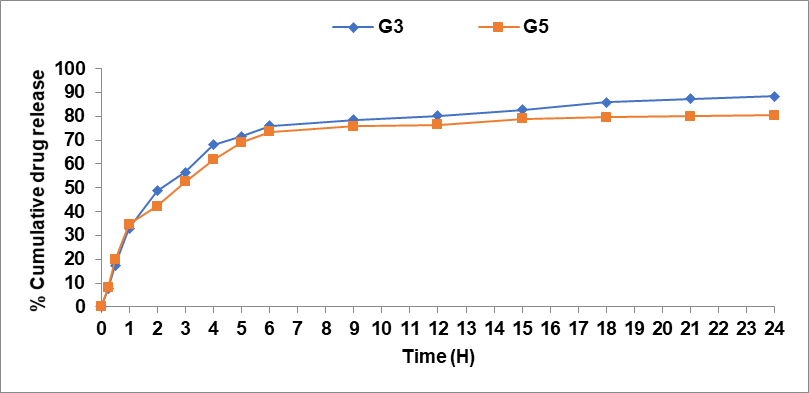
Fig. 4: Drug release study of optimized gel formulation (G3-G5)
Stability study
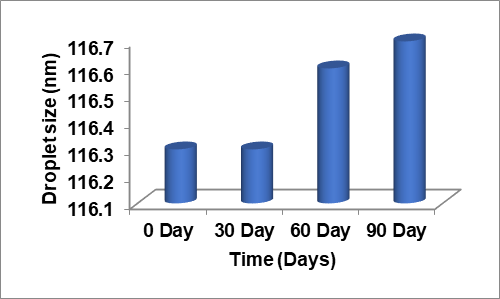
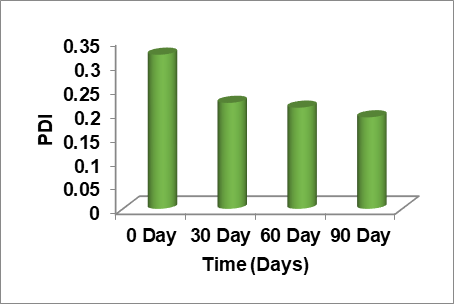
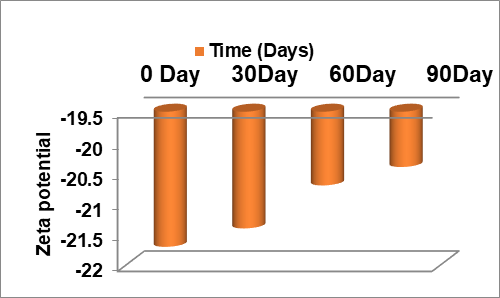
The stability study was undertaken in the investigation of the stability of topical gel formulation strategies as per ICH guidelines [32]. The stability studies for the optimized the formulations G3 gel formulation was conducted for three months. The study results indicated that no significant changes were observed for the analyzed parameters, fig. 5. Additionally, no microbial contamination was found during the analysis period.
 |
 |
 |
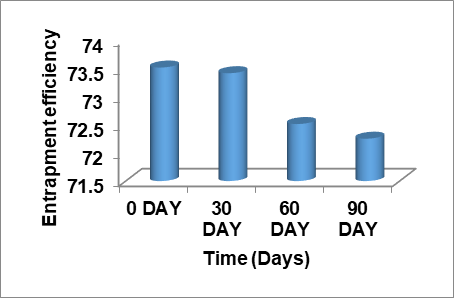 |
Fig. 5: Droplet size, PDI, zeta potential and entrapment efficiency of G3 for three months at 40 °C±3 °C at 75% RH
FTIR spectral analysis
To investigate the presence of organic functional groups in the optimized gels (G3 and G5), FTIR studies were conducted. The results indicate the presence of characteristic absorption band of drug is present in optimized G3 and G5 formulation, shown in fig. 6. The spectrum also displays no major change in the position of peak of drug in the G3. This result revealed that there is no possible interaction between drug and excipient.
TEM analysis
The photomicrograph of the optimized gel (G3and G5) is shown in fig. 8. The globules exhibit a dark spherical disappearance, with diameters ranging from 105±0.84and 118±1.56 nm for G3 and G5, respectively fig. 7. Among the three formulations, G3 demonstrated the narrowest size distribution, which can be attributed to the inclusion of 30 mg of Carbopol and 5 ml of PEG 400. This combination contributed to a reduction in globule size, confirming the formation of a vesicular structure.
Ex-vitro skin penetration study of optimized formulation
To effectively penetrate the stratum conium, vesicular systems are used. Vesicles have been shown to enhance a drug’s residence time in the epidermis, potentially improving its permeation [33]. In order to understand the ability of the vesicular gel to aid drug permeation through the skin, ex-vitro studies were conducted for optimized formulation (G3 and G5) and compared with conventional drug loaded gel (CG) to present better comparison of the permeation behavior through the rat abdominal skin with Franz diffusion cell as shown in fig. 8.
Fig. 6: FTIR spectra of pure drug (Dapsone and Cloxacilline) and optimized gel (G3and G5)
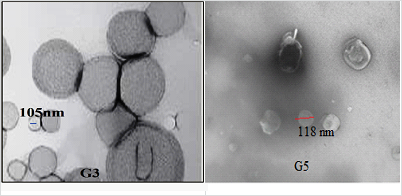
Fig. 7: TEM analysis of optimized gel (G3 and G5)
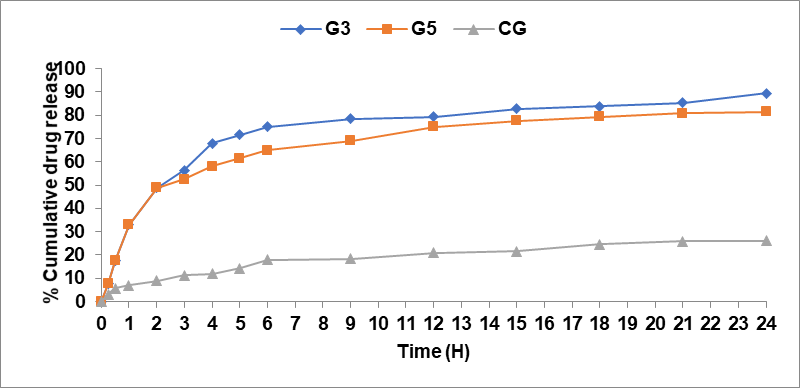
Fig. 8: Cumulative percentage of drug permeated via rat abdominal skin vs. time profile of optimized gel (G3and G5) and conventional gel (CG)
In contrast from the results that the vesicular gels G3 and G5 have a significantly longer release (89.45±0.27%and 85.36±0.33%) in comparison to conventional gel, GG (26.09±1.17%) in 24hr. The results indicated that increasing the concentration of the permeation enhancer (PEG 400) in formulation G3 may enhance skin permeability, vesicular flexibility, and their ability to deform, allowing them to penetrate the skin more effectively. This leads to greater vesicle penetration. The inclusion of 30 mg of Carbopol results in an extended residence time for the drug at the absorption site by interacting with the stratum cornea. Additionally, the viscosity of the gel formulation (G3) significantly influences drug release, affecting the rate of drug diffusion from the carrier [34, 35].
Skin irritation study
The results revealed that the Control group, being a known skin irritant, produced irritation with minimal erythema after 72 h and definite erythema with readily visible edema after 48 h. In comparison, both the placebo and optimized gel batches did not show any signs of irritation up to 48 h. After this period, slight erythema with mild redness was observed at the application site in Group III and Group V. However, Group IV did not show any signs of erythema or edema (show in table 6 and fig. 9). These in vivo skin irritation study results suggest that both gel formulations do not cause significant irritation on rat skin for up to 72 h.
Table 6: Skin irritation study
| Skin irritation study of group I | |||||
| Group | Skin reaction | Observation time (H) | Individual score | Total | |
| 1 | 2 | ||||
| Group I | Erythema and eschar formation | 0 | 0 | 0 | 0 |
| 24 | 0 | 0 | 0 | ||
| 48 | 0 | 0 | 0 | ||
| 72 | 0 | 0 | 0 | ||
| Sum of mean | 0 | ||||
| Edema Formation | 0 | 0 | 0 | 0 | |
| 24 | 0 | 0 | 0 | ||
| 48 | 0 | 0 | 0 | ||
| 72 | 0 | 0 | 0 | ||
| Sum of mean | 0 | ||||
| Primary irritation Index | 0 | ||||
| Skin Irritation Study of Group II | |||||
| Group | Skin Reaction | Observation time (Hr.) | Individual Score | Total | |
| 1 | 2 | ||||
| Group II | Erythema and Eschar formation | 0 | 0 | 0 | 0 |
| 24 | 0 | 0 | 0 | ||
| 48 | 0 | 1 | 1 | ||
| 72 | 1 | 1 | 2 | ||
| Sum of mean | 3 | ||||
| Edema Formation | 0 | 0 | 0 | 0 | |
| 24 | 0 | 0 | 0 | ||
| 48 | 0 | 0 | 0 | ||
| 72 | 1 | 1 | 2 | ||
| Sum of mean | 2 | ||||
| Primary irritation Index | 2.5 | ||||
| Skin Irritation Study of Group III | |||||
| Group | Skin Reaction | Observation time (Hr.) | Individual Score | Total | |
| 1 | 2 | ||||
| Group III | Erythema and Eschar formation | 0 | 0 | 0 | 0 |
| 24 | 0 | 0 | 0 | ||
| 48 | 0 | 0 | 0 | ||
| 72 | 0 | 0 | 0 | ||
| Sum of mean: | 0 | ||||
| Edema Formation | 0 | 0 | 0 | 0 | |
| 24 | 0 | 0 | 0 | ||
| 48 | 0 | 0 | 0 | ||
| 72 | 0 | 1 | 1 | ||
| Sum of mean: | 1 | ||||
| Primary irritation Index | 0.5 | ||||
| Skin Irritation Study of Group IV | |||||
| Group | Skin Reaction | Observation time (Hr.) | Individual Score | Total | |
| 1 | 2 | ||||
| Group IV | Erythema and Eschar formation | 0 | 0 | 0 | 0 |
| 24 | 0 | 0 | 0 | ||
| 48 | 0 | 0 | 0 | ||
| 72 | 0 | 0 | 0 | ||
| Sum of mean: | 0 | ||||
| Edema Formation | 0 | 0 | 0 | 0 | |
| 24 | 0 | 0 | 0 | ||
| 48 | 0 | 0 | 0 | ||
| 72 | 0 | 0 | 0 | ||
| Sum of mean: | 0 | ||||
| Primary irritation Index | 0 | ||||
| Skin Irritation Study of Group V | |||||
| Group | Skin Reaction | Observation time (Hr.) | Individual Score | Total | |
| 1 | 2 | ||||
| Group V | Erythema and Eschar formation | 0 | 0 | 0 | 0 |
| 24 | 0 | 0 | 0 | ||
| 48 | 0 | 0 | 0 | ||
| 72 | 0 | 1 | 1 | ||
| Sum of mean: | 1 | ||||
| Edema Formation | 0 | 0 | 0 | 0 | |
| 24 | 0 | 0 | 0 | ||
| 48 | 0 | 0 | 0 | ||
| 72 | 0 | 0 | 0 | ||
| Sum of mean: | 0 | ||||
| Primary irritation Index | 0.5 | ||||
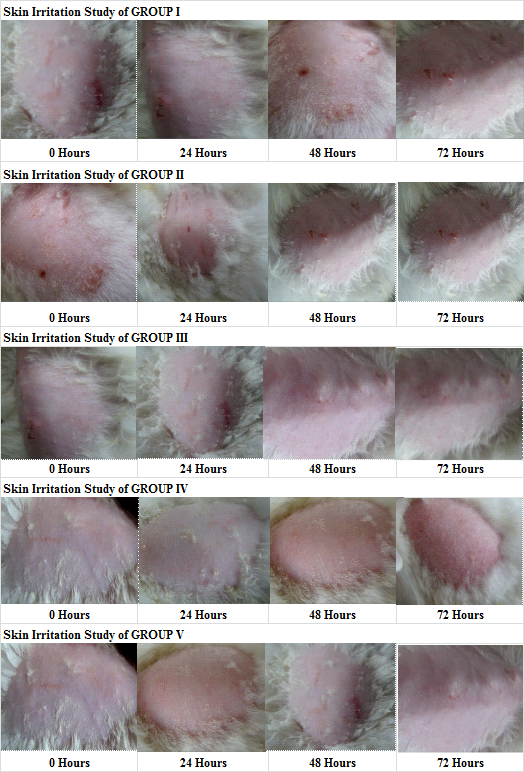
Fig. 9: Skin irritation study of all groups
In vivo lesion healing
The study evaluated lesion healing across groups over 30 days, with all starting at 5 mm on Day 0. The disease group showed no healing, with lesion size slightly increasing to 6 mm by Day 30, while the control group exhibited minimal natural recovery, reducing only to 4 mm by Day 20. The standard group showed moderate efficacy with gradual reduction to 1 mm by Day 30. Ethosomal Gel A demonstrated superior healing, with lesion size reduction beginning as early as day 5 and complete resolution by Day 30, making it the most effective treatment. Pharmacosomal Gel B showed intermediate efficacy, reducing lesion size steadily to 1 mm by Day 30, better than the standard and control groups but less effective than Ethosomal Gel A (show in fig. 10 and 11). These findings suggest that Ethosomal Gel A could be a promising candidate for further development as a therapeutic agent for lesion healing and infection control.
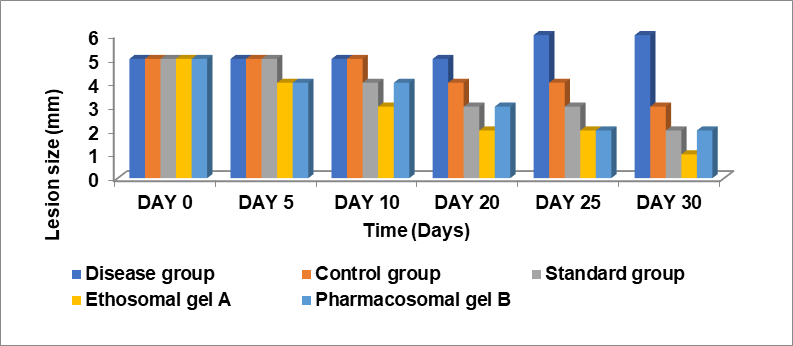
Fig. 10: Graph in between lesion size and time
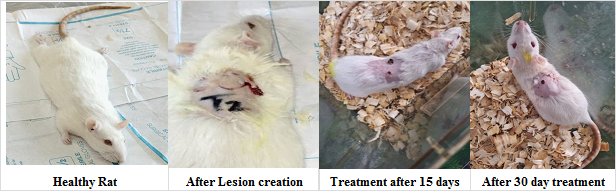
Fig. 11: Images of rat after different interval
Histopathological examination of lesion tissue
Histopathological evaluation was conducted after four weeks of treatment to assess tissue response and damage across all groups. The scoring system used ranged from 1 to 4, with:
Score 1: Normal or near-normal histology
Score 2: Mild histopathological alterations
Score 3: Moderate histopathological damage
Score 4: Severe histopathological damage
Histopathological evaluation after treatment revealed clear differences between groups. The control group (score 4) exhibited severe tissue damage, showing the untreated pathological process, while the standard group (score 3) demonstrated moderate improvement but with residual tissue damage. Test Gel B showed better protection with a score of 2, indicating mild tissue alterations, whereas Test Gel A presented the most significant recovery with a score of 1, reflecting near-normal tissue histology.
Overall, the scoring system (1–4) highlighted test gel A as the most effective treatment, providing superior tissue healing and protection. Test Gel B exhibited moderate efficacy, better than the standard group, while the control group confirmed the extent of untreated tissue damage (fig. 12). These findings strongly indicate that Test Gel A had the highest therapeutic potential in preserving or restoring tissue integrity.
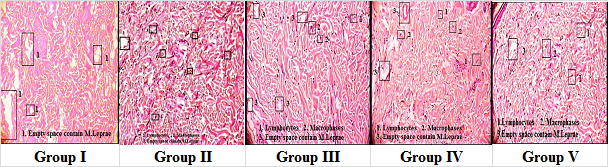
Fig. 12: Hispathological images in 100X of all groups
CONCLUSION
Vesicular gel of Dapsone+Cloxacilline is used in leprosy treatment and that was successfully formulated and optimized by 32 factorial design by using two independent variable (Humectant and Stirring) and two dependent variables, particle size and entrapment efficiency. Formulations F3 and P5 were prepared by using hot method and ether injection method, respectively. These two vesicles exhibited optimal vesicle characteristics, with high encapsulation efficiency and favorable physicochemical properties. The concentration of Humectant and Stirring speed show a major factor on the Particle size and drug encapsulation. The optimized vesicle showed a particle size 110.2±4.87 nm and drug encapsulation 71.91±0.60%. Further these vesicles is used to prepared in gel formulation and G3 and G5 gel were optimized on the basis of high drug content, viscosity, and spreadability. The gel G3 showing superior drug release in ex vivo studies (89.45±0.27%over 24 h). Stability studies confirmed G3s integrity, while in vivo studies showed no significant irritation. Histopathological analysis indicated G3 provided superior tissue healing, suggesting its potential as an effective, stable, and patient-compliant delivery system for Dapsone and Cloxacilline.
ACKNOWLEDGEMENT
Declared none
FUNDING
Nil
AUTHORS CONTRIBUTIONS
First author contribute to drafting, supervision, investigation, review, resource, and conceptualization. Second and Third authors contribute to supervision and review.
CONFLICT OF INTERESTS
The authors declare no conflict of interest, financial or otherwise.
REFERENCES
Jain S, Jain P, Umamaheshwari RB, Jain NK. Transfersomes a novel vesicular carrier for enhanced transdermal delivery: development, characterization and performance evaluation. Drug Dev Ind Pharm. 2003;29(9):1013-26. doi: 10.1081/DDC-120025458, PMID 14606665.
Verma DD, Verma S, Blume G, Fahr A. Particle size of liposomes influences dermal delivery of substances into skin. Int J Pharm. 2003;258(1-2):141-51. doi: 10.1016/s0378-5173(03)00183-2, PMID 12753761.
Squillante E. Optimization of in vitro nifedipine penetration enhancement through hairless mouse skin. International Journal of Pharmaceutics. 1998;169(2):143-54. doi: 10.1016/S0378-5173(98)00110-0.
Cevc G, Blume G. Lipid vesicles penetrate into intact skin owing to the transdermal osmotic gradients and hydration force. Biochim Biophys Acta. 1992 Feb;1104(1):226-32. doi: 10.1016/0005-2736(92)90154-e, PMID 1550849.
Cevc G, Gebauer D, Stieber J, Schatzlein A, Blume G. Ultraflexible vesicles, transferosomes have an extremely low pore penetration resistance and transport therapeutic amounts of insulin across the intact mammalian skin. Biochim Biophys Acta. 1998;1368(2):201-15. doi: 10.1016/s0005-2736(97)00177-6, PMID 9459598.
Bangham AD, Standish MM, Watkins JC. Diffusion of univalent ions across the lamellae of swollen phospholipids. J Mol Biol. 1965;13(1):238-52. doi: 10.1016/s0022-2836(65)80093-6, PMID 5859039.
Witika BA, Mweetwa LL, Tshiamo KO, Edler K, Matafwali SK, Ntemi PV. Vesicular drug delivery for the treatment of topical disorders: current and future perspectives. J Pharm Pharmacol. 2021;73(11):1427-41. doi: 10.1093/jpp/rgab082, PMID 34132342.
Molinelli E, Paolinelli M, Campanati A, Brisigotti V, Offidani A. Metabolic pharmacokinetic and toxicological issues surrounding Dapsonesone. Expert Opin Drug Metab Toxicol. 2019 Apr;15(5):367-79. doi: 10.1080/17425255.2019.1600670, PMID 30943794.
Goulart IM, Arbex GL, Carneiro MH, Rodrigues MS, Gadia R. Efeitos adversos da poliquimioterapia em pacientes com hanseniase: um levantamento de cinco anos em um Centro de Saude da Universidade Federal de Uberlandia. Rev Soc Bras Med Trop. 2002 Oct;35(5):453-60. doi: 10.1590/S0037-86822002000500005, PMID 12621663.
Barry BW. Mode of action of penetration enhancers in human skin. J Control Release. 1987;6(1):85-97. doi: 10.1016/0168-3659(87)90066-6.
Puri A, Loomis K, Smith B, Lee JH, Yavlovich A, Heldman E. Lipid-based nanoparticles as pharmaceutical drug carriers: from concepts to clinic. Crit Rev Ther Drug Carrier Syst. 2009;26(6):523-80. doi: 10.1615/CritRevTherDrugCarrierSyst.v26.i6.10, PMID 20402623.
Nasr AM, Moftah F, Abourehab MAS, Gad S. Design formulation and characterization of valsartan nanoethosomes for improving their bioavailability. Pharmaceutics. 2022 Oct;14(11):2268. doi: 10.3390/pharmaceutics14112268, PMID 36365087.
Garg HAA, Sheoran R, Pawar N, Sanjeev, Rahul. Formulation and evaluation of miconazole pharmacosome by using solvent evaporation method to enhance solubility of miconazole. Int J Membr Sci Technol. 2023;10(4):2362-73. doi: 10.15379/ijmst.v10i3.3364.
Naseeb Basha Shaik SD. Mortha lakshmi pkand lathakukati formulation and evaluation of tizanidine hydrochloride-loaded ethosomes for transdermal delivery. J Pharm Sci Res. 2020 Sep;12(11):1400-10. doi: 10.1016/j.molliq.2024.125111.
Nimisha ZF, Kaur CD. Formulation and performance of Berberis aristata extract-loaded ethosomal gel. Asian J Pharm. 2017 Sep;11(3):176-83. doi: 10.22377/ajp.v11i03.1401.
Saraswathi TS, Roshini R, Damodharan N, Mothilal M, Janani SK. Development of lipid-based vesicles of terbinafine gel for skin delivery by 32 full factorial design. Int J App Pharm. 2024 Jul;16(4):231-43. doi: 10.22159/ijap.2024v16i4.50460.
Anju K, Priya S, Sandeep DS, Nayak P, Kumar P, Kumar A, Lobo CL, Krithi SP. Formulation and optimization of zaltoprofen-loaded ethosomal gel by using 2³ full factorial designs. J Pharm Res Int. 2021;33(24B):30-44. doi: 10.9734/jpri/2021/v33i24B31439.
Tiwari R, Tiwari G, Wal A, Gupta C. Liposomal delivery of 5 fluorouracil and tretinoin: an aspect of topical treatment of skin warts. Ars Pharm. 2019 May;60(3):139-46. doi: 10.30827/ars.v60i3.7966.
Ramkanth S, Madhusudhana Chetty C, Sudhakar Y, Thiruvengadarajan VS, Anitha P, Gopinath C. Development characterization and in vivo evaluation of proniosomal based transdermal delivery system of atenolol. Future J Pharm Sci. 2018;4(1):80–7. doi: 10.1016/j.fjps.2017.10.003.
Halagali P, Wannur VI, Patil AK, Torgal VD, Naik SM, Marennavar SA. Formulation and evaluation of quercetin ethosomal hydrogel for topical delivery system. Int J Pharm Investigation. 2024 Jul;14(3):749-58. doi: 10.5530/ijpi.14.3.84.
Tiwari A, Bag P, Sarkar M, Chawla V, Chawla PA. Formulation validation and evaluation studies on metaxalone and diclofenac potassium topical gel. Environ Anal Health Toxicol. 2021;36(1):e2021001. doi: 10.5620/eaht.2021001, PMID 33499562.
Andleeb M, Shoaib Khan HM, Daniyal M. Development, characterization and stability evaluation of topical gel loaded with ethosomes containing Achillea millefolium L. extract. Front Pharmacol. 2021;12:603227. doi: 10.3389/fphar.2021.603227, PMID 33912036.
Tiwari A, Bag P, Sarkar M, Chawla V, Chawla PA. Formulation validation and evaluation studies on metaxalone and diclofenac potassium topical gel. Environ Anal Health Toxicol. 2021;36(1):e2021001. doi: 10.5620/eaht.2021001, PMID 33499562.
Priya S, Shridhar P, Shekhara K, Shenthar S, Kudva SK. Tolnaftate-loaded ethosomal gel for topical delivery: formulation and in vitro evaluation. J Health Allied Sci. 2024 Jun;15(1):26-31. doi: 10.1055/s-0044-1787293.
Iizhar SA, Syed IA, Satar R, Ansari SA. In vitro assessment of pharmaceutical potential of ethosomes entrapped with terbinafine hydrochloride. J Adv Res. 2016;7(3):453-61. doi: 10.1016/j.jare.2016.03.003, PMID 27222750.
Liu X, Liu H, Liu J, He Z, Ding C, Huang G. Preparation of a ligustrazine ethosome patch and its evaluation in vitro and in vivo. Int J Nanomedicine. 2011 Jan;6:241-7. doi: 10.2147/IJN.S16044, PMID 21499422.
El-Hashemy HA. Design formulation and optimization of topical ethosomes using full factorial design: in vitro and ex-vivo characterization. J Liposome Res. 2022 Mar;32(1):74-82. doi: 10.1080/08982104.2021.1955925, PMID 34697998.
Wang J, Li Z, Sun F, Tang S, Zhang S, LV P. Evaluation of dermal irritation and skin sensitization due to vitacoxib. Toxicol Rep. 2017;4:287-90. doi: 10.1016/j.toxrep.2017.06.003, PMID 28959651.
Pankajnainwal DR. Perform skin irritation study of the developed formulation. Natural Volatiles & Essential Oils. 2020 Jan;7(1):86-95. doi: 10.52783/nveo.5451.
Jung H, Seo W, Jeong T, Kang HW, Kim S. A study on the skin irritation toxicity test of processed sulfur in new zealand white rabbit. J Pharmacopuncture. 2022 Mar;25(1):46-51. doi: 10.3831/KPI.2022.25.1.46, PMID 35371586.
Naves Mde M, Ribeiro FA, Patrocinio LG, Patrocinio JA, Fleury RN, Goulart IM. Bacterial load in the nose and its correlation to the immune response in leprosy patients. Lepr Rev. 2013 Mar;84(1):85-91. doi: 10.47276/lr.84.1.85, PMID 23741885.
Vishwanath SS, Rajput V, Rajput D. Nitin wathore a study of clinico-histopathological correlation in leprosy IP archives of cytology and histopathology research. 2022 Nov;7(3):164-70. doi: 10.18231/j.achr.2022.036.
Chandira RM, Pethappachetty P, Chandiran G, Samy DA. Formulation and evaluation of nanosponges of an antileprosy drug: topical application. Asian J Biol Life Sci. 2022 Aug;11(2):554-63. doi: 10.5530/ajbls.2022.11.75.
Nayak D, Mohanta YK, Rauta PR, Chakrabartty I, Saravanan M. Ethosomes for dermal and transdermal drug delivery systems. In: Barabadi H, Mostafavi E, Saravanan M, editors. Pharmaceutical nanobiotechnology for targeted therapy. Cham: Springer International Publishing; 2022. p. 313-36. doi: 10.1007/978-3-031-12658-1_11.
Moideen Muthu JM, Khan BA, Rajendran V, El-Sherbiny M, Othman G, Ahmed Hussamuldin AB, Al-Serwi RH. Polymeric ethosomal gel loaded with nimodipine: optimisation pharmacokinetic and histopathological analysis. Saudi Pharm J. 2022;30(11):1603–11. doi: 10.1016/j.jsps.2022.09.003.
Zaid Alkilani A, Hamed R, Abdo H, Swellmeen L, Basheer HA, Wahdan W. Formulation and evaluation of azithromycin-loaded niosomal gel: optimization in vitro studies rheological characterization and cytotoxicity study. ACS omega. 2022;7(44):39782-93. doi: 10.1021/acsomega.2c03762, PMID 36385887.
Ponduri TK, Guntupalli C, Jeganathan B, Malothu N. Impact of ligand conjugation of physicochemical attributes of polymeric nanoparticles of atypical antipsychotic drug for nose-to-brain delivery. Int J App Pharm. 2024 Nov;16(6):38-47. doi: 10.22159/ijap.2024v16i6.52003.
Jadhav SP, Dhakad PK, Gupta T, Gilhotra R. Formulation development and evaluation of paliperidone nanosuspension for solubility enhancement. Int J App Pharm. 2024 May;16(4):173-81. doi: 10.22159/ijap.2024v16i4.51218.