
Int J App Pharm, Vol 18, Issue 2, 2026, 446-454Original Article
DEVELOPMENT AND VALIDATION OF ANALYTICAL METHODS FOR THE ESTIMATION OF ACTIVE INGREDIENTS IN XTEE HB TABLETS
JANORIOUS WINKA J.1, S. P. DHANABAL1*, NALIN D.2, VEERA VENKATA SATYANARAYANA REDDY KARRI2
*1Department of Pharmacognosy and Phyto Pharmacy, JSS College of Pharmacy, JSS Academy of Higher Education and Research, Ooty-643001, Nilgiris, Tamil Nadu, India. 2Department of Pharmaceutics, JSS College of Pharmacy, JSS Academy of Higher Education and Research, Ooty, Nilgiris, Tamil Nadu, India
*Corresponding author: S. P. Dhanabal; *Email: spdhanabal@jssuni.edu.in
Received: 07 Nov 2025, Revised and Accepted: 31 Jan 2026
ABSTRACT
Objective: To develop and validate robust analytical methods for the quantification of ferric pyrophosphate (FPP), ascorbic acid (vitamin C), cyanocobalamin (vitamin B12), and folic acid (FA) in XteeHb tablets, addressing the analytical challenges posed by their diverse physicochemical properties.
Methods: Separate reversed-phase high-performance liquid chromatography (HPLC) methods were optimized and validated for ascorbic acid (vitamin C), cyanocobalamin (vitamin B12), and folic acid (FA), while ferric pyrophosphate (FPP) was quantified using a validated ultraviolet–visible (UV–Vis) spectrophotometric assay due to its inorganic nature and poor chromatographic response. Validation was performed in accordance with ICH Q2(R1) guidelines, assessing specificity, linearity, precision, accuracy, robustness, and forced degradation.
Results: All methods demonstrated excellent linearity (R² ≥ 0.999), precision (% RSD<2 %), and recovery values within 98–102 %. System suitability parameters met acceptance criteria for all analytes. Assay testing of marketed XteeHb Tablets showed compliance with specification limits (≥ 90 % of label claim), with no interference from excipients. The ultraviolet–visible (UV–Vis) method showed stable and reproducible absorbance for iron detection at 540 nm.
Conclusion: The validated analytical approaches are accurate, precise, and suitable for routine quality control, batch release, and stability monitoring of multicomponent hematinic formulations. This multi-method strategy provides a reliable framework to ensure the pharmaceutical quality of XteeHb Tablets and similar iron–vitamin supplements.
Keywords: XteeHb, Ferric pyrophosphate (FPP), High-performance liquid chromatography (HPLC), Ultraviolet–visible (UV–Vis) spectrophotometry, Vitamins, Method validation, International council of harmonization (ICH) guidelines
© 2026 The Authors.Published by Innovare Academic Sciences Pvt Ltd. This is an open access article under the CC BY license (https://creativecommons.org/licenses/by/4.0/)
DOI: https://dx.doi.org/10.22159/ijap.2026v18i2.57415 Journal homepage: https://innovareacademics.in/journals/index.php/ijap
INTRODUCTION
Anemia remains a major global public health concern, particularly among women of reproductive age and young children, with nutritional deficiencies being a leading cause of impaired erythropoiesis and haemoglobin synthesis [1]. Iron deficiency accounts for the majority of cases; however, inadequate levels of cyanocobalamin (vitamin B12), folic acid (FA), and ascorbic acid (vitamin C) also significantly impair red blood cell maturation and DNA synthesis [2, 3]. Ferric pyrophosphate (FPP) is widely used in hematinic formulations because of its stability and good tolerability. Ascorbic acid (vitamin C) enhances non-heme iron absorption, while cyanocobalamin (vitamin B12) and folic acid (FA) play essential roles in erythropoiesis, making their combined administration clinically effective in the management of multifactorial anemia [4–6]. XteeHb Tablets contain ferric pyrophosphate (FPP), ascorbic acid (vitamin C), cyanocobalamin (vitamin B12), and folic acid (FA), providing a multicomponent approach to address co-existing micronutrient deficiencies. However, the chemical diversity of these active ingredients presents significant analytical challenges. Ferric salts lack intrinsic ultraviolet absorption and therefore require colorimetric or complexometric detection, whereas vitamins exhibit distinct chromatographic behaviour, solubility characteristics, and ultraviolet absorption maxima [7–10]. Existing pharmacopeial and literature-reported methods generally focus on single analytes or limited combinations, and no validated analytical strategy is currently available for the complete quantitative estimation of all four active components in such formulations [11–16]. This limitation complicates quality monitoring, regulatory compliance, and batch-to-batch consistency assessment.
The present study aimed to develop and validate separate high-performance liquid chromatography (HPLC) methods for the estimation of ascorbic acid (vitamin C), cyanocobalamin (vitamin B12), and folic acid (FA), along with an ultraviolet–visible (UV–Vis) spectrophotometric method for ferric pyrophosphate, in accordance with ICH Q2(R1) requirements for specificity, linearity, precision, accuracy, and robustness. These validated analytical procedures are intended to ensure accurate dosing and strengthen the quality control of multinutrient hematinic products such as XteeHb Tablets.
MATERIALS AND METHODS
Analytical techniques
The analytical techniques adopted in this study were based on established reversed-phase high-performance liquid chromatography with photodiode array detection (RP-HPLC–PDA) and ultraviolet–visible (UV–Vis) spectrophotometric principles reported in the literature and pharmacopeial practice. Independently optimized RP-HPLC methods were employed for the quantification of ascorbic acid, cyanocobalamin, and folic acid, while ferric pyrophosphate was estimated using a UV–Vis spectrophotometric complexation method owing to its inorganic nature and poor chromatographic response. Method development, optimization, and validation were carried out in accordance with ICH Q2(R1) guidelines, and the selected analytical approaches were adapted from previously reported methods for vitamin and iron analysis in pharmaceutical dosage forms [17, 21, 25, 26].
Chemicals and reagents
Pharmaceutical-grade working standards of ferric pyrophosphate (FPP), ascorbic acid (vitamin C), cyanocobalamin (vitamin B12), and folic acid (N-pteroyl-L-glutamic acid; FA) were used in the study. Methanol and acetonitrile of high-performance liquid chromatography (HPLC) grade, along with sodium phosphate salts, sodium acetate, orthophosphoric acid, glacial acetic acid, sodium carbonate, citric acid, thioglycolic acid, and ammonia solution, were procured from certified suppliers. Ultrapure water was obtained using a Milli-Q purification system (Millipore, Billerica, MA, USA).
Instruments
A high-performance liquid chromatography (HPLC) system equipped with a quaternary pump, autosampler, column oven, and photodiode array (PDA) detector was used for the individual quantification of vitamins under independently optimized chromatographic conditions. Chromatograms were recorded using suitable data-acquisition software. For the determination of ferric pyrophosphate (FPP), an ultraviolet–visible (UV–Vis) spectrophotometer equipped with a 1 cm quartz cuvette was employed, as HPLC analysis was unsuitable because of the inorganic nature and poor solubility characteristics of FPP [17].
Chromatographic mobile phase and preparation
Method development was performed independently for each vitamin to accommodate differences in polarity, solubility, and UV absorbance characteristics. Folic acid (FA) was analyzed using a phosphate buffer–methanol mobile phase at near-neutral pH, while cyanocobalamin (vitamin B12) required an acetate buffer–acetonitrile system at mildly acidic pH to achieve acceptable retention and peak symmetry. Ascorbic acid (vitamin C) was analyzed under acidic conditions using a phosphate buffer to improve stability and chromatographic performance. Mobile-phase pH values were adjusted using appropriate reagents and verified after filtration through 0.45 µm membranes. All aqueous phases were degassed by sonication prior to use.
The finalized chromatographic and spectrophotometric conditions selected after optimization are summarized in table 1.
Standard preparation for assay
Primary stock solutions were freshly prepared using certified reference standards. Ascorbic acid (vitamin C, 50 mg), folic acid (FA, 50 mg), and cyanocobalamin (vitamin B12, 10 mg) were accurately weighed and transferred into separate 100 ml volumetric flasks. Ascorbic acid was dissolved in the corresponding mobile phase. Folic acid was initially dissolved in 0.1 M sodium carbonate to facilitate solubilization and subsequently diluted with phosphate buffer, while cyanocobalamin was dissolved and diluted using acetate buffer. All solutions were sonicated for 10 min and diluted to volume to obtain primary stock concentrations of 500 µg/ml for ascorbic acid and folic acid, and 100 µg/ml for cyanocobalamin.
Ferric pyrophosphate (FPP) standard solution was prepared using ferrous ammonium sulphate equivalent to elemental iron. The salt was dissolved in distilled water containing citric acid, followed by the addition of thioglycolic acid and ammonia solution to form a coloured ferrous complex. The solution was allowed to stand to ensure complete colour development prior to dilution.
Sample preparation
Twenty XteeHb tablets were weighed, finely powdered, and homogenized. An amount of powder equivalent to the label claim of each analyte was transferred to appropriate volumetric flasks. Extraction was performed using the respective diluents, followed by sonication, centrifugation, and filtration to obtain clear sample solutions. For ferric pyrophosphate, colour development was carried out prior to spectrophotometric measurement at 540 nm. Details of standard and sample preparation procedures are summarized in table 2.
Validation parameters
The individual high-performance liquid chromatography (HPLC) methods for ascorbic acid (vitamin C), folic acid (FA), and cyanocobalamin (vitamin B12), and the ultraviolet–visible (UV–Vis) spectrophotometric method for ferric pyrophosphate (FPP) were validated in compliance with ICH guidelines, which included:
Specificity
Specificity was evaluated by analyzing placebo samples prepared using the same procedure as the test samples under identical chromatographic and spectrophotometric conditions. Placebo solutions were examined to assess potential interference at the retention times or absorbance maxima of the analytes. Peak purity was assessed using photodiode array (PDA) detection.
System suitability testing
System suitability testing was performed prior to sample analysis to ensure adequate chromatographic system performance. Six replicate injections (n = 6) of standard solutions were analyzed for each analyte. Parameters evaluated included retention time, theoretical plate count, tailing factor, and percentage relative standard deviation (%RSD) of peak areas. Acceptance criteria were defined as %RSD not more than 2.0, theoretical plates not less than 2000, and tailing factor not more than 2.0, in accordance with ICH guidelines.
Linearity
Linearity was assessed by analyzing standard solutions at five concentration levels covering 50–150 % of the target concentration for each analyte. Calibration curves were constructed by plotting analytical response versus concentration.
Accuracy (recovery)
Accuracy was evaluated separately for the high-performance liquid chromatography (HPLC) and ultraviolet–visible (UV–Vis) spectrophotometric methods. Pre-analysed tablet powder was spiked with known quantities of each analyte at three concentration levels (80 %, 100 %, and 120 % of the target concentration). The spiked samples were extracted using the respective diluent, followed by sonication for 10 min, centrifugation at 4000 rpm for 10 min, and filtration through a 0.45 µm polyvinylidene fluoride (PVDF) membrane prior to analysis. For ascorbic acid (vitamin C), folic acid (FA), and cyanocobalamin (vitamin B12), accuracy was assessed using the validated high-performance liquid chromatography(HPLC) methods, while ferric pyrophosphate (FPP) accuracy was evaluated using the ultraviolet–visible (UV–Vis) spectrophotometric method.
Precision
Precision was evaluated by intra-day and inter-day studies using six replicate injections of standard solutions for each analyte.
Robustness
Robustnesswas assessed by introducing small deliberate variations in chromatographic conditions, including flow rate (± 0.1 ml/min), column temperature (±5 °C), and mobile phase composition (±2%).
Forced degradation studies
These studies were conducted to evaluate the stability-indicating capability of the methods. Each analyte was subjected to acid hydrolysis (0.1 M HCl), base hydrolysis (0.1 M NaOH), oxidative degradation (3 % H₂O₂), thermal stress (60 °C), and photolytic stress for 24 h prior to analysis.
The calculations for the assays included
Calculation for folic acid (FA)


Where,
AT=Average peak area of sample
AS=Average peak area of standard
WS=Weight of standard taken (mg)
WT=Weight of powdered tablet taken (mg)
P=Potency of the standard
LC= Label Claim
Calculation for cyanocobalamin (vitamin B12)

Where,
AT = average peak area of sample
AS = average peak area of standard
WS = weight of standard taken (mg)
WT = weight of powdered tablet taken (mg)
P = potency of standard
LC = label claim
Calculation for ascorbic acid (vitamin C)


Where,
AT = average peak area of sample
AS = average peak area of standard
WS = weight of standard taken (mg)
WT = weight of powdered tablet taken (mg)
P = potency of standard
LC = label claim
Calculations for ferric pyrophosphate (FPP)

Where,
AT = absorbance of sample
AS = absorbance of standard
DS = dilution factor of standard
DT = dilution factor of sample
P = potency of standard
A = average tablet weight (mg)
LC = label claim
Method development
Method development was performed independently for each analyte to overcome their distinct physicochemical challenges and ensure optimal high-performance liquid chromatography (HPLC) and ultraviolet–visible (UV–Vis) spectroscopic performance.
Column selection
Multiple reverse-phase stationary phases were evaluated during screening. An octadecylsilane column (C18) column provided the best selectivity, resolution, and retention for ascorbic acid (vitamin C) and folic acid (FA), while an octylsilane (C8) column yielded improved peak symmetry and adequate retention for cyanocobalamin (vitamin B12), consistent with its higher polarity and lower hydrophobicity.
Detection wavelength optimization
Ultraviolet (UV) absorbance spectra were recorded to establish individual λmax values for maximum response and minimal interference. The selected detection wavelengths were 214 nm for ascorbic acid (vitamin C), 280 nm for folic acid (FA), and 361 nm for cyanocobalamin (vitamin B12). These wavelengths ensured improved signal intensity and peak purity for each analyte.
Iron method selection
Because ferric pyrophosphate (FPP) cannot be reliably measured by high-performance liquid chromatography (HPLC), an ultraviolet–visible (UV–Vis) spectroscopic method was used instead. A coloured complex is formed that shows a clear absorption peak at 540 nm, which makes iron quantification reliable and selective.
Mobile phase optimization
For folic acid (FA), a phosphate buffer combined with methanol produced sharp, well-defined peaks with satisfactory retention. For cyanocobalamin (vitamin B12), a sodium acetate buffer with acetonitrile provided a stable baseline and reproducible chromatographic response. For ascorbic acid (vitamin C), an acidic phosphate buffer (pH 2.0) enhanced solubility and improved peak symmetry.
Ferric pyrophosphate (FPP) was quantified by indirect estimation using ultraviolet-visible (UV–Vis) spectroscopy, as its inorganic nature and poor solubility rendered it unsuitable for reliable high-performance liquid chromatography (HPLC) analysis.
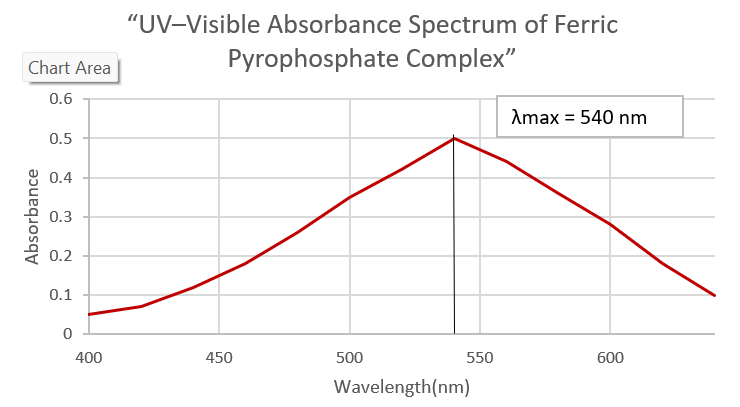
Fig. 1: UV–visible absorbance spectrum of the ferric pyrophosphate (FPP) complex, showing a distinct maximum absorbance (λmax) at 540 nm, which was used for quantitative analysis
RESULTS
Chromatographic and spectrophotometric conditions
Method development studies resulted in the selection of distinct analytical conditions for each active ingredient based on their physicochemical properties. Separate reversed-phase high-performance liquid chromatography (RP-HPLC) methods were finalized for ascorbic acid (vitamin C), folic acid (FA), and cyanocobalamin (vitamin B12), employing different stationary phases, mobile-phase compositions, flow rates, and detection wavelengths. Ferric pyrophosphate (FPP) was quantified using an ultraviolet–visible (UV–Vis) spectrophotometric method based on coloured complex formation, owing to its lack of intrinsic UV absorbance and poor chromatographic behaviour.
The finalized chromatographic and spectrophotometric conditions used for analysis are presented in table 1.
Table 1: Chromatographic and spectrophotometric conditions for the individual estimation of active ingredients in XteeHb tablets
| Analyte | Technique | Column | Mobile phase | Flow rate (ml/min) | Detection wavelength (nm) | Injection volume (µl) | Column temp (°C) | Run time (min) | Reference |
| Folic acid (FA) | High-performance liquid chromatography (HPLC) | Octadecylsilane (C18) column, 150 mm × 4.6 mm, 5 µm | 0.02 M phosphate buffer: methanol (70:30), pH 6.8 | 0.6 | 280 | 10 | 25 | 15 | [17] |
| Cyanocobalamin (vitamin B12) | High-performance liquid chromatography (HPLC) | Octylsilane (C8) column, 250 mm × 4.6 mm, 5 µm | 0.01 M acetate buffer: acetonitrile (60:40), pH 4.5 | 1.5 | 361 | 100 | 40 | 15 | [18] |
| Ascorbic acid (vitamin C) | High-performance liquid chromatography (HPLC) | Octadecylsilane (C18) column, 250 mm × 4.6 mm, 5 µm | pH 3.0 phosphate buffer | 1.0 | 214 | 10 | 25 | 10 | [19] |
| Ferric Pyrophosphate (FPP) | Ultraviolet–visible (UV–Vis) spectroscopy | — | Citric acid+thioglycolic acid+ammonia solution | — | 540 | — | — | — | [20] |
Abbreviations: HPLC – high-performance liquid chromatography; UV–Vis – ultraviolet–visible spectroscopy; FA – folic acid; FPP – ferric pyrophosphate; C18 – octadecylsilane; C8 – octylsilane; nm – nanometer; µl** – microliter; °C – degree Celsius.
Preparation of standard and sample solutions
Standard and sample preparation procedures were optimized to ensure complete extraction, solution stability, and reproducible analytical response for each analyte. Vitamin standards and tablet samples were prepared using analyte-specific diluents, followed by sonication, centrifugation, and filtration prior to analysis. Ferric pyrophosphate (FPP) samples were subjected to color development before spectrophotometric measurement. A summary of the standard and sample preparation schemes, including final concentrations, is provided in table 2.
Specificity
Specificity was demonstrated by the absence of interfering peaks at the retention times of ascorbic acid (vitamin C), folic acid (FA), and cyanocobalamin (vitamin B12) in placebo analyses. Peak purity evaluation using photodiode array (PDA) detection showed purity angles lower than the corresponding purity thresholds for all analytes, confirming chromatographic specificity and the absence of co-eluting excipient interference.
Linearity
The linearity performance of all analytes over the concentration range of 50–150 % of the target concentration is summarized in table 3, which shows correlation coefficients (R²) ≥ 0.999 with statistically insignificant y-intercepts (p>0.05).
System suitability testing
System suitability parameters for the developed high-performance liquid chromatography (HPLC) methods are summarized in table 4. For all three analytes, the methods demonstrated acceptable chromatographic performance, with %RSD values of peak areas below 2.0, theoretical plate counts exceeding 2000, and tailing factors within the prescribed limit of not more than 2.0.
Ascorbic acid (vitamin C) exhibited a retention time of 2.75 min, with a theoretical plate count of 3452 and a tailing factor of 1.12 (table 4). The corresponding chromatogram (fig. 2) shows a single, well-defined, symmetric peak at the expected retention time, supporting both system suitability and method specificity under the optimized chromatographic conditions.
Table 2: Preparation of standard and sample solutions for individual analyte estimation
| Analyte | Standard preparation | Final stock concentration | Sample preparation |
| Ascorbic acid (vitamin C) | 50 mg in 100 ml of mobile phase | 500 µg/ml | Powder equivalent to label claim; sonication 20 min; centrifuge 4000 rpm for 10 min; filter 0.45 µm; dilute suitably |
| Folic acid (FA) | 50 mg in 100 ml of 0.02 M phosphate buffer (pH 6.8) | 500 µg/ml | Powder equivalent to 250 µg; extraction as above |
| Cyanocobalamin (vitamin B12) | 10 mg in 100 ml of acetate buffer (pH 4.5) protected from light | 100 µg/ml | Powder equivalent to 5 µg; minimize light exposure |
| Ferric pyrophosphate (as Fe) | 10 mg Fe equivalent in citric acid+colour reagent to 50 ml | 200 µg/ml | Powder equivalent to label claim; sonication 20 min; colour development 10 min; filter |
Abbreviations: FA – folic acid; FPP – ferric pyrophosphate; rpm – revolutions per minute; µg/ml – micrograms per millilitre; µm – micrometre.
Table 3: Linearity parameters for vitamins and ferric pyrophosphate (FPP)
| Analyte | Range | Slope | Intercept | R² |
| Ascorbic acid (vitamin C) | 25–75 µg/ml | 12,487 | 3218 | 0.999 |
| Folic acid (FA) | 50–150 µg/ml | 9765 | 2894 | 0.999 |
| Cyanocobalamin (vitamin B12) | 2–10 µg/ml | 58421 | 1102 | 0.999 |
| Ferric pyrophosphate (FPP) | 10–40 µg/ml (as Fe) | 7930 | 2456 | 0.999 |
Abbreviations: R² – coefficient of determination; FA – folic acid; FPP – ferric pyrophosphate; µg/ml – micrograms per milliliter.
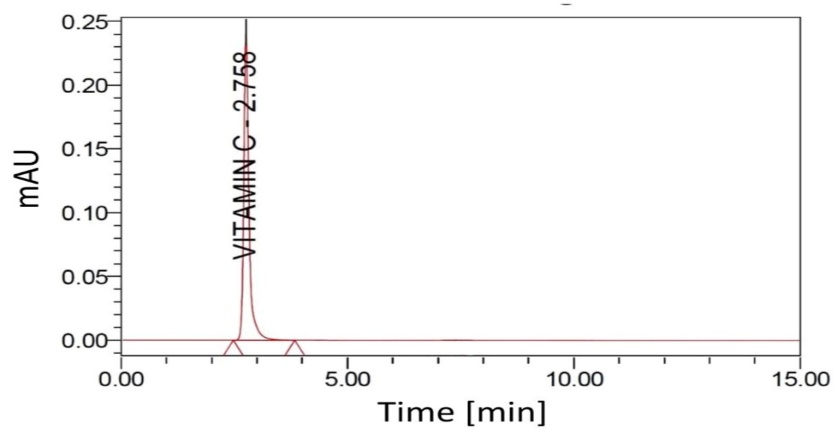
Fig. 2: Representative high-performance liquid chromatography (HPLC) chromatogram of ascorbic acid (vitamin C), showing a distinct peak at a retention time of approximately 2.75 min under the optimized chromatographic conditions, supporting method specificity and system suitability
For folic acid (FA), a retention time of 8.48 min was observed, along with a theoretical plate count of 3377 and a tailing factor of 1.08 (table 4). The representative chromatogram recorded at 280 nm (fig. 3) demonstrates a sharp and symmetric peak with no interfering signals, supporting the system performance and specificity of the method.
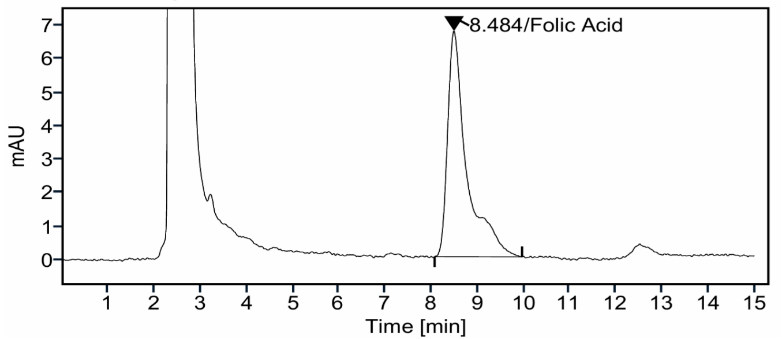
Fig. 3: Representative high-performance liquid chromatography (HPLC) chromatogram of folic acid (FA) standard obtained at 280 nm, demonstrating a sharp and symmetric peak at a retention time of about 8.48 min, supporting method specificity and system suitability
Cyanocobalamin (vitamin B12) eluted at 5.86 min and showed a high theoretical plate count of 8806 with a tailing factor of 1.40 (table 4), indicating excellent column efficiency. The representative chromatogram (fig. 4) displays a well-resolved and symmetrical peak at the expected retention time, further supporting the suitability of the system for Cyanocobalamin (vitamin B12) analysis under the established conditions.
Overall, the system suitability results, together with the representative chromatograms (fig. 2–4), demonstrate that the developedhigh-performance liquid chromatography (HPLC) methods are robust and capable of providing reliable and reproducible chromatographic performance for the estimation of ascorbic acid, folic acid, and cyanocobalamin.
Precision (repeatability and intermediate precision)
Intra-day and inter-day precision results for all analytes are summarized in table 5, where % RSD values did not exceed 2.0 for any analyte.
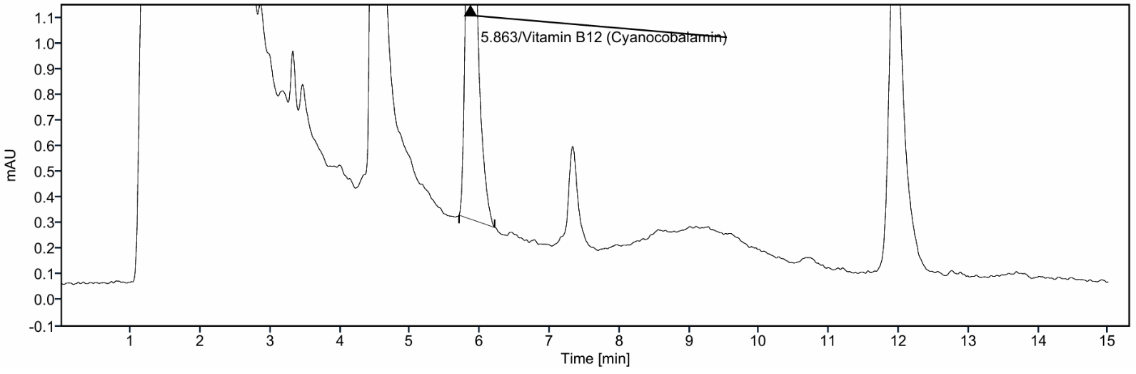
Fig. 4: Representativehigh-performance liquid chromatography (HPLC) chromatogram of cyanocobalamin (vitamin B12) demonstrating a well-resolved peak at a retention time of about 5.86 min, supporting method specificity and system suitability under the established analytical conditions
Table 4: System suitability parameters for the developed high-performance liquid chromatography (HPLC) method
| Parameter | Ascorbic acid (vitamin C) | Folic acid (FA) | Cyanocobalamin (vitamin B12) | Acceptance criteria |
| Retention time (min) | 2.75 | 8.48 | 5.86 | — |
| Theoretical plates (N) | 3452 | 3377 | 8806 | Not less than (NLT)2000 |
| Tailing factor | 1.12 | 1.08 | 1.4 | Not more than (NMT) 2.0 |
| % RSD of peak area | 0.85 | 0.92 | 0.8 | Not more than (NMT) 2.0 |
Abbreviations: N – theoretical plate count; RSD – relative standard deviation; NLT – not less than; NMT – not more than; min – minutes.
Table 5: Intraday and interday precision results for all analytes (n=6)
| Analyte | Intraday precision (n = 6) mean peak area±SD | Interday precision (n = 6) mean peak area±SD | % RSD (Intraday/Interday) | Acceptance criteria |
| Ascorbic acid (vitamin C) | 145,623±1,120 | 144,980±1,678 | 0.88 %/1.12 % | Not more than (NMT) 2.0 |
| Folic acid (FA) | 98,452±1,012 | 97,965±1,324 | 1.03 %/1.35 % | Not more than (NMT) 2.0 |
| Cyanocobalamin (vitamin B12) | 512,786±3,841 | 509,920±4,623 | 0.75 %/0.91 % | Not more than (NMT) 2.0 |
| Ferric pyrophosphate (FPP) | 78,524±925 | 77,885±1,146 | 1.18 %/1.47 % | Not more than (NMT) 2.0 |
Abbreviations: SD – standard deviation; RSD – relative standard deviation; FA – folic acid; FPP – ferric pyrophosphate; n = 6 represents the number of replicate determinations. All % RSD values were within acceptance limits (<2 %).
Robustness
Deliberate variations in flow rate, column temperature, and mobile-phase composition did not produce significant changes in retention time or peak area. Retention time variation remained below 1 %, and peak area variation remained below 2 %.
Forced degradation studies
Acidic, oxidative, thermal, and photolytic stress conditions were applied to generate representative degradation products in accordance with the principles of ICH Q1. Stress severity was selected to produce partial degradation sufficient to challenge the analytical methods without causing complete decomposition of the analytes. The applied conditions were therefore considered appropriate for evaluating method specificity and stability-indicating capability, rather than for detailed degradation pathway characterization.
Accuracy (recovery results)
Recovery results obtained at 80 %, 100 %, and 120 % of the target concentration are presented in tables 7 and 8 mean recovery values ranged between 98 % and 102 % for both high-performance liquid chromatography (HPLC) and ultraviolet–visible (UV–Vis) spectroscopy methods.
Table 6: Forced-degradation study results for all analytes
| Condition | Degradation (%) | Resolution from degradants | Peak purity |
| Acid hydrolysis | 18-22 % | >2.0 | Pass |
| Oxidation | 15-20 % | >2.0 | Pass |
| Thermal stress | ≤ 5 % | >2.0 | Pass |
| Photolysis | 10-18% | >2.0 | Pass |
Abbreviations: FA-folic acid; % – percentage. Note: Resolution values>2.0 indicate adequate separation between analyte and degradation products.
Table 7: Accuracy (recovery) results for the high-performance liquidchromatography (HPLC) methods
| Analyte | 80 % recovery | 100 % recovery | 120 % recovery | Mean recovery (%) |
| Ascorbic acid (vitamin C) | 99.1 | 100.3 | 101.5 | 100.3 |
| Folic Acid (FA) | 98.8 | 99.9 | 101.2 | 100 |
| Cyanocobalamin (vitamin B12) | 99.4 | 100.1 | 101 | 100.2 |
Abbreviations: HPLC-high-performance liquid chromatography; FA-folic acid; RSD – relative standard deviation.
Table 8: Accuracy (recovery) results for Ferric pyrophosphate (FPP) by ultraviolet–visible (UV–Vis) spectroscopic method
| Recovery level | Amount added (% of target) | % Recovery | Acceptance criteria |
| Level 1 | 80 % | 98.9 % | 98–102 % |
| Level 2 | 100 % | 100.0 % | 98–102 % |
| Level 3 | 120 % | 101.1 % | 98–102 % |
| mean recovery | — | 100.0 % | Meets criteria |
Abbreviations: UV–Vis-ultraviolet–visible spectroscopy; FPP-ferric pyrophosphate; RSD – relative standard deviation.
Table 9: Assay results for XteeHb tablets
| Analyte | Label claim | Result (% of label claim) | Compliance |
| Ascorbic acid (vitamin C) | 50 mg | 125.88 % | Meets specification |
| Folic acid(FA) | 125 µg | 122.08 % | Meets specification |
| Ferric pyrophosphate (FPP) | 29 mg | 108.90 % | Meets specification |
| Cyanocobalamin (vitamin B12) | 0.75 µg | 133.32 % | Meets specification |
Abbreviations: FA-folic acid; FPP-ferric pyrophosphate; % – percentage.
Table 10: Standard addition recovery results for all analytes
| Analyte | 80 % spike (% recovery) | 100 % spike (% recovery) | 120 % spike (% recovery) |
| Ascorbic acid (vitamin C) | 99.4 % | 100.3 % | 101.2 % |
| Folic acid (FA) | 98.8 % | 99.7 % | 101.0 % |
| Cyanocobalamin (vitamin B12) | 99.6 % | 100.5 % | 101.4 % |
| Ferric pyrophosphate (FPP) | 98.9 % | 99.5 % | 100.7 % |
Abbreviations: FA-folic acid; FPP-ferric pyrophosphate; % – Percentage, Note: Standard addition study performed to ensure absence of analytical bias.
Assay of marketed tablet formulation
Assay results of the marketed XteeHb tablet formulation are summarized in table 9, where all analytes showed assay values not less than 90 % of the respective label claims.
Standard addition experiment to rule out analytical bias
Standard addition recovery results obtained at 80 %, 100 %, and 120 % spike levels for all analytes are summarized in table 10.
Data source clarification
System suitability parameters were obtained from instrument-generated statistical summaries following six replicate injections, whereas linearity, precision, accuracy, assay, and standard addition results were derived from independent validation experiments.
DISCUSSION
Analytical method development for XteeHb Tablets, comprising ferric pyrophosphate (FPP), ascorbic acid (vitamin C), cyanocobalamin (vitamin B12), and folic acid (FA), required careful consideration of the substantial physicochemical diversity of the active ingredients. Although a single, simultaneous high-performance liquid chromatography (HPLC) method was initially explored, this approach was found to be impractical. Similar limitations have been reported in earlier studies, where analytes with markedly different polarity, stability, and ultraviolet absorbance could not be accommodated within a single chromatographic system without compromising peak shape or reproducibility. In the present work, ferric pyrophosphate exhibited poor reverse-phase retention and negligible UV absorbance, resulting in peak distortion under conditions suitable for vitamin analysis. Conversely, ascorbic acid, cyanocobalamin, and folic acid required distinct pH environments, stationary phases, and detection wavelengths to achieve acceptable retention, peak symmetry, and resolution, consistent with observations reported for individual vitamin assays in the literature.
The finalized analytical conditions summarized in table 1 were therefore selected to specifically address these challenges. Use of an octadecylsilane (C18) column under acidic conditions improved chromatographic stability and peak symmetry for ascorbic acid, in agreement with previously reported RP-HPLC methods for vitamin C analysis. Cyanocobalamin showed improved retention and peak shape on an octylsilane (C8) column with a higher organic mobile-phase composition, consistent with literature reports indicating better performance of less hydrophobic stationary phases for highly polar B-complex vitamins. Folic acid required a buffered mobile phase near neutral pH to overcome solubility limitations and co-elution tendencies, a requirement also noted in earlier chromatographic studies of folate derivatives. For ferric pyrophosphate, a UV–Vis spectrophotometric method based on coloured complex formation was adopted, as similarly reported for iron determination in pharmaceutical dosage forms, where chromatographic approaches often suffer from poor reproducibility.
Validation results obtained in this study compare favourably with those reported for established analytical methods. Linearity with correlation coefficients ≥ 0.999, precision with %RSD values below 2 %, and recovery within 98–102 % are consistent with previously published HPLC and spectrophotometric methods for vitamins and iron. These results confirm that the independently optimized methods provide analytical performance comparable to, and in some cases exceeding, that of earlier reports, while maintaining full compliance with ICH Q2(R1) requirements. Standard addition experiments further supported method reliability, as consistent recoveries across 80 %, 100 %, and 120 % spike levels ruled out matrix interference and analytical bias.
The elevated assay values observed for ascorbic acid, folic acid, and cyanocobalamin, reaching approximately 30 % above the label claim, merit contextual interpretation. Similar observations have been reported in the literature for multivitamin and hematinic formulations, where intentional overages are incorporated to compensate for degradation during manufacturing and storage. The present findings therefore, align with established formulation practices rather than indicating deficiencies in the analytical methodology. Nonetheless, these results emphasize the importance of routine assay monitoring and stability-supported justification of overages to ensure regulatory acceptability and patient safety.
Compared with previously reported studies, the present work extends existing analytical approaches by addressing a formulation that combines both organic vitamins and an inorganic iron salt within a single dosage form. While studies by Shaik and Gan focused on simultaneous vitamin estimation in biological matrices, and Kurdi et al. emphasized column technology for rapid vitamin analysis, these approaches did not consider the analytical incompatibility posed by inorganic iron salts. Other reports have demonstrated that chemically diverse analytes often require distinct chromatographic or spectrophotometric conditions, supporting the rationale for the multi-method strategy adopted here. The use of a dedicated ultraviolet–visible (UV–Vis) spectroscopic method for ferric pyrophosphate is further supported by earlier studies highlighting the robustness and suitability of spectrophotometric techniques for routine iron estimation.
Overall, although the limitation of not establishing a single-run HPLC method is acknowledged, the present study demonstrates that a multi-method analytical strategy provides superior reliability and practicality for complex hematinic formulations. The independently validated methods offer accurate, precise, and regulatory-compliant solutions for routine batch release, stability studies, and quality control of XteeHb Tablets, thereby strengthening their applicability in pharmaceutical quality assurance settings [21–26].
CONCLUSION
The analytical methods developed for XteeHb Tablets demonstrated strong accuracy, precision, and reliability for the estimation of multiple active ingredients in a complex formulation. Individual reverse-phase high-performance liquid chromatography (RP-HPLC) methods were successfully validated for ascorbic acid (vitamin C), cyanocobalamin (vitamin B12), and folic acid (FA), while ferric pyrophosphate (FPP) was accurately quantified using an ultraviolet–visible (UV–Vis) spectrophotometric approach due to its inorganic characteristics and poor compatibility with high-performance liquid chromatography (HPLC). All validation parameters, including specificity, linearity, precision, accuracy, and system suitability, complied with ICH requirements.
The developed methods employ commonly available instruments and reagents, ensuring their suitability for routine quality control applications. Overall, these validated analytical approaches provide a robust and regulatory-compliant framework for batch release, stability assessment, and long-term quality assurance of XteeHb Tablets.
ACKNOWLEDGEMENT
The authors would like to thank the Department of Science and Technology-Fund for Improvement of Science and Technology Infrastructure (DST-FIST) and Promotion of University Research and Scientific Excellence (DST-PURSE) for the facilities provided for conducting the research.
FUNDING
This research did not receive any funding.
AUTHORS CONTRIBUTIONS
Janorious Winka J: Writing original draft. Data curation, Formal analysis. S. P. Dhanabal: Conceptualization, Writing, Reviewing, and Editing, Supervision, Nalin D: Writing, Reviewing, and Editing, Veera Venkata Satyanarayana Reddy Karri: Reviewing and Editing.
CONFLICT OF INTERESTS
Declared none
REFERENCES
Kinyoki D, Osgood Zimmerman AE, Bhattacharjee NV, Local Burden of Disease Anaemia Collaborators, Kassebaum NJ, Hay SI. Anemia prevalence in women of reproductive age in low and middle-income countries between 2000 and 2018. Nat Med. 2021 Oct;27(10):1761-82. doi: 10.1038/s41591-021-01498-0, PMID 34642490, PMCID PMC8516651.
Hasan MM, Soares Magalhaes RJ, Garnett SP, Fatima Y, Tariqujjaman M, Pervin S. Anaemia in women of reproductive age in low and middle-income countries: progress towards the 2025 global nutrition target. Bull World Health Organ. 2022 Mar 1;100(3):196-204. doi: 10.2471/BLT.20.280180, PMID 35261408, PMCID PMC8886255.
Bayoumi I, Parkin PC, Birken CS, Maguire JL, Borkhoff CM; TARGet Kids! Collaboration. Association of family income and risk of food insecurity with iron status in young children. JAMA Netw Open. 2020 Jul 1;3(7):e208603. doi: 10.1001/jamanetworkopen.2020.8603, PMID 32729920, PMCID PMC12578488.
Deng J, Ramelli L, Li PY, Eshaghpour A, Li A, Schuenemann G. Efficacy of vitamin C with Fe supplementation in patients with iron deficiency anemia: a systematic review and meta-analysis. Blood Vessel Thromb Hemost. 2024 Aug 2;1(4):100023. doi: 10.1016/j.bvth.2024.100023, PMID 40765927, PMCID PMC12320449.
Fishman SM, Christian P, West KP. The role of vitamins in the prevention and control of anaemia. Public Health Nutr. 2000 Jun;3(2):125-50. doi: 10.1017/s1368980000000173, PMID 10948381.
Li N, Zhao G, Wu W, Zhang M, Liu W, Chen Q. The efficacy and safety of vitamin C for iron supplementation in adult patients with iron deficiency anemia: a randomized clinical trial. JAMA Netw Open. 2020 Nov 2;3(11):e2023644. doi: 10.1001/jamanetworkopen.2020.23644, PMID 33136134, PMCID PMC7607440.
Chen X, Yang Z, Xu Y, Liu Z, Liu Y, Dai Y. Progress and prediction of multicomponent quantification in complex systems with practical LC-UV methods. J Pharm Anal. 2023 Feb;13(2):142-55. doi: 10.1016/j.jpha.2022.11.011, PMID 36908853, PMCID PMC9999300.
Zaazaa HE, Abbas SS, Essam HA, El-Bardicy MG. Validated chromatographic methods for determination of perindopril and amlodipine in pharmaceutical formulation in the presence of their degradation products. J Chromatogr Sci. 2013 Jul;51(6):533-43. doi: 10.1093/chromsci/bms171, PMID 23112269.
Mazurek A, Wlodarczyk Stasiak M. A new method for the determination of total content of vitamin C, ascorbic and dehydroascorbic acid in food products with the voltammetric technique with the use of tris(2-carboxyethyl)phosphine as a reducing reagent. Molecules. 2023 Jan 13;28(2):812. doi: 10.3390/molecules28020812, PMID 36677868, PMCID PMC9861256.
Moreno P, Salvado V. Determination of eight water and fat-soluble vitamins in multi-vitamin pharmaceutical formulations by high-performance liquid chromatography. J Chromatogr A. 2000 Feb 18;870(1-2):207-15. doi: 10.1016/s0021-9673(99)01021-3, PMID 10722078.
Park JM, Koh JH, Kim JM. Development of pretreatment method for analysis of vitamin B12 in cereal infant formula using immunoaffinity chromatography and high-performance liquid chromatography. Food Sci Anim Resour. 2021 Mar;41(2):335-42. doi: 10.5851/kosfa.2020.e92, PMID 33987553, PMCID PMC8115006.
Modupe O, Maurras JB, Diosady LL. A spectrophotometric method for determining the amount of folic acid in fortified salt. J Agric Food Res. 2020 Dec;2:100060. doi: 10.1016/j.jafr.2020.100060, PMID 33458702, PMCID PMC7792661.
Lebiedzinska A, Dabrowska M, Szefer P, Marszall M. High-performance liquid chromatography method for the determination of folic acid in fortified food products. Toxicol Mech Methods. 2008 Jul;18(6):463-7. doi: 10.1080/15376510701623870, PMID 19696945, PMCID PMC2728762.
Chaudhary A, Wang J, Prabhu S. Development and validation of a high-performance liquid chromatography method for the simultaneous determination of aspirin and folic acid from nano-particulate systems. Biomed Chromatogr. 2010 Sep;24(9):919-25. doi: 10.1002/bmc.1386, PMID 20033881, PMCID PMC2891271.
Siddiqui B, Ahmed H, Haq IU, Rehman AU, Ahmed N. Development and validation of HPLC method for simultaneous determination of leflunomide and folic acid in the nanoparticulate system by reversed-phase HPLC. Drug Dev Ind Pharm. 2023 Aug;49(8):497-507. doi: 10.1080/03639045.2023.2239346, PMID 37470519.
Gazdik Z, Zitka O, Petrlova J, Adam V, Zehnalek J, Horna A. Determination of vitamin C (ascorbic acid) using high-performance liquid chromatography coupled with electrochemical detection. Sensors (Basel). 2008 Nov 7;8(11):7097-112. doi: 10.3390/s8117097, PMID 27873917, PMCID PMC3787433.
Nurchi VM, Cappai R, Spano N, Sanna G. A friendly complexing agent for spectrophotometric determination of total iron. Molecules. 2021 May 21;26(11):3071. doi: 10.3390/molecules26113071, PMID 34063849, PMCID PMC8196596.
Mateeva A, Kondeva Burdina M, Peikova L, Guncheva S, Zlatkov A, Georgieva M. Simultaneous analysis of water-soluble and fat-soluble vitamins through RP-HPLC/DAD in food supplements and brewer’s yeast. Heliyon. 2023;9(1):e12706. doi: 10.1016/j.heliyon.2022.e12706, PMID 36632098, PMCID PMC9826864.
Li HB, Chen F, Jiang Y. Determination of vitamin B12 in multivitamin tablets and fermentation medium by high-performance liquid chromatography with fluorescence detection. J Chromatogr A. 2000 Sep 8;891(2):243-7. doi: 10.1016/s0021-9673(00)00724-x, PMID 11043784.
Moreno P, Salvado V. Determination of eight water and fat-soluble vitamins in multi-vitamin pharmaceutical formulations by high-performance liquid chromatography. J Chromatogr A. 2000 Feb 18;870(1-2):207-15. doi: 10.1016/s0021-9673(99)01021-3, PMID 10722078.
Shaik MM, Gan SH. Rapid resolution liquid chromatography method development and validation for simultaneous determination of homocysteine vitamins B(6), B(9), and B(12) in human serum. Indian J Pharmacol. 2013 Mar-Apr;45(2):159-67. doi: 10.4103/0253-7613.108303, PMID 23716893, PMCID PMC3660929.
Kurdi SE, Muaileq DA, Alhazmi HA, Bratty MA, Deeb SE. Comparing monolithic and fused core HPLC columns for fast chromatographic analysis of fat-soluble vitamins. Acta Pharm. 2017 Jun 27;67(2):203-13. doi: 10.1515/acph-2017-0013, PMID 28590909.
Mantripragada MK, Rao SV, Nutulapati VV, Mantena BP. Simultaneous determination of impurities of atazanavir and ritonavir in tablet dosage form by using reversed-phase ultra-performance liquid chromatographic method. J Chromatogr Sci. 2018 Mar 1;56(3):270-84. doi: 10.1093/chromsci/bmx110, PMID 29300835.
Munir MA, Inayatullah A, Ibrahim S, Rimba Putri IR, Emelda E, Fatmawati A. A modest UV spectrophotometric method assisted by chemometric approach for verification of acetaminophen level in manufactured tablets and syrups in Indonesian pharmacies. Int J App Pharm. 2023;15(1):195-205. doi: 10.22159/ijap.2023v15i1.46290.
Parveen N, Routh T, Goswami AK, Mondal S. A robust analytical method development, validation and stress degradation study for estimating ritonavir by UV-spectroscopy and HPLC. Int J App Pharm. 2023;15(4):214-24. doi: 10.22159/ijap.2023v15i4.47924.
Gioia MG, Di Pietra AM, Gatti R. Validation of a spectrophotometric method for the determination of iron (III) impurities in dosage forms. J Pharm Biomed Anal. 2002 Aug 1;29(6):1159-64. doi: 10.1016/s0731-7085(02)00170-x, PMID 12110403.