
Int J App Pharm, Vol 18, Issue 2, 2026, 84-96Original Article
POTENTIAL OF TRANSFERSOMAL DELIVERY SYSTEM IN IMPROVING THE THERAPEUTIC OUTCOME OF LAPATANIB IN BREAST CANCER TREATMENT
RAMINENI SUNITHA1, PRAVEEN SIVADASU1*, P. BHARGHAVA BHUSHAN RAO2
*1Department of Pharmaceutics, K L College of Pharmacy, Koneru Lakshmaiah Education Foundation, Vaddeswaram-522302, Andhra Pradesh, India. 2A. M. Reddy Memorial College of Pharmacy, Petlurivaripalem, Narasaraopet, A. P, India
*Corresponding author: Praveen Sivadasu; *Email: praveen.sivadasu399@gmail.com
Received: 19 Nov 2025, Revised and Accepted: 09 Feb 2026
ABSTRACT
Objective: This study aimed to develop and optimize lapatinib ditosylate (LAP)-loaded transferosomes using a 32-factorial design.
Methods: LAP-loaded transferosomes were prepared by the rotary thin-film hydration method using Labrafac Lipophile WL1349 and Tween 80. The independent variables in transferosome preparation were the amount of Labrafac Lipophile WL1349 (X1) and Tween 80 (X2). The dependent variables analyzed were vesicle size (Y1) and percent entrapment efficiency (%EE) (Y2). The resulting transferosomes were characterized for several parameters: drug content, particle size distribution, entrapment efficiency, zeta potential (ZP), polydispersity index (PDI), and morphology via transmission electron microscopy (TEM). In vitro drug release studies were also performed. The optimized transferosomes were then incorporated into a gel formulation, having a good appearance and a suitable pH, spreadability, and viscosity. The finalized transferosomal gel was further evaluated through in vitro diffusion studies and confocal laser scanning microscopy (CLSM).
Results: The optimal LAP-loaded transferosomes displayed a vesicle size of 295±0.13 nm and %EE of 77.4±0.71%, along with a PDI of 0.103±0.024. TEM analysis revealed the vesicles to be spherical with a lamellar structure. The vesicles possessed a high negative surface charge of-44.3 mV, attributed to the presence of Tween 80, indicating strong electrostatic repulsion. In vitro permeation studies showed a sustained release of 84.3±0.38% over 24 h. The optimized transferosomal formulation was incorporated into a Carbopol 934-based gel. In vitro diffusion studies confirmed that the 2% Carbopol 934 transferosomal gel facilitated enhanced drug release of 87.83±2.6%. Furthermore, ex vivo permeation studies exhibited a 2.4-fold superior skin penetration compared to less elastic formulations.
Conclusion: This research confirms that transferosomes are effective nanoscale carriers for LAP, significantly enhancing skin penetration, as confirmed by a 2.4-fold increase in ex vivo permeation and deep epidermal delivery visualized by CLSM.
Keywords: Lapatanib, Transferosomes, 32 Factorial design, Thin film hydration method, CSLM studies
© 2026 The Authors.Published by Innovare Academic Sciences Pvt Ltd. This is an open access article under the CC BY license (https://creativecommons.org/licenses/by/4.0/)
DOI: https://dx.doi.org/10.22159/ijap.2026v18i2.57564 Journal homepage: https://innovareacademics.in/journals/index.php/ijap
INTRODUCTION
Breast cancer is the most frequently diagnosed cancer and the leading cause of cancer deaths in women. Despite advancements in medical research, the exact etiology of breast cancer remains elusive. The treatment strategy often depends on the tumor's stage and characteristics, allowing clinicians to employ either monotherapy or a combination of interventions to combat the disease effectively. Nevertheless, a significant limitation of these traditional treatments is their tendency to impact normal, healthy cells as well, due to their non-specific nature. In light of these challenges, researchers are increasingly exploring localized drug delivery systems for breast cancer treatment. This innovative strategy seeks to enhance the therapeutic index by delivering higher concentrations of drugs directly to the tumor while minimizing exposure to surrounding healthy tissues [1-5].
LAP is a potent and selective inhibitor that targets the dual tyrosine kinases ErbB-2 and EGFR. LAP is classified as a class-II, and it exhibits suboptimal pharmacokinetic properties. The oral bioavailability (2.9%) of LAP shows significant interpatient variability and is greatly influenced by food intake and undergoes extensive hepatic metabolism. Research indicates that both low-fat and high-fat diets before LAP administration can enhance its bioavailability. Additionally, gastric pH plays a role in influencing LAP bioavailability [6-10]. To improve the bioavailability of LAP and target it to tumors through passive methods, transferosomes were prepared for better drug encapsulation.
LAP transferosomes are flexible vesicles designed to enhance targeted drug delivery to breast cancer [11, 12]. They improve penetration through skin and target cancer cells. This leads to better drug retention, bioavailability, and reduced side effects [13].
While previous studies on LAP delivery have mainly focused on oral or non-optimized topical systems, limited work has explored statistically optimized transferosomal formulations with confirmed skin penetration and sustained release. This study fills that gap by developing an optimized transferosomal gel that demonstrates enhanced permeation, controlled release, and potential for localized therapy, thereby offering an improved approach for LAP delivery in breast cancer treatment.
Transferosomes are chosen as the novel technique to deliver the drug transdermally in order to achieve good permeation. Transdermal delivery could bypass the extensive hepatic metabolism and food-dependent bioavailability issues of oral LAP and can enhance the localized delivery to breast tissue.
By using this approach, LAP therapeutic efficacy can be improved, and more efficient and patient-friendly breast cancer treatment can be offered [14].
This study investigates the development of LAP-loaded transferosomes using a 32-factorial design by employing the Design Expert Software Version 12. It systematically illustrates the methods by which important formulation variables and their relationships regulate entrapment, release, penetration, and cytotoxicity. The independent variables that were considered for the formulation are lipid (labrafac lipophile WL1349) (X1) and Tween 80 (X2). The dependent variables analyzed were vesicle size (Y1) and %EE (Y2). 32 factorial design proved to be a robust tool for optimizing formulation parameters and assessing the effects of formula components on the performance characteristics, such as permeation of LAP transferosomal preparation in breast cancer treatment.
MATERIALS AND METHODS
Materials
LAP from Lupin Pharma Ltd, Labrafac Lipophile WL1349 from Gattefosse, France, Tween 80 from Merck(Mumbai), Labrafil from Gattefosse, France, Tween 20 from Merck(Mumbai), Capmul MCM from Abitec Group(ULABRAFAC), Fujicalin from Fuji chemical industry, Labrasol from Gattefosse, France, Cremophor EL from Gattefosse, France, Carbapol from mylan, hyderabad.
Methods
High-performance liquid chromatography (HPLC) analytical method development
LAP concentration was quantified using an HPLC system (Waters, USA) equipped with a Rheodyne 7725i injector, 1525 binary pump, Symmetry® C18 column (4.6×75 mm, 3.5 μm), and a 2998 photodiode array detector. The mobile phase consisted of acetonitrile and 0.1% formic acid in water (50:50, v/v) at a flow rate of 1.0 ml/min, with the column temperature maintained at 30±1 °C. Detection was performed at 262 nm, and data acquisition was carried out using Breeze2 software. Calibration curves were prepared over a concentration range of 500–3000 ng/ml. The method was validated for specificity, accuracy, precision, linearity, LOD, and LOQ in accordance with ICH Q2 (R1) guidelines [15-17].
Determination of the solubility of LAP in different solvents
Excess LAP (50 mg) was added to 5 ml of distilled water, 0.1 N HCl, methanol, DMSO, phosphate buffer (pH 5.0), and phosphate buffer (pH 7.4) in separate vials. The mixtures were vortexed for 2 min and equilibrated on a mechanical shaker at 150 rpm and 25 °C for 24 h to achieve saturation. Samples were then centrifuged at 10,000 rpm for 15 min, and 1 ml of the clear supernatant was carefully collected. Appropriate dilutions were performed to obtain concentrations within the linear range of the HPLC method: 1:100 for aqueous, methanolic, and buffer samples, and 1:1000 for DMSO samples. The diluted solutions were analyzed in triplicate using a validated HPLC method [18].
Solubility of LAP in various lipids
The solubility of LAP was evaluated in selected lipids, including olive oil, soybean oil, Labrafac® ME oil, Captex® 200, Capmul® MCM, arachis oil, Labrafac® Lipophile WL 1349, Compritol® 888 ATO, Precirol® ATO 5, stearic acid, and glyceryl monostearate. Briefly, 100 mg of LAP was placed in a test tube, and lipids were added incrementally in 0.5 g portions. The mixtures were heated in a water bath at 80 °C (approximately 5 °C above the lipid melting point) to obtain molten lipids and facilitate drug dissolution. The amount of lipid required to completely dissolve LAP was recorded [19].
Solubility of LAP in various surfactants
The solubility of LAP was assessed in different surfactants, including Gelucire® 44/14, Labrafil® M2125, Cremophor® EL, Labrasol®, Tween® 20, Tween® 80, Span® 20, and Span® 80. An excess amount of LAP was added to a fixed volume of each surfactant and agitated for 2 min, followed by shaking for 12 h. Samples were centrifuged at 10,000 rpm for 15 min, and the clear supernatant was diluted with methanol and analyzed for drug content [20].
Pre-formulation study and the screening results
The optimization focused on four key aspects:
Edge activator: Different edge activators were tested at a 15% concentration while keeping other ingredients constant.
Lipid: Different lipids were tested at 85% concentration, keeping other ingredients and a selected edge activator constant.
Lipid: Edge activator ratio: Ratios of lipid to the selected edge activator were varied (95:5, 90:10, 85:15, 80:20) to find the optimal combination.
Drug concentration: Different drug concentrations were tested while maintaining a constant lipid: edge activator ratio and other ingredients, to maximize drug incorporation in the transfersomes [21].
The goal of the pre-formulation study was to maximize penetration through a dialysis membrane. From the preliminary studies 85:15 ratio was selected as a low level.
Formulation and development of LAP-loaded transferosomes
LAP-loaded transferosomes were prepared using the rotary thin film hydration method. Labrafac (X1%), tween 80(X2%) represent the ratio of the lipid–surfactant phase. A lipid mixture of oflabrafac, tween 80 and LAP (0.1g) was dissolved in a methanol solution, evaporatedunder reduced pressure to form a uniform lipid film, and then hydrated with PBS at pH 6.4 to create large multilamellar vesicles (MLVs). The MLVs were sonicated to produce small unilamellar vesicles (SUVs) and filtered for uniformity, with storage at 4 °C for characterization. A parallel method was used to create empty transferosomes. The components of several transferosomal formulations are shown in table 1 [22].
Table 1: Formulae of LAP-loaded transferosomes
| Formulation code | Independent variables | Drug (g) | Methanol (ml) | PBS (ml) | |||
| X1 (Labrafac) | X2 (Tween 80) | X1 (%) | X2 (%) | ||||
| LAP-TF1 | -1 | +1 | 85 | 20 | 0.1 | 10 | 10 |
| LAP-TF2 | -1 | 0 | 85 | 17.5 | 0.1 | 10 | 10 |
| LAP-TF3 | -1 | -1 | 85 | 15 | 0.1 | 10 | 10 |
| LAP-TF4 | 0 | -1 | 87.5 | 15 | 0.1 | 10 | 10 |
| LAP-TF5 | 0 | 0 | 87.5 | 17.5 | 0.1 | 10 | 10 |
| LAP-TF6 | 0 | +1 | 87.5 | 20 | 0.1 | 10 | 10 |
| LAP-TF7 | +1 | -1 | 90 | 15 | 0.1 | 10 | 10 |
| LAP-TF8 | +1 | 0 | 90 | 17.5 | 0.1 | 10 | 10 |
| LAP-TF9 | +1 | +1 | 90 | 20 | 0.1 | 10 | 10 |
X₁ and X₂ denote the labrafac: tween 80 ratio in the lipid surfactant phase; 0.1 g LAP was added to each formulation.
32factorial design
A two-factor, 3-level factorial design (32) was utilized to optimize transferosomes formulations through Design-Expert® software (Version 12.0.0, Stat-Ease Inc., Minneapolis, USA), assessing the effects of lipophile WL1349 (X1) and tween 80 (X2) on vesicle size (Y1) and % EE(Y2). Initial studies indicated that labrafac concentrations below 75% and phospholipid levels above 85% led to poor entrapment efficiency and larger vesicle sizes, respectively. Additionally, surfactant (tween 80) concentrations below 10% or above 15% were ineffective. Therefore, optimal levels were set at 85-90% for labrafac (phospholipid) and 15-20% for Tween 80 for further experimentation [23-25]. Table 2 provides comprehensive details on the response variables under investigation as well as the design matrix. Analysis of variance (ANOVA) was conducted to determine the significance of regression coefficients and their impact on the responses, based on p-values and F-values.
Transfersomes characterization
FTIR investigations
To analyze a sample mixed with potassium bromide, pellets are used under high pressure. These pellets were scanned over a specific wavelength range, 4000 to 400 cm-1, and the resulting spectra were compared to the standard frequencies of LAP. Using a Bruker Optics GmbH Vertex 70 FTIR Spectrometer (Model no.), FTIR graphs were generated for both the more effective transferosomal formulation and the pure drug [26].
Table 2: The variables with their levels in a 32-factorial design for the development of transfersomes loaded with LAP
| Factor | Levels that were actually coded | ||
| Independent variable | Low (-1) | Medium (0) | High (+1) |
| X1: Labrafac | 85 | 87.5 | 90 |
| X2: Tween 80 | 15 | 17.5 | 20 |
| Dependent variable | |||
Y1: Vesicle size (nm) Y2: EE (%) |
Minimize Maximize |
||
The levels 1, 0, and+1 correspond to low, medium, and high amounts of each component and levels were selected based on preliminary pre-formulation studies.
Differential scanning calorimetry (DSC)
The thermal behaviour of lapatinib and various excipients was tested in terms of their melting temperature. This was performed with a combined thermal analysis system, Hitachi Japan (Model DSC 7020), with about 1 to 5 mg of the sample placed in a sealed aluminium pan. The samples were scanned at 30-300 °C at a constant rate of 10 °C/min under nitrogen [27].
Particle size analysis
Particle size measurement was conducted using 50μL of sample with a Horiba Scientific (Model no: SZ-100 Nano Particle Analyzer) at a 90° angle, and 25±1 °C. The instrument automatically calculated the hydrodynamic diameter (Z-average particle size) from scattered-light intensity. The light dispersion's dynamic strength was determined by the device based on the medium viscosity, which was 90 degrees for low-viscosity specimens and 170 degrees for specimens with greater viscosities. This suggests that the PDI should be less than 0.7 and the Transferosomes vesicle size should be between 50 and 500 nm, as indicated by the distribution of the uniform monodisperse size. Each sample was measured in triplicate, and the mean±standard deviation was recorded to ensure reproducibility and reliability of the results [28].
PDI and ZP
Dynamic light scattering was used to determine the ZP and PDI of different formulations (Malvern ZEN2600 Nano-Z Zetasizer/Zeta Potential Analyser). A 1 ml vesicular suspension was diluted with 10 ml of distilled water to assess particle size distribution uniformity [29].
In vitro release of the drug
A franz diffusion cell with a 3.14 cm² surface area and a 15 ml capacity was used to study in vitro drug release of transfersomes. Before the experiment, a dialysis membrane was positioned across the donor and receptor compartments after being submerged in phosphate buffer (pH 6.4) for a full day. The donor contained 0.1 ml of transfersomal suspension, while the receptor had 15 ml of phosphate buffer (pH 6.4), stirred at 34 °C. Samples of 1 ml were periodically withdrawn and analyzed using HPLC at 262 nm, with each withdrawal replaced by fresh buffer [30].
%EE
Using ultracentrifugation to separate transferosomes from unentrapped medication, %EE was calculated. After being separated, the vesicles were filtered, sonicated for about 15 min, and then resuspended in ethanol. To determine the drug concentration, the resulting filtrate has been diluted using phosphate buffer (pH 6.4) for HPLC analysis [31].
TEM studies
To ensure that the light scattering intensity remained within the sensor's sensitivity range, the transferosomal suspension was diluted with double-distilled water. Copper grids with a thin carbon layer were loaded with LAP transferosomal suspension for TEM imaging investigation, and they were then allowed to dry at room temperature. Following complete drying of the sample, the pictures were taken using a 200 Kv accelerating voltage and 0.27 nm point resolution using a transmission electron microscope (Philips Electron Optics: model Tecnai-20 Transmission Electron Microscope) [32].
Optimization of transferosomal gel
It was done on the basis of concentration of carbopol 934 (0.5%, 1%, 1.5% and 2%) as described in table 9.
Evaluation of LAP-loaded transferosomal gel
pH measurement
At room temperature, the pH of the formulations was measured using a digital pH meter (RI-152-R). After dissolving 1 g of gel in roughly 10 ml of water, it was mixed to create a dispersion and was kept aside for two hours. A calibrated pH meter was used to measure the pH of the dispersion [33].
Spreading diameter
After one minute, the spreading diameter of 1 g of gel between two horizontal plates (20 cm x 20 cm) was measured to assess the gel formulation's spread ability. A standard weight of 125 g was placed on the upper plate [34].
Drug content
50 millilitres of pH 6.4 phosphate buffer were used to dissolve 500 milligrams of gel. Following filtration, 50 μl of the filtrate was then diluted using 3.5 ml of distilled water, and then HPLC was used to determine the drug content of LAP [35].
Rheological investigations
Employing a Brookfield DV3T/DV Next rheometer cone and plate viscometer, the rheological characteristics of gels were evaluated. A 0.5 ml sample was tested for viscosity, shear stress, and shear rate at various speeds, as well as thixotropic behavior at 25 °C using the CP 52 spindle and Rheocalc software [36].
Extrudability test
After adding the weight in grams necessary to extrude a gel ribbon of at least 0.5 cm in length in 10 seconds, the total amount of gel (g/cm2) extruded from the lacquered aluminum collapsible tube was calculated. The provided formula can be used to assess the extrudability [37].

Skin irritation test
Three groups of healthy rats (Procured from Jeevan Life Sciences, Malkajgiri, Hyderabad), each consisting of six rats of either sex, participated in the skin irritation study. The animals had unrestricted access to water and were fed regular animal feed. The rats' research hair was shaved from the back on one day, and five centimeters of the area were marked on each side; one side was used as a control, and the other was used for testing. After applying the prepared transferosomal gel for seven days, the location was checked for any sensitivity or reactions. Skin irritation was observed and scored daily using a grading scale: 0 (no reaction) to 3 (severe erythema, potentially with edema). The experimental protocols were approved by the institutional animal ethical committee (IAEC) (CCSEA REG NO: 1219/Re/s/08/CCSEA) [38, 39].
Diffusion studies
In vitro diffusion experiments of transferosomal gel were performed using a franz diffusion cell maintained at 32±1 °C with excised rat abdominal skin. The experimental protocols were approved by the IAEC (CCSEA REG NO: 1219/Re/s/08/CCSEA). One g of the gel was placed in contact with the skin, while the donor compartment contained a constant drug amount and the receptor compartment was filled with 20 ml of pH 6.4 phosphate buffer, stirred continuously at 300 rpm. 2 ml of samples were taken at various time intervals and immediately replaced with fresh buffer to maintain a constant volume, filtered, diluted, and analyzed by HPLC [40].
CLSM studies
This study employed CLSM to investigate the skin permeation of lapatinib-loaded transferosomes. Transferosomes were labelled with Rhodamine-DHPE and applied to the abdominal part of hairless goat skin (sourced from a local market in Narasaraopet; six months of age at the time of the experiment). Skin sections (1 cm²) were analyzed via CLSM for up to 12 h to determine the depth of fluorescent probe penetration after removing excess vesicles. CLSM scans covered the full skin thickness at various depths. Before transferosome application, the skin was soaked in a dye-containing drug solution, and a franz diffusion cell was used for assessments at 2-hour intervals throughout the 12 h. Skin samples were preserved in formalin for subsequent analysis [41].
RESULTS AND DISCUSSION
HPLC analytical method development for LAP
Standard stock solutions of lapatinib (LAP) and gemcitabine hydrochloride (internal standard) were prepared by dissolving 25 mg of each drug in 25 ml of acetonitrile and 0.1% formic acid in water (50:50, v/v) to obtain a concentration of 1 mg/ml. Working standard solutions of LAP were prepared in the concentration range of 2–60 µg/ml, with gemcitabine hydrochloride maintained at a constant concentration of 5 µg/ml. A volume of 20 µl** of each working solution was injected into the HPLC system for analysis.
Table 3: Solubility of LAP in different solvents
| Solvent | Solubility (mg/ml) |
| Distilled water | 0.021±002 |
| 0.1 N HCL | 0.01±0.06 |
| Methanol | 1.71±0.04 |
| DMSO | 23.9±0.09 |
| Phosphate buffer pH 7.2 | 1.23±0.07 |
| Phosphate buffer pH 5.0 | 1.1±0.03 |
Results are expressed as mean±SD, n=3
Determination of the solubility of LAP in different solvents
Solubility studies showed that LAP has maximum solubility in DMSO, followed by ethanol and phosphate buffers, as shown in table 3. However, it is important to note that DMSO is an external solvent and has no direct impact on LAP's absorption within the body. The findings suggest that LAP's dissolution is favoured in environments similar to those found in tumors, which often have acidic pH values. Ethanol enhances the formulation's skin penetration because, in this research, LAP dissolves better in ethanol than in water.
Solubility study of the drug in various lipids and surfactants
Based on the findings from the aforementioned studies (table 4), it was observed that the drug exhibits significantly high solubility levels when combined with labrafac lipid and the surfactant tween 80. Consequently, for the next phase of formulation optimization, the decision was made to utilize a combination of labrafac lipid and tween 80 surfactant.
Table 4: Solubility of LAP in lipids and surfactants
| Oils/Surfactants | Solubility of LAP in mg/ml mean±sd |
| Olive oil | 5.8±0.25 |
| Soyabean Oil | 6.8±0.36 |
| Stearic Acid | 17.8±0.47 |
| SeLabrafacme oil | 13.4±0.72 |
| Capmul MCM | 16.5±0.83 |
| Arachis oil | 15.3±0.35 |
| Compritol 888ATO | 49.7±0.69 |
| Precirol ATO 5 | 31.0±0.53 |
| Captex 200 | 35.91±0.39 |
| LabrafaclipophileWL1349 | 127.54±0.23 |
| Tween 20 | 79.83±0.51 |
| Gelucire 44/14 | 74.71±0.47 |
| Span 20 | 69.93±0.83 |
| Span 80 | 78.92±0.94 |
| Labrasol | 85.41±0.23 |
| Cremophor EL | 79.39±0.18 |
| Labrafil | 88.67±0.43 |
| Tween 80 | 139.04±0.28 |
| Labrafac+tween80 | 221.6±0.68 |
Results are expressed as mean±SD, n=3; labrafac+tween 80 shows high solubility.
FTIR studies
FTIR spectra of pure drug and optimized formulation were shown in fig. 1 and fig. 2. Spectra of LAP shows its characteristic peaks at 3398 cm-1 for-NH-(secondary amine) stretching indicates the presence hydroxyl groups, 1138 cm-1 for C-O-C ether stretching, 1046 cm-1 for C-F carbon-fluorine stretching, 656 cm-1 for C-Cl carbon-chlorine stretching, 1204 cm−1 for-S=O stretching, 3029 cm−1 for aromatic =CH stretching, whereas in the FTIR spectrum of the optimized formulationexhibited same characteristic bands at 3409.74 cm-1 for-NH-, 1107.88 cm-1 –(C-O-C), 1066.06 cm-1 –(C-F), 1239.03 cm-1 –(S =O), 3720 cm⁻¹-(OH). When compared to pure lapatinib, the optimized lapatinib transferosomes' FTIR spectrum shows peak broadening and slight changes that support DSC by showing hydrogen bonding and molecular dispersion of the drug within the lipid bilayer without chemical incompatibility.
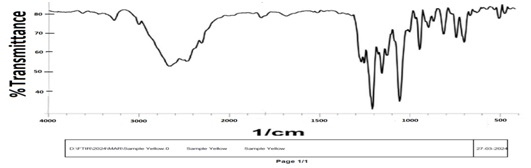
Fig. 1: FTIR spectra of pure LAP
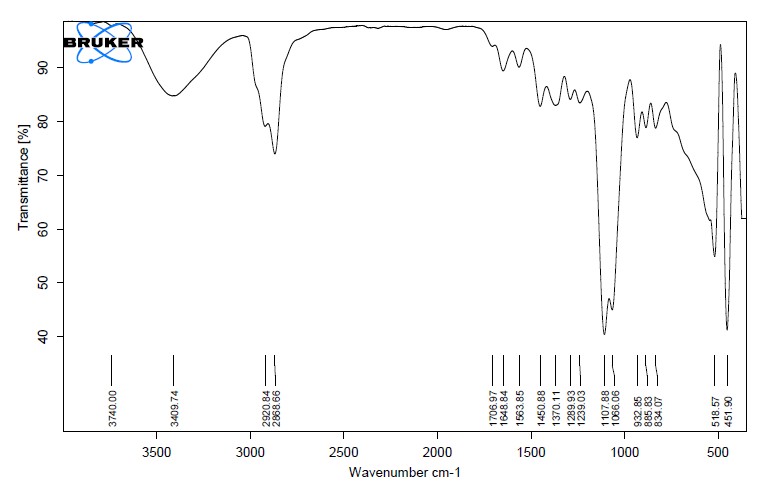
Fig. 2: FTIR spectra of optimized formulation
DSC studies
DSC thermograms of LAP shown in fig. 3 exhibit a sharp endothermic peak onset at 114 °C and peak at 123 °C, confirming its crystalline nature and thermal stability. The DSC thermogram of the optimized LAP transferosomal formulation, shown in fig. 4 exhibits significant broadening and suppression of this characteristic melting endotherm. This behavior indicates molecular dispersion and partial amorphization of LAP within the lipid bilayer of the transferosomal system rather than chemical interaction or degradation. The additional low-and intermediate-temperature thermal events observed in the formulation are attributed to lipid phase transitions and surfactant-phospholipid interactions, which are characteristic of vesicular systems. From the DSC findings confirm the encapsulation of LAP and compatibility with excipients.
Fig. 3: DSC thermogram of pure drug
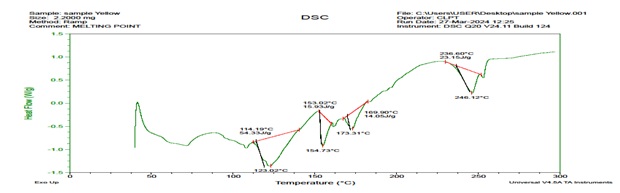
Fig. 4: DSC thermogram of optimized formulation
Optimization of transfersomes
The findings from the conducted studies provide clear insights into the formulation parameters, particularly highlighting the optimal ratio of lipids to edge activators. Specifically, the ideal ratio was determined to be 85:15, utilizing labrafacas the lipid component and tween 80 as the edge activator. This optimal ratio is crucial for achieving the desired properties of the transferosomes. To fully evaluate the performance of this formulation, several key metrics were measured, including the %EE, vesicle size measured in nanometers (nm), PDI, and ZP expressed in millivolts (mV). These parameters are essential in assessing both the stability and efficacy of the transferosomes. The detailed results of these measurements are compiled in table 5, which presents a comparative overview of the various formulations tested.
In vitro drug release
Fig. 5-7 displays the results of in vitro drug release (n=6, mean±SD) of all the formulations, ranging from 73.25±3.7 to 96.35±4.2%. These results are in line with the formulations formulated by Fernandes et al., (90%±3.6) [42].
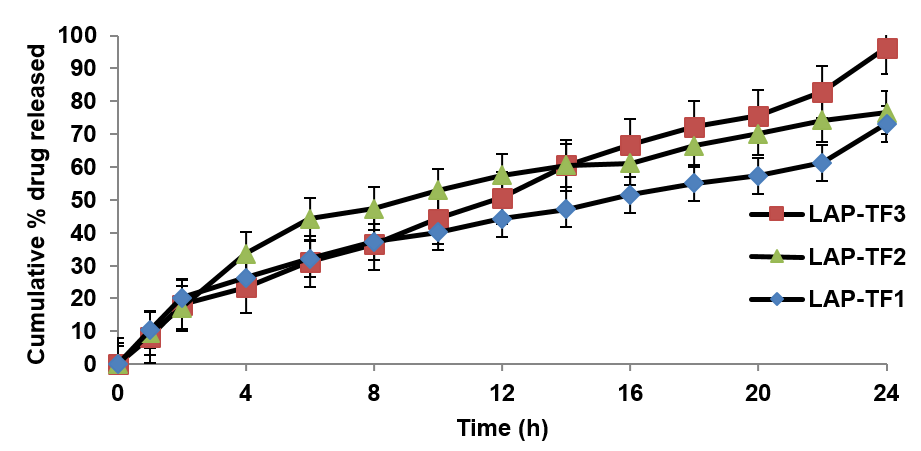
Fig. 5: In vitro drug release profile (mean±SD, n=6) of formulations LAP-TF1 to LAP-TF3 over 24 h in phosphate buffer pH 6.4
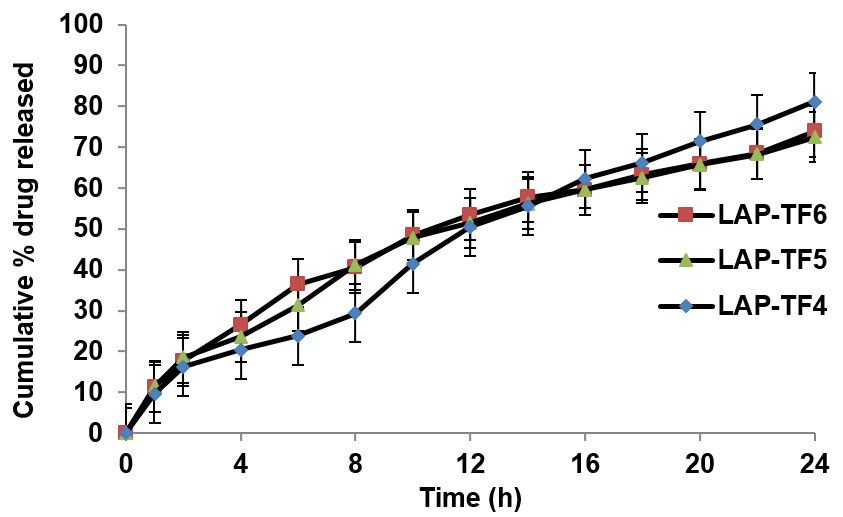
Fig. 6: In vitro drug release profile (mean±SD, n=6) of formulations LAP-TF4 to LAP-TF6 over 24 h in phosphate buffer pH 6.4
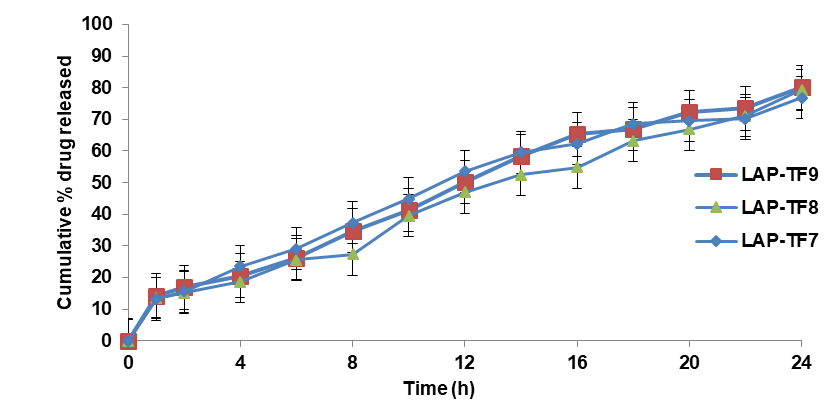
Fig. 7: In vitro drug release profile (mean±SD, n=6) of formulations LAP-TF7 to LAP-TF9 over 24 h in phosphate buffer pH 6.4
Particle size, ZP and PDI
The particle size of all the formulations shown in table 5 ranged from 269±3 to367±2. The optimized formulation (LPTF3) was found to be approximately 295 nm, which falls within the nano-range and is often desirable for enhancing bioavailability and improving drug delivery. These formulations have better particle size compared to the transferosomes formulated by Shukla KV et al., (132.23 nm) [43]. Additionally, the ZP of all the formulations ranged from-12.7±1.37 to-43.3±1.62and optimized formulation was measured to be-44.3 mV, indicating a significant negative charge, confirms strong electrostatic stabilization and good colloidal stability, as shown in table 5. The high negative ZP of –44.3 mV is unlikely due to Tween 80 (a non-ionic surfactant) and more likely originates from ionizable functional groups of the lipid matrix, possibly residual free fatty acids present in the formulation. This negative charge was critical as it suggests a stable dispersion of particles. These optimized formulations have better ZP compared to the transferosomes formulated by Sultana SS et al. (25 mV) [44]. Furthermore, the PDI shown in table 5 of 0.103±0.024 indicates a relatively narrow size distribution of the particles, suggesting that the particles are fairly uniform in size (fig. 8).
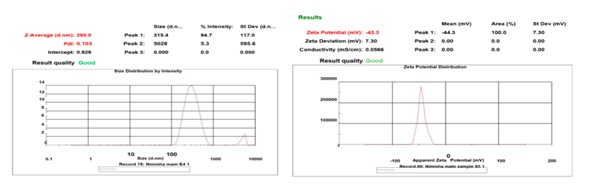
Fig. 8: Particle size distribution and ZP of the optimized formulation LPTF3
%EE
As the surfactant (edge activator) concentration in the current research was run through Design Expert Software, the concentration. Hence, the EE of all formulations was found to be between42.5±0.33 to 77.4±0.71% as shown in table 5. These formulations have better EE compared to the transferosomes formulated by Malakar J et al., (56.55±0.37 to 62.08±0.57) [45]. All of the formulations appear to be capable of good EE and negligible leakage. Formula LPTF3 of lapatinib has been found to provide better EE and optimal vesicle size based on the outcomes of two primary responses (dependent variables) chosen for the design expert software. This formulation was consequently taken into consideration for the following evaluations.
Table 5: EE, vesicle size, PDI and ZP of LAP transferosomal preparations
| Form code | EE (%) | Vesicle size (nm) | PDI | ZP (mV) |
| LPTF1 | 56.5±0.19 | 279±59 | 0.51±0.059 | -37.7± 1.2 |
| LPTF2 | 59±0.29 | 285±91 | 0.59±0.061 | -38.9±1.6 |
| LPTF3 | 77.4±0.71 | 295±13 | 0.103±0.024 | -44.3±1.5 |
| LPTF4 | 60.5±0.64 | 270±8 | 0.39±0.033 | -35.6±1.8 |
| LPTF5 | 42.5±0.33 | 345±15 | 0.41±0.035 | -38.2±1.3 |
| LPTF6 | 58.2±0.48 | 330±19 | 0.29±0.037 | -35.2±1.7 |
| LPTF7 | 65.01±0.51 | 295±12 | 0.10±0.021 | -40.3±1.5 |
| LPTF8 | 57.03±0.36 | 275±10 | 0.47±0.027 | -36.2±1.4 |
| LPTF9 | 59.01±0.49 | 300±11 | 0.37±0.031 | -41.1±1.6 |
| LPTF10 | 61.01±0.25 | 290±13 | 0.26±0.033 | -19.3±1.7 |
| LPTF11 | 56.70±0.36 | 285±14 | 0.39±0.049 | -28.9±1.8 |
| LPTF12 | 68.14±0.44 | 260±11 | 0.46±0.025 | -35.0±1.4 |
Results are expressed as mean±SD, n=6
Table 6: LPTF1–LPTF9 formulations' correlation coefficient (r2) values according to different kinetic models
| Formulae | Correlation coefficient (r2) values | ||||
Zero order |
First order |
Higuchi’s |
Peppas’s |
n value |
|
| LPTF1 | 0.9416 |
0.9531 |
0.9826 |
0.9802 |
0.539 |
| LPTF2 | 0.8921 |
0.9761 |
0.9838 |
0.9611 |
0.622 |
| LPTF3 | 0.9888 |
0.8505 |
0.9595 |
0.9874 |
0.719 |
| LPTF4 | 0.9843 |
0.9798 |
0.9582 |
0.9719 |
0.683 |
| LPTF5 | 0.9397 |
0.9912 |
0.9927 |
0.9920 |
0.584 |
| LPTF6 | 0.9294 |
0.9873 |
0.9945 |
0.9941 |
0.583 |
| LPTF7 | 0.9577 |
0.9898 |
0.9812 |
0.9719 |
0.604 |
| LPTF8 | 0.9851 |
0.9672 |
0.9523 |
0.9921 |
0.607 |
| LPTF9 | 0.9759 |
0.9845 |
0.9651 |
0.9940 |
0.602 |
Model with the highest r² and best fit to release data is highlighted in bold for each formulation
Drug release kinetics studies
The kinetics of the drug release were thoroughly analysed using various kinetic models, and the corresponding release kinetic graphs can be observed. The optimized formulation (LPTF3) exhibited zero-order release kinetics with Case-II transport behavior, indicating that drug release was governed primarily by matrix relaxation and vesicle reorganization rather than diffusion alone. This mechanism enables constant, sustained drug release and represents a significant advantage for localized and controlled delivery of lapatinib over a period extending up to 24 h, and can provide a sustained therapeutic effect without significant fluctuations as they are given topically by incorporating into gels. Other models were evaluated for comparison, but showed lower goodness of fit. Table 6 presents the correlation coefficient (r²) values for the various formulations.
Statistical analysis of factorial design
Nine formulations of transfersomes were designed following a factorial design, with their vesicle size and %EE evaluated. A mathematical model was applied using Design-Expert® software to analyze the data, focusing on metrics such as R² values, standard deviation, and predicted residual sum of squares. A second-order polynomial equation was derived to examine the impacts of independent variables Y1, Y2, at various combinations and levels on dependent responses. The analysis was carried out by utilizing the coded values of the independent factors.
Regression equation of the fitted quadratic model
Vesicle size (Y1) =+244.44+19.02 X1-104.26 X2-9.30 X1X2+3.13 X 12+8.10 X 22
% EE (Y2) =+91.50+3.35 X1 – 2.01 X2-0.59 X1X2-1.44 X 12-6.36 X 22
Effect of independent variables on vesicle size (Y1)
A quadratic equation characterizes how the amounts of phospholipid and surfactant affect vesicle size. Tween 80 (X₂) was the dominant factor responsible for reducing vesicle size (Y₁), as evidenced by its large negative coefficient and high model significance. The high negative coefficient confirms that increasing tween 80 concentration significantly decreases vesicle size due to enhanced emulsification efficiency and improved surface stabilization of the lipid droplets. The 3D surface plot clearly shows that increasing Tween 80 may reduce vesicle size, confirming its dominant effect. While labrafac (X₁) causes only minor changes, consistent with its smaller model coefficient. The significant coefficient for X2 means that the amount of tween 80 has a greater impact on the vesicle size of LAP transfersomes than the amount of labrafac. In equation (Y1), the main effect and interaction terms X 12 and X 22had positive regression coefficients. Table 7 presents the ANOVA results for the vesicle size data, and table 8 presents the regression analysis, where the model F-value of 16124.34 indicates that the model is statistically significant (p<0.0001). The model F-Value of this magnitude due to random noise is only 0.01%. The Predicted R2 value of 0.9997 closely aligns with the Adjusted R2value of 0.9999, demonstrating an excellent model fit. Additionally, the adequate precision ratio of 45.146 indicates a reliable signal, confirming that the quadratic model is suitable for exploring the design space. ANOVA results further validate the model's significance (p<0.0001) (table 8), showcasing a high F-value and robust correspondence between predicted and adjusted R² values, which affirm the model's reliability for design optimization.3D-response surface graphs and their corresponding 2D-contour plots for vesicle size were shown in fig. 9.
Effect of independent variable on EE (Y2) of LAP-loaded transfersomes
The quadratic equation was formulated to illustrate the influences of labrafac (which has a positive effect) and tween 80 (which has a negative effect) on EE, with labrafac showing a more substantial impact. The high coefficient value for X1 indicates that the quantity of Labrafac significantly influences the entrapment efficiency of LAP transfersomes. %EE increases with higher labrafac (X₁) and decreases with higher tween 80 (X₂), as shown by the positive and negative coefficients, respectively. The 3D surface plot confirms this pattern, illustrating a steady rise in EE with increased lipid content and a decline at elevated surfactant levels. 3D-response surface graphs and their corresponding 2D-contour plots for % EE are shown in fig. 10. Table 7 displays the results regarding EE. The model F-value of 191.55 suggests the model is significant (p<0.0006), with 0.06% chances that such a model F Value could occur by random variation. The overall analysis confirms the statistical significance of the model, supported by a predicted R² of 0.9647 and an adjusted R² of 0.9917, confirming its reliability for exploring the design space shown in table 8.
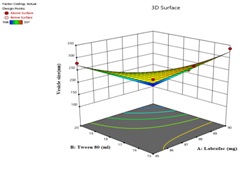
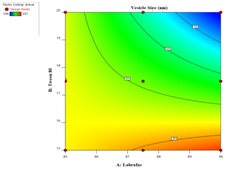
Fig. 9: Three-dimensional response surface and the corresponding 2D contour plots for vesicle size
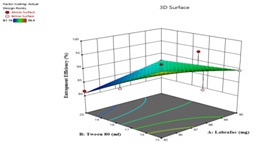
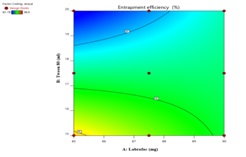
Fig. 10: Three-dimensional response surface and the corresponding 2D contour plots for % EE
Table 7: ANOVA results and adequate precision for every LAP transfersomes response based on the quadratic model
| Models | SD | R2 | Adjusted R2 | Predicted R2 | Press | CV (%) | Remark |
| Response (Y1) | |||||||
| Linear | 8.12 | 0.9924 | 0.9900 | 0.9784 | 1435.26 | 4.58 | |
| 2FI | 4.54 | 0.9971 | 0.9962 | 0.9894 | 688.78 | 2.78 | |
| Quadratic | 0.90 | 1.000 | 0.9997 | 0.9994 | 22.58 | 0.46 | Suggested |
| Response (Y2) | |||||||
| Linear | 3.80 | 0.5134 | 0.3515 | -0.0288 | 184.11 | 4.48 | |
| 2FI | 4.12 | 0.5212 | 0.2343 | -1.0945 | 374.80 | 4.87 | |
| Quadratic | 0.41 | 0.9967 | 0.9915 | 0.9645 | 6.31 | 0.52 | Suggested |
SD: standard deviation, R2: multiple correlation coefficient, 2FI: two-factor interaction, PRESS: predicted residual sum of squares, CV: coefficient of variation.
Table 8: Regression analysis results for transferosome responses Y1 (vesicle size) and Y2 (% EE) for fitting to various polynomial models
| Source | Responses | |||||
| Y1 (Vesicle size) | Y2 (EE%) | |||||
| F value | p-value | Adequancy precision | F value | p-value | Adequancy precision | |
| Model | 16124.3 | <0.0001 | 329.072 | 191.55 | 0.0006 | 41.147 |
| X1 | 2577.17 | <0.0001 | 363.34 | 0.0003 | ||
| X2 | 77454.5 | <0.0001 | 130.15 | 0.0014 | ||
| X1X2 | 410.6 | 0.0003 | 7.48 | 0.0717 | ||
| X12 | 23.34 | 0.0169 | 22.42 | 0.0179 | ||
| X22 | 156.02 | 0.0011 | 434.3 | 0.0002 | ||
TEM studies
TEM images for optimized formulation (LPTF3) confirmed the formation of well-defined spherical nanovesicles. The vesicles exhibited a unilamellar structure with smooth outer boundaries, indicating uniform lipid assembly. The internal electron density appeared homogeneous, suggesting stable incorporation of the drug within the lipid matrix. No significant aggregation of vesicles was observed, reflecting good colloidal stability, likely due to steric stabilization by tween 80. Furthermore, the vesicle dimensions observed under TEM were consistent with the size range measured by DLS, validating the successful preparation of nanosized transferosomes (fig. 11).
Preparation of transferosomal gel
Through the extensive studies conducted and the subsequent statistical optimization processes, it was determined that LPTF3 emerged as the most effective formulation among all. This was then integrated into a meticulously gel base, which comprised 0.5, 1.0, 1.5 and 2% w/w Carbopol 934. An appropriate amount of carbopol was dispersed in demineralised water, the pH was adjusted with triethanolamine, and stirring was continued until a homogeneous gel formed. Then, LAP transferosomes were dispersed in a prepared gel base using a homogenizer at 15000 RPM for 18 min. Concentrations of gelling agent and other ingredients are given in table 9, resulting in a new formulation referred to as LPTF3 F4.
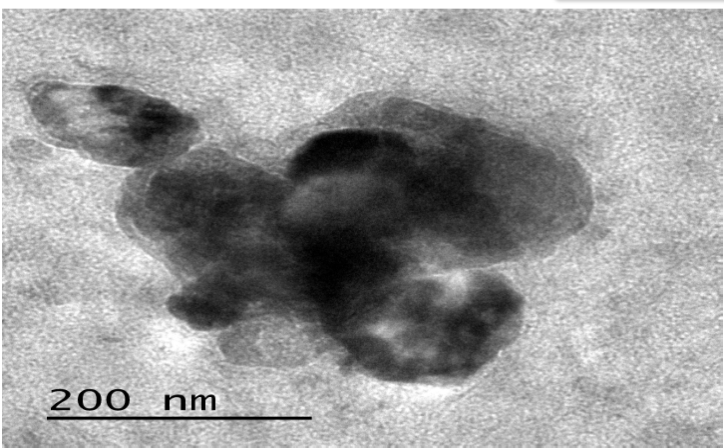
Fig. 11: TEM image ofLPTF3 with 200 nm
Table 9: Formulation of LAP transferosomal gel
| Ingredients | LPTF3 (F1) | LPTF3 (F2) | LPT3 (F3) | LPT3 (F4) |
| LAP transferosomes equivalent to(mg) | 0.1 | 0.1 | 0.1 | 0.1 |
| Carbopol (% w/w) | 0.5 | 1.0 | 1.5 | 2 |
| Distilled water | qs | qs | qs | qs |
| Propylene Glycol (%) | 0.1 | 0.1 | 0.1 | 0.1 |
| Methyl Paraben | 0.02% | 0.02% | 0.02% | 0.02% |
| Triethanolamine | 0.1% | 0.1% | 0.1% | 0.1% |
All formulations were made up to 100 g with distilled water; "qs" (quantity sufficient).
Diffusion studies of transferosomal gel
The drug diffusion study of prepared transferosomal gels was conducted utilizing the franz diffusion cell with rats’ skin. In vitro diffusion rate of transferosomal gel of all formulations ranged from 61.67±2.33 % to 87.83±3.71% over 24 h. From the results, the optimized transferosomal gel was considered as LPTF3 F4. The results are shown in fig. 12.
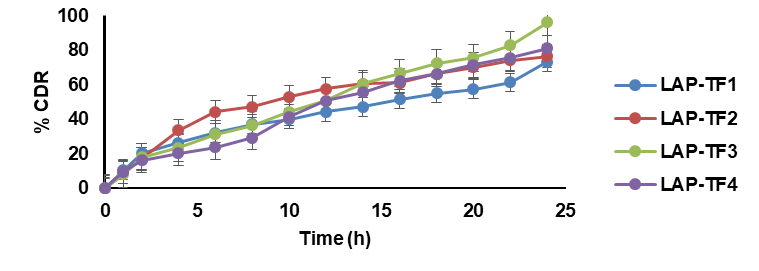
Fig. 12: In vitro diffusion studies of LAP transferosomal gel. Results are expressed as mean±SD, n=3
Rheological studies
The gel sample under investigation demonstrated a thixotropic pseudoplastic behavior where the viscosity decreases as shear stress increases, shown in the upward curve, fig. 15. Conversely, as shear stress decreases, the gel slowly returns to its original structure, increasing viscosity shown in the downward curve (fig. 15). It indicates that the transferosomal gel becomes easier to flow under applied stress; identical up and down curves indicate negligiblethixotropy, which means the fluid’s structure breaks down and rebuilds very quickly, without significant time-dependent changes (fig. 13 – 14).
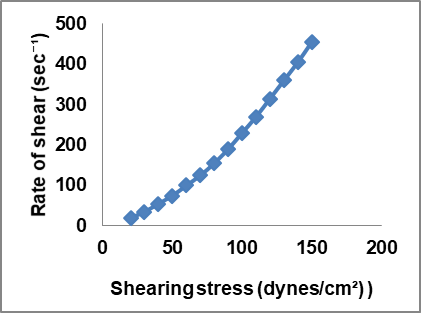
Fig. 13: Rheological behavior of transferosomal gel formulation (LPTF3 F4 gel) at different shear rates (n=3)
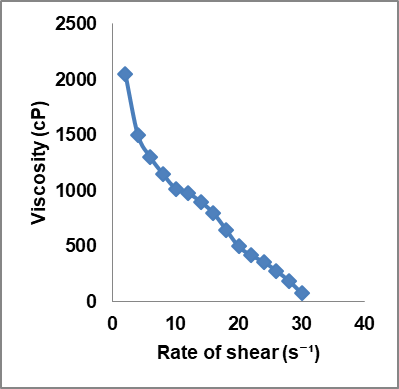
Fig. 14: Rheogram plotted showing flow property of gel
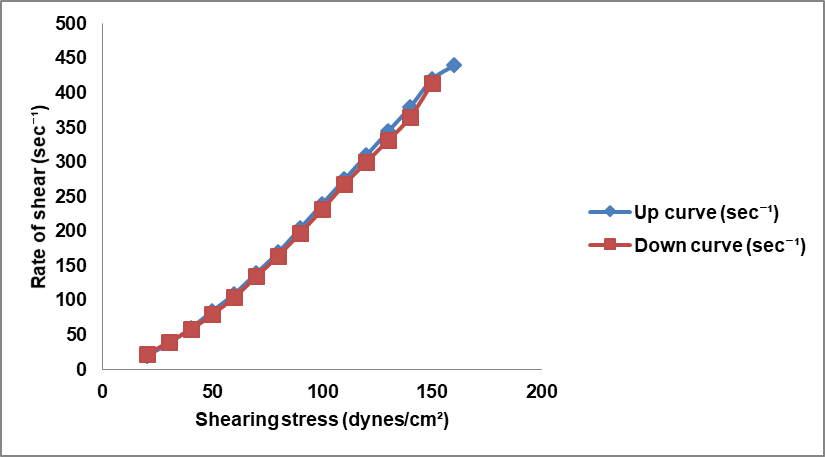
Fig. 15: Thixotropic behaviour for LPTF3 F4 gel
Skin irritation test
The wistar rats were used for the skin irritancy test. After applying the LAP transfersomal gel formulations to the dorsal side of the neatly shaven rats, there was no indication of irritation and itchiness up to 7 d.
Characteristics of LAP optimized transferosomal gel formulation (LPTF3 F4)
Optimized transferosomal gel is evaluated for parameters like colour, homogeneity, texture, pH, spread ability diameter, drug content, extrudability, skin irritation and viscosity and the results are shown in table 10.
The optimized gel formulation (LPTF3 F4) was dull white in colour with smooth texture and homogenous, and had good extrudability.
The pH ought to range between 4.5 and 6.5 since the transferosomal gel must be applied topically. pH of LPTF3 F4formulation was discovered to be 6.2, and have skin compatibility conclusion drawn from without any skin irritation.
The transferosomal gels should spread effectively and uniformly since they display pseudo-plastic flow. The LPTF3 F4 formulation shows a 55 mm spreading diameter, it demonstrates that the formulation's spread ability is at its best.
LPTF3 F4 formulation was discovered to have a viscosity of 2000±0.15 centipoises, which appears to be gel-like rather than cream-or oil-like. Drug content was found to be 93.2±3.4%
CLSM studies
The drug vesicle depth of penetration was investigated using CLSM. The produced transfersomal formulation was evenly dispersed throughout the skin layers, as demonstrated by the CLSM's strong fluorescence intensity. As shown in fig. 16, when Rhodamine B dye was added to the formulation, it penetrated the deeper layers of the skin. At depths of 0–10 µm, the fluorescence intensity was high, reflecting strong deposition of the formulation on the skin surface and within the upper stratum corneum. At 15–20 µm, moderate fluorescence was still discernible, suggesting penetration into the stratum corneum's deeper levels. The formulation successfully penetrated the superficial barrier and reached the living epidermis, as evidenced by the fluorescence weakening dramatically at 30 µm and becoming faint but discernible at about 40 µm. At 50–100 µm, no fluorescence was seen, indicating that the penetration was limited to the epidermal area and did not extend to the dermis. This penetration was in line with the transferosomes formulated by Elsayed MM et al., who observed strong fluorescence up to 30–40 µm for transferosomal formulations [46].
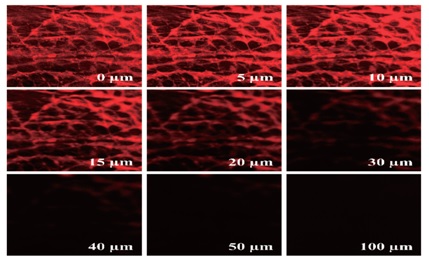
Fig. 16: CLSM image of hairless goat skin after 12 h of rhodamine B-loaded transferosome application, showing fluorescence at various depths and including a scale bar
Table 10: Assessment characteristics of LAP's transferosomal gel
| Formulation | Color | Homogenity | Texture | Viscosity (cps) |
pH | Spreading diameter (mm) | Drug content (%) | Extrudability | Skin Irritation test |
| LPTF3 F4 gel | Dull white | Homogeneous | Smooth | 2000±0.15 | 6.2 | 55 | 93.2±3.4 | Excellent | 0 |
Results are expressed as mean±SD, n=6; Grading scale: 0 = no irritation, 1 = slight, 2 = moderate, 3 = severe erythema
CONCLUSION
A 3² factorial design was effectively used to develop and optimize LAP-loaded transferosomes, resulting a formulation that had excellent entrapment efficiency, nanosized vesicles, and appropriate ZP. The optimized transferosomal gel showed prolonged drug release and improved ex vivo skin penetration, indicating its potential as a successful localized delivery technique for poorly soluble drugs. These results reinforce the potential of transferosomal gels for topical or localized breast cancer therapy applications by indicating that they may enhance therapeutic efficacy while reducing systemic adverse effects.
ACKNOWLEDGEMENT
The authors would like to thank A. M. Reddy Memorial College of Pharmacy and K. L. College of Pharmacy (KLU) for providing support to perform this work.
FUNDING
No funding was received for this research work.
AUTHORS CONTRIBUTIONS
R. Sunitha: Conduction of the experimental work, collection and integration of data and writing the drafted manuscript. Dr Praveen Sivadasu: Supervision, visualization and manuscript reviewing and editing. Dr P. Bhargava Bhushan Rao: Study hypothesis and conceptualization, methodology, supervision, data interpretation, and manuscript reviewing and editing.
CONFLICTS OF INTERESTS
There are neither financial nor non-financial conflicts of interest among the contributing authors.
REFERENCES
Sung H, Ferlay J, Siegel RL, Laversanne M, Soerjomataram I, Jemal A. Global cancer statistics 2020: GLOBOCAN estimates of incidence and mortality worldwide for 36 cancers in 185 countries. CA Cancer J Clin. 2021;71(3):209-49. doi: 10.3322/caac.21660, PMID 33538338.
Lukasiewicz S, Czeczelewski M, Forma A, Baj J, Sitarz R, Stanisławek A. Breast cancer-epidemiology risk factors classification prognostic markers and current treatment strategies-an updated review. Cancers (Basel). 2021;13(17):4287. doi: 10.3390/cancers13174287, PMID 34503097.
Wang J, Wu SG. Breast cancer: an overview of current therapeutic strategies challenge and perspectives. Breast Cancer (Dove Med Press). 2023;15:721-30. doi: 10.2147/BCTT.S432526, PMID 37881514.
Chouhan K, Amarchiya R, Bagherwa A. Formulation and evaluation of herbal cream for psoriasis leucoderma or vitiligo disease. Int J Curr Res. 2025;17(10):34868-73.
Tewabe A, Abate A, Tamrie M, Seyfu A, Abdela Siraj E. Targeted drug delivery from magic bullet to nanomedicine: principles, challenges and future perspectives. J Multidiscip Healthc. 2021;14:1711-24. doi: 10.2147/JMDH.S313968, PMID 34267523.
Josephs DH, Fisher DS, Spicer J, Flanagan RJ. Clinical pharmacokinetics of tyrosine kinase inhibitors: implications for therapeutic drug monitoring. Ther Drug Monit. 2013;35(5):562-87. doi: 10.1097/FTD.0b013e318292b931, PMID 24052062.
Ferguson FM, Gray NS. Kinase inhibitors: the road ahead. Nat Rev Drug Discov. 2018;17(5):353-77. doi: 10.1038/nrd.2018.21, PMID 29545548.
Roskoski R Jr. Properties of FDA-approved small molecule protein kinase inhibitors: a 2020 update. Pharmacol Res. 2020;152:104609. doi: 10.1016/j.phrs.2019.104609, PMID 31862477.
Aisner J. Overview of the changing paradigm in cancer treatment: oral chemotherapy. Am J Health Syst Pharm. 2007;64(9 Suppl 5):S4-7. doi: 10.2146/ajhp070035, PMID 17468157.
Rowland A, Van Dyk M, Mangoni AA, Miners JO, McKinnon RA, Wiese MD. Kinase inhibitor pharmacokinetics: comprehensive summary and roadmap for addressing inter-individual variability in exposure. Expert Opin Drug Metab Toxicol. 2017;13(1):31-49. doi: 10.1080/17425255.2016.1229303, PMID 27561659.
Jalajakshi MN, Chandrakala V, Srinivasan S. An overview: recent development in transdermal drug delivery. Int J Pharm Pharm Sci. 2022;14(10):1-9. doi: 10.22159/ijpps.2022v14i10.45471.
Solanki D, Kushwah L, Motiwale M, Chouhan V. Transferosomes a review. World J Pharm Pharm Sci. 2016;5(10):435-49. doi: 10.20959/wjpps201610-7845.
Bachovchin KA, Sharma A, Bag S, Klug DM, Schneider KM, Singh B. Improvement of aqueous solubility of lapatinib-derived analogues: identification of a quinolinimine lead for human African trypanosomiasis drug development. J Med Chem. 2019;62(2):665-87. doi: 10.1021/acs.jmedchem.8b01365, PMID 30565932.
Surini S, Nastiti PD, Putri AR, Putri KS. Formulation of andrographolide transfersomes gel for transdermal delivery: a preliminary study. Int J App Pharm. 2020;12(1):187-91. doi: 10.22159/ijap.2020.v12s1.FF043.
Kumar KK, Nagoji KE, Nadh RV. A validated RP-HPLC method for the estimation of lapatinib in tablet dosage form using gemcitabine hydrochloride as an internal standard. Indian J Pharm Sci. 2012;74(6):580-3. doi: 10.4103/0250-474X.110621, PMID 23798787.
Mondal P, Krishnaprasad D, Kusuma A, Kulkarni M, Reddy MS, Kola V. Novel stability indicating RP-HPLC coupled with PDA detection for the simultaneous quantification of artesunate and amodiaquine in bulk and its tablet. Pharm Methods. 2019;10(2):64-9. doi: 10.5530/phm.2019.2.12.
Godela R, Pola KK, Panukanti M, Kusuma A, Shireen S, Srinivas M. Estimation of glyoxylic acid in emtricitabine by a new validated RP-HPLC method. Int J Pharm Qual Assur. 2024;15(2):622-5. doi: 10.25258/ijpqa.15.2.10.
Fernandes NB, Velagacherla V, Spandana KJ, NB, Mehta CH, Gadag S. Co-delivery of lapatinib and 5-fluorouracil transfersomes using transpapillary iontophoresis for breast cancer therapy. Int J Pharm. 2024;650:123686. doi: 10.1016/j.ijpharm.2023.123686, PMID 38070658.
Rasheed MS, Ansari SF, Shahzadi I. Formulation characterization of glucosamine-loaded transfersomes and in vivo evaluation using papain-induced arthritis model. Sci Rep. 2022;12(1):19813. doi: 10.1038/s41598-022-23103-1, PMID 36396950.
Varia U, Joshi D, Jadeja M, Katariya H, Detholia K, Soni V. Development and evaluation of ultradeformable vesicles loaded transdermal film of boswellic acid. Futur J Pharm Sci. 2022;8(1):39. doi: 10.1186/s43094-022-00428-2.
Benson HA. Transfersomes for transdermal drug delivery. Expert Opin Drug Deliv. 2006;3(6):727-37. doi: 10.1517/17425247.3.6.727, PMID 17076595.
Opatha SA, Titapiwatanakun V, Chutoprapat R. Transfersomes: a promising nanoencapsulation technique for transdermal drug delivery. Pharmaceutics. 2020;12(9):855. doi: 10.3390/pharmaceutics12090855, PMID 32916782.
Bnyan R, Khan I, Ehtezazi T, Saleem I, Gordon S, O’Neill F. Formulation and optimisation of novel transfersomes for sustained release of local anaesthetic. J Pharm Pharmacol. 2019;71(10):1508-19. doi: 10.1111/jphp.13149, PMID 31373700.
Fitria M, Silvia S, Raditya I. Development of transfersomal emulgel to enhance the permeation of berberine chloride for transdermal delivery. J App Pharm Sci. 2022;12(2):48-55. doi: 10.7324/JAPS.2021.120205.
Asif AH, Desu PK, Alavala RR, Rao GS, Sreeharsha N, Meravanige G. Development statistical optimization and characterization of fluvastatin-loaded solid lipid nanoparticles: a 32 factorial design approach. Pharmaceutics. 2022;14(3):584. doi: 10.3390/pharmaceutics14030584, PMID 35335960.
Anusha K, Venu K. Formulation and characterization of sustained release matrix tablets of verapamil hydrochloride. World J Pharm Pharm Sci. 2019;8(5):1633-44.
Kusuma A, Kumar RS. Optimization of fast-dissolving tablets of carvedilol using 2³ factorial design. Int J App Pharm. 2024;16(1):98-107. doi: 10.22159/ijap.2024v16i1.49535.
Ubaid M, Ilyas S, Mir S, Khan AK, Rashid R, Khan MZ. Formulation and in vitro evaluation of Carbopol 934-based modified clotrimazole gel for topical application. An Acad Bras Cienc. 2016;88(4):2303-17. doi: 10.1590/0001-3765201620160162, PMID 27925034.
Esposito E, Calderan L, Galvan A, Cappellozza E, Drechsler M, Mariani P. Ex vivo evaluation of ethosomes and transethosomes applied on human skin: a comparative study. Int J Mol Sci. 2022;23(23):15112. doi: 10.3390/ijms232315112, PMID 36499432.
Joshi A, Kaur J, Kulkarni R, Chaudhari R. In vitro and ex-vivo evaluation of raloxifene hydrochloride delivery using nano-transfersome based formulations. J Drug Deliv Sci Technol. 2018;45:151-8. doi: 10.1016/j.jddst.2018.02.006.
Sailaja K, Supraja R. Formulation of mefenamic acid-loaded transfersomal gel. Nanomed J. 2017;4(2):126-34. doi: 10.22038/nmj.2017.8414.
Imam SS. Topical formulation constituted with transferosomes for non-melanoma skin cancer. Asian J Pharm Clin Res. 2023;16(5):27-32. doi: 10.22159/ajpcr.2023.v16i5.47033.
Devi MG, Santosh KR, Kusuma A. Telmisartan fast dissolving film using mango kernel starch. In: Advancement in animal handling and generative AI for pre-clinical studies. CRC Press; 2024. p. 130-7.
Balasubramanyam P, Sudheer P, Sreeharsha N, Nair AB, Ramachandra DP. Transfersomes mediated transdermal delivery of curcumin: in vitro and in vivo evaluation. Pharm Sci. 2025;31(2):203-15. doi: 10.34172/PS.025.40996.
Sankar PR, Sailu AB, Eswarudu MM, Satya MN, Sreeja P, Roja P. Analytical methods for FDA-approved tyrosine kinase inhibitors. J Pharm Sci Res. 2021;13(6):313-8.
Dubey A, Furtado R, Bhandary P, Hebbar S, Shetty A. Role of penetration enhancers in the topical delivery of adapalene by transfersomal gel: an in vitro investigation. J Young Pharm. 2021;13(3):239-45. doi: 10.5530/jyp.2021.13.49.
Divya M, Vijay Kumar D, Maloth R, Vijaylaxmi S, Manasa K. Ketorolac tromethamine transferosomal gel using box–behnken design. J Innov Dev Pharm Tech Sci. 2024;7(6):22-32.
Rada SK, Kusuma A. Toxicity studies of starch hyaluronate in Wistar rats. Trop J Nat Prod Res. 2023;7(5):2965-8. doi: 10.26538/tjnpr/v7i5.19.
Tiwari T, Kaul S, Nagaich U, Pandey M, Mishra DK, Jain N. In vitro toxicity safety and skin permeability evaluation of antifungal transferosomal hydrogels for the advanced management of foot dermatophytosis. BioNanoScience. 2025;15(3):456. doi: 10.1007/s12668-025-02064-5.
Malviya N, A P, Alexander A. Comparative study on ethosomes and transferosomes for enhancing skin permeability of sinapic acid. J Mol Liq. 2023;383:122098. doi: 10.1016/j.molliq.2023.122098.
Zheng H, Xu C, Fei Y, Wang J, Yang M, Fang L. Monoterpenes-containing PEGylated transfersomes for enhancing joint cavity drug delivery evidenced by CLSM and double-sited microdialysis. Mater Sci Eng C. 2020;113:110929. doi: 10.1016/j.msec.2020.110929.
Fernandes NB, Velagacherla V, Spandana KJ, N B, Mehta CH, Gadag S. Co-delivery of lapatinib and 5-fluorouracil transfersomes using transpapillary iontophoresis for breast cancer therapy. Int J Pharm. 2024;650:123686. doi: 10.1016/j.ijpharm.2023.123686, PMID 38070658.
Shukla KV, Meshram R, Yadav M. Transfersomal gel development and evaluation. J Drug Deliv Ther. 2019;9(4-A):642-5.
Sultana SS, Sailaja AK. Formulation and evaluation of diclofenac sodium transferosomes using different surfactants by thin film hydration method. Der Pharmacia Lettre. 2015;7(11):43-53.
Malakar J, Sen SO, Nayak AK, Sen KK. Formulation optimization and evaluation of transferosomal gel for transdermal insulin delivery. Saudi Pharm J. 2012;20(4):355-63. doi: 10.1016/j.jsps.2012.02.001, PMID 23960810.
Elsayed MM, Abdallah OY, Naggar VF, Khalafallah NM. Lipid vesicles for skin delivery of drugs: reviewing three decades of research. Int J Pharm. 2007;332(1-2):1-16. doi: 10.1016/j.ijpharm.2006.12.005, PMID 17222523.