
Int J App Pharm, Vol 18, Issue 2, 2026, 264-271Original Article
GELATIN FROM MUSCOVY DUCK (CAIRINA MOSCHATA) BONE AS PHARMACEUTICAL EXCIPIENT: EXTRACTION AND CHARACTERIZATION
BAYU EKO PRASETYO1,2,3, ANAYANTI ARIANTO2,3*, HAKIM BANGUN2,3, ABDI WIRA SEPTAMA4
1Doctor in Pharmaceutical Sciences Program, Faculty of Pharmacy, Universitas Sumatera Utara, Medan-20155, Indonesia. 2Department of Pharmaceutics and Pharmaceutical Technology, Universitas Sumatera Utara, Medan-20155, Indonesia. 3Nanomedicine Center of Excellence, Universitas Sumatera Utara, Medan-20155, Indonesia. 4Research Center for Pharmaceutical Ingredients and Traditional Medicine, National Research and Innovation Agency (BRIN), KST Soekarno, Cibinong, Jawa Barat-16911, Indonesia
*Corresponding author: Anayanti Arianto; *Email: anayanti@usu.ac.id
Received: 24 Nov 2025, Revised and Accepted: 05 Feb 2026
ABSTRACT
Objective: This study aimed to extract and characterize gelatin from Muscovy duck (Cairina moschata) bone using acid method.
Methods: Gelatin production was carried out by soaking bone in 5 % hydrochloric acid with soaking times varying between 6, 12, and 24 h. The extraction process was conducted using a water bath at 70 °C for 4 h. Gelatin evaluation included yield value, proximate analysis (water content, ash content, lipid content, and total protein content), pH, viscosity, gel strength, color test, metal contamination level, fourier transform infrared (FTIR) and x-ray diffraction (XRD) analysis.
Results: The yield value of gelatin produced from Muscovy duck (Cairina moschata) bone was between 10.27-10.56 %, with water, ash, lipid, and total protein content of 2.26-3.14 %, 0.84-1.52 %, 0.24-1.15 %, and 71.05-75.86 %, respectively. PH of gelatin was 4.2-4.9, with a viscosity of 6.18-7.47 mPa. s, gel strength value was between 69.88-72.63 bloom, and color characteristic (L*= 33.33-35.31; a*= 0.52-0.81; b*=-0.55-0.26). In addition, the metal contamination levels were Cu<2 ppm, Zn<40 ppm, and As<0.2 ppm. FTIR profile showed that gelatin exhibited characteristic functional groups, while XRD analysis revealed that the diffraction peaks at 8° and 20° were specific characteristics of gelatin and similar to the commercial gelatin.
Conclusion: Gelatin produced from Muscovy duck bone has a good physical and chemical characterization and has FTIR profile and XRD profile similar to commercial gelatin, making it highly potential to be developed as an alternative source for gelatin production.
Keywords: Acid method, Cairina moschata, Gelatin, Muscovy duck, Bone
© 2026 The Authors.Published by Innovare Academic Sciences Pvt Ltd. This is an open access article under the CC BY license (https://creativecommons.org/licenses/by/4.0/)
DOI: https://dx.doi.org/10.22159/ijap.2026v18i2.57610 Journal homepage: https://innovareacademics.in/journals/index.php/ijap
INTRODUCTION
Gelatin is one of the excipients widely used in various fields of pharmacy. It is the main component of capsule shells used as a dosage form for various synthetic and herbal medicines [1-3]. In addition, gelatin is also often used in the manufacture of tablets as a binding agent and as a coating agent [4, 5]. Several studies have shown that it can be applied as a gelling agent in various semisolid preparations and as film for food packaging [6-10]. This polymer has various advantages, such as being natural, biocompatible, biodegradable, and low toxicity [11].
The world's main source of gelatin, which mostly comes from pig skin, raises concerns about halal status, specifically in countries with a Muslim majority, such as Indonesia [12]. Another source of gelatin is cow skin or bone, but various diseases in cows also add to concerns about safety [13]. Therefore, various studies continue to be conducted to develop alternative sources, including the use of poultry products. Poultry is one of the animals that has a high collagen content, and by-products, such as skin, bone, and feet, have the potential to be developed as raw materials for gelatin production.
Various studies on gelatin production from poultry have been conducted, including using chicken bone [14], chicken leg skin [15], chicken head [16], and duck feet [17]. These studies show that gelatin can also be produced from high-quality poultry products and used in pharmaceutical applications. Muscovy duck (Cairina moschata) is one of the poultry species commonly raised by Indonesians, along with chickens, which have the potential to be developed as source of gelatin [18].
In gelatin extraction process, the denaturation of collagen protein requires the assistance of compounds that can break collagen hydrogen bonds. This process of breaking hydrogen bonds can be carried out using acidic or alkaline solutions. The process does not damage collagen, but causes the structure to become looser, leading to easier hydrolysis into gelatin [19]. The method of immersion in acidic solution is preferred over an alkaline solution because it requires less time, and the product obtained has good quality. Several acidic solvents that have been used and proven to produce gelatin are acetic acid solution [20, 21], hydrochloric acid [22, 23], or sulphuric acid [24]. Hydrochloric acid is one of the best solvents considered capable of breaking down collagen fibers and producing a good-quality product [25]. Therefore, this study aimed to extract gelatin from Muscovy duck bone using acid method and evaluate the characterization of the produced gelatin.
MATERIALS AND METHODS
Chemicals and reagents
Fresh Muscovy duck bone was obtained from the local market in Percut Sei Tuan, Deli Serdang District, North Sumatera Province, Indonesia. Commercial gelatin was purchased from Sigma Aldrich (USA). Hydrochloric acid was obtained from Merck (Darmstadt, Germany). All chemical reagents were analytical grade and used without further purification.
Gelatin extraction
Gelatin was produced based on a modification of the methods of Fasya (2018) and Said (2011) [25, 26]. The bone was cleaned with water from the meat and other impurities and then cut into smaller pieces (1 cm x 1 cm). Subsequently, the bones were soaked in hot water at 70 °C for 30 min to facilitate the removal of fat and meat still attached. The sample was added with 5 % of hydrochloric acid in a ratio of 1:4 (w/v) and soaked for 6, 12, and 24 h, and the samples were named T6, T12, and T24, respectively. After this procedure, bones were washed with distilled water until the pH was close to neutral (in the range 6.5-7.0). The extraction process was conducted by using a water bath at 70 °C for 4 h, and the solution was filtered with a filter using a mesh of 200, then centrifuged at 9.707 RCF, temperature 20 °C for 15 min, and dried in an oven at a temperature of 60 °C for 24 h. This dried gelatin was blended until smooth to get a powder form and ready for evaluation.
Gelatin characterizations
Yield value of gelatin
The amount of gelatin yield obtained from Muscovy duck bone was determined by comparing the amount produced with the raw bone material used [26]. The percentage yield was calculated using the following formula.

Proximate analysis
Proximate content analyzed was water content of gelatin using moisture balance method with a Moisture Analyzer (DSH-10A, China). The procedure of measurement was based on Warmiati, 2024 [27]. Ash analysis procedure referred to Indonesian national standardization (SNI) 06-3735-1995 [28]. Fat and total protein content was analyzed based on SNI no 01-2354.1.2006 [29]. Total protein content was evaluated using the Micro Kjeldahl method and calculated with a conversion factor of 6.25.
Determination of pH
A solution of gelatin was made by dissolving 1 g of gelatin in 100 ml (w/v) of distilled water at a temperature of 60 °C, after which the mixture was allowed to cool to room temperature. The pH meter (Az 86505) was calibrated beforehand using standard pH buffers of 4 and 7. The pH meter electrode was then immersed in the solution until a constant reading was obtained [30, 31].
Viscosity measurement
Gelatin sample solution was prepared at a concentration of 6.67 % w/v (7.50 g and 105 ml of distilled water) and heated at a temperature of 60 °C until the particles dissolved completely. Viscosity of the sample was measured using a viscometer NDJ 8S (Huanghua Faithful Instrument Co., Ltd, China). Gelatin solution was poured into the sample place of the viscometer, and viscosity was measured at room temperature [32, 21].
Gel strength
This sample was prepared based on the solution preparation for the viscosity test and then stored at a temperature of 10 °C for more than 16 h. Gel strength was measured using a LFRA texture analyzer (Brookfield, USA) with trigger 5 g, distance 10 mm, and speed at 1 mm/s [33, 34].
Color test
Gelatin sample was prepared according to the sample preparation method for viscosity testing. Gelatin color was determined based on the values of “L*”, ‘a*’ and “b*” using a colorimeter WR10 (Fru, Shenzhen Wave Optoelectronics Technology Co., Ltd, China) [35].
Atomic absorption analysis
Atomic absorption analysis was used to measure the metal contamination levels of copper (Cu), zinc (Zn), and arsenic (As) in gelatin. The measurements were carried out using an atomic absorption spectrophotometer (AAS Perkin Elmer Pinnacle 900T, USA) [36, 37].
FTIR analysis
The infrared spectra of gelatin were characterized using a FTIR ATR spectrophotometer (Bruker-Tensor II) with a frequency range of 4000-500 cm-1, 45 s of scanning, and a resolution of 4.0 cm. In addition, the resulting gelatin from Muscovy duck bone was compared with the commercial gelatin [38].
XRD analysis
The test was conducted using XRD spectroscopy (PAN alytical AERIS, Netherlands). XRD characterization in this study was performed using a voltage of 40 kV. Monochromatic Cu kα radiation (target source) with a wavelength of λ = 1.5406 Å, with a step size of 0.02°, a scan rate of 0.2/s, and a scan range from 2θ = 5 to 85 in solid form. The sample to be characterized was gelatin powder placed in a 2x2 cm² holder on the diffractometer [39, 40].
Statistical analysis
The results were expressed as mean±standard deviation (SD). One-way analysis of variance (ANOVA) was performed on the data, and differences between means were evaluated using Tukey multiple range test. A p-value<0.05 was considered to be statistically significant. IBM Statistical Product and Service Solutions (SPSS) 26 program was used for data analysis.
RESULTS AND DISCUSSION
Yield of gelatin
The effect of soaking time with hydrochloric acid on the yield values of gelatin can be shown in fig.1. Based on the data, different times influenced the yield value, but the difference was not significant (F(2,6)=0.514, p value=0.622). Soaking for 6 h showed a smaller yield value than soaking for 12 and 24 h, but the difference was very small. The results of this study were consistent with the previous study, which used 5 % of hydrochloric acid for 12 and 24 h on chicken bone samples and produced a yield of over 10 % [25]. Although the yield value for 12 h soaking time was higher than 6 h, the difference was very small. Based on these results, it can be indicated that soaking for 6 h has shown near maximum demineralization. From several previous references, the use of strong acids such as HCl tends to be faster in the bone demineralization process compared to weaker acids, where the end point or maximum point of the demineralization process can be reached in 3 to 7 h [41]. According to Khirzin (2019), the lower the hydrochloric acid concentration, the less gelatin was extracted because gelatin was still strongly bound to the bone tissue, as a result, extraction was not optimal. However, when hydrochloric acid concentration was too high, it could also cause gelatin components to break down and dissolve in hydrochloric acid [42].
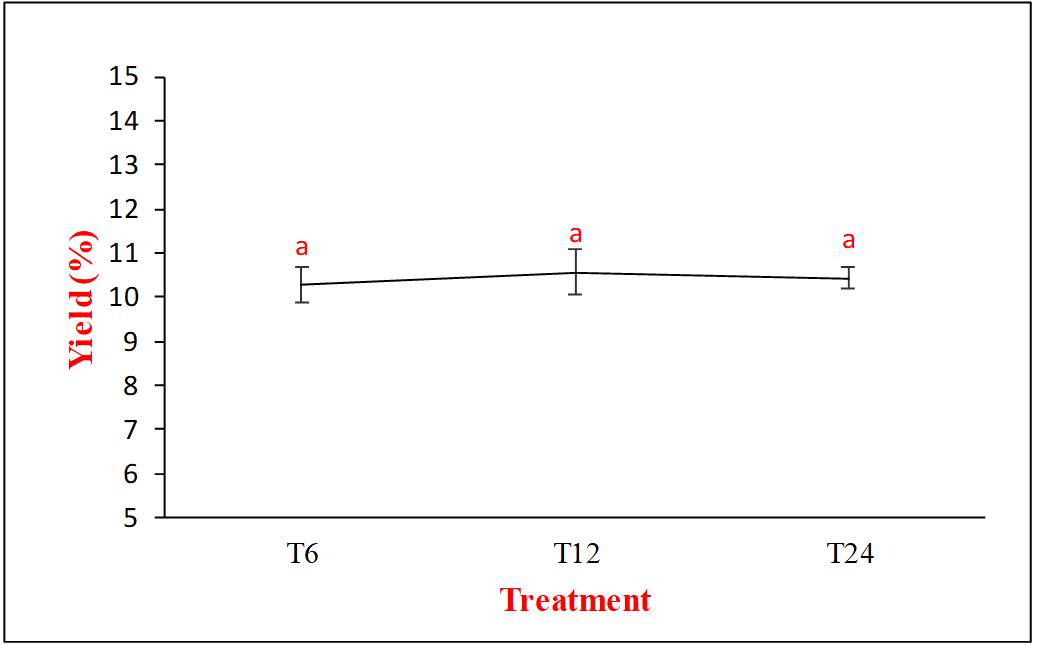
Fig. 1: The effect of immersion time on the yield value of gelatin. Data were expressed in mean±SD, (n=3). The same letters above bars indicate no significant differences (p>0.05)
Proximate composition determination
Proximate parameters of the resulting gelatin were presented in table 1. Based on the proximate parameter tests conducted, both water and ash contents of gelatin produced using acid method met the requirements of SNI 06-3735-1995 regarding gelatin quality. Water content from the drying shrinkage test showed that gelatin produced met the water content requirement that should be no more than 16 %, and there was no significant difference for all soaking time variation (F(2,6)=2.911, p value =0.131) [28]. For the ash content test, there was no significant different between soaking time variation at 6 and 12 h, but the result for 24 h showed significant different (F(2,6)= 73.580, p value=0.000) compared with the others, but the test showed that all gelatin produced exhibited ash content below 2 % and met the requirement (<3.25 %) [28]. In addition, the lipid content in gelatin produced was also very low, it was below 1.2 % (F(2,6)=2522.364, p value=0.000).
Total protein content testing also showed more than 70 % for all soaking time variation and the 24 h showed lower than others. The duration of soaking in 5 % hydrochloric acid showed very little change in protein content of gelatin, but there was no significant difference (F(2,6)= 5.683, p value=0.041). Based on the data, increasing the duration of hydrochloric acid immersion for 24 h resulting in a decrease in the protein content of the gelatin produced. This occurs in relation to acid-induced hydrolysis processes. If the soaking time in acid is too long, it can cause the collagen fibers to shrink, the collagen structure to break down, and lead to the degradation of collagen into an unordered structure. Collagen that gets damaged from too much acid exposure will dissolve in the soaking solution and be washed away during rinsing, which reduces the amount of gelatin protein extracted [43].
The results at this study were similar to those of protein content testing on chicken bone samples, where the use of 5 % of hydrochloric acid for 12 h of soaking produced gelatin with a protein content of 70.6% [25]. Subsequently, this was even higher than the results of a study on gelatin production using 5 % of hydrochloric acid for 48 h on broiler chicken bones, which was 67.75 % [44]. Several factors could cause differences in gelatin protein content, including the fact that gelatin protein levels depend on the species of animal that produce collagen. The use of acidic solvents in the demineralization process also affected protein content of gelatin produced. The higher the acid concentration, the longer the soaking time, and the higher the temperature used decreased the protein content due to more protein in the raw material was hydrolyzed [45].
Table 1: Proximate parameter muscovy duck gelatin
| Treatment | Water content (%) | Ash content (%) | Lipid content (%) | Total protein content (%) |
| T6 | 2.26±0.76a | 0.84±0.06a | 1.15±0.02a | 75.50±2.03a |
| T12 | 3.14±0.43a | 0.93±0.08a | 0.70±0.01b | 75.86±1.86a |
| T24 | 2.36±0.51a | 1.52±0.08b | 0.24±0.01c | 71.05±1.96a |
Data in mean±SD (n=3), followed by the different letters in each column, show significant difference (p<0.05)
pH value
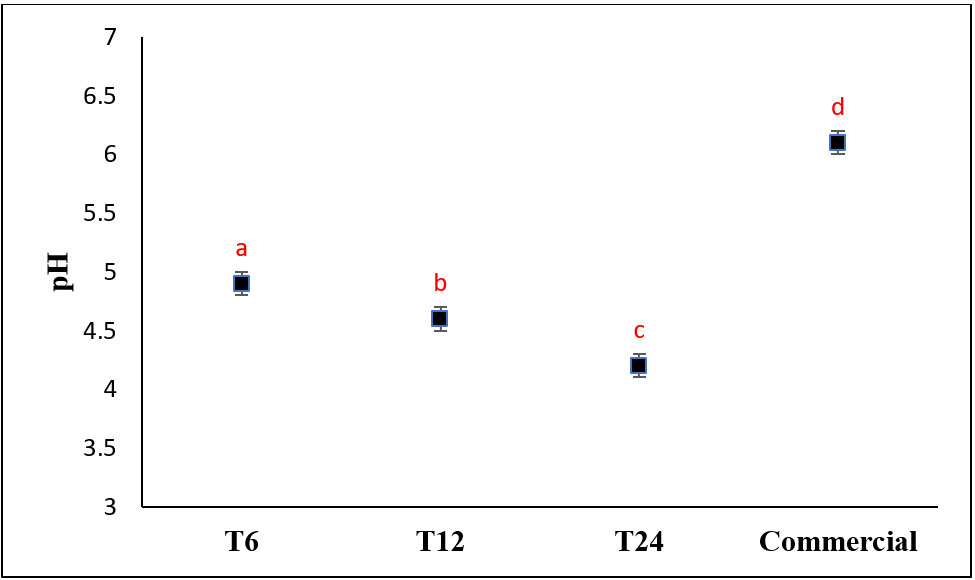
The pH of gelatin extracted using acid method, namely 5% of hydrochloric acid, tended to be acidic (fig. 2a). But, the pH of gelatin still met the requirements for type A gelatin according to gelatine manufacturers institute of America (GMIA) requirements, which was between 3.8 and 5.55, and all pH results showed significant different (F(2,6)=111, p value=0.000). Previous studies on the pH values of poultry gelatin were 5.50 for chicken intestine [14], pH 5.35 from chicken head [16], or pH 6.0 for chicken bone [44]. Based on previous studies, several factors affected the pH of gelatin produced, including the type of acid used and the neutralization process carried out after soaking in acid, which must be considered because it could affect the final pH of gelatin [46]. The washing process during neutralization may not remove all acid residues in the collagen tissue of the bone marrow, thereby contributing to the low pH of the gelatin produced.
Viscosity measurement
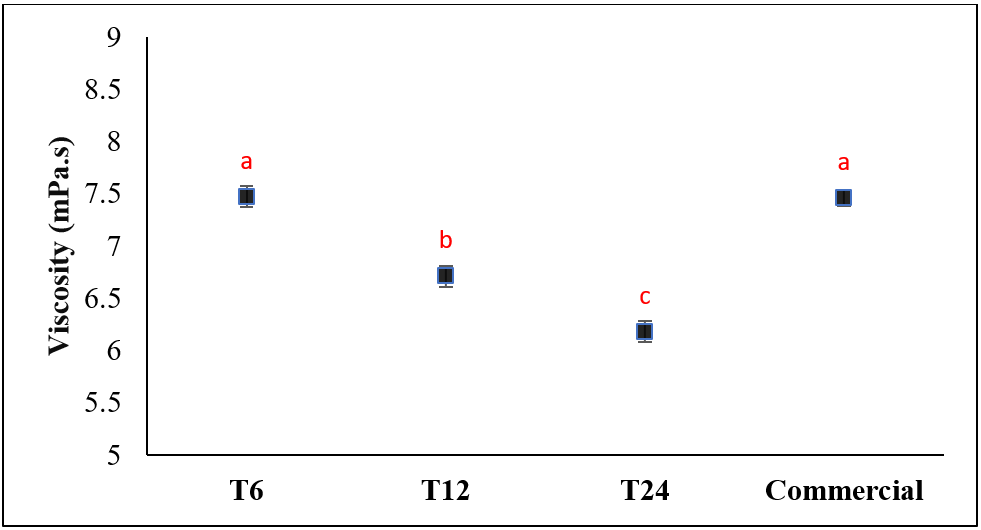
Based on the data in fig. 2b, viscosity of Muscovy duck bone gelatin produced was meeting the gelatin viscosity requirements according to SNI 06-3735-1995, which was between 1.5 and 7.5 mPa. s. Increasing the duration of bone immersion in 5 % of hydrochloric acid caused a decrease in viscosity value of gelatin produced. The difference in acid immersion time produced significant difference viscosity values (F(3,8)=664.079, p value=0.000), but the viscosity of T6 gelatin did not different significantly from the viscosity of commercial gelatin. The viscosity value of the gelatin produced was similar to several previous studies, such as from chicken bone using acid method (6.0 mPa. s) or using chicken head with acetic acid 4 % (6.33 mPa. s) [44, 16]. This viscosity value was influenced by various factors such as temperature, pH, hydrodynamic interactions between gelatin molecules, and related to the polypeptide chains of amino acids that generate the gelatin structure [24].
Gel strength
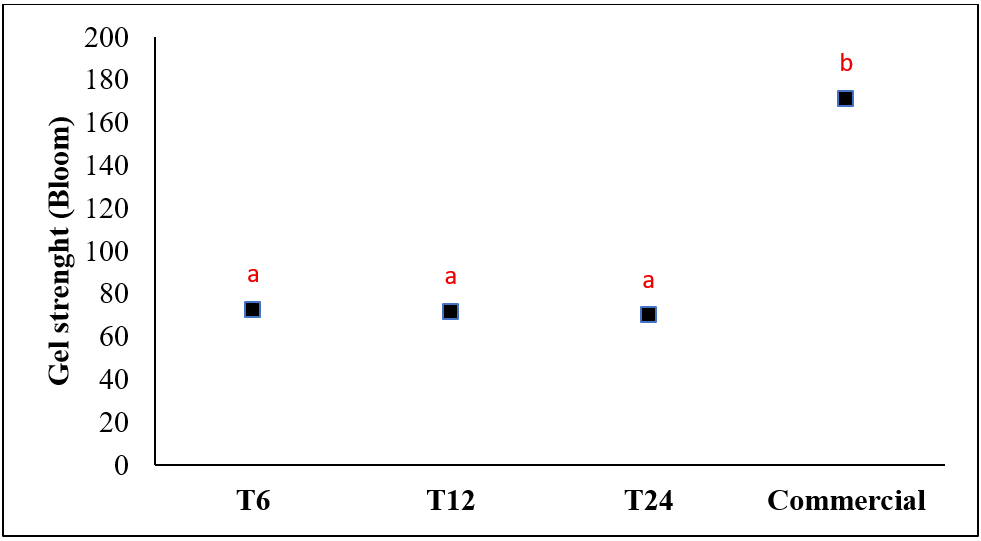
The gel strength test results showed for gelatin produced can be seen in fig. 2c. This value indicated that the gel strength was quite good and still met gel strength test requirements from GMIA [32] in the range of 50-300 bloom and similar to the commercial gelatin gel strength, which usually range from 50 to 200 bloom [47]. There was no significant difference between gel strength values with soaking time variation, but the gel strength value was significant compared with commercial gelatin (F(3,8)= 4355.189, p value=0.000). Gel strength is one of the most important parameters of gelatin because it greatly determines its ability to form a gel when applied. Although T6 showed an increase in gel strength compared to T12 and T24, the increase was not significant and only a trend, not a proven difference. In addition, the gel strength value under 100 bloom also considered in weak category [47]. Various factors can greatly affect gel strength, including pH, amino acid content, and molecular weight distribution of gelatin [34].
Color test
Color of duck bone gelatin produced in variations of soaking time (6 h, 12 h, and 24 h) was shown by the l, a*, and b* notation values in table 2, which tended to be yellowish white/pale and did not different significantly in all treatments (F(2,6)=4.277, p value=0.070 for l), (F(2,6)= 0.525, p value =0.616 for a*) and (F(2,6)= 0.045, p value=0.956 for b*), respectively. This suggested that the difference in the length of soaking during the pretreatment process with hydrochloric acid did not greatly affect color of gelatin produced. Extraction method factors, such as the temperature used and the extraction time, could affect color of gelatin produced [35]. Color evaluation of gelatin was used as a quality parameter in gelatin production, ensuring that repeated production yielded the same color parameters.
Table 2: Results of gelatin color tests produced from muscovy duck bones
| Treatment | L* | a* | b* |
| T6 | 33.33±0.47a | 0.75±0.37a | -0.33±1.06a |
| T12 | 33.54±1.54a | 0.81±0.20a | -0.55±0.14a |
| T24 | 35.31±0.23a | 0.52±0.59a | 0.26±1.54a |
L*: lightness, a*: red/green value, b*: blue/yellow value. Data in mean±SD (n=3) followed by the different letters in each column show significant difference (p<0.05)
a
b
c
Fig. 2: Effect of soaking time on a) pH, b) viscosity, and c) gel strength (different letters above bars indicate significant differences (p<0.05))
Atomic absorption analysis
Heavy metal content testing on gelatin samples was conducted for Cu, Zn, and As. Based on the data in table 3, it was observed that there were Cu, Zn, and As metal contents in gelatin samples produced, but only in very small amounts. Therefore, it could still meet SNI requirements. The difference in soaking time with acid causes a slight difference in the Cu content in gelatin, but the difference was significant (F(2,6)=1093.371, p value= 0.000). Whereas the Zn content in gelatin shows that the difference in immersion time with acid shows no significant difference in all samples (F(2,6)=4.042, p value= 0.077). Although the As levels in all treatments were very low, the differences were significant (F(2,6)= 2202, p value= 0.000). Metal content in gelatin produced was due to the natural content in the material used as a source of gelatin, and also contamination that occurred during gelatin manufacturing process. Therefore, the selection of safe collagen sources and strict inspection during the manufacturing process were very important to produce good-quality gelatin [48]. When heavy metal content met the requirements, gelatin produced from Muscovy duck bones could be used safely [49].
FTIR analysis
The results of FTIR profile analysis of gelatin produced compared to commercial gelatin were displayed in fig. 3. Based on the results of the study, the infrared spectrum of Muscovy duck bone gelatin samples using 5 % hydrochloric acid immersion for 6, 12, and 24 h consecutively showed wave numbers of 3277 cm-1, 3272 cm-1, and 3287 cm-1, respectively. This was in accordance with Sugita (2021), who stated that Amide a absorption peak was in the range of 3600-2300 cm-1. Amide a absorption region could occur due to the presence of N-H stretching, namely from amide group bonded to amino acids and hydroxyproline, and hydrogen bonds [50].
The next absorption region of Muscovy duck bone gelatin using 5% of hydrochloric acid immersion for 6, 12, and 24 h showed wave numbers of 2928 cm-1, 2925 cm-1, and 2926 cm-1, respectively. This absorption region was the absorption region for C-H functional group. According to Coates (2000), the absorption peak of C-H functional group ranged from 2935 to 2915 cm-1 [51].
Table 3: Results of heavy metal testing on muscovy duck bone gelatin using acid method
| Treatment | Result (ppm) | ||
| Cu | Zn | As | |
| T6 | 0.80±0.04a | 35.12±1.52a | 0.17±0.01a |
| T12 | 0.53±0.03b | 34.35±1.50a | 0.02±0.01b |
| T24 | 1.99±0.08c | 36.00±1.11a | 0.001±0.00c |
| Requirements based on SNI 06-3735-1995 (ppm) | Maximum 30 | Maximum 100 | Maximum 2 |
Data were expressed in mean±SD, (n=3), followed by the different letters in each column show significant difference (p<0.05)
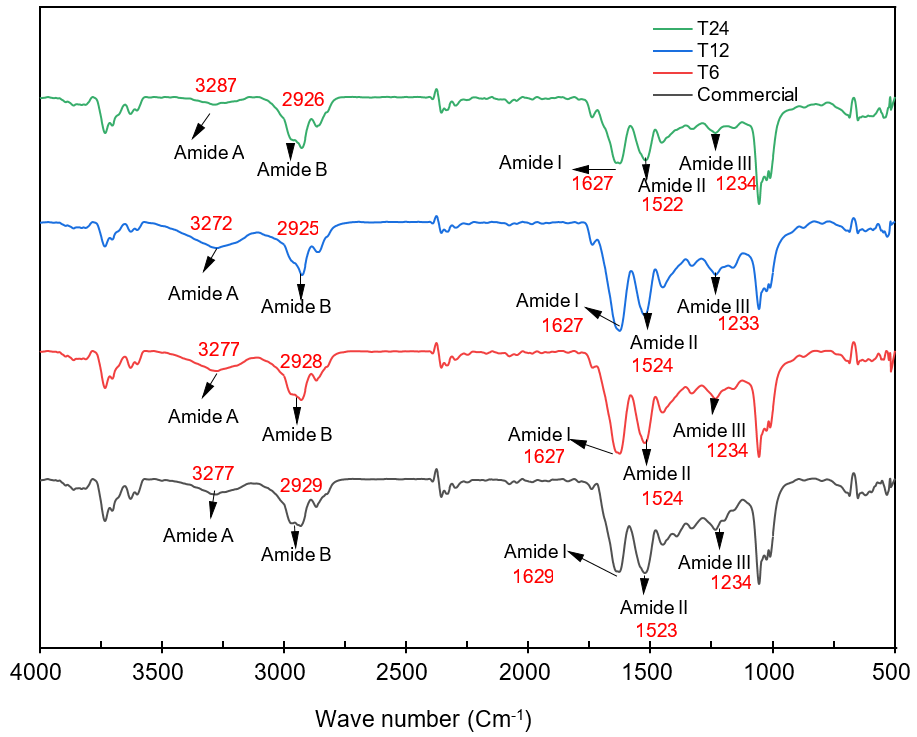
Fig. 3: FTIR profile of Muscovy duck bone gelatin compared to commercial gelatin. There are similar functional groups in gelatin samples and commercial gelatin, indicating the presence of amide functional groups A, B, I, II and III, which are commonly found in gelatin
In this study, the next absorption region of Muscovy duck bone gelatin using 5 % of hydrochloric acid immersion for 6, 12, and 24 h showed the similar wave numbers of 1627 cm-1. This absorption region was absorption region of amide group I, namely C=O functional group and C-N stretching. According to Casanova (2020), wave numbers between 1600-1700 cm-1 showed the presence of C=O functional group [52].
The next functional group absorption region was amide II at 6, 12, and 24 h of immersion, which showed wave numbers of 1524 cm-1, 1524 cm-1, and 1522 cm-1, respectively. According to Ko and Yu (2007), absorption region at wavenumbers between 1450 cm and 1575 cm-1 indicated the presence of N-H and C-N functional groups. This absorption occurred due to changes in N-H bond structure in protein molecule, which was related to the change in the tropocollagen structure to an alpha-helix chain structure [53].
Absorption regions of amide III functional group in immersion with 5 % of hydrochloric acid at 6, 12, and 24 h were 1234 cm-1, 1233 cm-1, and 1234 cm-1, respectively. In addition, the results obtained were in accordance with the statement by Woo et al. (2008), stating that absorption region at 1200-1400 cm-1was absorption of amide III. This absorption region indicated the presence of N-H bending groups. All functional groups that appeared in FTIR analysis results of duck bone gelatin were in accordance with the functional groups that appeared in commercial gelatin [54].
The calculation of the amide I to amide II ratio in the FTIR profile of gelatin was an important parameter that can be used to assess the degree of protein denaturation, the relative amount of unfolded protein, or the degree of hydrolysis that has occurred. Based on the data in table 4, the amide I/amide II ratio of all samples showed values above 1. This result was confirmed by other researchers who calculated the amide I/amide II ratio for gelatin, such as bovine gelatin and fish gelatin, with ratios of 1.16 and 1.12, respectively [55]. The amide III/1450 cm-1 ratio value, which was lower than I, also indicates that collagen denaturation has occurred during the gelatin extraction process. Based on Koochakzaei (2023), during the gelatin extraction process, there was a change in the secondary structure of collagen, particularly the α-helix chain, which becomes a random coil and β-sheet, as can be seen from the change in peak intensity in the amide I region [56].
XRD analysis
The results of the thermal analysis of gelatin samples using XRD method could be seen in Fig.4. In this figure, peaks appeared at 2θ ≈ 8 and 20 in all XRD graphs of the samples, and these peaks correlated with the triple helix content in gelatin and it was typically a partially crystalline gelatin [57, 58]. The main patterns that appeared in graphics from all gelatin samples produced were consistent with the patterns that appeared in commercial gelatin, which was also tested as a comparison. This was consistent with Mosleh's (2020) statement that the peak at 8° was related to gel strength of the tested gelatin [57]. However, the results of this study differ slightly from the results of XRD testing of gelatin extracted from the scales of the freshwater fish (Labeo rohita), namely peaks appearing at 2θ ≈ 7 and 19 [56]. Another XRD analysis test using pig skin gelatin samples showed almost identical peak results, appearing at 2θ ≈7.8 and 22.12 [59].
Table 4: Information on the ratio of amide I/amide II and the ratio of amide 3/1450 cm-1 from muscovy duck bone gelatin compared to commercial gelatin
| Sample | Amide I/Amide II | Amide III/Amide 1450 cm-1 |
| T6 | 1.11±0.01 | 0.78±0.01 |
| T12 | 1.17±0.02 | 0.79±0.01 |
| T24 | 1.05±0.01 | 0.75±0.02 |
| Commercial gelatin | 1.00±0.01 | 0.74±0.01 |
Data were expressed in mean±SD, (n=3)
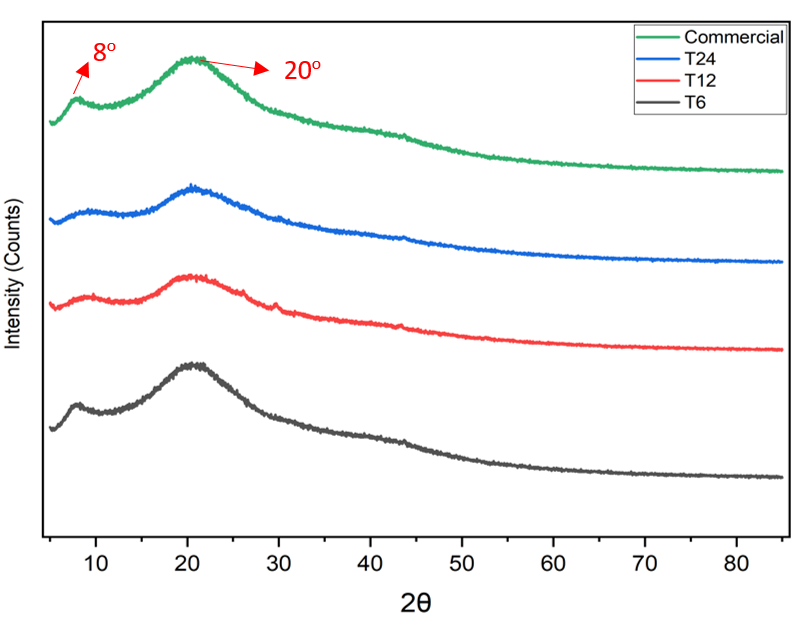
Fig. 4: XRD pattern of Muscovy duck bone gelatin using acid method compared to commercial gelatin. Peaks appeared around 2θ ≈ 8 and 20 in all XRD graphs on gelatin samples, similar to commercial gelatin as a direct comparison.
CONCLUSION
In conclusion, gelatin produced from Muscovy duck bone has a good physical and chemical characterization and has FTIR profile with functional groups and XRD profile similar to commercial gelatin, making it highly potential for use as an alternative source of gelatin. However, this study still has several limitations in terms of confirming that gelatin from Muscovy duck bones is truly safe for use as pharmaceutical excipients, such as microbiological testing, bloom strength-based application classification, and compatibility studies that should be conducted for further studies.
ACKOWLEDGEMENT
Thanks to Faculty of Pharmacy Universitas Sumatera Utara for the support and the authors acknowledge the facilities, scientific and technical support from Advanced Characterization Physics Laboratories Serpong, National Research and Innovation Agency through E-Layanan Sains, Badan Riset dan Inovasi Nasional.
ABBREVIATIONS
FTIR (fourier transform infrared), XRD (x-ray diffraction), SNI (Indonesian national standardization), Gelatin Manufacturers Institute of America (GMIA), AAS (atomic absorption spectrophotometer).
AUTHORS CONTRIBUTIONS
Bayu Eko Prasetyo designed, conducted the experiment, analyzed the results and writing-original draft, Anayanti Arianto designed, supervised and reviewed the manuscript and gave helpful suggestions. Hakim Bangun and Abdi Wira Septama supervised the research and finalized the manuscript.
CONFLICTS OF INTERESTS
The authors declare no conflict of interest.
REFERENCES
Duconseille A, Astruc T, Quintana N, Meersman F, Sante Lhoutellier V. Gelatin structure and composition linked to hard capsule dissolution: a review. Food Hydrocoll. 2015;43:360-76. doi: 10.1016/j.foodhyd.2014.06.006.
Agrosi M, Mischiatti S, Harrasser PC, Savio D. Oral bioavailability of active principles from herbal products in humans a study on hypericum perforatum extracts using the soft gelatin capsule technology. Phytomedicine. 2000;7(6):455-62. doi: 10.1016/S0944-7113(00)80029-X, PMID 11194173.
Esmaeili S, Dayani L, Taheri A, Zolfaghari B. Phytochemical standardization formulation and evaluation of oral hard gelatin capsules from Pinus eldarica bark extract. Avicenna J Phytomed. 2021;11(2):168-79. PMID 33907675.
Permadi A, Wahyuningsih I, Yuliani S, Satar I, Wijayatri R. Effect of gelatin as a binder on turmeric extract tablet formulation. JFSP. 2022:8(2):205-12. doi: 10.31603/pharmacy.v8i2.6399.
Wahlanto P, Yusuf AL, Nugraha D, Siti Rahmah KR, Dissya Alifia. Optimization of gelatin concentration in tablet with african leaf extract (Vernonia amygdalina). MS. 2024;9(4):1057-64. doi: 10.37874/ms.v9i4.1614.
Milano F, Masi A, Madaghiele M, Sannino A, Salvatore L, Gallo N. Current trends in gelatin-based drug delivery systems. Pharmaceutics. 2023;15(5):1499. doi: 10.3390/pharmaceutics15051499, PMID 37242741.
Bayu Eko Prasetyo, Mariadi, Emil Salim. Development of oral thin film strip contained ethanol extract of clove leaves (Syzygium aromaticum (L.) Merr. & Perry). IDJPCR. 2022;5(2):49-57. doi: 10.32734/idjpcr.v5i2.17919.
Prasetyo BE, Mariadi YM, Permata YM, Laila L, Victoria V, Rafiqah L. Fish gelatin and chitosan-based anti-acne patch with tea tree oil: development and evaluation. Int J App Pharm. 2025;17(3):237-42. doi: 10.22159/ijap.2025v17i3.53714.
Jaiswal VS, Kolhe M, Khambayat D, Paprikar P. Gelatin-based drug delivery nanosystem for oncology. Int J Curr Pharm Res. 2025;17(2):10-7. doi: 10.22159/ijcpr.2025v17i3.55044.
Malhotra B, Keshwani A, Kharkwal H. Natural polymer-based cling film for food packaging. Int J Pharm Pharm Sci. 2015;7(4):10-8.
Lukin I, Erezuma I, Maeso L, Zarate J, Desimone MF, Al-Tel TH, Gorka Orive. Progress in gelatin as biomaterial for tissue engineering. Pharmaceutics. 2022;14(6):1177. doi: 10.3390/pharmaceutics14061177, PMID 35745750.
Uddin SM, Hossain MA, Sagadevan S, Al Amin M, Johan MR. Halal and kosher gelatin: applications as well as detection approaches with challenges and prospects. Food Biosci. 2021;44:101422. doi: 10.1016/j.fbio.2021.101422.
Atma Y, Ramdhani H. Gelatin extraction from the indigenous Pangasius catfish bone using pineapple liquid waste. Indones J Biotechnol. 2017;22(2):86-91. doi: 10.22146/ijbiotech.32472.
Gumilar J, Pratama A. Production and characterization of halal gelatin made from chicken intestine. J Agroind Technol. 2018;28(1):75-81. doi: 10.24961/j.tek.ind.pert.2018.28.1.75.
Sompie M, Triasih A. Effect of extraction temperature on characteristics of chicken legskin gelatin. IOP Conf Ser: Earth Environ Sci. 2018;102:012089. doi: 10.1088/1755-1315/102/1/012089.
Syafitri Y, Lianti L, Fadhilah L. The effect of different concentrations of acetic acid (CH3COOH) solution on the physicochemical characteristics of broiler chicken head gelatin. JSTPUHO. 2024;9(6):8059-77. doi: 10.63071/1v5zma94.
Andiati HA, Gumilar J, Wulandari E. Utilization of duck feet gelatin with the additional glycerol as a plasticizer on the physical properties of edible film. JIPT. 2022;10(3):289. doi: 10.23960/jipt.v10i3.p289-299.
Widianingrum D, Widjastuti T, Anang A, Setiawan I. Technical characteristics of Muscovy duck (Cairina moschata) in ciayumajakuning, west Java, Indonesia. J Agric Sciences. 2020;15(2):299-308. doi: 10.4038/jas.v15i2.8814.
Mikhailov OV. Gelatin as it is: history and modernity. Int J Mol Sci. 2023;24(4):3583. doi: 10.3390/ijms24043583, PMID 36834993.
Chua LK, Lim PK, Thoo YY, Neo YP, Tan TC. Extraction and characterization of gelatin derived from acetic acid-treated black soldier fly larvae. Food Chem Adv. 2023;2:100282. doi: 10.1016/j.focha.2023.100282.
Bayu Eko Prasetyo, Mariadi, Yade Metri Permata, Lia Laila, Vivian Victoria, Lainy Rafiqah. Karakterisasi gelatin sisik ikan NILA hitam (Oreochromis niloticus) dengan kombinasi metode asam dan ultrasonik sebagai bahan pangan. JSTP UHO. 2025;10(2):8263–72. doi: 10.63071/jj996z84.
Rahmi Hafsari AR, Rosmiati D, Jamaludin D. The effect of hydrochloric acid (HCL) concentration on the quality of gourami bone gelatin (Ospheronemus Gouramy Lac). In: International Conference Recent Innovations; 2018. p. 2983-9. doi: 10.5220/0009947329832989.
Mulyani S, Setyabudi FM, Pranoto Y, Santoso U. The effect of pretreatment using hydrochloric acid on the characteristics of buffalo hide gelatin. J Indones Trop Anim Agric. 2017;42(1):14-22. doi: 10.14710/jitaa.42.1.14-22.
Anggaeni TT. The effect of sulphuric acid (H2SO4) concentration in yield physical and chemical properties of gelatin from goat skin pickle shaving waste. J Anim Sci Padjajaran Univ. 2020;20(1):17-24. doi: 10.24198/jit.v20i1.27546.
Fasya AG, Amalia S, Imamudin M, Putri Nugraha R, Ni’mah N, Yuliani D. Optimasi produksi gelatin halal dari tulang ayam broiler (Gallus domesticus) dengan variasi lama perendaman dan konsentrasi asam klorida (HCl). Indones J Halal. 2018;1(2):102. doi: 10.14710/halal.v1i2.3665.
Said MI, Triatmojo S, Erwanto Y, Fudholi A. Characteristics of goat skin gelatin that produced through acid and alkali process. Agritech. 2011;31(3):190-200. doi: 10.22146/agritech.9744.
Warmiati ND, Nurhidayati D. Moisture content measurement in gelatin: a comparison of gravimetric methods using moisture analyzer and oven. Settings Berkala Penelitian Teknologi Kulit Sepatu dan Produk Kulit. 2024;23(1):62-71. doi: 10.58533/061s5z77.
Badan Standardisasi Nasional. Quality and testing methods for gelatin. Jakarta: National Standardization Council; 1995.
Badan Standardisasi Nasional. Cara uji mikrobiologi bagian 1: penentuan angka lempeng total (ALT) pada produk perikanan. Jakarta: Badan Standardisasi Nasional; 2006.
Saenmuang S, Phothiset S, Chumnanka C. Extraction and characterization of gelatin from black-bone chicken by-products. Food Sci Biotechnol. 2019;29(4):469-78. doi: 10.1007/s10068-019-00696-4, PMID 32296557.
Mishra A, Sherke A, Lohare B, Soni R. Formulation and evaluation of polyherbal skin-care cream containing liquorice and aloe. Int J Pharm Pharm Sci. 2025;17(12):17-21. doi: 10.22159/ijpps.2025v17i12.55508.
Gelatin Manufacturers Institute of America (GMIA). Gelatin handbook. New York: GMIA; 2012.
Renaldi G, Sirinupong N, Samakradhamrongthai RS. Effect of extraction pH and temperature on yield and physicochemical properties of gelatin from Atlantic salmon (Salmo salar) skin. Agric Nat Resour. 2022;56(4):687-96. doi: 10.34044/j.anres.2022.56.4.03.
Shyni K, Hema GS, Ninan G, Mathew S, Joshy CG, Lakshmanan PT. Isolation and characterization of gelatin from the skins of skipjack tuna (Katsuwonus pelamis), dog shark (Scoliodon sorrakowah), and rohu (Labeo rohita). Food Hydrocoll. 2014;39:68-76. doi: 10.1016/j.foodhyd.2013.12.008.
Al-Hassan AA. Gelatin from camel skins: extraction and characterizations. Food Hydrocoll. 2020;101:105457. doi: 10.1016/j.foodhyd.2019.105457.
Valipour P, Talebian A, Ebadi AG. Gelatin preparation from cow’s bone by heat-pressure method. Asian J Chem. 2008;20(2):1337-42.
Ibibia ET, Peter Obaloluwa AP, Olasunkanmi AM, Ijeoma MA, Olugbemiga OS. Total phenolic flavonoid and mineral contents of the methanolic leaf extract of Parinari curatellifolia planch. Ex benth. Int J Chem Res. 2023;7(2):13-8. doi: 10.22159/ijcr.2023v7i2.218.
Bindhani S, Mohapatra S. Recent approaches of solid dispersion: a new concept toward oral bioavailability. Asian J Pharm Clin Res. 2018;11(2):72-8. doi: 10.22159/ajpcr.2018.v11i2.23161.
Khan S, Jan SU, Gul R, Qadir MA, Shah KU. Formulation and evaluation of metformin HCl release from topical preparation using two different types of membrane. Int J Curr Pharm Sci. 2020;12(4):97-101. doi: 10.22159/ijcpr.2020v12i4.39091.
Tharunya P, Subha V, Kirubanandan S, Sandhaya S, Renganathan S. Green synthesis of superparamagnetic iron oxide nanoparticle from Ficus carica fruit extract characterization studies and its application on dye degradation studies. Asian J Pharm Clin Res. 2017;10(3):125. doi: 10.22159/ajpcr.2017.v10i3.15538.
Pang S, Su FY, Green A, Salim J, Mc Kittrick J, Jasiuk I. Comparison of different protocols for demineralization of cortical bone. Sci Rep. 2021;11(1):7012. doi: 10.1038/s41598-021-86257-4, PMID 33782429, PMCID PMC8007753.
Khirzin MH, Hilmi M, Prastujati AU, Mawardi N, Rahayu R. Characteristics of duck bone gelatin hydrolysate with trypsin enzyme as an alpha amylase inhibitor. Sci J Innov. 2020;20(3):55-60.
Miskiyah SKS, Budiyanto A. The effect of prolonged soaking time on the characteristics of chicken foot gelatin. Agrointek. 2022;16(2):179-85. doi: 10.21107/agrointek.v16i2.11846.
Maryam S, Effendi N, Kasmah K. Production and characterization of gelatin from chicken bone waste using spectrophotometer FTIR. Pharm Mag. 2019;15(2):96. doi: 10.22146/farmaseutik.v15i2.47542.
Febriana LG, NASS PH, Fitriani AN, Putriana NA. The potential of fish bone gelatin as a halal alternative to capsule shells: characteristics and pre-formulation. Pharm Mag. 2021;6(3):223-33. doi: 10.24198/mfarmasetika.v6i3.33183.
Sandria N, Desmelati D, Sukmiwati M. A study on extraction of gelatin from tuna eye (Thunnus sp.). Pekanbaru: Universitas Riau; 2014.
Liu D, Nikoo M, Boran G, Zhou P, Regenstein JM. Collagen and gelatin. Annu Rev Food Sci Technol. 2015;6:527-57. doi: 10.1146/annurev-food-031414-111800, PMID 25884286.
Pertiwi CW, Nuzulina B, Umah DI. Exploring the potential of halal gelatin from chicken by-products: a review. Journal of Halal Product Research. 2025;8(1):13-21. doi: 10.20473/jhpr.vol.8-issue.1.13-21.
Hermanto S, Hudzaifah MR, Muawanah A. Physicochemical characteristics of gelatin from stingray skin (Hyposarcus pardalis) acid extraction results. Valensi Chem J. 2014;4(2):109-20. doi: 10.15408/jkv.v0i0.3608.
Purwantiningsih Sugita, Muhamad Rifai, Ambarsari L, Rahayu DU, Dianhar H. Gelatin extraction and characterization from femur bones of bovine and porcine with acid process. J Jamu Indo. 2021;6(1):32-41. doi: 10.29244/jji.v6i1.188.
Coates J. Interpretation of infrared spectra, a practical approach. In: Meyers RA, McKelvy ML, editors. Encyclopedia of analytical chemistry. Chichester: John Wiley & Sons Limited; 2000. p. 10815-37. doi: 10.1002/9780470027318.a5606.
Casanova F, Mohammadifar MA, Jahromi M, Petersen HO, Sloth JJ, Eybye KL. Physico-chemical structural and techno-functional properties of gelatin from saithe (Pollachius virens) skin. Int J Biol Macromol. 2020;156:918-27. doi: 10.1016/j.ijbiomac.2020.04.047, PMID 32283110.
Kong J, Yu S. Fourier transform infrared spectroscopic analysis of protein secondary structures. Acta Biochim Biophys Sin (Shanghai). 2007;39(8):549-59. doi: 10.1111/j.1745-7270.2007.00320.x, PMID 17687489.
Woo JW, Yu SJ, Cho SM, Lee YB, Kim SB. Extraction optimization and properties of collagen from yellowfin tuna (Thunnus albacares) dorsal skin. Food Hydrocoll. 2008;22(5):879-87. doi: 10.1016/j.foodhyd.2007.04.015.
Sendrea C, Carsote C, Badea E, Adams A, Niculescu M, Iovu H. Non-invasive characterisation of collagen-based materials by NMR-mouse and ATR-FTIR. Sci Bull B Chem Mater Sci. 2016;78(3):27-38.
Koochakzaei A. Determination of sulfuric acid effects on degradation and structural changes of gelatin using Fourier-transform infrared spectroscopy and peak deconvolution analysis. Spectroscopy. 2023;38:5-11. doi: 10.56530/spectroscopy.tw7684z4.
Mosleh Y, De Zeeuw W, Nijemeisland M, Bijleveld JC, Van Duin P, Poulis JA. The structure-property correlations in dry gelatin adhesive films. Adv Eng Mater. 2021;23(1):2000716. doi: 10.1002/adem.202000716.
Das MP, Suguna PR, Prasad K, JVV, MR. Extraction and characterization of gelatin: a functional biopolymer. Int J Pharm Pharm Sci. 2017;9(9):239. doi: 10.22159/ijpps.2017v9i9.17618.
Asma C, Meriem E, Mahmoud B, Djaafer B. Physicochemical characterization of gelatin-cmc composite edibles films from polyion-complex hydrogels. J Chil Chem Soc. 2014;59(1):2279-83. doi: 10.4067/S0717-97072014000100008.