
Int J Curr Pharm Res, Vol 17, Issue 4, 98-104Original Article
DEVELOPMENT AND VALIDATION OF HPTLC METHOD FOR CEFPROZIL ESTIMATION
TOSHIKA SANJAY NIKAM1*, MANISHA KATKATE2, RAHUL SHIVARKAR3, NILESH BABRE4
1Department of Pharmaceutical Quality Assurance, Pes Modern College of Pharmacy (for Ladies) Moshi Pune, 421105, Maharashtra, India. 2Department of Pharmaceutical Quality Assurance, Nulife Pharmaceutical, Bhosari, Pune-411018, Maharashtra, India. 3Department of Pharmacognosy, Pes Modern College of Pharmacy (for Ladies) Moshi Pune-421105, Maharashtra, India. 4Department of Pharmacology, Oriental College of Pharmacy, Sanpada, Navi Mumbai-400705, India
*Corresponding author: Toshika Sanjay Nikam; *Email: toshikanikam36@gmail.com
Received: 15 Apr 2025, Revised and Accepted: 10 Jun 2025
ABSTRACT
Objective: To develop and validate a precise, robust, and efficient High-Performance Thin Layer Chromatography (HPTLC) method for quantitatively estimating Cefprozil in bulk and pharmaceutical tablet formulations.
Methods: HPTLC analysis was performed using silica gel 60 F254 plates and a mobile phase of methanol, ethyl acetate, and triethylamine (5.5:4.5:0.2 v/v/v). Densitometric detection was conducted at 285 nm. The method was validated as per ICH guidelines.
Results: Cefprozil exhibited an Rf value of 0.48. The method showed good linearity in the 2-10 µg/band range with a correlation coefficient (R²) of 0.9989. The LOD and LOQ were found to be 0.5227 µg and 1.5840 µg per band, respectively. Recovery ranged between 98 %-102%, indicating accuracy. Robustness and specificity studies confirmed the method’s reliability under slight variations.
Conclusion: The developed HPTLC method is simple, specific, reproducible, and suitable for the routine quality control of Cefprozil in pharmaceutical formulations.
Keywords: HPTLC, Cefprozil, Validation, Pharmaceutical analysis, Quality control
© 2025 The Authors. Published by Innovare Academic Sciences Pvt Ltd. This is an open access article under the CC BY license (https://creativecommons.org/licenses/by/4.0/)
DOI: https://dx.doi.org/10.22159/ijcpr.2025v17i4.7027 Journal homepage: https://innovareacademics.in/journals/index.php/ijcpr
INTRODUCTION
Cefprozil, an oral second-generation cephalosporin, demonstrates broad-spectrum antibacterial activity. It is active against numerous pathogens, covering both g-positive and g-negative aerobic bacteria, as well as many anaerobic organisms. Compared to other cephalosporins, cefprozil shows slower hydrolysis in the presence of Staphylococcus aureus, regardless of penicillinase production. Recognised for its comprehensive antibacterial coverage, cefprozil offers inhibition against a wide array of aerobic and anaerobic bacterial strains. It also exhibits potentially greater stability against beta-lactamase enzymes than several other oral cephalosporins. Cefprozil is acknowledged as a potent remedy for mild to moderate infections of the upper and lower respiratory system, such as sinus inflammation, middle ear infection, throat inflammation, and airway inflammation, along with dermal and soft tissue conditions, rendering it a valuable choice for both teenagers and grown-ups [1-7]. Cefprozil is a semisynthetic cephalosporin antibiotic with a molecular weight of approximately 407.45 g/mol. Its chemical structure can be described as a derivative of 6-(7,7R)-(R)-2-amino-7-[2-acetamido]-8-oxo-3-propenyl-5-thia-1-azabicyclo[4.2.0] oct-2-ene-2-carboxylic acid, and its molecular formula is C₁₈H₁₉N₃O₅S. The substance presents as an off-white to light yellow crystal-like powder. It demonstrates high dissolvability in water and methanol, whereas its dissolvability in ethanol is low. Cefprozil remains chemically stable under normal room temperature conditions [8]. Cefprozil, a β-lactam class antibiotic, functions by targeting penicillin-binding proteins (PBPs), which play a crucial role in the terminal steps of bacterial cell wall construction. By inhibiting these PBPs, cefprozil interferes with cell wall integrity, leading to cell lysis. This occurs as the disruption activates autolytic processes involving enzymes like autolysins, which are normally regulated by specific inhibitors [9, 10] Cefprozil is commonly used in clinical practice to manage a range of respiratory tract infections both upper and lower such as pharyngitis, tonsillitis, sinusitis, acute flare-ups of chronic bronchitis, as well as skin and soft tissue infections [11, 12]. Cefprozil comprises around 90% cis-form and 10% trans-form [13]. Both forms display similar antimicrobial potency against g-positive microorganisms; nevertheless, g-negative organisms demonstrate reduced susceptibility to their influence. Research indicates that the cis configuration of cefprozil is no less than sixfold more potent in eradicating g-negative microbes relative to the trans configuration [14]. Therefore, it is important to evaluate blood levels and individually assess the in vivo pharmacokinetic characteristics of each isomer [15]. High-Performance Thin Layer Chromatography (HPTLC) is an enhanced version of traditional Thin Layer Chromatography (TLC), known for its improved resolution, accuracy, and analytical performance. It involves precise sample application, consistent chromatogram development, and data analysis supported by specialised software, ensuring reliable and reproducible results [16]. HPTLC techniques are founded on well-established scientific principles for both qualitative and quantitative analysis, making them highly suitable for meeting the rigorous quality standards of contemporary analytical laboratories. This method guarantees precise quantitative assessments and improves resolution [17, 18].
MATERIALS AND METHODS
Instrumentation and apparatus
The study employed a CAMAG HPTLC system (Switzerland), integrated with a 100 μl Hamilton syringe, a wensar analytical balance, a dual-wavelength UV cabinet, A partially automated CAMAG Linomat V dispenser, a CAMAG TLC Detector 3, and a 10×10 cm level-base dual-channel development chamber [19].
Reagents and materials
Lupin Pharmaceuticals Ltd kindly supplied a complimentary sample of cefprozil. The commercial tablet preparation, Refzil O, was obtained from the nearby market. All substances and solutions utilised in the experiment were of analytical quality. Double-distilled water, freshly prepared on-site, was utilised throughout the experimental procedures.
Chromatographic conditions
Methanol was utilised to precondition the HPTLC plates before the analysis, and the solvent was removed by activating the plates at 100 °C for five minutes. Cefprozil solutions were spotted onto 10×10 cm and 5×10 cm TLC plates using a 100 microliter syringe and a Linomat V automatic applicator, with each band measuring 8 mm in length, positioned 10 mm from the plate’s bottom and edge, and spaced 10 mm apart. The chromatographic plates were activated in a dual-trough chamber equilibrated for 10 min with a solvent system consisting of methanol, triethylamine, and ethyl acetate (5.5:4.5:0.2, v/v/v). Densitometric evaluation was conducted at 285 nm utilising a CAMAG TLC scanner III, and the data were analysed using Win CATS software.
Preparation of standard solution
A stock solution of Cefprozil (1000 µg/ml) was formulated by accurately measuring 10 mg of the Cefprozil reference compound, dissolving it in purified water, and adjusting the volume to 10 ml in a calibrated flask.
Preparation of sample solution
A precisely measured quantity of tablet powder, equivalent to 10 mg of Cefprozil, was placed into a 10 ml volumetric flask. Around 7 ml of purified water was introduced, and the blend was sonicated for 15-20 min to achieve thorough dispersion. The volume was subsequently adjusted to the calibration mark with purified water. The resulting solution was filtered through Whatman filter paper to obtain a final concentration of 1000 μg/ml.
Determination of wavelength for measurement
The method's specificity for wavelength identification was evaluated by examining the prepared plate with a CAMAG Scanner III densitometer in reflectance mode over the UV-visible range (200-700 nm). A sharp and distinct peak appeared at 285 nm, which was chosen as the ideal detection wavelength.
Analysis of cefprozil in marketed formulation
Twenty tablets from each Cefprozil formulation were individually weighed and finely triturated. A precisely measured quantity of powder, corresponding to 10 mg of Cefprozil, was placed into a 10 ml volumetric flask. About 7 ml of purified water was introduced, and the blend was sonicated for 15 min to guarantee thorough dispersion. The mixture was subsequently filtered using Whatman filter paper, and the final volume was adjusted to 10 ml with purified water. A 6 μL aliquot of the resulting solution was withdrawn for further analysis [20].
Method validation
Linearity and range
Linearity in an analytical technique refers to the method's ability to produce results that are directly related to the analyte concentration, or can be mathematically adjusted to align with it, within a defined interval [21]. This factor guarantees that the absorbance observed is directly related to the analyte concentration in the sample. Linearity was evaluated by preparing five concentration stages (2 μg/band, 4 μg/band, 6 μg/band, 8 μg/band, and 10 μg/band) from a reference solution and examining them over three consecutive days at a wavelength of 280 nm. The linearity properties were identified by assessing the correlation between the peak area response of Cefprozil and its associated concentration across the 2-10 μg/band spectrum.
Limit of detection (LOD)
In limit examinations, the detection threshold (DT) for a particular analytical procedure denotes the minimal quantity of a substance in a specimen that can be identified, although not accurately measured. Rather than presenting the DT in concentration units, it is more advantageous to report it according to the mass applied to the surface [22].
Limit of quantification (LOQ)
The detection threshold (LOQ) of an analytical technique denotes the smallest amount of a compound in a specimen that can be measured with reliable consistency and correctness [23].
Precision
The precision of the testing technique is assessed to ensure consistent observation of specified testing criteria, including active compound concentration and contaminant quantities. This assessment also assists analysts and end-users in verifying the method’s appropriateness for its intended application [24-28].
Sample application consistency
To evaluate consistency, the specimen solution at a strength of 6 μg/band was spotted six times, and the per cent relative standard deviation (RSD) of the obtained peak responses was calculated.
Precision (Intra-day and inter-day)
Intra-day repeatability measures the uniformity of outcomes achieved within one day, while inter-day repeatability examines fluctuations over multiple days. To evaluate the method’s total repeatability, a Cefprozil sample solution (6 μg/band) was tested three times on the same day for intra-day repeatability and across three successive days for inter-day repeatability.
Accuracy
The exactness of the suggested technique was evaluated through retrieval experiments performed at three varied levels: 80%, 100%, and 120%. To assess the method’s repeatability, a measured quantity of reference was incorporated into the marketed product. The prepared samples were examined in threefold using the described protocol. The retrieval percentage ranged between 98% and 102%, verifying the method’s dependability and exactness.
Solution stability
To evaluate the durability of Cefprozil, a reference solution was formulated and kept at ambient temperature (25 °C) for six hours. The solution was examined using a verified HPTLC procedure at periods of 0, 2, 4, and 6 h. No significant deterioration or generation of contaminants was detected in the chromatographic profiles, with the signal area and elution time remaining stable throughout the evaluation. At each time point, the percentage of Cefprozil remained within the permissible limit of 98.0-102.0%. These results verify that the reference Cefprozil solution maintains its integrity for at least six hours under standard lab settings.
Robustness
A durability examination was performed to evaluate how small, intentional adjustments in the chromatographic settings affect the measurement of Cefprozil in tablet formulations. The investigation analysed the impact of subtle changes in mobile phase volume, mixture, and chamber saturation duration on the analytical outcomes. Chromatographic partitioning was executed using mobile phases made up of methanol, ethyl acetate, and triethylamine in varying volume proportions (5.5:4.5:0.2 v/v/v)
Specificity
Achieving optimal purity in a sample chromatogram can be difficult, particularly when contaminating substances are involved. Specificity denotes a technique’s ability to differentiate the target analyte from other substances like active components, additives, contaminants, or breakdown products. This attribute guarantees that the identified peak is exclusively linked to the analyte of focus [29]. The uniqueness of the pharmaceutical formulation was determined by evaluating its absorption, reflection spectra, and Rf value against those of the benchmark reference Cefprozil. To evaluate peak purity, spectral information was gathered at the starting point, peak apex, and conclusion of the chromatographic peak.
Stress degradation studies
Degradation testing under stress conditions was performed across diverse scenarios, including acidic, basic, and neutral hydrolysis, in addition to oxidative, thermal, and photochemical settings. For every trial, two samples were employed: a control and a Cefprozil benchmark reference. To evaluate the method's robustness and selectivity, a solution was made by dissolving 10 mg of Cefprozil in 10 ml of water, which was subsequently exposed to forced breakdown. In all situations, three repetitions were examined, and the mean peak area of both the degraded sample and the Cefprozil benchmark was recorded following application (6 µg per band) using High-Performance Thin-Layer Chromatography (HPTLC).
Acidic hydrolysis
A quantity of 10 milligrams was accurately weighed and dispersed in 3 ml of 0.05 N hydrochloric acid, then kept at room temperature for 30 min to evaluate its stability in acidic conditions. Thereafter, the solution was adjusted to neutrality using 0.05 N NaOH and extended with water to the required volume to achieve a terminal concentration of 100 µg/ml. A fraction equivalent to 6 µg per strip was subsequently applied onto a TLC plate to produce the densitogram.
Alkaline hydrolysis
To analyse the degradation in alkaline conditions, 10 mg of Cefprozil was accurately weighed and dispersed in 3 ml of 0.05 N NaOH. The blend was maintained at room temperature for 30 min. At that point, it was counteracted with 0.05 N HCl, then thinned with water to attain a terminal strength of 1000 µg/ml. A 6 µg/band portion of this solution was then deposited onto a TLC plate for densitometric evaluation.
Oxidative hydrolysis
A 10 mg amount of Cefprozil was precisely measured and dissolved, followed by the introduction of 3 ml of 3% hydrogen peroxide to commence oxidative degradation. The blend was kept at room temperature for 30 min to allow the reaction to occur. Subsequently, the liquid was thinned with water to reach a final 1000 µg/ml strength. From this, a 6 µg/band fraction was spotted onto a TLC plate, and the analysis produced a densitogram.
Thermal hydrolysis
A 10 mg aliquot of Cefprozil was exposed to thermal treatment in a furnace set at 40 °C for 30 min. Following the heating process, the compound was solubilised in water and adjusted to a concentration of 1000 µg/ml. From this resulting solution, 6 µg per spot was applied to a TLC plate. Afterwards, a densitogram was produced for evaluation.
Photolytic hydrolysis
A 10 mg amount of Cefprozil was exposed to constant UV radiation for 24 h. Following this contact period, the specimen was solubilised in water and thinned to achieve a 1000 µg/ml strength. A 6 µg per band level of this formulated mixture was then applied onto a TLC sheet, and the chromatographic division was monitored by generating a densitographic profile.
Hydrolytic hydrolysis
Hydrolysis is a commonly seen chemical breakdown process that can take place under different pH environments. In this process, a substance breaks down when it interacts with water. The choice of acidic or alkaline environments, along with their concentration, is based on the stability characteristics of the drug compound. Generally, alkaline hydrolysis utilises sodium hydroxide or potassium hydroxide in concentrations between 0.1 and 1M, while acidic hydrolysis typically uses sulfuric acid or hydrochloric acid within the same concentration range [30, 31]. During a hydrolysis degradation study, 10 mg of Cefprozil was accurately measured, solubilised in 3 ml of purified water, and allowed to decompose at room temperature for 30 min. The obtained solution was subsequently diluted to attain a final strength of 1000 µg/ml. A chromatogram was generated by applying 6 µg of the mixture to each segment on a TLC plate.
RESULTS AND DISCUSSION
Optimisation of the HPTLC method
The ideal solvent mixture was determined to be a methanol: ethyl acetate: triethylamine proportion of 5.5:4.5:0.2 (v/v/v). The formulated solvent mixture delivered a separation with an Rf value of 0.48±0.02 for Cefprozil.
Analysis of marketed formulation
The chromatogram obtained from the Cefprozil tablet samples displayed an Rf value of 0.48, as shown in fig. 4.
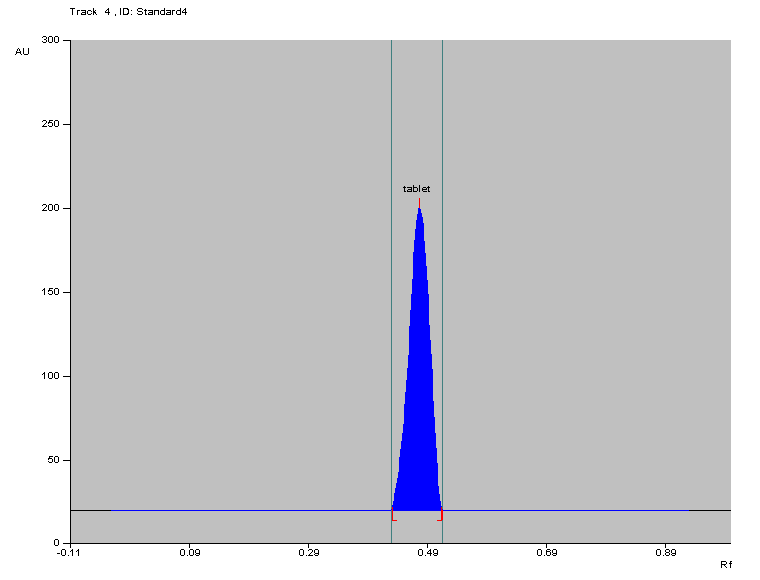
Fig. 1: Densitogram of cefprozil in marketed formulation
Table 1: Analysis results for cefprozil marketed formulation
| Formulation | Cefprozil |
| % Drug content | 102.44 |
| ± SD | 0.1288 |
| % RSD | 0.1257 |
According to table 7, the drug content of Cefprozil was found to be 102.44%±0.005. The low value of relative standard deviation (RSD) suggests that this technique is appropriate for routine quantification of Cefprozil in medicinal preparations.
Validation of the method
Linearity and range
The association between the Cefprozil amount (spanning from 2-10 μg/band) and the peak intensity response of Cefprozil was assessed for proportionality. As shown in fig. 2, the Rf value of Cefprozil was determined to be 0.48. The regression formula derived was y = 660.15x+1189.3, with a correlation factor (R²) of 0.9989.
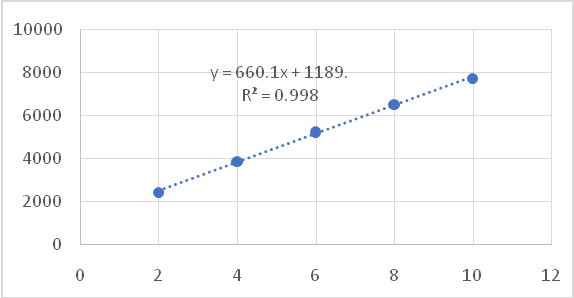
Fig. 2: Linearity graph of cefprozil
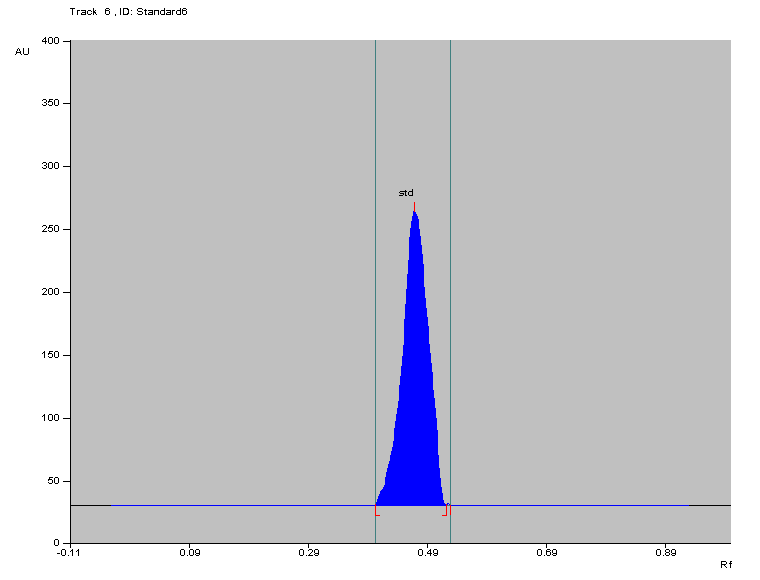
Fig. 3: Densitogram of standard cefprozil with Rf value 0.48
Table 2: Linearity and range results for cefprozil
| Linearity range | 2–10μg/band |
| Regression equation | y = 660.15x+1189.3 |
| Correlation coefficient (R²) | 0.9989 |
LOD and LOQ
The thresholds of identification (TI) and measurement (LM) were established by assessing the signal-to-background ratios at levels three and ten multiples of the ambient noise, respectively. The evaluation indicated that the TI for Cefprozil was 0.5227 μg per stripe, whereas the LM was 1.5840 μg per stripe.
Table 3: LOD and LOQ results for cefprozil
| LOD (μg/band) | LOQ (μg/band) |
| 0.5227 | 1.5840 |
Precision
To assess the uniformity of the procedure, six analyses of cefprozil formulations at the same strength were conducted. The dependability of the procedure was established by examining the inter-day and intra-day variations (%RSD). For within-day accuracy, three separate tests of reference drug solutions were performed on the same day, and the %RSD for the peak area ranged from 0.31% to 0.43%. For day-to-day accuracy, the %RSD for the peak area fluctuated between 0.53% and 0.68%.
Accuracy
The accuracy of the method was assessed at three separate concentration levels using recovery experiments, namely 80%, 100%, and 120%. The specimens collected were examined three times using the outlined procedure. The retrieval percentages approached 100%, with negligible standard deviation (SD) and per cent relative variability (%RV), indicating minor variation and confirming that the procedure is both accurate and reliable for retrieval evaluation.
Table 4: Repeatability study for cefprozil (n=6)
| Formulation | Area of cefprozil | % Drug content |
| Average | 5254.34 | 102.62 |
| SD | 16.74 | 0.4466 |
| %RSD | 0.3186 | 0.4352 |
Table 5: Intermediate precision results for cefprozil (n=6)
| Formulation | Area of cefprozil | % Drug content |
| Average | 5255.22 | 102.65 |
| SD | 27.99 | 0.7067 |
| %RSD | 0.5326 | 0.6885 |
Table 6: Accuracy study for cefprozil
| % Recovery level | 80% | 100% | 120% |
| Amount added (μg/band) | 4 | 6 | 8 |
| Average amount recovered (μg/band) | 4.07 | 6.08 | 8.21 |
| Average % recovery | 101.93 | 101.49 | 101.54 |
| SD | 0.6564 | 0.2059 | 0.8193 |
| %RSD | 0.6439 | 0.2029 | 0.8068 |
Robustness
The coefficient of variation (CV) for the peak intensities was determined three times to evaluate the effect of variations in chamber saturation duration (±5 min), mobile phase quantity (±1 ml), and mobile phase formulation. The technique showed excellent stability, as indicated by minimal %CV values (<2) after minor intentional modifications to the suggested HPTLC protocol.
Table 7: Change in mobile phase results for cefprozil
| Formulation | Change in mobile phase methanol: ethyl acetate: triethylamine (5.5: 4.5: 0.2 v/v/v) |
| Volume of mobile phase(ml) | 9 |
| Average % drug content | 102.16 |
| SD | 0.2730 |
| %RSD | 0.2679 |
Table 8: Change in saturation time results for cefprozil
| Formulation | Change in saturation time |
| Chamber saturation time (min) | 5 |
| Average % drug content | 102.58 |
| SD | 0.1457 |
| %RSD | 0.1421 |
Specificity
The recognition of Cefprozil was validated by contrasting the spectra of both the reference and the sample. The evaluation of Cefprozil in tablet form alongside the reference verified the purity of the pertinent spots, as illustrated in fig. 3. The inactive ingredients and other constituents in the tablet formulation did not disturb the separation and resolution of Cefprozil.
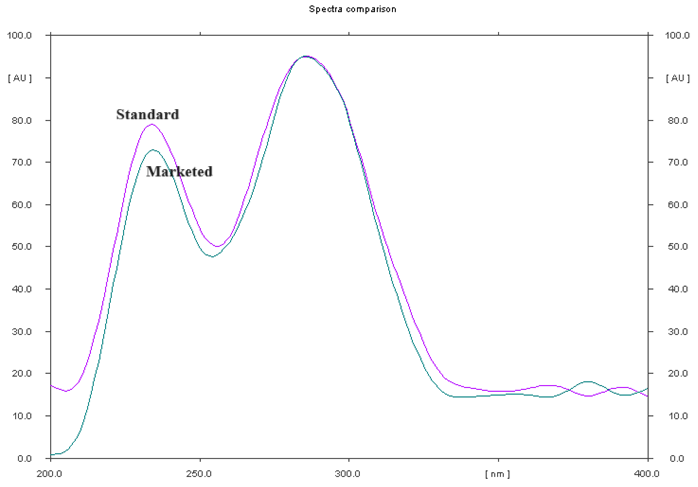
Fig. 4: Overlain UV spectrum of standard cefprozil and marketed formulation
CONCLUSION
The traditional Thin-Layer Chromatography (TLC) technique has been improved with the development of High-Performance Thin-Layer Chromatography (HPTLC), a more sophisticated variant of planar chromatography. In this study, the proposed HPTLC method for evaluating Cefprozil in pharmaceutical formulations demonstrated precision, consistency, simplicity, and reproducibility, without any interference from excipients. The method's validation affirmed its dependability, making it appropriate for the standardisation and continuous quality monitoring of Cefprozil-containing pharmaceutical formulations. A comprehensive review of existing literature uncovered that no previous analytical techniques had been reported for quantifying Cefprozil in pharmaceutical preparations using UV spectrophotometry, High-Performance Liquid Chromatography (HPLC), or HPTLC. In this study, three innovative analytical methods, UV spectrophotometry, HPLC, and HPTLC, were effectively developed and validated to fill this gap. The UV spectrophotometric approach was designed as a quick, simple, and affordable tool for providing essential spectral data for chromatographic evaluation. The HPLC technique, employing a suitable mobile phase, demonstrated excellent sensitivity, high resolution, and a brief retention time, making it perfect for quality control purposes. The HPTLC technique allowed clear separation of degradation products and efficient, high-throughput quantification of Cefprozil. All three methods underwent thorough validation in line with ICH guidelines, showcasing their robustness, precision, accuracy, and specificity. The findings confirm that these approaches are reliable for the regular examination of Cefprozil in pharmaceutical formulations. By offering validated methods for Cefprozil measurement, this study fills a significant void in the literature and encourages compliance with quality control standards, thereby making a substantial contribution to pharmaceutical analytical studies.
FUNDING
Nil
AUTHORS CONTRIBUTIONS
CONFLICT OF INTERESTS
Declared none
REFERENCES
Shyu WC, Gleason CR, Barbhaiya RH. Effects of time of administration and posture on the pharmacokinetics of cefprozil. Clin Pharmacokinet. 1993;25(3):237-42. doi: 10.2165/00003088-199325030-00006, PMID 8222462.
Barriere SL. Review of in vitro activity, pharmacokinetic characteristics safety and clinical efficacy of cefprozil a new oral cephalosporin. Ann Pharmacother. 1993;27(9):1082-9. doi: 10.1177/106002809302700914, PMID 8219444.
Gainer RB. Cefprozil a new cephalosporin: its use in various clinical trials. South Med J. 1995;88(3):338-46. doi: 10.1097/00007611-199503000-00018, PMID 7886533.
Hedrick JA, Sher LD, Schwartz RH, Pierce P. Cefprozil versus high dose amoxicillin/clavulanate in children with acute otitis media. Clin Ther. 2001;23(2):193-204. doi: 10.1016/s0149-2918(01)80002-3, PMID 11293553.
Aronovitz GH. Antimicrobial therapy of acute otitis media: review of treatment recommendations. Clin Ther. 2000;22(1):29-39. doi: 10.1016/s0149-2918(00)87975-8, PMID 10688388.
Peric M, Browne FA, Jacobs MR, Appelbaum PC. Activity of nine oral agents against gram-positive and gram-negative bacteria encountered in community-acquired infections: use of pharmacokinetic/pharmacodynamic breakpoints in the comparative assessment of beta-lactam and macrolide antimicrobial agents. Clin Ther. 2003;25(1):169-77. doi: 10.1016/s0149-2918(03)90021-x, PMID 12637118.
Bhargava S, Lodha R, Kabra SK. Cefprozil: a review. Indian J Pediatr. 2003;70(5):395-400. doi: 10.1007/BF02723613, PMID 12841400.
Wishart DS, Knox C, Guo AC, Shrivastava S, Hassanali M, Stothard P. Cefprozil. Drug Bank. Available from: http://www.drugbank.ca/drugs/DB01150. [Last accessed on 20 May 2025].
O Neil MJ, editor. The merck index: an encyclopedia of chemicals, drugs and BioLogicals. 13th ed. Whitehouse Station NJ: Merck and Company Incorporated; 2001.
Rockville, MD: United States Pharmacopeial convention. 27th revision and the national formulary. 22nd ed (USP 27/NF 22) United States Pharmacopeial Convention; 2004.
Aronovitz G. Treatment of upper and lower respiratory tract infections: clinical trials with cefprozil. Pediatr Infect Dis J. 1998;17(8)Suppl:S83-8. doi: 10.1097/00006454-199808001-00007, PMID 9727656.
Nolen TM. Clinical trials of cefprozil for treatment of skin and skin structure infections: review. Clin Infect Dis. 1992;14 Suppl 2:S255-63. doi: 10.1093/clinids/14.supplement_2.s255, PMID 1617046.
Park TH, Kim JK, Jee JP, Park JS, Kim CK. HPLC method for simultaneous determination of cefprozil diastereomers in human plasma. J Pharm Biomed Anal. 2004;36(1):243-8. doi: 10.1016/j.jpba.2004.06.001, PMID 15351073.
Wiseman LR, Benfield P. A review of its antibacterial activity, pharmacokinetic properties and therapeutic potential drugs evaluation. Cefprozil. 1993;45(2):295-317. doi: 10.2165/00003495-199345020-00008, PMID 7681376.
Jeong SH, Jang JH, Cho HY, Lee YB. Pharmacokinetic comparison with different assays for simultaneous determination of cis-trans-cefprozil diastereomers in human plasma. J Pharm Anal. 2021;11(3):351-63. doi: 10.1016/j.jpha.2020.07.001, PMID 34277123.
CAMAG. Basic equipment for modern thin layer chromatography. Switzerland: CAMAG; 2010-2011. Available from: https://www.maneko.cz/data/katalogy/CAMAG-zakladni-vybaveni-TLC.pdf.
CAMAG. Instrumental thin-layer chromatography. Switzerland: CAMAG; 2010-2011. Available from: https://www.pharmatutor.org/articles/high-performance-thin-layer-chromatography-hptlc-instrumentation-overview.
Patel RB, Patel MR, Batel BG. Experimental aspects and implementation of HPTLC. In: Srivastava M, editor. High-performance thin-layer chromatography (HPTLC). New York: Springer; 2011. p. 41-54. doi: 10.1007/978-3-642-14025-9_3.
Ghantiwala NB, Dedania Z, Dedania R, Patel U. Development and validation of stability stability-indicating high-performance thin-layer chromatographic method for estimation of rifapentine in pharmaceutical formulation. Sep Sci Plus. 2024;7(2). doi: 10.1002/sscp.202300130.
Dedania Z, Dedania R, Patel U. Development and validation of stability indicating high-performance thin-layer chromatographic method for estimation of rifapentine in pharmaceutical formulation. Sep Sci Plus. 2023;7(2)1-12. doi: 10.1002/sscp.202300130.
Huber L. Validation of analytical methods and processes. In: Wachter A, Nash R, editors. Pharmaceutical process validation. New York: CRC Press; 2003. doi: 10.1201/9780203912119.ch15.
Ferenczi Fodor K, Renger B, Vegh Z. The frustrated reviewer recurrent failures in manuscripts describing validation of quantitative TLC/HPTLC procedures for analysis of pharmaceuticals. Journal of Planar Chromatography Modern TLC. 2010;23(3):173-9. doi: 10.1556/JPC.23.2010.3.1.
Validation of analytical procedures: text and methodology International Conference on Harmonisation (ICH). 2005;Q2:R1. Available from: https://database.ich.org/sites/default/files/Q2%28R1%29%20Guideline.pdf.
Shabir GA, John Lough WJ, Arain SA, Bradshaw TK. Evaluation and application of best practice in analytical method validation. J Liq Chromatogr Relat Technol. 2007;30(3):311-33. doi: 10.1080/10826070601084753.
Swartz ME. Chromatography: method validation. In: Wilson ID, Poole C, editors. Handbook of methods and instrumentation in separation science. San Diego: Academic Press; 2009.
Yuwono M, Indrayanto G. Validation of chromatographic methods of analysis. Profiles Drug Subst Excip Relat Methodol. 2005;32:243-59. doi: 10.1016/S0099-5428(05)32009-0, PMID 22469089.
Huber L. Validation of analytical methods and processes. In: Wachter A, Nash R, editors. Pharmaceutical process validation. New York: CRC Press; 2003. doi: 10.1201/9780203912119.ch15.
Huber L. Validation of analytical methods: review and strategy. Lab Compliance Retrieved; 2011. Available from: https://www.labcompliance.com/ebooks/methods/validation-of-analyticalmethods-review-and-strategy.
Rashmin P, Mrunali P, Nitin D, Nidhi D, Bharat P. HPTLC method development and validation: strategy to minimize methodological failures. J Food Drug Anal. 2012;20(4):20.
Singh S, Bakshi M. Guidance on conduct of stress tests to determine inherent stability of drugs. Pharm Technol. 2000;24:1-14.
Alsante KM, Ando A, Brown R, Ensing J, Hatajik TD, Kong W. The role of degradant profiling in active pharmaceutical ingredients and drug products. Adv Drug Deliv Rev. 2007;59(1):29-37. doi: 10.1016/j.addr.2006.10.006, PMID 17187892.