
Int J Curr Pharm Res, Vol 17, Issue 3, 56-61Original Article
A STUDY ON COST EFFECTIVENESS ANALYSIS OF DRUGS USED IN THE TREATMENT OF STROKE AT TERITARY CARE HOSPITAL-A REAL WORLD DATA
SUBASHINI R.1*, KAVIPRIYADHARSHINI V.2, NANDHINIPRIYA S.2, NILOFARNISHA M.2, PREETHA K.2, PUNITHA JINISHA R.2
1Head of Pharmacy Practice, Swamy Vivekanandha College of Pharmacy, Tiruchengode, the Tamil Nadu Dr. M. G. R. Medical University, TamilNadu, India. 2Department of Pharmacy Practice, Swamy Vivekanandha College of Pharmacy, Tiruchengode, the TamilNadu Dr. M. G. R. Medical University, TamilNadu, India
*Corresponding author: Subashini R.; *Email: dr.subashinipharm14@gmail.com
Received: 27 Jan 2025, Revised and Accepted: 16 Mar 2025
ABSTRACT
Objective: This study aims to assess the cost effectiveness of drugs used in stroke treatment within tertiary care hospital, providing evidence-based insights for more efficient resource allocation and better healthcare decision-making.
Methods: The Prospective observational study was conducted from December 2024 to March 2025 to analyse the cost effectiveness and evaluate the quality life including patient-reported outcomes and medical records, quality of life measures, healthcare resource utilisation and direct/indirect costs. Data collection utilized the SS-QOL Questionnaire for QOL assessment. GraphPad Prism was employed for data analysis, utilising paired t-tests and 95% Confidence intervals were calculated.
Results: Direct healthcare expenses include a Medication fee of Rs.1754, transportation fees of Rs.42, food fees of Rs.154.6, consultation fees of Rs.522.2. Indirect costs involve patients and caretakers loss of productivity (LOP) at Rs. 876.2 and Rs.766.7 respectively. Effective cost management in healthcare is crucial.
Conclusion: Ischemic stroke has a profound impact on quality of life, resulting the significant disability, cognitive impairment and emotional distress. In this context, cost effectiveness analysis is crucial to inform healthcare decision making resource allocation. This study has provided the comprehensive cost effectiveness analysis of drugs used in the treatment of stroke.
Keywords: Cost effectiveness analysis, SSQOL, Cost of illness, Stroke, Direct cost, Indirect cost
© 2025 The Authors. Published by Innovare Academic Sciences Pvt Ltd. This is an open access article under the CC BY license (https://creativecommons.org/licenses/by/4.0/)
DOI: https://dx.doi.org/10.22159/ijcpr.2025v17i3.55065 Journal homepage: https://innovareacademics.in/journals/index.php/ijcpr
INTRODUCTION
Strokes, also known as cerebrovascular accidents (CVA) are defined as an acute focal or diffuse brain dysfunction caused by vascular issues and persisting for more than 24 h. This definition encompasses various conditions, including intracerebral haemorrhages, subarachnoid haemorrhages, ischemic strokes, and cerebral venous sinus thrombosis [1, 2].
India accounts for 13.3% of global disability-adjusted life years (DALYs) lost due to stroke. The treatment of stroke is complex and multifaceted, involving the range of pharmacological interventions [3]. Cost–effective analysis is a systematic approach to evaluate the costs and outcomes of different treatment strategies [4]. In the context of stroke treatment, cost-effective analysis can help identify the most cost-effective treatment strategies and improve patient outcomes [5].
The cost of illness study is to identify and measure all the cost of a particular disease, including the direct, indirect, and intangible dimensions. The output, expressed in monetary terms, is an estimate of the total burden of a particular disease to society [6-9].
The Stroke-Specific Quality of Life (SS-QOL) scale is a widely used measure to assess the quality of life of stroke patients. It’s a self-report questionnaire that captures the unique experience and challenges faced by stroke patients, consisting of 49 items grouped into 12 domains, including energy, family roles, language, mobility, mood, personality, self-care, social role, thinking, upper extremity function, vision, and work/productivity [10]. Analysis of cost effectiveness in stroke patient will help optimize resource allocation, reduce unnecessary costs and provide evidence-based decision making.
MATERIALS AND METHODS
Study design and ethical consideration
The present study was a prospective observational study on analysis of cost effectiveness and quality of life in the neurology department was conducted in a tertiary care hospital “Vivekanandha medical care hospital”, Elayampalayam, Tiruchengode, Tamil Nadu, India over six month. The ethical clearance was obtained from the Institutional Ethics Committee with approved Ref. No: SVCP/IEC//2024 from Vivekanandha medical care hospital and after obtaining informed consent from the subjects.
Inclusion criteria
The following criteria were included to the study:
Patients diagnosed with stroke (CVA).
Age above 18 years men and women were included.
Patient who received pharmacological treatment during their hospital stay.
Exclusion criteria
The following criteria were excluded from the study:
Patients with incomplete medical records.
Patients who are unable to provide informed consent may be excluded.
Old cases of stroke admitted for comorbidities.
Sample size
Sample size calculation, based on the calculation, the estimated sample size for this study was 75 participants. This sample size ensures that the margin of error remains 5% for the given confidence level of 95%.
Method of collection of data
On the day of the examination, all participants were taken informed consent. Patient’s case sheets were analyzed for details such as age, gender, diagnosis, and comorbid conditions. Besides, we have also assessed the therapeutic management analysed the cost effectiveness and assessed the quality of life using SS-QOL scale.
Statistical analysis
The data were collected and recorded in a pre-designed proforma and managed using Microsoft Excel worksheet during the final analysis. Data collection utilized the SS-QOL Questionnaire for QOL assessment. GraphPad Prism was employed for data analysis, utilising paired t-tests and 95% Confidence intervals were calculated.
RESULTS
A total number of 63 stroke patients were included in the study
Distribution based on age, gender-wise and marital status
Out of 63 subjects, 33% were female (n=21) and 67 % were male (n=42). The majority of subjects were under the age group of 60–90 years (n=41) constituting 65% followed by age group of 40–59 (n=18) constituting of 29% and least were observed in the age group of 18-39(n=6%) constituting of 6%. Most of the subjects, 89% were married (n=56),`10 % were unmarried (n=6) and 1 % were widow (n=1) (table 1).
Distribution based on body mass index and dietary habits
In our study, stroke is observed in most of subjects with normal BMI 41 (65%) followed by overweight 16 (25%) and least in obese 6 (10%) (table 1). The majority of subjects were following mixed diet 43 (68%) and vegetarian 20 (32%) lesser (table 1).
Table 1: Baseline characteristic distribution of study population
| Baseline character | No. of patients (n) | Percentage (%) | Mean+SD |
| Age | |||
| Young adult (18-39) | 4 | 6% | 35.6±18.68 |
| Adult (40-59) | 18 | 29% | |
| Older adult (60-90) | 41 | 65% | |
| Gender | |||
| Male | 42 | 67% | 31.5 ±14.84 |
| Female | 21 | 33% | |
| Body mass index | |||
| Under weight (Below 18.5) | 0 | 0% | 58.5±18.08 |
| Normal weight (18.5 – 24.9) | 41 | 65% | |
| Overweight (25.0 – 29.9) | 16 | 25% | |
| Obese (30.0 and above) | 6 | 10% | |
| Marital status | |||
| Married | 56 | 89% | 62.3±30.4 |
| Unmarried | 6 | 10% | |
| Widow | 1 | 1% | |
| Alcohol and substance use | |||
| Smokers | 1 | 1.58 | 7±8.68 |
| Alcoholic | 22 | 34.92 | |
| Alcoholic, smokers | 1 | 1.58 | |
| Past Alcoholic, Smokers | 6 | 9.52 | |
| Chronic Alcoholic,Smokers | 5 | 7.93 | |
| Non-Alcoholic and smoker | 28 | 44.44 |
Table 2: Socio demographic distribution of the study population
| Baseline character | NO. of patients (n=63) | Percentage |
| Food habits | ||
| Mixed | 43 | 68% |
| Vegetarian | 20 | 32% |
| Social history | ||
| Tea and Coffee | 36 | 57% |
| No Social History | 27 | 43% |
| Patient reside | ||
| Rural | 48 | 76% |
| Urban | 15 | 24% |
| Co morbidities | ||
| Patients with one co morbidity | 10 | 15% |
| Patients with>1 comorbidity | 53 | 85% |
| Duration of comorbidities | ||
| <1 y | 12 | 19% |
| 2-5 y | 37 | 58% |
| >5 y | 14 | 23% |
| Surgical history | ||
| Yes | 9 | 14% |
| No | 54 | 86% |
| OTC medication | ||
| Yes | 8 | 13% |
| No | 55 | 87% |
| Regular follow up | ||
| Yes | 50 | 79% |
| No | 13 | 21% |
Distribution based on prevalence of alcohol and substance use and social habit history
Majority of the subjects are non-alcoholic and smoker 28 (44.44%) followed by alcoholic 22 (34.92%), Past alcoholic and smoker 6 (9.52%), Chronic alcoholic, smoker 5 (7.93), smoker and alcoholic and smoker 1 (1.58%) (table 1). History of no social habits 27(43%) compared to tea and coffee habit 36 (57%) (table 1).
Distribution based on location of subject reside and routine health checkup
Majority of the subject reside in rural area 48(76%) and followed by urban 15 (24%). Subject adherence to regular checkup 50 (79%) and not adhered13 (21%) (table 2).
Comorbid conditions and duration of comorbid observed in stroke patients
Majorly>1 comorbidity 53(85%) were associated in greater number of stroke patient, followed by patient with single co morbidity 10(15%). About 12 patients (19%) comorbidities lasting less than 1 y, while 37 (58%) reported comorbidities lasting between 2 to 5 y and 14 (23%) reported comorbidities lasting more than 5 y (table 2).
Distribution of data based on surgical history and utilisation of OTC
Majority of the subject were not undergone surgery 54(86%) and were undergone surgery 9(14%). Majority of subjects are not taken OTC medication 55(87%) followed by OTC users 8 (13%) (table 2).
Data evaluation based on financial loss due to their illness and complaints pattern
Out of the patients 63 patients, 45 individuals (71%) experienced a loss of pay, while 18 patients (29%) did not encounter any loss of pay. Majorly 21 (33%) of patients have single complaints (fig. 1), 33 (52%) have dual complaints (fig. 2) and 9 (15%) have triple complaints (fig. 3).
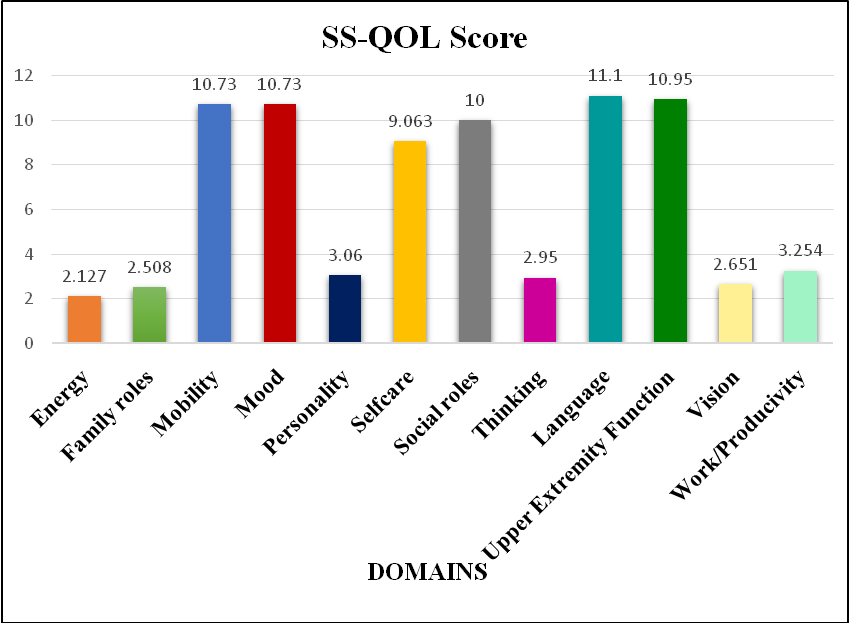
Distribution of data based on SS-QOL score
The data reveals variability across multiple health and functional domains, with scores ranging from energy (2.127±2.871) to mobility and mood (10.73±4.573). Other domains, such as family roles (2.508±2.994), self-care (9.063±5.174), and language (11.10±5.076), show moderate variability (table 3) (fig. 4).
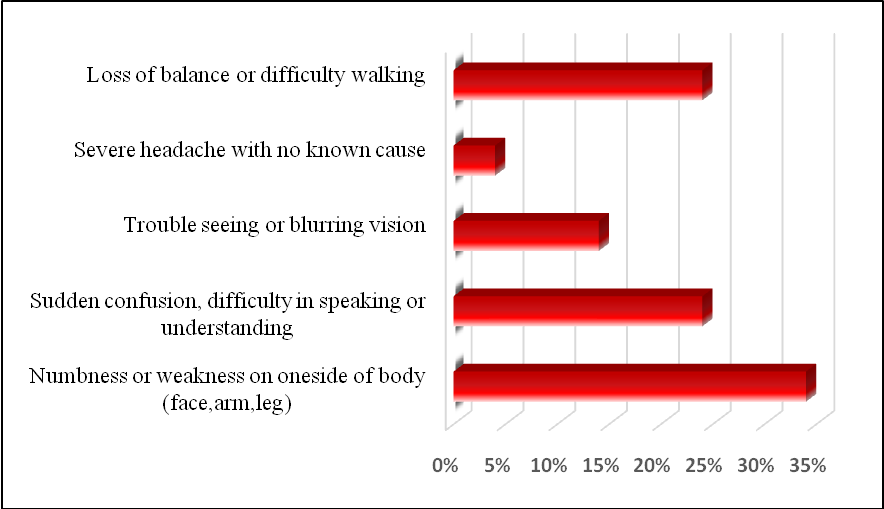
Fig. 1: Assessment of single complaint
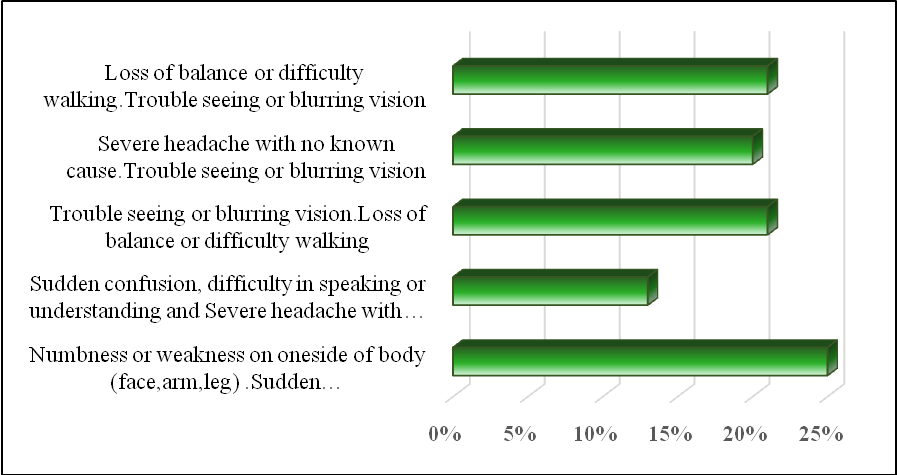
Fig. 2: Assessment of dual complaints
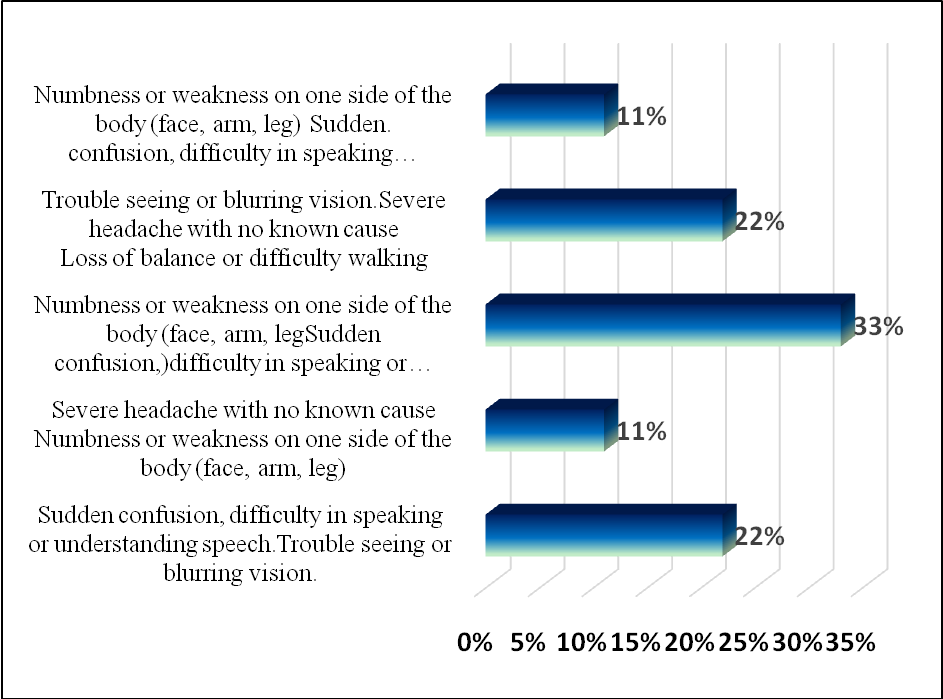
Fig. 3: Assessment of triple complaints
Table 3: Distribution of data based on SS-QOL score
| Domain | Mean±SD | P value |
| Energy | 2.127±2.871 | P=<0.0001 |
| Family Roles | 2.508±2.994 | |
| Mobility | 10.73±4.573 | |
| Mood | 10.73±4.573 | |
| Personality | 3.063±2.978 | |
| Selfcare | 9.063±5.174 | |
| Social roles | 10.00±5.181 | |
| Thinking | 2.952±2.697 | |
| Language | 11.10±5.076 | |
| Upper Extremity function | 10.95±4.637 | |
| Vision | 2.651±2.731 | |
| Work/Productivity | 3.254±2.823 |
Fig, 4: SS-QOL score of the study population
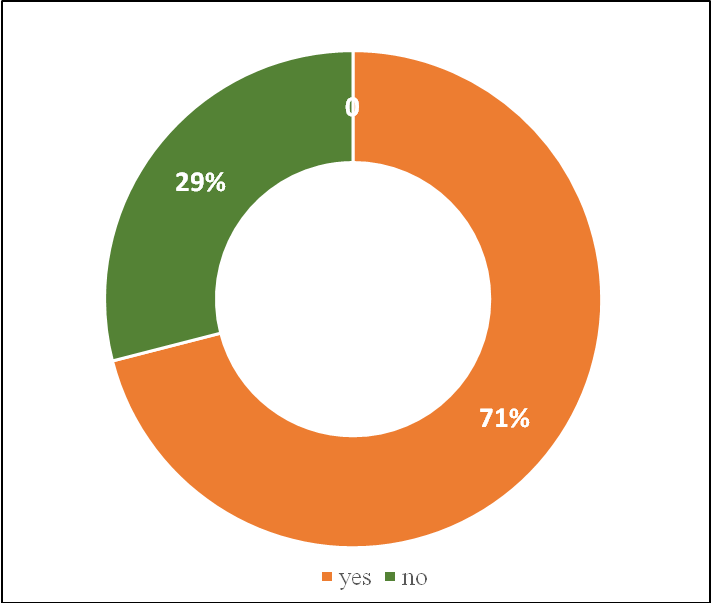
Fig. 5: Data evaluation based on financial loss due to their illness
Data evaluation based on cost of Illness
Majority of cost of illness observed in direct cost: greater cost of illness from medication fee 1784±1553 followed by consultation fee 522.2±133.7, Transportation fee421±227.5 and Food fee 154.6±52.20 and least observed in indirect cost: LOP 876.2±306.9 and followed by LOP CT 766.7±982.2 (table 4) (fig. 5).
Table 4: Data based on cost of illness
| Domain | Mean±SD |
| Direct cost | |
| Medication fee | 1784±1553 |
| Food fee | 154.6±52.20 |
| Transportation fee | 421±227.5 |
| Consultation fee | 522.2±133.7 |
| Indirect cost | |
| Lop | 876.2±306.9 |
| Lop CT | 766.7±982.2 |
DICUSSION
The study revealed that gender distribution a modest male predominance, with 67% of the patients being male and 33% being female. This is in line with earlier research that has found that male patients are frequently more prevalent. The group was 31.5 y old on average, and a sizable percentage (65%) were elderly individuals (60–90 y old). This shows that, perhaps because of the illnesses being studied, the study group may represent a clinical trend in which older patients are seen more frequently. 65% of the patients were categorized as BMI; neither underweight nor obese people were found.
The prevalence of substance usage is high, with 63% of people drinking alcohol and 3% smoking and drinking. Most people also have a history of past or ongoing substance use; 17% are classed as past smokers and drinkers, while 14% are classified as chronic smokers and drinkers. 68% of people ate a mix of mixed and vegetarian diets, according to dietary habits, while 32% ate only vegetarian food, indicating a tendency toward vegetarianism in the population.
They also found that 57% of people drank tea and coffee, whereas 43% did not. These lifestyle choices, which include eating habits and substance abuse, are linked to one another and emphasize the necessity of an all-encompassing risk of stroke.
In this study, the majority of patients were married; 56 out of 63 patients (89%) reported being married. Only 10% of the individuals were unmarried, and 1% were widowed. The high marriage rate among participants may reflect the social dynamics and cultural norms which can also have an impact on their participation in healthcare decisions and general health outcomes.
The patient distribution between rural and urban areas showed that 48 out of 63 patients (76%) lived in rural areas, indicating a predominance of rural populations. According to this, people living in rural areas may not have as much access to medical facilities, specialist care, or health education as people living in cities. Particularly when it comes to managing chronic diseases or comorbidities, these differences in healthcare access may have an impact on the patients' health. Despite being smaller in number (15 patients, 24%), those living in cities may have easier access to healthcare services, which could lead to a different pattern of the management of comorbidities or health outcomes.
85% of participants in the study had various comorbidities, highlighting the complexity of the patient group and the need for coordinated, comprehensive care. On the other hand, 15% had just one comorbidity, indicating that their illnesses were easier to control. Comorbidities varied in length; 58% of patients had them for two to five years, indicating chronic health conditions. 23% of patients had co-morbidities for more than five years, compared to 19% who had them for less than a year. This need continuous care for more complicated, chronic diseases.
54 patients (86%) in this study had no prior surgical history, whereas 9 patients (14%) reported having had surgery in the past. Since a patient's surgical history can affect their recovery and result, this distinction might affect how they react to the present treatment strategy. There were 55 patients (87%) who reported no use of over the counter (OTC) drugs, compared to 8 patients (13%) who reported using them. For clinical evaluations to ensure that patients receive the best therapeutic interventions, it is crucial to keep focus on these factors.
This study evaluated the financial burden of illness and the frequency of medical examinations for 63 participants. 79% of respondents maintained a routine of check-ups, demonstrating a proactive approach to healthcare. 21%, however, did not regularly attend screenings, possibly as a result of time, money, or a lack of health information. 71% of patients lost money as a result of their illness, underscoring the financial cost of medical conditions.
The data presented highlights varying levels of well-being and functionality across different domains, with considerable variability observed within each category. Domains such as mobility, mood, self-care, social roles, and upper extremity function showed relatively higher mean scores, indicating that participants generally experienced better outcomes in these areas. However, the high standard deviations suggest significant individual differences. In contrast, domains like energy, familyroles, thinking, personality, vision, and work/productivity exhibited lower mean scores, pointing to challenges or lower levels of engagement in these areas for some participants. The variability in scores across all domains underscores the complexity of individual health and well-being, influenced by a combination of factors such as physical health, mental well-being, social support, and external circumstances.
Analysis cost of illness
In the analysis of direct and indirect costs associated with the study, several key fig. emerged, providing insight into the financial burden of the given conditions. The direct costs were dominated by the medication fee, with an average cost, reflecting significant variation in individual cases. This high variation could be attributed to factors such as the type of medication prescribed or the duration of treatment.
The food fee and transportation fee were relatively lower but still contributed to the overall financial burden. The consultation fee also showed a moderate cost, likely influenced by the number of consultations required for patient care.
On the indirect cost side, the Lop cost and CT cost. These costs represent additional expenditures that are not immediately visible in direct treatments but are essential to the overall healthcare process. The large standard deviation in both Lop and Lop CT costs suggests significant variability, potentially reflecting differences in the type of medical services or treatments provided to individuals.
These findings highlight the substantial financial burden of healthcare, both in terms of direct treatment costs and the additional indirect costs that may not be immediately considered in budgeting or cost analyses.
CONCLUSION
The study highlights stroke patients' multifaceted challenges, revealing key socio-demographic, lifestyle, and economic factors that influence outcomes. With a predominance of male patients, a high incidence of comorbidities, and significant lifestyle influences like substance use and diet, the findings highlight the necessity for personalized care strategies, especially for older and rural patients with limited access to healthcare. Additionally, the economic burden of stroke is considerable, with both direct costs such as medications and indirect costs like diagnostic tests impacting patients' financial stability. The variability in quality of life across different domains further underscores the importance of addressing both physical and mental health, emphasizing the need for a holistic approach to stroke care that improves access, reduces financial strain, and enhances overall well-being.
LIMITATION
The single-centre nature of the study may limit the generalizability of findings to other healthcare settings.
Additionally, reliance on self-report measures could introduce response biases and the economic analysis might not capture all costs associated with ischemic stroke.
Furthermore, the study may not have fully addressed patient population heterogeneity and cofounding factors such as comorbidities and socioeconomic status may not have been adequately considered, potentially affecting result interpretation.
AUTHORS CONTRIBUTIONS
All authors have contributed equally
CONFLICTS OF INTERESTS
We have no conflicts of interest to disclose.
FUNDING
No external funding
REFERENCE
Warburton E, Alawneh JA, Clatworthy PL, Morris RS. Stroke management. BMJ Clin Evid. 2011 Jun 9;2011:0201. PMID 21658301, PMCID PMC3217648.
Sacco RL, Kasner SE, Broderick JP, Caplan LR, Connors JJ, Culebras A. An updated definition of stroke for the 21st century: a statement for healthcare professionals from the American Heart Association/American Stroke Association. Stroke. 2013 Jul;44(7):2064-89. doi: 10.1161/STR.0b013e318296aeca, PMID 23652265.
Hedau VN, Patil T. Mounting stroke crisis in India: a systematic review. Cureus. 2024 Mar 27;16(3):e57058. doi: 10.7759/cureus.57058, PMID 38681344, PMCID PMC11052531.
Vale L, Thomas R, MacLennan G, Grimshaw J. Systematic review of economic evaluations and cost analyses of guideline implementation strategies. Eur J Health Econ. 2007 Jun;8(2):111-21. doi: 10.1007/s10198-007-0043-8, PMID 17347844.
Saceleanu VM, Toader C, Ples H, Covache Busuioc RA, Costin HP, Bratu BG. Integrative approaches in acute ischemic stroke: from symptom recognition to future innovations. Biomedicines. 2023 Sep 23;11(10):2617. doi: 10.3390/biomedicines11102617, PMID 37892991.
Byford S, Torgerson DJ, Raftery J. Economic note: cost of illness studies. BMJ. 2000 May 13;320(7245):1335. doi: 10.1136/bmj.320.7245.1335, PMID 10807635.
Rai M, Goyal R. Pharmacoeconomics in healthcare. In: Pharmaceutical medicine and translational clinical research. Amsterdam: Elsevier; 2018 Jan 1. p. 465-72. doi: 10.1016/B978-0-12-802103-3.00034-1.
Robinson R. Cost-utility analysis. BMJ. 1993 Oct 2;307(6908):859-62. doi: 10.1136/bmj.307.6908.859, PMID 8401133.
Bang H, Zhao H. Cost effectiveness analysis: a proposal of new reporting standards in statistical analysis. J Biopharm Stat. 2014 Mar 4;24(2):443-60. doi: 10.1080/10543406.2013.860157, PMID 24605979.
Legris N, Devilliers H, Daumas A, Carnet D, Charpy JP, Bastable P. French validation of the stroke specific quality of life scale (SS-QOL). Neuro Rehabilitation. 2018 Jan 30;42(1):17-27. doi: 10.3233/NRE-172178, PMID 29400672.