
Int J Curr Pharm Res, Vol 17, Issue 5, 133-138Original Article
IS TYPE 2 DIABETES MELLITUS AN INFLAMMATORY CONDITION? EXPLORING THE LINKS BETWEEN INTERLEUKIN-6, A PRO-INFLAMMATORY CYTOKINE, GLYCEMIC INDICES AND ADIPOSITY IN TYPE 2 DIABETES MELLITUS
MEGHNA BORAH1*, ANJU B. TELI2, RAHUL DUBEY3, KALPAJIT DUTTA4, RAJIB K. BORA5, DEBABANI BORA6
1Department of Biochemistry, Tinsukia Medical College and Hospital, Assam, India. 2Department of Biochemistry, Jorhat Medical College and Hospital, Assam, India. 3Department of Biochemistry, Soban Singh Jeena Government Institute of Medical Science and Research, Almora, Uttarakhand, India. 4Multidisciplinary Research Unit, Jorhat Medical College and Hospital, Assam, India. 5Department of Medicine, Dhubri Medical College and Hospital, Assam, India. 6Department of Anatomy, Jorhat Medical College and Hospital, Assam, India
*Corresponding author: Meghna Borah; *Email: drmeghnab@gmail.com
Received: 11 Jun 2025, Revised and Accepted: 01 Aug 2025
ABSTRACT
Objective: The primary objective of our study was to evaluate the levels of inflammatory cytokine Interleukin-6 (IL-6) in diabetic patients and compare the levels with age and gender matched healthy controls. The secondary objective was to assess the correlation, if any, of IL-6 with glycemic indices and anthropometric markers of obesity.
Methods: In this cross-sectional study, IL-6 levels were measured in 110 patients with T2DM and compared with an equal number of age-and gender-matched healthy controls. Correlations between interleukin-6 levels and glycemic markers and anthropometric measurements were assessed.
Results: Interleukin-6 levels were significantly elevated in diabetic patients, with a sixfold increase compared to healthy controls. In the diabetic group, the mean IL-6 levels were found to be 12.24±4.18 pg/ml as compared to 2.01±0.82 mg/dl in healthy controls. The elevation was more pronounced in obese patients (seven-fold increase) with a mean value 13.8±4.5 pg/ml, compared to their non-obese counterparts (five. five-fold increase) with a mean value of 11.1±3.8 pg/ml. A moderate positive correlation was observed between IL-6 and BMI (r = 0.31), and a stronger positive correlation was found between IL-6 and HbA1c (r = 0.70).
Conclusion: Our findings confirm that IL-6 is significantly elevated in T2DM patients, with higher levels observed in those with obesity. These results support the hypothesis that inflammation plays a crucial role in the pathogenesis of T2DM, particularly in the context of obesity, and emphasize the potential of targeting inflammatory pathways as a therapeutic strategy.
Keywords: Diabetes mellitus, Obesity, Inflammation, Interleukin-6, Inflammation mediated insulin resistance
© 2025 The Authors. Published by Innovare Academic Sciences Pvt Ltd. This is an open access article under the CC BY license (https://creativecommons.org/licenses/by/4.0/)
DOI: https://dx.doi.org/10.22159/ijcpr.2025v17i5.7079 Journal homepage: https://innovareacademics.in/journals/index.php/ijcpr
INTRODUCTION
Persistent hyperglycemia is a hallmark of diabetes mellitus (DM), a chronic, diverse metabolic disease caused by either decreased insulin action or secretion, or both. Even though it has been known since ancient times, a thorough understanding of its pathophysiology remains extremely difficult due to its complex character. Insidiously developing, type 2 diabetes mellitus (T2DM) is characterized by a growing mismatch between insulin availability and insulin sensitivity. Genetic, environmental, and lifestyle variables interact in a complicated way to cause the underlying insulin resistance [1]. Atherosclerosis and obesity are two metabolic disorders that are not typically thought of as immune-mediated, but recent research has shown that persistent, low-grade inflammation plays a part in their pathogenesis.
Although inflammatory markers have long been used to gauge the severity of T2DM, new research indicates that inflammatory mediators may have a more direct role in the development of insulin resistance and β-cell dysfunction [2]. Central obesity, hyperinsulinemia, and significant insulin resistance are often linked to type 2 diabetes [3, 4]. Significant alterations in the composition and function of adipose tissue accompany adipocyte enlargement in the context of obesity. These include the production of pro-inflammatory cytokines, including interleukin-6 (IL-6) and tumour necrosis factor-alpha (TNF-α), as well as enhanced macrophage infiltration, which is probably involved in the removal of senescent adipocytes [5]. It is thought that these cytokines play a part in the systemic metabolic abnormalities seen in obesity and type 2 diabetes, with TNF-α being especially important in causing insulin resistance [6, 7].
The gradual β-cell failure and peripheral insulin resistance that define type 2 diabetes are characterized by immunological processes, according to a growing body of evidence [2]. IL-6, a pleiotropic cytokine, plays a critical role in both immune regulation and various metabolic processes across a wide range of tissues [8]. The dual role of IL-6 has been investigated in a number of epidemiological, genetic, animal, and in vitro investigations, which have connected it to both protective and pathogenic pathways associated with obesity, insulin resistance, β-cell dysfunction, and the onset of type 1 and type 2 diabetes.
The development of type 2 diabetes is significantly influenced by the multifunctional cytokine IL-6. It accomplishes this by enhancing insulin sensitivity, controlling blood glucose levels, and stimulating insulin production. A hallmark of type 2 diabetes, increasing insulin resistance is frequently linked to elevated levels of IL-6, which are caused by an increase in insulin-driven glucose clearance brought on by AMP-activated protein kinase activation. It has been shown that giving healthy people IL-6 infusions at a rate of 5 μg per hour improves insulin's capacity to effectively remove glucose [9].
Accordingly, the present study was undertaken to evaluate the association between IL-6 levels and key markers of diabetes mellitus, as well as anthropometric parameters, in order to further clarify the cytokine's role in the pathophysiology of T2DM.
MATERIALS AND METHODS
Study design
With the proper consent from the Institutional Ethics Committee, this study was carried out as a cross-sectional observational study at Jorhat Medical College and Hospital in Assam over the course of a year, from July 2023 to June 2024. Written informed consent was obtained from all participants before their inclusion in the study.
The following were the inclusion and exclusion criteria of our study. Inclusion criteria for cases (T2DM Patients) are patients who had been diagnosed with Type 2 Diabetes Mellitus (T2DM) according to ADA criteria, aged between 30 and 70 y. Only those patients were included whose duration of diabetes was at least 1 y and who were willing and able to provide informed consent. Inclusion criteria for controls (Non-diabetic Individuals) were age and gender matched individuals aged between 30 and 70 y. Only those patients were accepted as controls whose fasting plasma glucose was less than 100 mg/dl and HbA1c less than 5.7%. This enabled exclusion of individuals with diabetes or prediabetes. History of the control group was taken carefully to ensure that there was no history of diabetes or impaired glucose tolerance. All individuals in the control group were willing and able to provide informed consent.
All individuals were excluded as cases or controls if they had type 1 diabetes mellitus or gestational diabetes. As the study focused on the inflammatory aspect of T2DM, all individuals with presence of acute or chronic infections or inflammatory conditions (e. g., rheumatoid arthritis, lupus) were excluded. Chronic kidney disease (eGFR<60 ml/min/1.73m²) or liver disease patients were excluded as well to prevent confounding factors interfering with the study results. To prevent false elevations of IL-6, individuals with history of malignancy, autoimmune disease, or recent surgery/trauma (<3 mo) were excluded as study subjects. Use of drugs that might interfere with the study results like anti-inflammatory drugs, immunosuppressants, or corticosteroids in the past month were also included. Pregnant and lactating women were also excluded from the study.
Sample size estimation and sampling method
Every participant had clinical tests and interviews, and anthropometric measurements like height, weight, and waist circumference were taken. The World Health Organization's (WHO) recommendations were followed for all measurements, and quality control procedures were upheld during the data gathering process [10]. The sample size was calculated as 110 in each group (Cases and control) using Epi Info software with a 95% confidence interval, ±5% margin of error, and a prevalence of 17.32% [11]. Both cases and controls were recruited through purposive sampling, adhering to the specified inclusion and exclusion criteria. Participants wore light clothing while all measurements were taken.
Anthropometric measurements
Weight was measured using a mechanical weighing scale (kg), accurate to the nearest 0.5 kg, with the scale placed on a firm, flat surface. Participants were weighed without shoes. Height was measured with a measuring tape against a flat vertical surface, recorded in centimeters (cm), accurate to the nearest 0.1 cm. Waist Circumference was measured at the midpoint between the coastal margin and iliac crest, using a measuring tape and recorded in centimeters to the nearest 0.1 cm. Body Mass Index (BMI) was calculated as BMI = weight (kg)/height (m²).
Criteria for defining obesity
General obesity was stratified into two groups. Individuals were classified as overweight if the BMI exceeded 25 kg/m² and obese if the BMI was greater than 30 kg/m²[12]. Truncal obesity was defined as a waist-to-stature ratio (WSR) ≥ 0.90 for males and ≥ 0.85 for females [13]. Individuals were classified as having central obesity if the Waist Circumference exceeded 90 cm for males and 80 cm for females [13].
Biochemical analysis
Following all standard aseptic precautions, venous blood samples were collected for the estimation of fasting blood glucose (FBG), postprandial blood glucose (PPBG), glycated hemoglobin (HbA1c), and interleukin-6 (IL-6). FBG and PPBG levels were measured using the glucose oxidase-peroxidase method on the Vitros 5600 autoanalyzer (Ortho Clinical Diagnostics, USA). HbA1c was analyzed via cation-exchange high-performance liquid chromatography (HPLC) using the D-10 Hemoglobin Testing System (Bio-Rad Laboratories, USA). IL-6 levels were determined using a sandwich enzyme-linked immunosorbent assay (ELISA) method according to the manufacturer’s protocol.
Statistical analysis
Microsoft Excel (Office 2019, Microsoft Corporation, Redmond, Washington, USA) was used to create the database, and GraphPad Prism version 9.00 (GraphPad Software, Inc., California, USA) was used for statistical analysis. Nominal variables are expressed as percentages and the number of cases, while continuous variables are presented as mean±standard deviation. The association between IL-6 levels and other glycemic indicators (FBG, PPBG, HbA1c%) and anthropometric parameters (BMI, waist circumference) was evaluated using Pearson's correlation coefficient. A p-value<0.01 indicated high statistical significance, while a two-tailed p-value<0.05 was deemed statistically significant.
RESULTS
Following the application of all inclusion and exclusion criteria, the study included 110 patients with Type 2 Diabetes Mellitus (T2DM) and 110 healthy controls of the same age and gender. Diabetic cases were 70 males (63.64%) and 40 females (36.36%), with ages ranging from 32 to 69 y and a mean age of 48.12±10.4 y.
Of the diabetic group, 48.2% (n = 53) had a body mass index (BMI) ≥ 25 kg/m², compared to 21.8% (n = 24) in the control group. This difference was statistically significant (p<0.05), with the strongest association observed among individuals with BMI ≥ 30 kg/m². Central obesity, as indicated by waist circumference, was present in 42.7% (n = 47) of diabetic patients compared to 14.5% (n = 16) of controls (p<0.05). Table 1 shows the anthropometric measurements in Diabetic group and control group.
Table 1: Anthropometric indices in diabetic group and control group
| Parameter | Diabetic group (n = 110) number (Percentage) | Control group (n = 110) number (Percentage) | Chi-square (χ²) value | p-value |
| BMI ≥ 25 kg/m² | 53 (48.2%) | 24 (21.8%) | 16.81 | 0.000041 |
| Central Obesity (WC criteria) | 47 (42.7%) | 16 (14.5%) | 21.38 | 0.000004 |
Abbreviation: BMI: Body mass index; WC: waist circumference
T2DM patients showed significantly elevated glycemic indices. The FBG, PPBG and HbA1c% in the cases were 249.6+64.1 mg/dl, 334.2+75.8 mg/dl and 10.08+2.31 % as compared to 81.2+11.3 mg/dl, 96.4+17.9 mg/dl and 5.41+0.46% in controls. Table 2 shows the fasting blood glucose, postprandial blood glucose and glycated hemoglobin levels in the diabetic and control groups.
Table 2: Glycemic Indices in diabetic group and control group
| Parameter | Diabetic group (n = 110) | Control group (n = 110) | p-value |
| Fasting Blood Glucose (FBG) | 249.6±64.1 mg/dl | 81.2±11.3 mg/dl | <0.0001 |
| Post-Prandial Blood Glucose (PPBG) | 334.2±75.8 mg/dl | 96.4±17.9 mg/dl | <0.0001 |
| HbA1c (%) | 10.08±2.31% | 5.41±0.46% | <0.0001 |
As evident from our study, IL-6 levels were negligible in healthy controls (2+0.8 pg/ml) as compared to diabetic patients (12.12+4.18 pg/ml). There was a sixfold increase in IL-6 levels in diabetics as compared to healthy controls. The IL-6 levels in the obese diabetic group was found to be 13.8±4.5 pg/ml and 11.1±3.8 pg/ml in the non-obese diabetic group. The augmentation in IL-6 levels was greater in obese patients (7 folds) than in non-obese patients (5.5 folds) as compared to normal healthy individuals. Table 3 shows the interleukin levels in healthy controls, Diabetic group (both obese and non-obese) as well as the fold changes of IL-6 in these groups as compared to the healthy controls.
Table 3: Interleukin 6 levels in healthy controls, obese diabetics and non-obese diabetics
| Group | IL-6 level (pg/ml) | Fold increase vs. control | p-value |
| Healthy Controls (n = 110) | 2.01±0.82 | – | – |
| Diabetic Group | 12.24±4.18 | ~6-fold | <0.0001 |
| Diabetic – Obese | 13.8±4.5 | ~7-fold | <0.0001 |
| Diabetic–Non-obese | 11.1±3.8 | ~5.5-fold | <0.0001 |
Abbreviation: IL-6: Interleukin-6

Fig. 1: Shows the levels of IL-6 in the control group and the diabetic group. The levels of IL-6 has been shown both in the obese as well as non-obese diabetic group
Abbreviation: IL-6: Interleukin-6
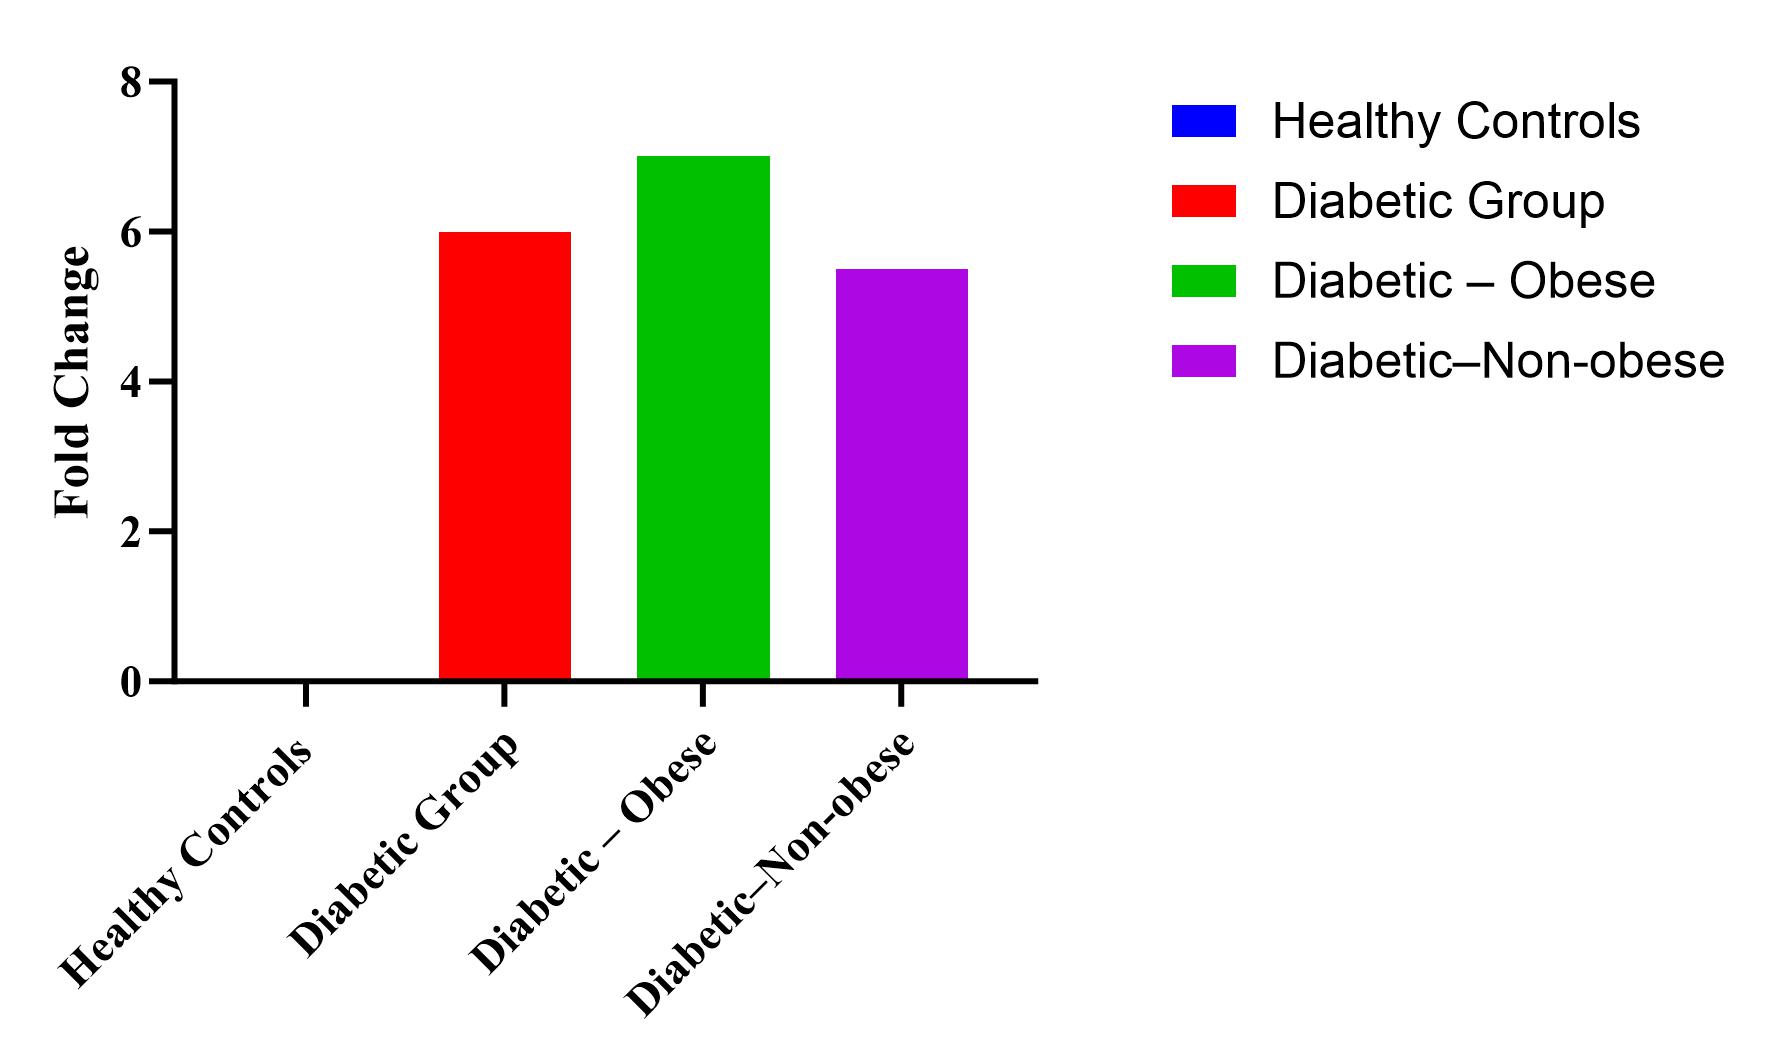
Fig. 2: Shows the fold increase in the diabetic group (both obese and non-obese) as compared to the healthy control
Table 4: Statistical summary table comparing glycemic indices, Interleukin-6, waist circumference and BMI among cases and controls
| Parameter | Cases (n=110) (Mean±SD) | Controls (n=110) (Mean±SD) | 95% CI (Cases) | 95% CI (Controls) | p-value |
| FBG (mg/dl) | 249.6±64.1 | 81.2±11.3 | 230.3–265.1 | 76.4–85.2 | <0.0001 |
| PPBG (mg/dl) | 334.2±75.8 | 96.4±17.9 | 305.2–351.7 | 91.5–100.1 | <0.0001 |
| HbA1c (%) | 10.08±2.31 | 5.41±0.46 | 9.17–10.52 | 5.14–5.57 | <0.0001 |
| IL-6 (pg/ml) | 12.24±4.18 | 2.01±0.82 | 11.02–13.17 | 1.82–2.22 | <0.0001 |
| WC (cm) | 86.2±8.6 | 77.4±5.1 | 83.9–88.1 | 76.1–79.2 | <0.05 |
| BMI (kg/m²) | 24.8±3.2 | 21.7±2.5 | 23.7–25.6 | 20.9–22.3 | <0.0001 |
Abbreviations: SD – standard deviation; CI – confidence interval; WC – waist circumference; BMI – body mass index; FBG: Fasting blood glucose; PPBG: post prandial blood glucose; HbA1c: Glycated hemoglobin; IL-6: Interleukin-6
Table 4 shows the comparison of FBG, PPBG, HbA1c, IL-6, waist circumference and BMI among the cases and controls. All glycemic indices, fasting and post prandial blood glucose and glycated hemoglobin show statistically highly significant elevation in the diabetic group as compared to the healthy controls. Statistically highly significant elevation is also seen in the Body Mass Index of the diabetic group as compared to the healthy controls. The waist circumference in the diabetic group was also elevated and this elevation was also statistically significant.
Pearson correlation analysis in the diabetic group revealed a moderate positive correlation between Interleukin-6 and Body Mass Index. A statistically stronger positive correlation was found between Interleukin-6 and glycated hemoglobin. A moderate positive correlation was found between IL-6 and BMI (r = 0.31). Stronger positive correlation (r = 0.70) was found between IL-6 and HbA1c%. Fig. 3 shows the correlation between IL-6 and BMI, which shows a moderate positive correlation of 0.31.
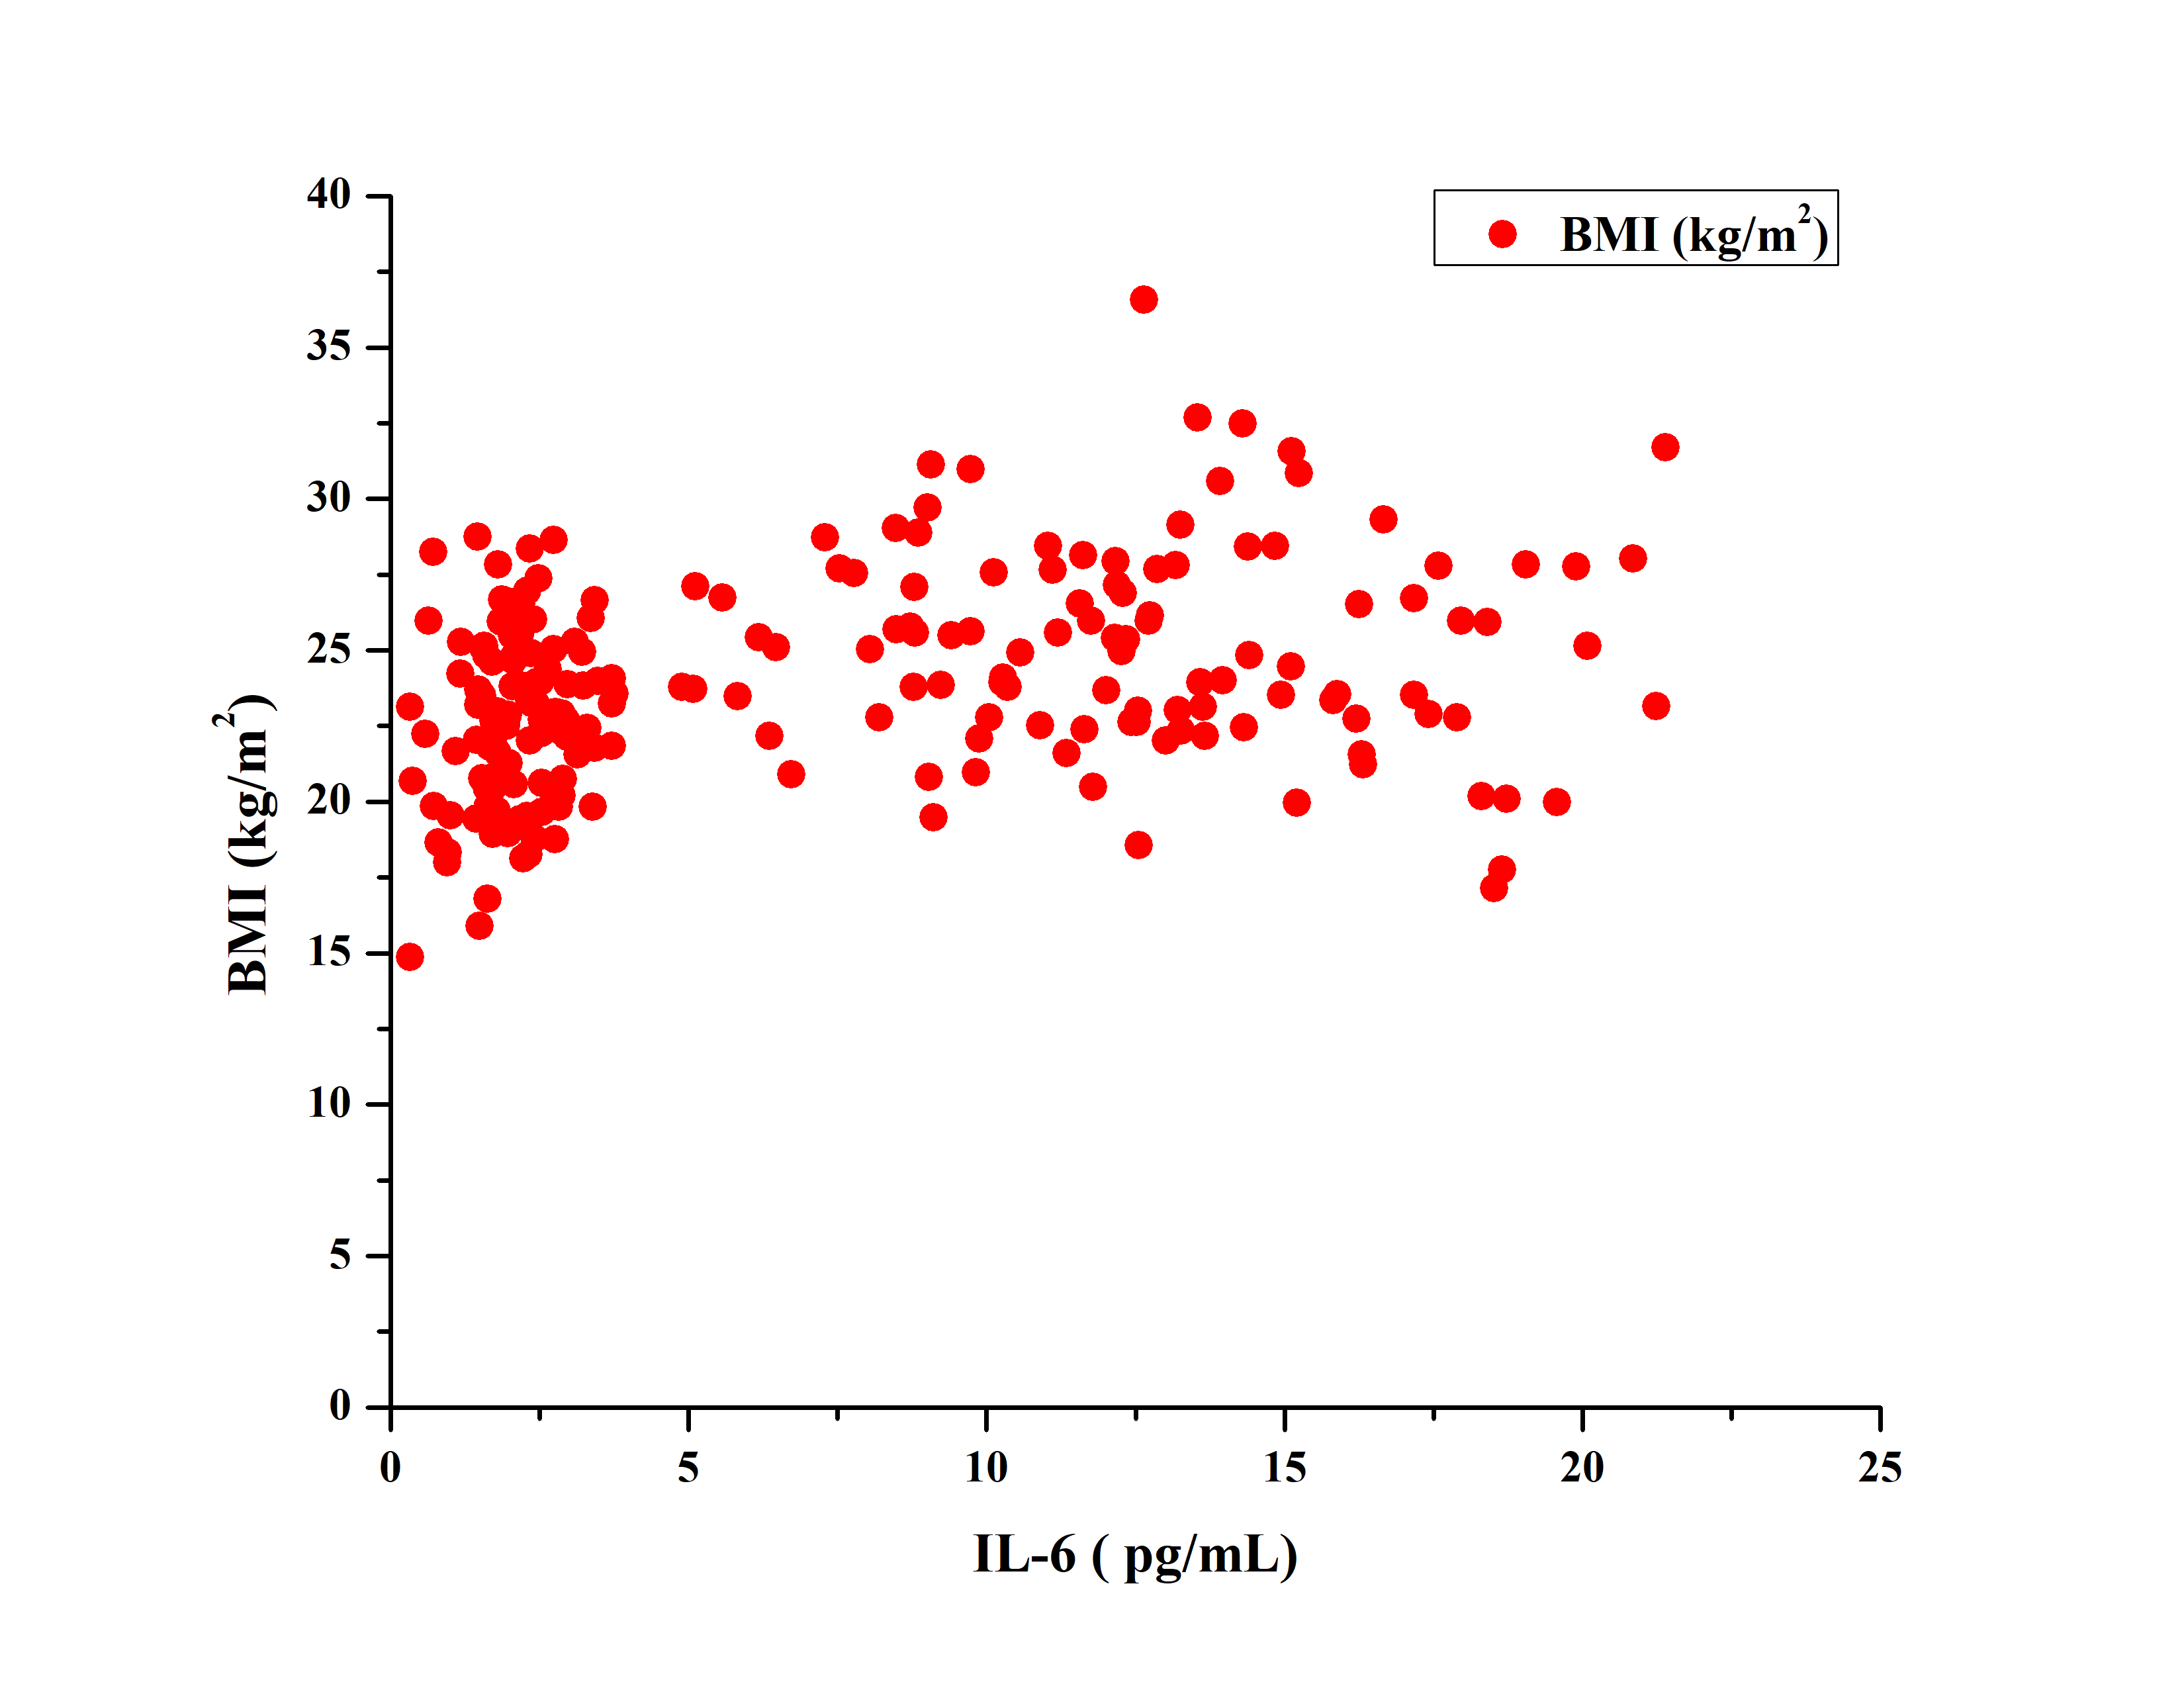
Fig. 3: Showing the correlation between IL-6 and BMI which showed a moderate positive correlation (r = 0.31), IL-6: Interleukin-6, BMI: body mass index
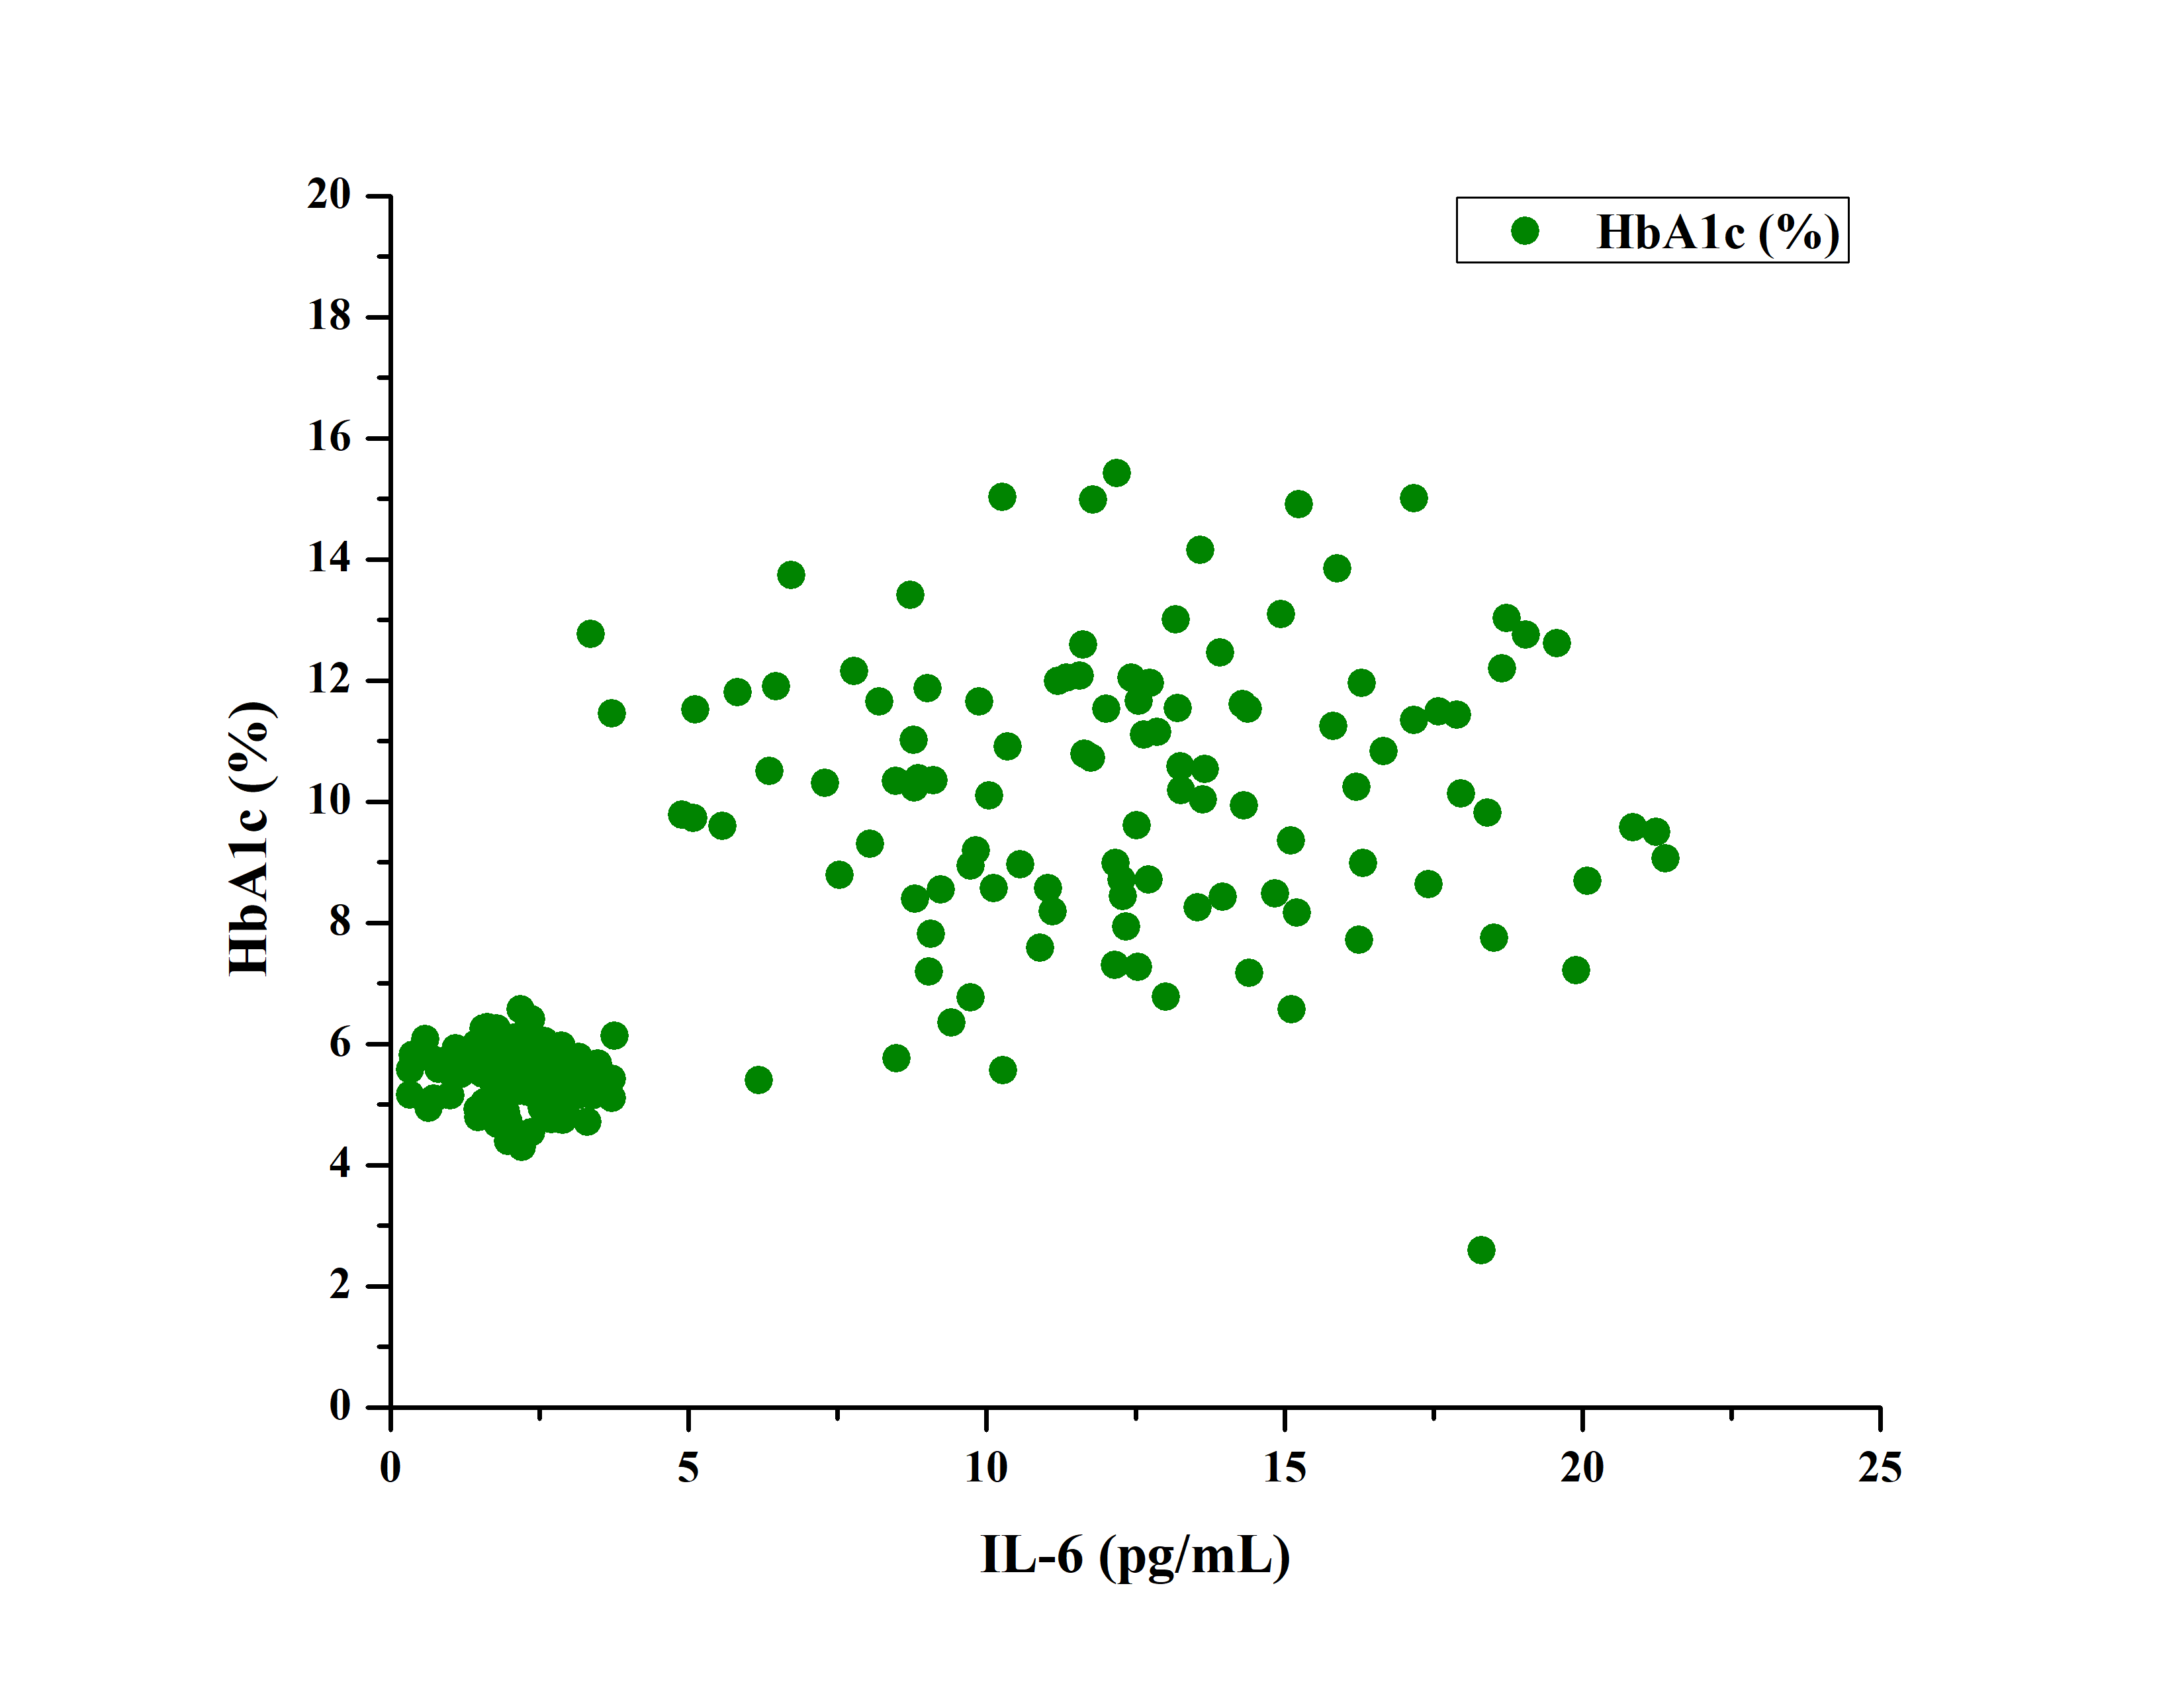
Fig. 4: Showing the correlation between IL-6 and HbA1c% which showed a strong positive correlation (r = 0.70), Abbreviations: IL-6: Interleukin-6, HbA1c: Glycated hemoglobin
DISCUSSION
Although the existence of Diabetes Mellitus has known since 1550 BC, the remarkable resurgence of cases in the last few decades has proven that, much has yet to be uncovered regarding the pathogenesis and treatment of this ancient disease. The present study was an attempt to explore the hypothesis that type 2 Diabetes Mellitus is a low-grade inflammatory condition. As such, interleukin (IL-6) levels were measured in type 2 Diabetic patients and the correlation of its levels was calculated with markers of glycaemic index as well as with markers of obesity.
Our study included 110 patients with Type 2 Diabetes Mellitus (T2DM) and 110 healthy controls. Diabetic cases were 70 males (63.64%) and 40 females (36.36%), showing male predominance (63.64%), which is consistent with research by Khalid A et al. and Shah SK et al. [14, 15].
The findings of our current study indicate that the case group, consisting of diabetic patients, had a mean HbA1c(%) level of 10.08±2.31. The control group was observed to have a lower average HbA1c concentration with a mean value of 5.41±0.46. The statistical study demonstrated a noteworthy association between HbA1c levels and the presence of T2DM, with a p value of 0.0001. Similarly, FBG and PPBG in diabetic patients were also found to be considerably higher than controls, which are in consistent with findings from Krhač M et al. [16].
Diabetics had a considerably greater prevalence of obesity (as measured by BMI and waist circumference), supporting the findings of Qureshi SS et al. [17]. The link between obesity and diabetes has long been recognized, with Hippocrates being among the first to identify obesity as a disease in its own right. Hippocrates, a classical Greek physician and philosopher is considered to have the foremost and most outstanding contributions in the field of medicine. It was he who deduced that obesity, rather than being a cosmetic problem is a medical disorder with many associated co-morbidities, principal among which is Diabetes Mellitus. It was he who had inscribed that “Corpulence is not only a disease itself, but the harbinger of others.”
A mean IL-6 level of 12.24±4.18 pg/ml was observed in our study in the diabetic group. These values were significantly higher than the control group's mean IL-6 level of 2.01±0.82 pg/ml, with a statistically significant correlation (p =0.001). Importantly, IL-6 levels were significantly elevated in diabetic patients, particularly those with obesity, supporting the idea that T2DM is an inflammatory condition. A meta-analysis conducted recently of 15 prospective studies investigated associations between IL-6 levels and incident T2DM this meta-analysis included 5,421 cases and 31,562 non-cases of type 2 Diabetes Mellitus the results of the meta-analysis found that higher levels of IL-6 (per log pg/ml) were significantly associated with a higher risk of incident T2DM [18]. This led to a hypothesis that, IL-6 which is a key player in chronic inflammation, also plays a role in the pathophysiology of type 2 diabetes (T2D). This hypothesis was largely on the basis of experimental evidence from animal models. In agreement with this hypothesis, observational epidemiology studies also found that elevated IL-6 levels are associated with obesity, insulin resistance and type 2 diabetes risk [18].
Our study further reinforces the positive correlation between IL-6 and both BMI and HbA1c%. Baikpour et al. reported similar associations between pro-inflammatory cytokines and increased BMI in overweight and obese individuals [19]. Obesity-related chronic inflammation, or "meta-inflammation," is characterized by hypoxia-induced adipocyte death and increased production of adipocytokines and pro-inflammatory mediators, contributing to systemic insulin resistance [20-22]. A number of adipocytokines family members are produced by macrophages and adipocytes. In obese individuals, adipocyte tissue expansion is believed to cause adipocyte hypoxia causing death of adipocytes. This hypoxia of the adipocytes is hypothesized to actively participate in the development of inflammation induced by obesity. Increased adipocytokine production and promotion of the expression of proinflammatory genes is credited to contribute towards inflammation [20, 21]. In obesity, the chronic inflammation which is found is characterized by a reduced metabolic rate. In direct contrast, the inflammation found in non-sterile conditions is rather associated with an increased rate of metabolism. The state of metabolic induced sterile inflammation is defined as “meta-inflammation.” Progressive insulin resistance is the central pathophysiologic effect of meta-inflammation [22].
IL-6’s correlation with HbA1c suggests a link between chronic inflammation and poor glycemic control. Qe H et al. and Sekhri et al. reported similar findings, although some variability was noted in poorly controlled diabetics, where the correlation could become inverse [23, 24].
Novelty of the study
Although interleukin-6 (IL-6) has been recognized as a key pro-inflammatory cytokine involved in the pathophysiology of type 2 diabetes mellitus (T2DM), its concurrent association with glycemic indices and anthropometric parameters remains insufficiently explored. This study offers a novel perspective by simultaneously evaluating the relationship between circulating IL-6 levels, markers of glycemic control (including fasting and post-prandial plasma glucose and HbA1c%), and anthropometric measurements (such as body mass index and waist circumference) within a single diabetic cohort.
The uniqueness of this research lies in its integrated approach, bridging metabolic and inflammatory dimensions of T2DM to assess whether IL-6 can serve as a composite marker reflecting both glycemic dysregulation and obesity-related risk. Furthermore, the study contributes region-specific data, addressing a critical gap in population-level inflammatory profiling in diabetes in North-East India. These insights may aid in the stratification of patients based on inflammatory burden and inform future interventions targeting metabolic inflammation in T2DM.
Limitations of the study
However, several limitations must be acknowledged. First, the cross-sectional design precludes causal inference, limiting the ability to determine whether elevated IL-6 levels are a cause or consequence of poor glycemic control and increased adiposity. Second, the study's sample size may constrain the generalizability of findings, particularly across diverse age groups, genders, and ethnicities. Third, potential confounding factors such as concurrent infections, undiagnosed inflammatory conditions, medication use (e. g., statins or anti-inflammatory agents), and lifestyle variables (diet, physical activity) were not fully controlled, which could influence IL-6 levels. Lastly, single-point measurement of IL-6 may not reflect its variability over time, underscoring the need for longitudinal studies to validate these associations.
Despite these limitations, the study offers an important foundation for future research exploring the mechanistic and clinical relevance of IL-6 in T2DM.
CONCLUSION
Our findings confirm that Interleukin-6 is significantly elevated in type 2 diabetes mellitus patients, with higher levels observed in those with obesity. Type 2 diabetics usually exhibit a characteristic metabolic profile, with a greater degree of central obesity. Enlarged adipocytes gradually become hypoxic and express a greater amount of pro-inflammatory cytokines like IL-6. Our study observed that diabetics with a higher body mass index and waist circumference exhibited greater IL-6 levels. These results support the hypothesis that inflammation plays a crucial role in the pathogenesis of T2DM, particularly in the context of obesity. Due to this, Interleukin-6 can be earmarked as a potential biomarker for progression of Type 2 Diabetes Mellitus. Additionally, it provides additional supportive evidence that better glycemic control can be achieved by weight loss, specifically targeting improved BMI and waist circumference in obese type 2 diabetic patients. Our study also emphasizes the potential of targeting inflammatory pathways as a therapeutic strategy. In summary, it must be borne in mind that type 2 diabetes mellitus is a complex multifactorial disease, with inflammation playing a key role. Only holistic treatment methods, focusing on all aspects of the disease including targeting inflammatory pathways can halt the progression of this disease, and prevent the development of complications.
FUNDING
Nil
AUTHORS CONTRIBUTIONS
All authors have contributed equally
CONFLICT OF INTERESTS
Declared none
REFERENCES
Murea M, Ma L, Freedman BI. Genetic and environmental factors associated with type 2 diabetes and diabetic vascular complications. Rev Diabet Stud. 2012;9(1):6-22. doi: 10.1900/RDS.2012.9.6, PMID 22972441.
Kolb H, Mandrup Poulsen T. An immune origin of type 2 diabetes? Diabetologia. 2005;48(6):1038-50. doi: 10.1007/s00125-005-1764-9, PMID 15864529.
Pickup JC. Inflammation and activated innate immunity in the pathogenesis of type 2 diabetes. Diabetes Care. 2004;27(3):813-23. doi: 10.2337/diacare.27.3.813, PMID 14988310.
Reaven GM. Banting lecture 1988. Role of insulin resistance in human disease. Diabetes. 1988;37(12):1595-607. doi: 10.2337/diab.37.12.1595, PMID 3056758.
Unnikrishnan R, Anjana RM, Mohan V. Diabetes in South Asians: is the phenotype different? Diabetes. 2014;63(1):53-5. doi: 10.2337/db13-1592, PMID 24357697.
Cinti S, Mitchell G, Barbatelli G, Murano I, Ceresi E, Faloia E. Adipocyte death defines macrophage localization and function in adipose tissue of obese mice and humans. J Lipid Res. 2005;46(11):2347-55. doi: 10.1194/jlr.M500294-JLR200, PMID 16150820.
Hotamisligil GS, Shargill NS, Spiegelman BM. Adipose expression of tumor necrosis factor alpha: direct role in obesity linked insulin resistance. Science. 1993;259(5091):87-91. doi: 10.1126/science.7678183, PMID 7678183.
Hotamisligil GS, Spiegelman BM. Tumor necrosis factor alpha: a key component of the obesity diabetes link. Diabetes. 1994;43(11):1271-8. doi: 10.2337/diab.43.11.1271, PMID 7926300.
Kamimura D, Ishihara K, Hirano T. IL-6 signal transduction and its physiological roles: the signal orchestration model. Rev Physiol Biochem Pharmacol. 2003;149:1-38. doi: 10.1007/s10254-003-0012-2, PMID 12687404.
Step wise approach to surveillance (steps)-guide to physical measurements. World Health Organization. Available from: https://cdn.who.int/media/docs/default-source/ncds/ncd-surveillance/steps/part3-section5.pdf?sfvrsn=a46653c7_2. [Last accessed on 27 Aug 2025].
Pourhoseingholi MA, Vahedi M, Rahimzadeh M. Sample size calculation in medical studies. Gastroenterol Hepatol Bed Bench. 2013;6(1):14-7. PMID 24834239.
WHO Expert Consultation. Appropriate body mass index for Asian populations and its implications for policy and intervention strategies. Lancet. 2004;363(9403):157-63. doi: 10.1016/S0140-6736(03)15268-3, PMID 14726171.
http://whqlibdoc.who.int/publications/2011/9789241501491_eng.pdf.
Alqurashi KA, Aljabri KS, Bokhari SA. Prevalence of diabetes mellitus in a Saudi community. Ann Saudi Med. 2011;31(1):19-23. doi: 10.4103/0256-4947.75773, PMID 21245594.
Shah SK, Saikia M, Burman NN, Snehalatha C, Ramachandran A. High prevalence of type 2 diabetes in urban population in North Eastern India. Int J Diab Dev Ctries. 1999;19:144-7.
Krhac M, Lovrencic MV. Update on biomarkers of glycemic control. World J Diabetes. 2019;10(1):1-15. doi: 10.4239/wjd.v10.i1.1, PMID 30697366.
Qureshi SS, Amer W, Kaleem M, Beg BM. Adult anthropometry in type 2 diabetic population: a case control study. Pak J Med Sci. 2019;35(5):1284-9. doi: 10.12669/pjms.35.5.759, PMID 31488993.
Bowker N, Shah RL, Sharp SJ, Luan J, Stewart ID, Wheeler E. Meta-analysis investigating the role of interleukin-6 mediated inflammation in type 2 diabetes. EBiomedicine. 2020 Nov;61:103062. doi: 10.1016/j.ebiom.2020.103062, PMID 33096487.
Baikpour M, Baikpour M, Hosseini M. Variations in levels of interleukins and adiponectin in normal and obese adults; a case control study. J Med Physiol. 2017;2(2):56-62.
Hosogai N, Fukuhara A, Oshima K, Miyata Y, Tanaka S, Segawa K. Adipose tissue hypoxia in obesity and its impact on adipocytokine dysregulation. Diabetes. 2007;56(4):901-11. doi: 10.2337/db06-0911, PMID 17395738.
Ye J, Gao Z, Yin J, He Q. Hypoxia is a potential risk factor for chronic inflammation and adiponectin reduction in adipose tissue of ob/ob and dietary obese mice. Am J Physiol Endocrinol Metab. 2007;293(4):E1118-28. doi: 10.1152/ajpendo.00435.2007, PMID 17666485.
Gregor MF, Hotamisligil GS. Inflammatory mechanisms in obesity. Annu Rev Immunol. 2011;29:415-45. doi: 10.1146/annurev-immunol-031210-101322, PMID 21219177.
He Q, Dong M, Pan Q, Wang X, Guo L. Correlation between changes in inflammatory cytokines and the combination with hypertension in patients with type 2 diabetes mellitus. Minerva Endocrinol. 2019;44(3):252-8. doi: 10.23736/S0391-1977.18.02822-5, PMID 29687969.
Sekhri A, Kaur S. Correlation between various inflammatory markers serum triglyceride levels and glycosylated hemoglobin in type II diabetes mellitus: a case control study in an Indian tertiary care setting. Int J Pharm Clin Res. 2023;15(8):1099-104.