
Int J Curr Pharm Res, Vol 17, Issue 6, 100-111Original Article
HOSPITAL-BASED STUDY TO ANALYSE PREVALENCE, PRESCRIBING PATTERN AND MANAGEMENT OF ALCOHOL DEPENDENCE SYNDROME
SHRIJAL M. RAO1*, RAHUL P.1, SHAMEEM MUKTHAR1, CHRISTY T. CHACKO2, MITHUN SADASHIVA ACHARYA3, A. R. SHABARAYA4
1,2,4Department of Pharmacy Practice, Srinivas College of Pharmacy, Valachil, Mangaluru-574143, Karnataka, India. 3Department of Psychiatry, Srinivas Institute of Medical Sciences, Mangaluru-574146, Karnataka, India
*Corresponding author: Shrijal M. Rao; *Email: shrijalmrao@gmail.com
Received: 18 Aug 2025, Revised and Accepted: 14 Oct 2025
ABSTRACT
Objective: Alcohol dependence syndrome (ADS) is a chronic, progressive disorder that significantly impacts physical health, mental well-being, family, and social life. This study aimed to evaluate the demographic profile, prescribing trends, and liver function changes in patients with ADS.
Methods: A prospective observational study was conducted over six months at a tertiary care hospital in Mangalore. A total of 100 patients with ADS who fulfilled the inclusion criteria were enrolled. Data on demographics, alcohol consumption, prescribing patterns, and liver function tests (LFTs) were collected and analyzed.
Results: Among 100 participants, 99% were males and 1% was female. The majority (53%) belonged to the 41–50 y age group, followed by 24% in the 31–40 y group. Regarding alcohol consumption, 40% reported intake of 60 g/day, while 32% consumed 81–90 ml/day. Long-term use was common, with 34% consuming alcohol for more than 22 y. The prescribing analysis revealed frequent use of vitamins (92%), benzodiazepines (75%), anti-craving drugs (65%), antipsychotics (55%), antiepileptics (45%), and PPIs (42%). Lorazepam (83%) was the most commonly prescribed benzodiazepine, while Baclofen (84%) was the preferred anti-craving drug. Olanzapine (36%) was commonly prescribed for affective disorders. Two-thirds (66%) were treated only for ADS, while 34% had comorbidities such as depression, seizures, and psychosis. LFTs showed significant abnormalities, including elevated AST and ALT levels and altered albumin, globulin, and bilirubin levels.
Conclusion: ADS predominantly affects middle-aged males and is linked to long-term, high-quantity alcohol consumption. Significant liver dysfunction and psychiatric comorbidities highlight the need for early detection, comprehensive management, and preventive measures to reduce the overall burden of ADS.
Keywords: Alcohol dependence syndrome (ADS), Prevalence, pattern of alcohol consumption, Prescribing patterns, Management, Liver function tests
© 2025 The Authors. Published by Innovare Academic Sciences Pvt Ltd. This is an open access article under the CC BY license (https://creativecommons.org/licenses/by/4.0/)
DOI: https://dx.doi.org/10.22159/ijcpr.2025v17i6.8002 Journal homepage: https://innovareacademics.in/journals/index.php/ijcpr
INTRODUCTION
Alcohol Dependence Syndrome (ADS) is regarded as a chronic, multifaceted illness that progresses slowly and is nearly always discovered at a later stage. It also has effects on one's family, career, social life, psychology, and physical health [1]. The demand for alcoholic beverages is one of the most significant worldwide. To cut down on alcohol consumption, strict laws are required in each state, and those who drink must be made aware of the many negative impacts drinking may have on their body, mind, and soul [2]. The symptoms frequently include an intense craving for alcohol, difficulty controlling one's intake, sticking with it in spite of negative effects, putting alcohol before other obligations, building up a tolerance, and, in rare situations, going through physical withdrawal.
The adaptability of alcohol has made its acquisition, use, and consumption commonplace for a long time. For example, data from Bangalore in 2010 shows that alcohol consumption was 23.7% and Kerala in 2016, Andaman and Nicobar Islands in 2017, rural Indore in 2018 showed 28.78%, and Dehradun in 2019 showed 44%. Numerous medical and psychological issues, including obesity, liver problems, anxiety, and distrust, are brought on by alcohol consumption [3]. The liver is responsible for the metabolism of almost all ethanol taken and is also the main site of ethanol's harmful health consequences. Numerous liver-derived indicators linked to excessive ethanol consumption and alcoholic liver damage have been shown in alcoholic individuals. Heavy drinkers often show elevated activity of serum GGT and transaminases (ALT, AST), however, with advancement of alcoholic liver disease, there may be elevations in liver enzymes coupled with abnormally low serum quantities of hepatic proteins [4].
Primary objective
To analyze the prevalence, prescribing pattern and management of alcohol dependence syndrome in a tertiary care hospital
Secondary objectives
To identify the prevalence and pattern of alcohol consumption
To assess the quantity of alcohol consumption and the duration of use in inividuals with alcohol dependence syndrome.
To monitor the progress of management in alcohol dependence syndrome using biomarker of liver status
MATERIALS AND METHODS
Study design: a prospective observational study was conducted over a period of 6 mo at Srinivas Institute of Medical Science and Research Centre, Mukka-574146.
Sample size: 100 participants
Study criteria
Inclusion criteria
Patients ≥18 y of age diagnosed with ADS
Patients who have consented for the study.
Exclusion criteria
Patients of either sex aged below 18 y.
Patients who are critically ill, agitated, or unable to cooperate during data collection.
Source of data collection
Relevant data was collected from patient’s medical records.
Data collection
A data collection form was prepared, which contains patient's demographic details, history of medical condition, medication history, complaints on admission, social history, lab investigations. Data of each participant regarding current and discharge medication prescribed was collected from patient's medical records. Prior to collecting data, patient consent was obtained.
Statistical analysis
Statistical analysis involves collecting and scrutinizing every data sample in a set of items from which samples can be drawn and a suitable statistical test was applied to analyze the data. The collected data were analyzed using Microsoft Excel.
RESULTS
Demographic of subjects
The data highlights a pronounced gender disparity among patients, with males comprising 99% of the total population, while females represent only 1%. The largest age group among patients is 41 to 50 y old, accounting for 53% of the total. Following this, 24% fall into the 31 to 40 age bracket, and 6% are aged 20 to 30. There is a noticeable decrease in patient numbers in older age categories, with 12% in the 51 to 60 range, 3% between 61 and 70, and 2% over 70 y old. Detailed demographic information of the subjects can be found in table 1, highlighting the importance of these findings.
Table 1: Demographic of subjects
| Age (y) | Male | Female | Total (n=100) | |||
| n | % | n | % | n | % | |
| 20-31 | 6 | 6 % | 6 | 6% | ||
| 31-40 | 23 | 23% | 1 | 1% | 24 | 24% |
| 40-51 | 53 | 53% | 53 | 53% | ||
| 51-60 | 12 | 12% | 12 | 12% | ||
| 61-70 | 3 | 3% | 3 | 3% | ||
| >70 | 2 | 2% | 2 | 2% | ||
Duration of alcohol consumption among ads patients
In fig. 1, 34% of participants reported consuming alcohol for over 22 y. Meanwhile, 26 individuals consumed alcohol between the ages of 20 and 22, and 14 individuals between 10 and 12 y. Additionally, 8% consumed alcohol between the ages of 12 and 14, and the remaining 6% did so between 14 to 16, 16 to 18, and 18 to 20 y. So majority of the individulas consumed alcohol more than 22 y.
Quantity of alcohol consumed by ads patients
The data illustrates varying levels of alcohol consumption among patients, with the highest percentage (40%) consuming 60 g of alcohol per day. Additionally, 16% consume between 61 to 70 g, and another 12% fall within each of the ranges of 71 to 80 g and greater than 90 g per day. This distribution suggests a notable proportion of patients engaging in heavy alcohol consumption, potentially indicating a significant factor in their health conditions.
Prescribing pattern of drugs
In this table 4, the table presents the prescribing pattern of various therapeutic classes of drugs. The most commonly prescribed drugs were Vitamins (92%), BZDs (75%), anti-craving drugs (65%), anti-psychotics (55%), antiepileptics (45%), PPI (42%), Corticosteroids (31%) and anti-convulsants (30%).
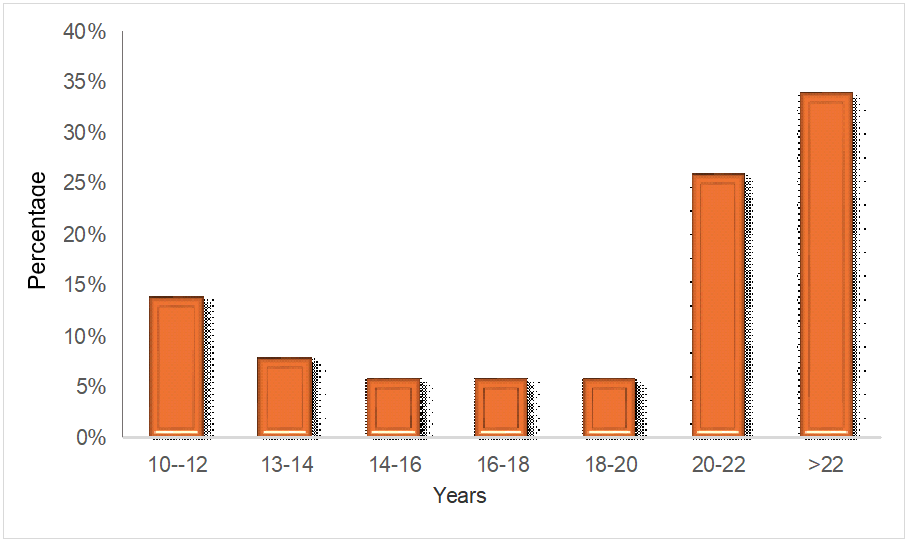
Fig. 1: Duration of alcohol consumption among alcohol dependence syndrome patients
Table 2: Quantity of alcohol consumed by alcohol dependence syndrome patients
| Grams of alcohol/Day | No. of patients | Percentage (%) |
| 60 | 40 | 40% |
| 61-70 | 16 | 16% |
| 71-80 | 12 | 12% |
| 81-90 | 32 | 32% |
Table 3: Prescribing pattern of drugs
| Therapeutic class of drugs | No of drugs, N=(100) |
| Vitamins | 92 |
| BZD | 75 |
| Anti-cravings | 65 |
| Anti-Psychotics | 55 |
| Anti epileptics | 75 |
| PPI | 42 |
| Corticosteroids | 31 |
| Antibiotics | 28 |
| Anti emetics | 20 |
| Hepatoprotective | 15 |
| Psychostimulants | 13 |
| Anti platlet | 12 |
| Statins | 12 |
| Vasoprotective | 11 |
| Mucolytics | 9 |
| Laxatives | 7 |
| Bronchodilators | 3 |
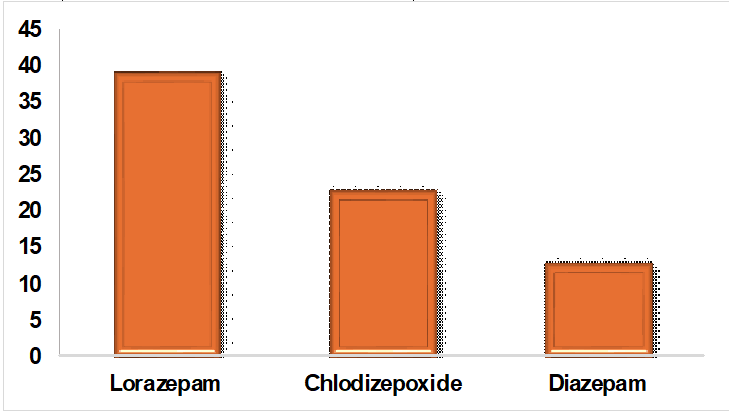
Fig. 2: Prescribing patterns of benzodiazepines for alcohol dependence syndrome in fig. 2, Among the BZDs, Lorazepam (39%) was the most common drug prescribed, followed by Chlordiazepoxide (23%) and diazepam (13%)
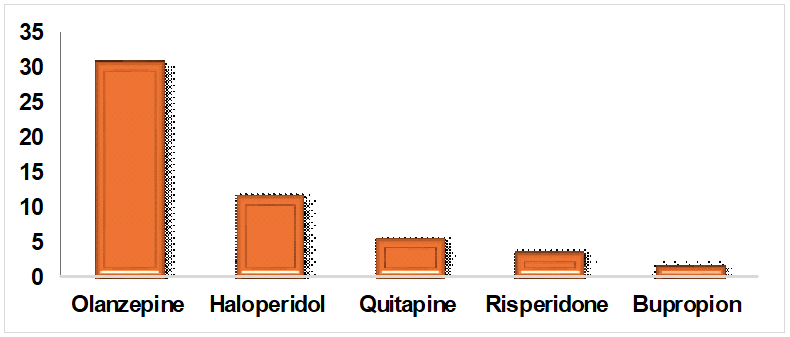
Fig. 3: Prescribing patterns of anti-craving drugs in alcohol dependence syndrome, in fig. 3, for long-term relapse prevention, anti-craving drugs like Baclofen (29%), Disulfiram (15 %), Acomprosate (6%) and Naltrexone (5%) were prescribed
Table 4: Pre-intervention liver biomarkers in alcohol dependence syndrome
| LFTs | Normal value | Increased values | Decreased values |
| Total Bilirubin (0.1-1.2 mg/dl) | 82 | 10 | 8 |
| Direct bilirubin (0.0-0.3 mg/dl) | 44 | 56 | - |
| Indirect bilirubin (0.2-0.8 mmmg/dl) | 42 | 45 | 4 |
| Total protein (6.0-8.3g/dl) | 40 | 10 | 50 |
| AST (10-40 U/l) | 9 | 91 | - |
| ALT (7-56U/l) | 31 | 49 | 20 |
| ALP (44-147 U\L) | 42 | 52 | 6 |
| Albumin (3.4-5.4 g/dl) | 38 | 6 | 56 |
| Globulin (1.8-3.4 g/dl) | 32 | 41 | 27 |
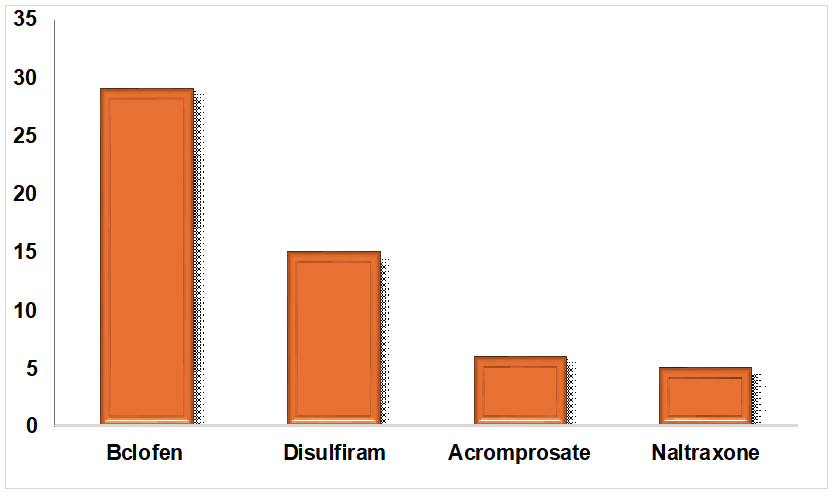
Fig. 4: Prescribing patterns of drugs for psychosis in alcohol dependent syndrome, in fig. 4, for associated affective disorders like psychosis, Olanzapine (31%), Haloperidol (12%), Quetiapine (6%), Risperidone (4%) and Bupropion (2%) were the common drugs prescribed
To monitor the progress of management in ads using liver biomarkers
In table 4, the data illustrates that, in managing alcohol dependence syndrome (ADS), liver function tests frequently remain abnormal. Before interventions, among a population of 100 patients, 91 % had elevated AST levels. Additionally, 56% had elevated direct bilirubin, 52% had elevated ALP, 49% had elevated ALT, 45% had elevated indirect bilirubin, and 41% had elevated globulin levels. Albumin and total protein levels were generally depleted.
Table 5: Post-intervention liver biomarkers in alcohol dependence syndrome
| LFTs | Normal value | Increased values | Decreased values |
| Total Bilirubin (0.1-1.2 mg/dl) | 86 | 4 | - |
| Direct bilirubin (0.0-0.3 mg/dl) | 44 | 56 | - |
| Indirect bilirubin (0.2-0.8 mmmg/dl) | 45 | 40 | 15 |
| Total protein (6.0-8.3g/dl) | 42 | 12 | 46 |
| AST (10-40 U/l) | 6 | 90 | 4 |
| ALT (7-56U/l) | 32 | 48 | 20 |
| ALP (44-147 U\L) | 47 | 53 | - |
| Albumin (3.4-5.4 g/dl) | 40 | 5 | 55 |
| Globulin (1.8-3.4 g/dl) | 41 | 38 | 21 |
In table 5, the data illustrates that, in managing alcohol dependence syndrome (ADS), liver function tests frequently remain abnormal. Before interventions, among a population of 100 patients, 90 % had elevated AST levels. Additionally, 40% had elevated indirect bilirubin, 53% had elevated ALP, 48% had elevated ALT, 56% had elevated direct bilirubin, and 38% had elevated globulin levels. Albumin and total protein levels were generally depleted.
Table 6: Pre-bilirubin values with alcohol quantity in ADS patients
| Pre-total bilirubin | ||||
| Quantity (gm) | Normal | Increased | Decreased | p value |
| 60 | 26 | 6 | 9 | 0.0202 |
| 61-70 | 16 | |||
| 71-80 | 12 | |||
| 81-90 | 28 | 3 | ||
| Pre-direct bilirubin | ||||
| Quantity (gm) | Normal | Increased | Decreased | p value |
| 60 | 13 | 28 | 0.00001 | |
| 61-70 | 16 | |||
| 71-80 | 12 | |||
| 81-90 | 2 | 29 | ||
| Pre-indirect bilirubin | ||||
| Quantity (gm) | Normal | Increased | Decreased | p value |
| 60 | 11 | 26 | 4 | 0.003146 |
| 61-70 | 16 | |||
| 71-80 | 12 | |||
| 81-90 | 2 | 29 | ||
In table 6, a significant correlation was found between alcohol consumption and bilirubin levels. With 60 g of alcohol, 6 cases showed increased total bilirubin levels, while 9 cases showed a decrease; for 81-90 g, 3 cases had increased levels. The correlation coefficient (R) was 0.232 with a P-value of 0.0202, indicating statistical significance. For direct bilirubin levels, 28 cases increased with 60 g, and 29 cases increased with 80-90 g, with an R value of 0.6539 and a P-value less than 0.00001, showing a strong correlation. For indirect bilirubin, 26 cases increased and 4 decreased with 60 g, while 29 increased with 81-90 g, with an R value of 0.2925 and a P-value of 0.003146, indicating a significant correlation.
Table 7: Pre-bilirubin values with alcohol duration in ADS patients
| Total bilirubin | ||||
| Duration (years) | Normal | Incraesed | Decreased | p value |
| 10-12 | 28 | 0.514134 | ||
| 13-14 | 3 | |||
| 15-16 | 19 | |||
| 17-18 | ||||
| 19-20 | 10 | 4 | 9 | |
| 21-22 | 2 | |||
| >22 | 20 | 5 | ||
| Direct bilirubin | ||||
| Duration (years) | Normal | Incraesed | Decreased | p value |
| 10-12 | 27 | 1 | 0.021684 | |
| 13-14 | 3 | |||
| 15-16 | 13 | 6 | ||
| 17-18 | ||||
| 19-20 | 23 | |||
| 21-22 | ||||
| >22 | 25 | |||
| Indirect bilirubin | ||||
| Duration (years) | Normal | Incraesed | Decreased | p value |
| 10-12 | 26 | 2 | 0.00001 | |
| 13-14 | 3 | |||
| 15-16 | 12 | 5 | 2 | |
| 17-18 | ||||
| 19-20 | 23 | |||
| 21-22 | 2 | |||
| >22 | 25 | |||
In a table 7, the study observed that over 22 y of alcohol consumption, there was no significant correlation between alcohol quantity and total bilirubin (R =-0.066, P = 0.514). However, a significant positive correlation was found between the duration of alcohol consumption and direct bilirubin (R = 0.2294, P = 0.0217) and indirect bilirubin (R = 0.889, P = 0.00001). Increased direct bilirubin levels were noted in 25 cases over 22 y and 23 cases for 19-20 y. Indirect bilirubin levels increased in 25 cases over 22 y, 23 cases for 19-20 y, and 5 cases for 15-16 y.
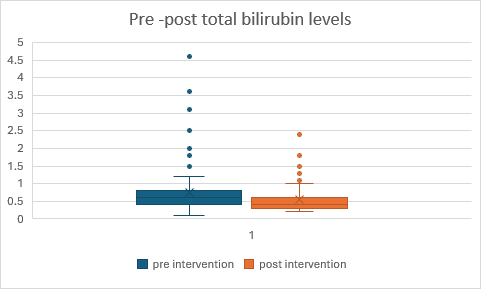
Fig. 5: Comparison of pre and post total bilirubin levels in Alcohol Dependence syndrome
In fig. 5, the intervention demonstrates effectiveness by reducing both median and mean scores on the measured variable. Participants in Group 2 (post-test) scored lower on average and showed less variability compared to Group 1 (pre-test), suggesting that the intervention had a beneficial effect on the outcome measured. The statistical test showed a p-value of 0.00019, which indicates that the results are significant at a significance level of p<0.05. This suggests that there is strong evidence to reject the null hypothesis based on the test conducted.
In fig. 6, the intervention shows effectiveness by reducing both the mean score and variability of the measured variable. Participants in Group 2 (post-test) scored lower on average and showed less variability compared to Group 1 (pre-test), suggesting that the intervention had a beneficial effect on the outcome measured. When applying a t-test for dependent variables the p-value is less than 0.00032, demonstrating that the findings are statistically significant at a significance level of p<0.05. This indicates strong evidence to reject the null hypothesis based on the conducted test.
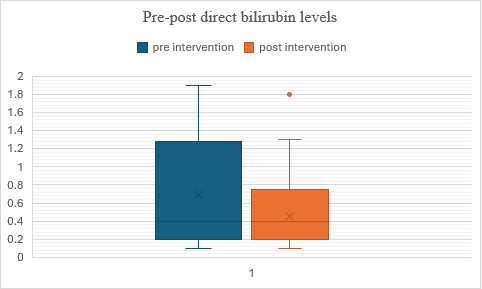
Fig. 6: Comparison of pre and post – direct bilirubin levels in alcohol dependence syndrome
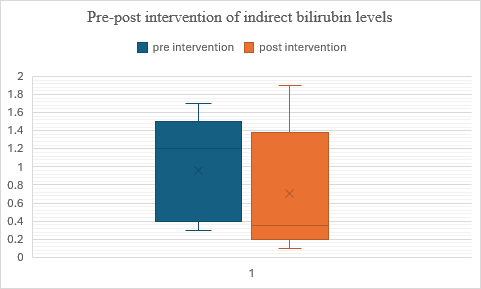
Fig. 7: Comparison of pre and post–indirect bilirubin levels in alcohol dependence syndrome
In fig. 7, the data suggests that the intervention was effective in reducing scores on the measured variable. This is supported by lower median and mean scores in Group 2 (post-test) compared to Group 1 (pre-test). when applying a t-test for dependent variables, The p-value is less than 0.00001, indicating that the result is highly significant even at a strict significance level of p<0.05.
Table 8: Pre-protein values with alcohol quantity in ADS patients
| Total protien | ||||
| Quantity (gm) | Normal | Increased | Decreased | p value |
| 60 | 20 | 2 | 19 | 0.000617 |
| 61-70 | 16 | |||
| 71-80 | 12 | |||
| 81-90 | 20 | 8 | 3 | |
| Albumin | ||||
| Quantity (gm) | Normal | Incraesed | Decreased | p value |
| 60 | 11 | 6 | 24 | 0.012853 |
| 61-70 | 16 | |||
| 71-80 | 11 | 1 | ||
| 81-90 | 31 | |||
| Globulin | ||||
| Quantity (gm) | Normal | Incraesed | Decreased | p value |
| 60 | 10 | 20 | 11 | 0.22089 |
| 61-70 | 16 | |||
| 71-80 | 12 | |||
| 81-90 | 10 | 21 | ||
In table 8, the study found that higher alcohol consumption (81-90 g) led to increased total protein levels in 8 cases and decreased levels in 3 cases, while 60 g resulted in 2 cases of increased and 19 cases of decreased total protein levels. A significant positive correlation was observed between the duration of alcohol consumption and total protien levels (R = 0.3366, P = 0.000617). For albumin levels, 60 g of alcohol consumption resulted in 6 cases of increased and 24 cases of decreased levels, while 81-90 g led to 31 cases of decreased levels, with a weak but significant negative correlation (R =-0.248, P = 0.012853). Regarding globulin levels, 60 g of alcohol consumption led to 20 cases of increased and 11 cases of decreased levels, while 81-90 g showed 21 cases of increased levels, with a weak and non-significant correlation (R = 0.1235, P = 0.22089).
Table 9: Pre-protein values with alcohol duration in ADS patients
| Total protien | ||||
| Duration (years) | Normal | Incraesed | Decreased | p value |
| 10-12 | 28 | <0.00001 | ||
| 13-14 | 3 | |||
| 15-16 | 1 | 18 | ||
| 17-18 | ||||
| 19-20 | 19 | 4 | ||
| 21-22 | 2 | |||
| >22 | 19 | 5 | 1 | |
| Albumin | ||||
| Duration (years) | Normal | Incraesed | Decreased | p value |
| 10-12 | 28 | 0.000405 | ||
| 13-14 | 3 | |||
| 15-16 | 1 | 18 | ||
| 17-18 | ||||
| 19-20 | 19 | 4 | ||
| 21-22 | 2 | |||
| >22 | 19 | 5 | 1 | |
| Globulin | ||||
| Quantity (gm) | Normal | Incraesed | Decreased | p value |
| 10-12 | 5 | 23 | <0.00001 | |
| 13-14 | 2 | 1 | ||
| 15-16 | 16 | 3 | ||
| 17-18 | ||||
| 19-20 | 1 | 22 | ||
| 21-22 | 2 | |||
| >22 | 6 | 19 | ||
In table 9, the study found a significant correlation between alcohol consumption duration and total protein levels (R = 0.795, P<0.00001). Albumin levels showed mixed changes for 19-20 y and mostly decreased for 10-14 y, with a weak negative correlation (R =-0.3473, P = 0.000405). Globulin levels had a moderate positive correlation with consumption duration (R = 0.636, P<0.00001), with increased levels in 19 cases over 22 y and 22 cases for 19-20 y.
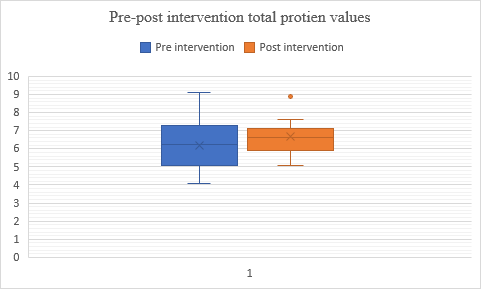
Fig. 8: Comparison of pre and post–total protein levels in alcohol dependence syndrome
In figure 8, Both groups have similar overall score distributions, Group 2 (post-test) shows a slightly higher central tendency (median and mean) and less variability (lower standard deviation) compared to Group 1 (pre-test), suggesting a potential improvement in scores after the intervention or treatment. When applying a t-test for dependent variables, the p-value is less than 0.00001, indicating that the results are statistically significant at a significance level of p<0.05. This suggests strong evidence to reject the null hypothesis based on the test conducted.
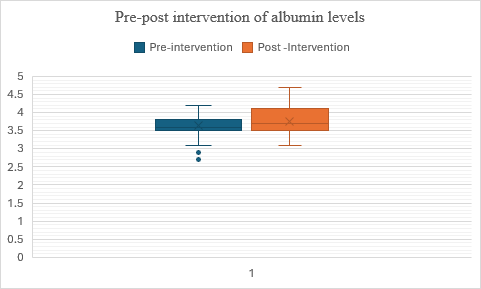
Fig. 9: Comparison of pre and post–albumin levels in alcohol dependence syndrome
In fig. 9, Group 2 (post-test) exhibits a higher central tendency (median and mean) and less variability (lower standard deviation) in scores compared to Group 1 (pre-test), suggesting a potential improvement or positive effect of the intervention or treatment between the two testing phases. The data indicate that the albumin values have increased after the intervention. The t-value is 2.283003, and the p-value is 0.01228, indicating that the result is significant at (p<0.05).
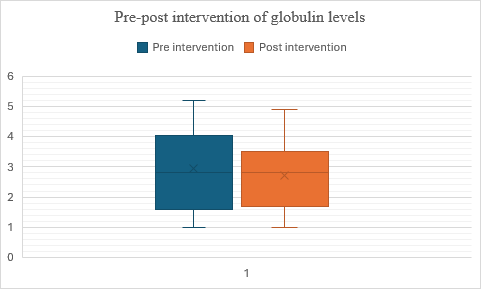
Fig. 10: Comparison of pre and post–globulin levels in alcohol dependence syndrome
In fig. 10, the median scores remain consistent between the pre-test and post-test phases. In Group 2 (post-test), there is a lower mean score and a reduced standard deviation compared to Group 1 (pre-test). This suggests that, on average, there may be a slight decrease in scores or less variability after the intervention or treatment between the two phases of testing. Despite these differences in mean and variability between the groups, the intervention does not appear to have significantly altered the central tendency of the measurements, as indicated by the identical median values. The t-value is -1.638981, and the p-value is 0.0522, indicating that the result is not significant at (p<0.05).
Table 10: Pre-liver enzyme values with alcohol quantity in ADS patients
| Pre-SGOT | ||||
| Quantity (gm) | Normal | Increased | Decreased | p value |
| 60 | 9 | 32 | <0.00001 | |
| 61-70 | 16 | |||
| 71-80 | 12 | |||
| 81-90 | 31 | |||
| PRE-SGPT | ||||
| Quantity (gm) | Normal | Incraesed | Decreased | p value |
| 60 | 22 | 13 | 6 | 0.00001 |
| 61-70 | 7 | 9 | ||
| 71-80 | 12 | |||
| 81-90 | 2 | 27 | 2 | |
| PRE-ALP | ||||
| Quantity (gm) | Normal | Incraesed | Decreased | p value |
| 60 | 30 | 10 | 1 | 0.00001 |
| 61-70 | 2 | 9 | 5 | |
| 71-80 | 9 | 3 | ||
| 81-90 | 1 | 30 | ||
In table 10, the study found a significant correlation between alcohol consumption and liver enzyme levels. Elevated SGOT (AST) levels were observed with increasing alcohol intake: 32 cases at 60 g, 16 at 61-70 g, 22 at 71-80 g, and 31 at 81-90 g (R = 0.8077, P<0.00001). For SGPT (ALT), 13 cases increased and 6 decreased at 60 g, 9 increased at 61-70 g, 12 decreased at 71-80 g, and 27 increased and 2 decreased at 81-90 g (R = 0.4737, P<0.00001). ALP levels showed 10 increased and 1 decreased at 60 g, 9 increased and 5 decreased at 61-70 g, 3 increased at 71-80 g, and 30 increased at 81-90 g (R = 0.5641, P<0.00001). All results were statistically significant at p<0.05.
Table 11: Pre-liver enzyme values with alcohol duration in ADS patients
| Pre-SGOT | ||||
| Duration (years) | Normal | Incraesed | Decreased | p value |
| 10-12 | 19 | 9 | <0.00001 | |
| 13-14 | 3 | |||
| 15-16 | 19 | |||
| 17-18 | ||||
| 19-20 | 23 | |||
| 21-22 | 2 | |||
| >22 | 25 | |||
| Pre-SGPT | ||||
| Duration (years) | Normal | Incraesed | Decreased | p value |
| 10-12 | 8 | 16 | 4 | <0.00001 |
| 13-14 | 1 | 2 | ||
| 15-16 | 1 | 5 | 13 | |
| 17-18 | ||||
| 19-20 | 17 | 5 | 1 | |
| 21-22 | 2 | |||
| >22 | 5 | 20 | ||
| Pre-ALP | ||||
| Duration (years) | Normal | Incraesed | Decreased | p value |
| 10-12 | 9 | 13 | 6 | 0.000204 |
| 13-14 | 3 | |||
| 15-16 | 9 | 10 | ||
| 17-18 | ||||
| 19-20 | 17 | 6 | ||
| 21-22 | 2 | |||
| >22 | 4 | 21 | ||
In table 11, the study found a moderate positive correlation between SGOT and alcohol consumption (R = 0.7496, P<0.00001). SGPT and ALP levels varied, with weak correlations (SGPT,R = 0.4994, P<0.00001; ALP, R = 0.3632, P = 0.000204). ALP levels increased with alcohol duration, suggesting potential liver stress.
In fig. 11, the data indicates that the intervention or treatment implemented between the pre-test (Group 1) and post-test (Group 2) phases had a positive effect on the Participants' scores. Group 2 shows higher median and mean scores, suggesting an improvement in performance after the intervention. Additionally, the lower standard deviation in Group 2 indicates that scores were more consistent among participants compared to Group 1. These findings collectively suggest that the treatment effectively improved scores and reduced variability among the participants. The t-value is -10.179006, and the p-value is less than 0.00001, indicating that the result is highly significant at (p<0.05).
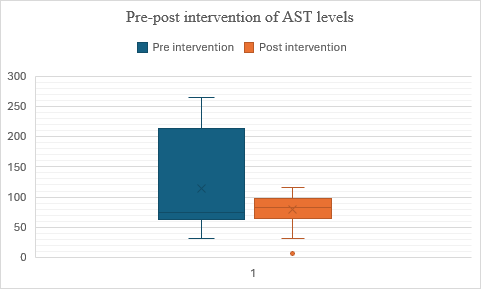
Fig. 11: Comparison of pre and post– SGOT levels In Alcohol Dependence syndrome
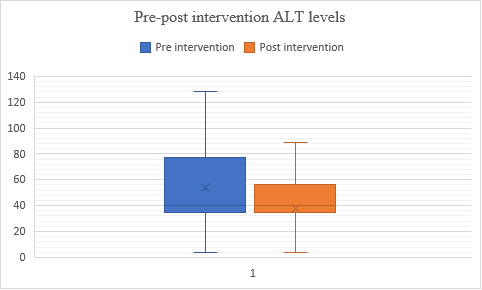
Fig. 12: Comparison of pre and post–SGPT levels in alcohol dependence syndrome
In fig. 12, the data suggests the intervention had an impact on participants' scores. Group 2 shows a lower mean score and lower variability compared to Group 1, indicating a decrease in performance after the intervention. The median scores remained the same, suggesting no significant change in central tendency. Therefore, the treatment might not have improved scores and may have slightly decreased performance in Group 2. The t-value is -3.27248, and the p-value is 0.00073, indicating a significant result at (p<0.05).
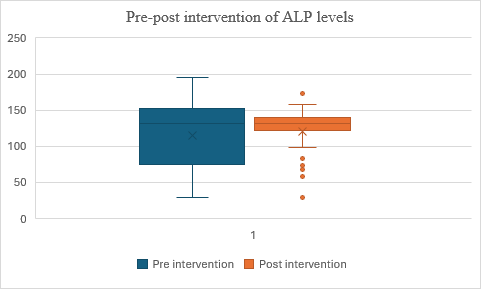
Fig. 13: Comparison of pre and post– ALP levels in alcohol dependence syndrome
In fig. 13, the mean score for Group 2 (post-test) is slightly higher than for Group 1 (pre-test), suggesting some improvement after the intervention. However, the t-value of 1.169683 and p-value of 0.12247 indicate that this difference is not statistically significant at (p<0.05). This means the observed improvement could be due to random chance, and there is no strong evidence that the intervention caused the improvement. Therefore, the intervention might not have had a significant effect on part.
DISCUSSION
The data paints a comprehensive picture of the patient population, revealing multifaceted patterns that warrant careful consideration. Firstly, the striking gender imbalance, with males representing a predominant proportion of 99%, suggests potential gender-specific vulnerabilities or behavioral differences. This result is similar to the study conducted by Kumar N et al. [11]. Women using alcohol are more stigmatized and have more difficulty in accessing treatment and often don’t seek treatment [12]. This disparity prompts inquiries into societal and biological factors influencing health-seeking behaviors and susceptibility to certain conditions across genders. The age distribution showcases a concentration of patients within the middle-aged bracket, particularly between 41 to 50 y old. The declining representation in older age groups raises questions about the cumulative effects of alcohol consumption over time and the age-related progression of associated health conditions. This result shows similar patterns when compared to the study conducted by BT Vignesh et al.[13]Speaking of alcohol consumption, the data underscores a worrying prevalence of heavy intake among patients, with a substantial proportion consuming 60 g or more daily. Harmful drinking includes consumption of an average>60 g alcohol per day for males and>40 g per day for females. This is in accordance with the study conducted by J Rehm et al. [14]. This highlights the urgent need for targeted interventions addressing alcohol use disorders and associated health risks within the population. Furthermore, the duration of alcohol consumption reveals a significant portion of patients engaging in long-term use, with nearly two-thirds reporting durations of over 22 y. This is comparable to the study done by Campanella S et al. [15]. It underscores the chronic nature of alcohol consumption within the studied cohort and emphasizes the importance of comprehensive long-term management strategies addressing both alcohol dependency and its associated health consequences. Patients who have been consuming alcohol for an extended period are more likely to develop severe forms of ADS. Long-term alcohol use can alter neurotransmitter levels in the brain, particularly those related to reward and pleasure, leading to a reinforcing cycle of alcohol-seeking behavior. Additionally, chronic alcohol consumption can result in physiological adaptations that require increasing amounts of alcohol to achieve the desired effects, leading to tolerance. In sum, these findings show the complexity of factors contributing to health outcomes within the population and emphasize the need for holistic approaches addressing gender-specific vulnerabilities, age-related risks, and chronic patterns of alcohol consumption to effectively mitigate health disparities and improve overall well-being. Various studies addressing alcohol addiction lessons conducted by CK Naveen et al. explained the need of long-term pharmacological interventions with various behavioural therapies as the key to decrease the alcohol addiction burden in society [9]. In the present study, multivitamins were prescribed to majority of the patients with alcohol dependence. These findings are consistent with previous research by Dube U et al. where multivitamins were prescribed to majority of the alcohol dependence patients [8]. In a study done by Bhanu Prakash K et al. multivitamins were the most common drugs prescribed in alcoholic liver disease. This indicates multivitamins are necessary to treat nutritional deficiencies commonly suffered by alcoholic patients [7]. For decreasing the withdrawal symptoms, BZDs like Lorazepam, Chlordiazepoxide, and Diazepam were prescribed in our study, which was in line with the studies done by Hoey LL et al. Where lorazepam and chlordiazepoxide are the common BZDs being prescribed. Hence, BZDs are effective in treatment of withdrawal symptoms in alcohol-dependent patients [16]. Current study indicates Baclofen, Acamprosate, and Naltrexone were the most commonly prescribed anti-craving drugs, emulating the Study conducted by Atul A et al., and Julie Dupouy et al., which provided consistent evidence of use of acamprosate, Naltrexone, and Baclofen as anti-craving drugs [17]. This pattern of prescribing anti-craving drugs in alcohol dependence is similar to that approved by the US FDA. Previous studies showed use of Disulfiram for alcohol craving [12]. This change in the prescribing pattern in the anti-craving drugs is because of the better and clearer understanding of neurobiology of alcohol de-addiction techniques [12]. There is a decreased trend of using
Disulfiram, probably because of high requirement of patient’s willingness to stop alcohol completely and its associated adverse drug reactions. In the present study, anti-craving drugs are prescribed as monotherapy, whereas in a study by Lohit K et al., they were prescribed as combination therapy. Due to the complex neurobiology regarding de-addiction process, treatment with combination therapy of various anti-craving agents are advocated in patients not responding to monotherapy [18]. Alcohol consumption causes changes in the liver functions both in acute consumption as well as chronic consumption. In the present study significant changes were detected biochemically based on the liver function tests mainly using the parameters-serum albumin, globulin, SGOT, SGPT, ALP, and bilirubin levels. Alcohol dependence significantly impacts liver function parameters, with elevated AST, ALT, altered albumin levels being notable features, this study was supported by Alatalo et al. [4].
CONCLUSION
According to the study, there are significant gender disparities, age-related patterns, and a high prevalence of chronic heavy alcohol use, with many patients having consumed more than 60 g per day for more than 20 y. Persistently abnormal liver function tests indicate that this pattern considerably raises health risks, especially liver damage. The treatment of alcohol dependence syndrome necessitates a thorough, individualized strategy that includes antipsychotic and antiepileptic drugs, vitamins, benzodiazepines, and anti-craving pharmaceuticals, including Baclofen, Acamprosate, and Naltrexone. Frequent monitoring of liver function is necessary for early problem identification and prompt treatment. Holistic methods such as lifestyle changes, cognitive behavioral therapy, hepatology consultations, and support organizations like Alcoholics Anonymous are essential in addition to medication. People with ADs can benefit from improved long-term health outcomes, prolonged recovery, and increased treatment effectiveness when medical and psychosocial therapies are integrated.
FUNDING
Nil
AUTHORS CONTRIBUTIONS
CONFLICT OF INTERESTS
Declared none
REFERENCES
Valentim OS, Celia P, Jose S, Luis S, Paulo. People with alcohol dependence syndrome. Rev Enferm. 2018;41(Suppl 11-12):181-8.
Eashwar VM, Umadevi R, Gopalakrishnan S. Alcohol consumption in India an epidemiological review. J Fam Med Prim Care. 2020;9(1):49-55. doi: 10.4103/jfmpc.jfmpc_873_19, PMID 32110564.
Ray A, Ninave S, Patil PS, Ninave S, Khan T. Assessing the behavioral and personality changes in alcohol dependence syndrome in Wardha, Central, India. Cureus. 2023;15(11):e48419. doi: 10.7759/cureus.48419, PMID 38073911.
Alatalo P, Koivisto H, Puukka K, Hietala J, Anttila P, Bloigu R. Biomarkers of liver status in heavy drinkers moderate drinkers and abstainers. Alcohol Alcohol. 2009;44(2):199-203. doi: 10.1093/alcalc/agn099, PMID 19054785.
Nayak G, Tom C, Skaria DM, Yasmeen N, CK FH. A prospective observational study on drug utilization pattern and relation of alcohol consumption in patients with alcoholic liver disease in a Tertiary Care Hospital. IJOPP. 2022;15(1):15-21. doi: 10.5530/ijopp.15.1.4.
Alatalo P, Koivisto H, Puukka K, Hietala J, Anttila P, Bloigu R. Biomarkers of liver status in heavy drinkers moderate drinkers and abstainers. Alcohol Alcohol. 2009;44(2):199-203. doi: 10.1093/alcalc/agn099, PMID 19054785.
Dube U, Shwetha, Shanmukananda KA, R VD, Kumar A. Prescribing pattern of drugs in alcohol dependence in a Tertiary Care Hospital. Int J Basic Clin Pharmacol. 2017;6(11):2621. doi: 10.18203/2319-2003.ijbcp20174777.
Eashwar VM, Umadevi R, Gopalakrishnan S. Alcohol consumption in India an epidemiological review. J Fam Med Prim Care. 2020;9(1):49-55. doi: 10.4103/jfmpc.jfmpc_873_19, PMID 32110564.
Becker HC. Alcohol dependence, withdrawal and relapse: implications for treatment. Schol Sci J. 2023;7:23-4.
Sarkar P, Sudarsanan S, Nath S. Outcome of treatment of alcohol dependence syndrome patients in military psychiatry set up. Med J Armed Forces India. 2004;60(3):247-50. doi: 10.1016/S0377-1237(04)80056-X, PMID 27407643.
Kumar N, Kanchan T, Unnikrishnan B, Thapar R, Mithra P. Health sciences profile of substance use among patients attending de-addiction centres in a coastal city of Southern India. PLOS One. 2013;8(2):e57824. doi: 10.1371/journal.pone.0057824.
Women BSB. Alcohol and drugs. In: Miller N, editor. A handbook of drug and alcohol addiction. New York: marcel Dekher; 1991. p. 147-77.
Vignesh BT, Singh AK, Mohan SK, Murthy S, Joshi A. Association between socio-demographics and alcohol dependence among individuals living in an Indian setting. Glob J Health Sci. 2014 May;6(3):16-26. doi: 10.5539/gjhs.v6n3p16, PMID 24762342.
Rehm J, Greenfield TK, Walsh G, Xie X, Robson l, Single E. Assessment methods for alcohol consumption prevalence of high risk drinking and harm: a sensitivity analysis. Int J Epidemiol. 1999 Apr;28(2):219-24. doi: 10.1093/ije/28.2.219, PMID 10342682.
Campanella S, Petit G, Maurage P, Kornreich C, Verbanck P, Noel X. Chronic alcoholism: insights from neurophysiology. Neurophysiol Clin. 2009 Oct 1;39(4-5):191-207. doi: 10.1016/j.neucli.2009.08.002, PMID 19853791.
Hoey LL, Nahum A, Vance Bryan K. A prospective evaluation of benzodiazepine guidelines in the management of patients hospitalized for alcohol withdrawal. Pharmacotherapy. 1994;14(5):579-85. doi: 10.1002/j.1875-9114.1994.tb02854.x, PMID 7997391.
Ambekar A, Kattimani S. Anti-craving medications in the treatment of alcoholism. Manual for long-term pharmacotherapy. New Delhi: National Drug Dependence Treatment Centre, All India Institute of Medical Sciences; 2006.
Lohit K, Kulkarni C, Galgali RB. Factors influencing adherence to anti-craving medications and drinking outcomes in patients with alcohol dependence: a hospital-based study. J Pharmacol Pharmacother. 2016;7(2):72-9. doi: 10.4103/0976-500X.184770.