
Int J Curr Pharm Res, Vol 18, Issue 1, 30-35Original Article
FORMULATION AND EVALUATION OF HERBAL FLOATING TABLET OF PIPERINE FOR CONSTIPATION
PRIYANKA SHARMA1*, RAJESH KUMAR1, AJEET PAL SINGH2, AMAR PAL SINGH2
1Department of Pharmaceutics, St. Soldier institute of pharmacy, Lidhran Campus, Behind NIT (R. E. C.), Jalandhar –Amritsar by pass, NH-1, Jalandhar-144011, Punjab, India. 2Department of Pharmacology, St. Soldier institute of pharmacy, Lidhran Campus, Behind NIT (R. E. C.), Jalandhar –Amritsar by pass, NH-1, Jalandhar-144011, Punjab, India
*Corresponding author: Priyanka Sharma; *Email: ps0002328@gmail.com
Received: 07 Oct 2025, Revised and Accepted: 28 Nov 2025
ABSTRACT
Objective: To formulate and evaluate a herbal floating tablet of piperine intended for the treatment of constipation, with an emphasis on understanding how different polymer.
Methods: Floating tablets were prepared using direct compression and designed via a three-factor, three-level Box–Behnken experimental design. The independent variables were the amounts of HPMC K4M (A), HPMC K100M (B), and xanthan gum (C). Tablets were assessed for physicochemical properties (thickness, weight variation, friability, hardness), buoyancy parameters (floating lag time—FLT), swelling index (SI), and time to 90% drug release (T90%). Data was analyzed to determine the effect of polymer blends on tablet performance.
Results: The floating tablets varied from 81.12±0.63 to 119.7±0.567 sec, rising with larger polymer concentrations and longer hydration. HPMC K100M had the greatest FLT, followed by xanthan gum and HPMC K4M due to hydrophilicity and molecular weight. The swelling index varied from 61.9±0.624% to 99.95±0.226%. HPMC K100M and xanthan gum swelled more. Time to 90% drug release (T90%) varied from 7.0±0.55 to 10.33±0.289 h, with increased polymer viscosity and concentration delaying release. HPMC-xanthan gum polymers caused synergistic swelling and regulated drug release with zero-order kinetics.
Conclusion: The floating, swelling, and drug release kinetics of floating tablets depend on polymer selection and mixing. HPMC K100M and xanthan gum alone or in combination provide tablet matrices with better integrity, stomach retention, and drug release. This allows controlled-release oral formulations with enhanced constipation treatment.
Keywords: Floating tablets, HPMC K100M, HPMC K4M, Xanthan gum, Floating lag time, Swelling index, Drug release kinetics, Polymer hydrophilicity, Matrix integrity
© 2026 The Authors. Published by Innovare Academic Sciences Pvt Ltd. This is an open access article under the CC BY license (https://creativecommons.org/licenses/by/4.0/)
DOI: https://dx.doi.org/10.22159/ijcpr.2026v18i1.8007 Journal homepage: https://innovareacademics.in/journals/index.php/ijcpr
INTRODUCTION
The development of gastric-retentive drug delivery systems has emerged as an innovative approach to enhance the bioavailability of drugs with narrow absorption windows in the upper gastrointestinal tract. Floating drug delivery systems (FDDS), a subclass of gastro-retentive technologies, are designed to remain buoyant in gastric fluid for extended periods, enabling prolonged gastric retention and consistent drug release. This prolonged residence time ensures improved absorption, reduced dosing frequency, and enhanced therapeutic efficacy [1-5]. The effectiveness of FDDS is influenced by several factors, including floating lag time (FLT), swelling behaviour, and drug release kinetics. Polymers play a pivotal role in achieving these functionalities. Hydrophilic polymers, such as hydroxypropyl methylcellulose (HPMC) and xanthan gum, are widely utilized for their ability to hydrate, swell, and form gel layers, which control drug release while maintaining tablet buoyancy. Among various grades of HPMC, HPMC K100M, HPMC K4M, and xanthan gum are frequently employed due to their distinct viscosity, hydration, and gel-forming properties. The combination of synthetic polymers like HPMC with natural polymers such as xanthan gum has demonstrated synergistic effects, leading to improved swelling, controlled drug release, and better matrix integrity [6-15].
This study aims to investigate the impact of polymer type, grade, and concentration on the FLT, swelling properties, and drug release behaviour of floating tablets. The findings will provide insights into optimizing polymer blends to achieve desired therapeutic outcomes, advancing the field of controlled-release drug delivery systems [16-19].
MATERIALS AND METHODS
Preformulation studies [20-25]
Identification of drug
Preformulation is a group of studies which generally carried out for identification and compatibility study. It focuses on the physicochemical properties of a new drug candidate that could affect the drug performance and the development of a dosage form. Preformulation studies were generally carried out for identification and compatibility studies of API and excipients.
Melting point
Melting point is one of the identification tests for organic compounds. The melting point of the drug was determined by capillary melting point method using melting point apparatus (Tempo, India). The drug was filled in a thin-walled capillary tube with sealed one end. The capillary was then placed in melting point apparatus and the temperature of the apparatus was gradually increased. The temperature range over which the drug melts was observed.
FTIR and UV spectrophotometric analysis
The FTIR studies of Piperine were performed over the 4000– 400 cm-1 wavelength regions at a resolution of 4 cm-1. Attenuated total reflectance is employed to analyse the IR transmission spectra and trace the distinguishing peaks, sample in the ratio 1:100 is mixed with KBr for analysis by FTIR spectrophotometer. Lambda max is the wavelength of light in the ultraviolet region at which maximum absorbance is exhibited by the compound. Sample was dissolved in methanol to prepare stock solution and scan in UV spectrophotometer.
Solubility studies
The solubility studies of drug in aqueous and non-aqueous phases are the important properties during formulation consideration and also behavior and transport of drugs in the body. Equilibrium solubility was determined at room temperature, for this, systems of each solvent (DW, Methanol, Ethanol and PBS pH 7.4) were taken individually in volumetric flask and drug was added gradually in each solvent and vigorously shaken on shaker. As the saturation point was reached a pinch of drug was added to it and the flask was shaken for 15 min and placed in the flask shaker for 24 h. After 24 h it was removed and observed. Since un-dissolved drug was found it was kept for 24 h undisturbed. After 24 h, the solution was filtered and diluted suitably with reagent blank and absorbance was taken against reagent blank and recorded.
Drug-excipients compatibility studies
Drug excipients compatibility study was done by using I. R. spectroscopy different mixtures of drug and carrier were prepared and analysed by I. R. in the range of 400-4000 cm-1. Small amount of sample was taken and analysed by placing it in powder sample compartment and it was check for any interaction between drug and excipients.
Preparation of standard calibration curves
10 mg of Piperine was weighed accurately and transferred to 100 ml volumetric flask and dissolved in small amount of ethanol, after that volume was made up to 100 ml with ethanol so as to obtain stock solution of 100 µg/ml. Stock solution was taken in aliquots of 0.1 ml, 0.2 ml, up to 0.5 ml in to a series of 10 ml volumetric flasks and volume was made up to the mark with ethanol. The solutions were filtered through Whatman filter paper no. 1 and filtrate was analyzed at λmax 425 nm using a UV-visible spectrophotometer. Methanol was used as blank solution. The standard curve was plotted between absorbance and concentration.
Formulation of floating tablet
All the tablets were prepared by direct compression method. Formulations were prepared by varying drug to polymer ratio and keeping other ingredients in required quantities to make the final weight of 350 mg per tablet. Briefly, preparation of tablets involved, passing all the ingredients except magnesium stearate and talc through sieve #40 and mixing the blend in an octagonal blender for 10 min. Magnesium stearate and talc were then passed through sieve #60 and were used to lubricate the blend. The lubrication was done for 5 min. The lubricated blend was compressed into tablets using 12 mm flat faced punches.
Layout of box-behnken experimental design
A three-factor, Three-level Box–Behnken design was used for the optimization procedure using Design-Expert® 13 software (Stat-Ease, Inc., USA). The investigated factors (independent variables) were HPMC K4M (A1) content HPMC K100M (B2) and Xanthan gum content (C3). The levels for these three factors were determined from sufficient preliminary trials. The Swelling index (SI), Floating lag time (FLT) and Time required to release 90% of the drug from the tablet (T90%) were selected as dependent variables.
The statistical model:
Y = b0+b1A+b2B+b3C+b11AA+b22BB+b12AB+b23BC+b13AC+E
Table 1: Layout of box-behnken experimental design
| Independent variable | Level | Dependent variable | ||
| -1 | 0 | +1 | ||
| A: HPMC K4M | 40 | 60 | 80 | Response 1 |
| B: HPMC K 100M | 30 | 45 | 60 | Response 2 |
| C: Xanthum gum | 15 | 30 | 45 | Response 3 |
Table 2: Formulation design
| S. No. | Ingredient | PF1 | PF2 | PF3 | PF4 | PF5 | PF6 | PF7 | PF8 | PF9 | PF10 | PF11 | PF12 | PF13 | PF14 | PF15 |
| 1 | Piperine | 100 | 100 | 100 | 100 | 100 | 100 | 100 | 100 | 100 | 100 | 100 | 100 | 100 | 100 | 100 |
| 2 | HPMC K4M | 60 | 60 | 60 | 60 | 60 | 60 | 60 | 60 | 60 | 60 | 60 | 60 | 60 | 60 | 60 |
| 3 | HPMC K100M | 30 | 30 | 30 | 30 | 30 | 30 | 30 | 30 | 30 | 30 | 30 | 30 | 30 | 30 | 30 |
| 4 | Xanthum gum | 15 | 15 | 15 | 15 | 15 | 15 | 15 | 15 | 15 | 15 | 15 | 15 | 15 | 15 | 15 |
| 5 | Sodium bi carbonate | 50 | 50 | 50 | 50 | 50 | 50 | 50 | 50 | 50 | 50 | 50 | 50 | 50 | 50 | 50 |
| 6 | Citric acid | 20 | 20 | 20 | 20 | 20 | 20 | 20 | 20 | 20 | 20 | 20 | 20 | 20 | 20 | 20 |
| 7 | MCC | 70 | 70 | 70 | 70 | 70 | 70 | 70 | 70 | 70 | 70 | 70 | 70 | 70 | 70 | 70 |
| 8 | Magnesium stearate | 5 | 5 | 5 | 5 | 5 | 5 | 5 | 5 | 5 | 5 | 5 | 5 | 5 | 5 | 5 |
| Total weight | 350 | 350 | 350 | 350 | 350 | 350 | 350 | 350 | 350 | 350 | 350 | 350 | 350 | 350 | 350 |
RESULTS AND DISCUSSION
Preformulation studies
Various tests were used to analyse the organoleptic properties of Piperine. Table 4 shows results of Mayer’s test, Wagner’s test and Lambda max determination.
Fig. 1 depicts that infrared (IR) spectrum of the standard piperine sample shows a prominent absorption band between 3200–3300 cm⁻¹, which appears at 3213.75 cm⁻¹ in the sample. This band corresponds to NH stretching vibrations, confirming the presence of amide or secondary amine functional groups in the compound. Another distinct absorption band is observed within the 2900–3000 cm⁻¹ range, recorded specifically at 2940.3 cm⁻¹ for the sample. This peak is attributed to CH stretching, indicating the presence of aliphatic or aromatic C–H bonds. Additionally, a sharp absorption peak is noted in the region of 1400–1500 cm⁻¹, appearing at 1491 cm⁻¹ in the experimental data. This band corresponds to C=C stretching, which further confirms the presence of an aromatic ring structure in piperine.
Table 3: Mayer’s test, Wagner’s test
| Test | Result | Observation |
| Mayer’s Reagent Test | Light Yellowish ppt. was formed | Presence of Alkaloid |
| Wagner’s Test | Dark Brown ppt. was formed | Presence of Alkaloid |
Melting point of Piperine was determined using capillary method and it was found to be 128-130 ℃, FTIR study was performed on Drug and different polymers for determination of functional groups that will describe the identity. T
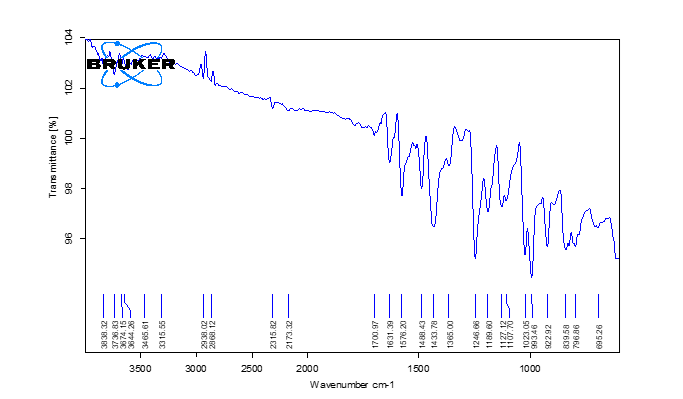
Fig. 1: IR spectra of piperine
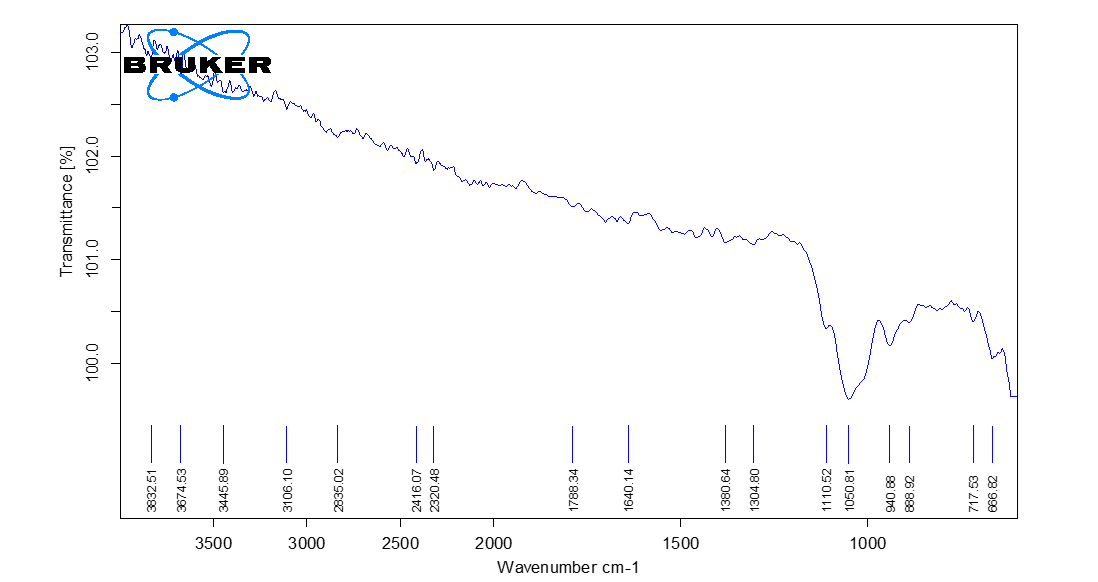
Fig. 2: IR spectra of HPMC K 4 M
Fig. 2 depicts that infrared (IR) spectral analysis of the sample HPMC K4M reveals several characteristic absorption bands corresponding to its functional groups. A broad absorption band is observed in the region of 3300–3500 cm⁻¹, appearing specifically at 3315.4 cm⁻¹ in the sample. This band is attributed to OH stretching vibrations, which confirm the presence of hydroxyl groups typically associated with cellulose derivatives such as HPMC (hydroxypropyl methylcellulose). Another absorption peak is found in the 2800–2900 cm⁻¹ range, recorded at 2879.2 cm⁻¹, representing CH stretching vibrations arising from the alkyl groups present in the polymer backbone.
Determination of lambda max
UV spectrophotometer shows maximum absorption of piperine at 345 nm
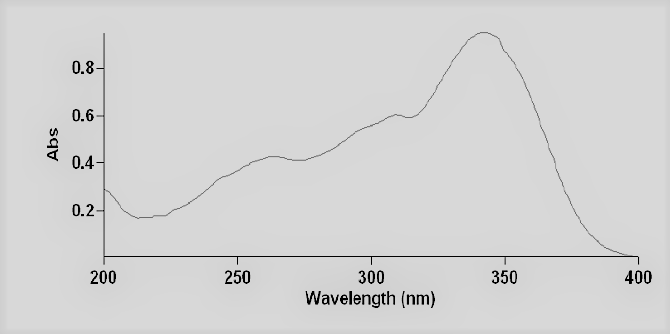
Fig. 3: Lambda max determination of Piperine, solubility determination of curcumin was done using different solvents like Ethanol, Benzene, Dimethylformamide, Acetone, Ethyl acetate and water
Table 4: Quanlitative solubility of piperine
| Element | Soluble |
| Ethanol | Soluble |
| Benzene | Soluble |
| Dimethyl Formamide | Soluble |
| Acetone | Soluble |
| Ethyl Acetate | Soluble |
| Water | Insoluble |
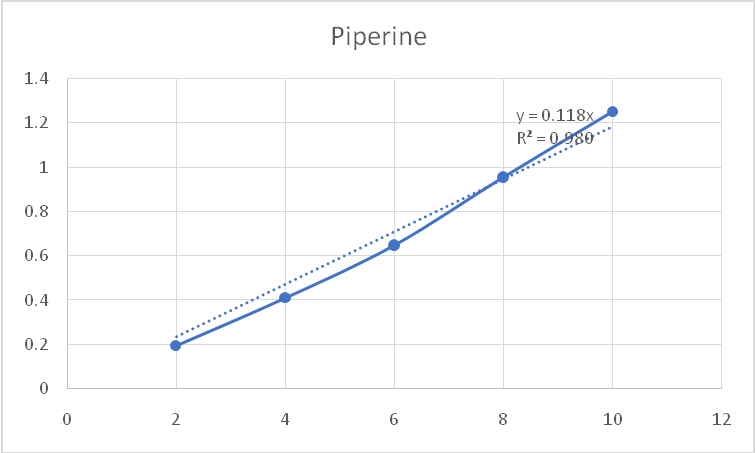
Fig. 4: Calibration curve of piperine
Table 5: Evaluation of various characteristics, such as thickness, hardness, friability, and weight variation for 15 different tablet formulations (F1 to F15)
| Formulation code | Thickness (mm) | Hardness (kg/cm²) | Friability (%) | Weight Variation (mg) |
| F1 | 3.17 ± 0.14 | 4.81 ± 0.12 | 0.83 ± 0.05 | 500 ± 0.22 |
| F2 | 3.18 ± 0.12 | 4.73 ± 0.53 | 0.81 ± 0.02 | 512 ± 0.16 |
| F3 | 3.16 ± 0.12 | 4.55 ± 0.40 | 0.86 ± 0.03 | 496 ± 0.02 |
| F4 | 3.14 ± 0.11 | 4.67 ± 0.33 | 0.83 ± 0.01 | 506 ± 0.75 |
| F5 | 3.20 ± 0.10 | 4.71 ± 0.17 | 0.81 ± 0.08 | 521 ± 0.46 |
| F6 | 3.19 ± 0.16 | 4.58 ± 0.28 | 0.82 ± 0.06 | 486 ± 0.85 |
| F7 | 3.17 ± 0.14 | 4.58 ± 0.31 | 0.81 ± 0.03 | 523 ± 0.89 |
| F8 | 3.14 ± 0.14 | 4.52 ± 0.36 | 0.86 ± 0.12 | 500 ± 0.86 |
| F9 | 3.16 ± 0.11 | 4.64 ± 0.35 | 0.84 ± 0.10 | 480 ± 1.90 |
| F10 | 3.18 ± 0.14 | 4.81 ± 0.24 | 0.81 ± 0.05 | 520 ± 1.11 |
| F11 | 3.17 ± 0.12 | 4.72 ± 0.29 | 0.81 ± 0.08 | 486 ± 0.16 |
| F12 | 3.15 ± 0.12 | 4.54 ± 0.34 | 0.86 ± 0.03 | 490 ± 1.02 |
| F13 | 3.28 ± 0.10 | 4.64 ± 0.41 | 0.82 ± 0.01 | 500 ± 0.75 |
| F14 | 3.12 ± 0.11 | 4.73 ± 0.33 | 0.84 ± 0.08 | 487 ± 0.46 |
| F15 | 3.23 ± 0.16 | 4.57 ± 0.62 | 0.86 ± 0.06 | 493 ± 1.82 |
Discussion on the influence of independent variables on the dependent variables of tablet formulations (F1 to F15)
This table presents the effects of varying three independent variables (A, B, and C) in different quantities, on the Dependent Variables: FLT (Floating Lag Time, s), SI (Swelling Index, %), and T90 (Time to 90% Drug Release, h) for 15 formulations (F1 to F15). The goal is to analyze how the quantities of the independent variables (A, B, and C) influence the tablet's performance, including its dissolution characteristics, swelling behavior, and release time.
Independent variables
A (mg): This could represent the concentration of a primary excipient or active ingredient.
B (mg): This might refer to the concentration of another excipient, stabilizer, or binder.
C (mg): Likely another excipient or component contributing to the overall tablet properties.
Each formulation varies in the amount of A, B, and C, and these differences in composition have significant impacts on the dependent variables.
Dependent variables
FLT (Falling load time in seconds)
Observation: FLT values vary from 83.4±0.954 s (F6) to 119.7±0.567 s (F12). A higher FLT indicates a slower disintegration time, which suggests that the tablets are more resistant to disintegration and thus may release the active ingredient at a slower rate.
Effect of independent variables
Increasing A seems to correlate with an increase in FLT. For example, Formulations F2 (80 mg A) and F12 (80 mg A) exhibit higher FLT (114.7 s and 119.7 s, respectively) compared to formulations with a lower concentration of A, like F6 (40 mg A), which shows a lower FLT of 83.4 s.
The levels of B and C do not appear to show a strong, consistent effect on FLT, suggesting that A may have the most significant influence on the disintegration time.
SI (Swelling index in %)
Observation: The swelling index (SI) values range from 61.9±0.624% (F11) to 99.95±0.226% (F12), which indicates the extent to which the tablets swell in the dissolution medium.
Effect of independent variables
A appears to have a modest effect on SI. The highest SI (99.95%) is observed in F12, which has the highest amount of A (80 mg) and C (45 mg). This suggests that the higher concentration of A might lead to an increase in the ability of the tablet to swell, potentially improving the release characteristics of the formulation.
B at 60 mg in formulations like F4, F7, and F12 is associated with higher SI values (e. g., 93.42% in F4 and 99.95% in F12), suggesting that higher B content may promote swelling.
C also appears to influence SI; higher levels of C (45 mg) generally result in higher swelling indices, especially when paired with high levels of A (80 mg).
T90 (Time for 90% drug release in hours)
Observation: T90 values range from 6.66±0.289 h (F9) to 10.33±0.289 h (F2), indicating the time taken for 90% of the drug to be released from the tablet. The longer the T90, the slower the drug release.
Effect of independent variables
A has a strong effect on T90. Formulations with higher concentrations of A tend to have a longer T90. For instance, F2 (80 mg A) has a T90 of 10.33 h, while F6 (40 mg A) shows a T90 of 7.66 h. This suggests that an increase in A may slow down the release of the drug.
B also plays a significant role. When B is increased (e. g., F12 with 60 mg B), the release rate tends to slow down, as reflected in the increased T90 value (10.17 h). This could indicate that B may function as a retarding agent, slowing down the dissolution process.
C appears to influence the release profile as well. Higher amounts of C (45 mg), especially when paired with higher levels of A, generally result in slower release (longer T90).
Trends and correlations
A (mg): The concentration of A consistently appears to influence all three dependent variables. Higher A concentrations tend to increase FLT (slower disintegration), improve SI (greater swelling), and extend T90 (slower drug release). This suggests that A plays a crucial role in controlling the physical properties of the tablet, particularly in terms of its disintegration, swelling, and release characteristics.
B (mg): The effect of B on the dependent variables is more variable. B influences SI positively, with higher B correlating with higher swelling indices. Additionally, an increase in B tends to slow down the drug release (longer T90), which might be due to its role as a retarding agent or binder that slows down the dissolution process.
C (mg): The impact of C is observed mainly in relation to swelling and drug release. Higher concentrations of C generally enhance the swelling index and extend the T90, suggesting that C could be contributing to the formation of a gel-like structure or matrix within the tablet, thus modulating the drug release rate.
Table 6: The influence of independent variables on the dependent variables of tablet formulations (F1 to F15)
| Formulation code | Independent variables | Dependent variables | ||||
| A (mg) | B (mg) | C (mg) | FLT (s) | SI (%) | T90 (h) | |
| F1 | 60 | 45 | 30 | 89.65 ± 0.492 | 69.63 ± 0.321 | 7.00 ± 0.550 |
| F2 | 80 | 45 | 45 | 114.7 ± 0.419 | 94.60 ± 0.794 | 10.33 ± 0.289 |
| F3 | 40 | 60 | 30 | 109.2 ± 0.124 | 89.80 ± 0.529 | 10.17 ± 0.289 |
| F4 | 80 | 60 | 30 | 112.8 ± 0.654 | 93.42 ± 0.316 | 9.83 ± 0.289 |
| F5 | 80 | 30 | 30 | 104.1 ± 0.513 | 84.23 ± 0.666 | 9.50 ± 0.500 |
| F6 | 40 | 45 | 15 | 83.40 ± 0.954 | 63.51 ± 0.447 | 7.66 ± 0.289 |
| F7 | 60 | 60 | 15 | 89.98 ± 0.511 | 70.64 ± 0.481 | 8.66 ± 0.289 |
| F8 | 60 | 45 | 30 | 88.92 ± 0.671 | 69.37 ± 0.514 | 6.83 ± 0.289 |
| F9 | 60 | 45 | 30 | 91.98 ± 0.437 | 72.70 ± 0.557 | 6.66 ± 0.289 |
| F10 | 60 | 30 | 15 | 93.10 ± 0.522 | 73.02 ± 0.225 | 8.50 ± 0.000 |
| F11 | 60 | 30 | 45 | 81.12 ± 0.630 | 61.90 ± 0.624 | 7.50 ± 0.500 |
| F12 | 60 | 60 | 45 | 119.7 ± 0.567 | 99.95 ± 0.226 | 10.17 ± 0.289 |
| F13 | 40 | 45 | 45 | 100.6 ± 0.437 | 81.79 ± 0.278 | 10.17 ± 0.289 |
| F14 | 40 | 30 | 30 | 87.72 ± 0.419 | 67.39 ± 0.575 | 8.00 ± 0.500 |
| F15 | 80 | 45 | 15 | 95.05 ± 0.492 | 75.47 ± 0.578 | 8.83 ± 0.289 |
CONCLUSION
The floating lag time (FLT) of floating tablets, defined as the time required for a tablet to float on the dissolution medium, significantly impacts gastric retention time and should be minimized to prevent premature gastric emptying. In this study, FLT ranged from 81.12±0.63 sec to 119.7±0.567 sec, with higher polymer concentrations associated with prolonged FLT due to delayed hydration and gel formation, which traps gas and induces buoyancy. Tablets containing HPMC K100M exhibited the highest FLT compared to those with xanthan gum or HPMC K4M, attributed to the greater hydrophilicity of HPMC K100M. This polymer's rapid hydration forms a dense gel layer that reduces medium penetration and enhances floating stability. Swelling-controlled systems, such as those employing HPMC and xanthan gum, rely on polymer hydration, swelling, and gel formation to regulate drug release. HPMC, particularly high-viscosity grades like K100M, demonstrates superior water uptake, gel formation, and controlled drug release, although xanthan gum enhances hydration and gel stability due to its high hydrophilicity. Polymer blends of HPMC and xanthan gum optimize drug release profiles, leveraging the rapid hydration of xanthan gum and the controlled swelling of HPMC to achieve extended release. Higher polymer viscosity and concentration increased the drug's diffusional path length, reducing release rates and prolonging T90% values, which ranged from 7.0±0.55 h to 10.33±0.289 h. Thus, combining natural and synthetic polymers enhances the biocompatibility and performance of controlled-release formulations.
FUNDING
Nil
AUTHORS CONTRIBUTIONS
All authors have contributed equally
CONFLICT OF INTERESTS
Declared none
REFERENCES
Jithan A. Oral drug delivery technology. Pharma book syndicate; 2007. p. 176-7.
Lee PI, Good William R. Controlled-release technology pharmaceutical applications. American Chemical Society; 1997. p. 1-2.
Kim CJ. Controlled release dosage form design. Technomic Publishing Company; 2000. p. 1-10.
Vyas SP, Khar RK. Controlled drug delivery: concepts and advances. 1st ed Vallabh Prakashan; 2002. p. 345-76.
Lee VH, Robinson JR. Sustained and controlled release drug delivery system. Mercel Decker; 1978:24-36.
Chein YW. Oral drug delivery system in novel drug delivery system. Marcel Dekker; 1992. p. 139-96.
Hirtz J. The git absorption of drugs in man: a review of current concepts and methods of investigation. Br J Clin Pharmacol. 1985;19(Suppl 2):77-83. doi: 10.1111/j.1365-2125.1985.tb02746.x.
Shiva Kumar HG, Gowda V, Kumar TM. Floating controlled drug delivery systems for prolonged gastric residence: a review. Indian J Pharm Educ. 2004;38(4):172-9.
Arora S, Ali J, Ahuja A, Khar RK, Baboota S. Floating drug delivery systems: a review. AAPS PharmSciTech. 2005;6(3):E372-90. doi: 10.1208/pt060347, PMID 16353995.
Yeole PG, Khan S, Patel VF. Floating drug delivery systems: need and development. Indian J Pharm Sci. 2005;67(3):265-72.
Singh BN, Kim KH. Floating drug delivery systems: an approach to oral controlled drug delivery via gastric retention. J Control Release. 2000;63(3):235-59. doi: 10.1016/S0168-3659(99)00204-7, PMID 10601721.
Hwang SJ, Park H, Park K. Gastric retentive drug-delivery systems. Crit Rev Ther Drug Carrier Syst. 1998;15(3):243-84. PMID 9699081.
Fell JT, Whitehead L, Collett JH. Prolonged gastric retention using floating dosage forms. Pharm Technol. 2000;24(3):82-90.
Reddy LH, Murthy RS. Floating dosage systems in drug delivery. Crit Rev Ther Drug Carrier Syst. 2002;19(6):553-85. doi: 10.1615/CritRevTherDrugCarrierSyst.v19.i6.20, PMID 12822735.
Deshpande AA, Shah NH, Rhodes CT, Malick W. Development of a novel controlled-release system for gastric retention. Pharm Res. 1997;14(6):815-9. doi: 10.1023/A:1012171010492, PMID 9210203.
Ch’Ng HS, Park H, Kelly P, Robinson JR. Bioadhesive polymers as platforms for oral controlled drug delivery II: synthesis and evaluation of some swelling water-insoluble bioadhesive polymers. J Pharm Sci. 1985;74(4):399-405. doi: 10.1002/jps.2600740407, PMID 3998999.
Sathish D. Preparation and evaluation of novel expandable drug delivery system. Br J Pharm Res. 2013;3(4):1079-93. doi: 10.9734/BJPR/2013/4891.
Sathish D, Himabindu S, Kumar YS, Shayeda, Rao YM. Floating drug delivery systems for prolonging gastric residence time: a review. Curr Drug Deliv. 2011;8(5):494-510. doi: 10.2174/156720111796642273, PMID 21696354.
Vinay Kumar K, Jagan Mohan S, Sunil R, Chandra Mohan E, Bala Raesha Chary R, Madhusudan Rao Y. Floating drug delivery systems: a review. Curr Trends Biotechnol Pharm. 2010;4(2):610-47.
Sheth PR, Tossounian J. The hydrodynamically balanced system (Hbs™): a novel drug delivery system for oral use. Drug Dev Ind Pharm. 1984;10(2):313-39. doi: 10.3109/03639048409064653.
Baumgartner S, Kristl J, Vrecer F, Vodopivec P, Zorko B. Optimisation of floating matrix tablets and evaluation of their gastric residence time. Int J Pharm. 2000;195(1-2):125-35. doi: 10.1016/S0378-5173(99)00378-6, PMID 10675690.
Hwang SJ, Park H, Park K. Gastric retentive drug-delivery systems. Crit Rev Ther Drug Carrier Syst. 1998;15(3):243-84. PMID 9699081.
Park K, Robinson JR. Bioadhesive polymers as platforms for oral-controlled drug delivery: method to study bioadhesion. Int J Pharm. 1984;19(2):107-27. doi: 10.1016/0378-5173(84)90154-6.
Haas J, Lehr CM. Developments in the area of bioadhesive drug delivery systems. Expert Opin Biol Ther. 2002;2(3):287-98. doi: 10.1517/14712598.2.3.287, PMID 11890868.
Reddy LH, Murthy RS. Floating dosage systems in drug delivery. Crit Rev Ther Drug Carrier Syst. 2002;19(6):553-85. doi: 10.1615/CritRevTherDrugCarrierSyst.v19.i6.20, PMID 12822735.