
Int J Curr Pharm Res, Vol 18, Issue 1, 93-96Original Article
CORRELATION OF SERUM URIC ACID WITH LIPID PROFILE AND GLYCEMIC CONTROL IN TYPE 2 DIABETES MELLITUS
AMIT SINGH, RAMAN RAHI, CHANDAN KUMAR, PRABHAT KUMAR SINGH*, SANTOSH KUMAR
Department of Biochemistry, Nalanda Medical College, Patna, Bihar, India
*Corresponding author: Prabhat Kumar Singh; *Email: prabhatt26@yahoo.com
Received: 06 Oct 2025, Revised and Accepted: 26 Nov 2025
ABSTRACT
Objective: Type 2 diabetes mellitus (T2DM) is often associated with metabolic abnormalities, including dyslipidemia and hyperuricemia. Recent studies suggest that elevated serum uric acid (SUA) levels may correlate with poor glycemic control and adverse lipid profiles. This study aimed to evaluate the relationship between SUA, lipid parameters, and glycemic markers among T2DM patients.
Methods: A cross-sectional study was conducted on 150 patients with T2DM. Fasting blood samples were analyzed for serum uric acid, fasting plasma glucose (FPG), glycated hemoglobin (HbA1c), and lipid profile, including total cholesterol (TC), triglycerides (TG), high-density lipoprotein (HDL), and low-density lipoprotein (LDL). Pearson correlation was used to assess relationships between SUA and biochemical variables.
Results: mean SUA was 6.2±1.1 mg/dl. SUA showed a positive correlation with triglycerides (r = 0.39, p<0.001) and LDL (r = 0.29, p = 0.002), and a negative correlation with HDL (r = –0.28, p = 0.004). A weak positive correlation was observed between SUA and HbA1c (r = 0.16, p = 0.05). Patients with poor glycemic control (HbA1c>7%) had higher SUA levels compared to those with good control.
Conclusion: Elevated serum uric acid levels are associated with dyslipidemia and poor glycemic control in T2DM patients. Routine monitoring of SUA may provide additional insight into metabolic risk and cardiovascular complications.
Keywords: T2DM, Uric acid, Glycemic control, HDL-c, TG, LDL-c
© 2026 The Authors. Published by Innovare Academic Sciences Pvt Ltd. This is an open access article under the CC BY license (https://creativecommons.org/licenses/by/4.0/)
DOI: https://dx.doi.org/10.22159/ijcpr.2026v18i1.8042 Journal homepage: https://innovareacademics.in/journals/index.php/ijcpr
INTRODUCTION
Type 2 diabetes mellitus (T2DM) is a chronic, progressive metabolic disorder characterized by impaired insulin secretion, insulin resistance, and persistent hyperglycemia. It is one of the leading causes of morbidity and mortality globally and poses a major burden on healthcare systems due to its chronic complications involving cardiovascular, renal, and nervous systems [1]. According to the International Diabetes Federation (IDF 2024), over 537 million adults worldwide are living with diabetes, with India contributing significantly to this global load, earning the title “diabetes capital of the world” [2]. This rapid epidemiological rise underscores the importance of understanding metabolic disturbances associated with T2DM that amplify the risk of complications.
Beyond hyperglycemia, T2DM is frequently accompanied by dyslipidemia and hyperuricemia, both of which play crucial roles in the development of cardiovascular disease (CVD) [3]. Diabetic dyslipidemia typically presents as a triad of elevated triglycerides (TG), low levels of high-density lipoprotein cholesterol (HDL-C), and a preponderance of small, dense low-density lipoprotein (LDL) particles [4]. These lipid abnormalities accelerate atherosclerosis and contribute to endothelial dysfunction, thereby increasing cardiovascular morbidity. Serum uric acid (SUA), the terminal oxidation product of purine metabolism, has traditionally been viewed as a benign waste metabolite. However, in recent years, it has been increasingly recognized as a biologically active molecule implicated in oxidative stress, endothelial dysfunction, and insulin resistance [5, 6]. Elevated SUA levels, or hyperuricemia, can reduce endothelial nitric oxide bioavailability, impair vasodilation, and promote systemic inflammation [7]. These pathophysiological mechanisms link SUA not only to gout but also to obesity, hypertension, and insulin resistance, key components of the metabolic syndrome [8]. The interaction between SUA and insulin resistance is bidirectional. Hyperinsulinemia reduces renal uric acid excretion, resulting in SUA accumulation, while elevated SUA may exacerbate insulin resistance through oxidative and inflammatory pathways [9, 10]. This creates a metabolic feedback loop that promotes both hyperglycemia and dyslipidemia. SUA has also been shown to stimulate hepatic lipogenesis, increasing VLDL secretion and plasma triglyceride levels, while reducing HDL cholesterol [11, 12]. Consequently, hyperuricemia contributes to the atherogenic lipid profile frequently observed in diabetic patients. Several epidemiological and clinical studies have confirmed these interrelationships. Johnson et al. (2013) proposed that elevated SUA might play a causal role in the development of diabetes and obesity through fructose-induced metabolic pathways [13]. Similarly, Lv et al. (2013) in a meta-analysis reported that high SUA significantly increased the risk of developing type 2 diabetes. Xiong et al. (2019) observed that uric acid contributes to endothelial dysfunction and oxidative stress, exacerbating the progression of diabetes-related vascular complications [14, 15]. Other Indian studies have demonstrated similar findings, with Kumar et al. (2022) showing a significant positive correlation between SUA and triglyceride levels and a negative correlation with HDL cholesterol in patients with T2DM [16]. Despite global research, the relationship between SUA, lipid profile, and glycemic control remains incompletely characterized in Indian populations. Genetic factors, dietary habits rich in carbohydrates, sedentary lifestyle, and environmental stressors contribute uniquely to the Indian metabolic phenotype [17]. Moreover, regional variations in diet, renal function, and healthcare access influence both uric acid levels and diabetic complications [18]. Therefore, evaluating the link between SUA, lipid abnormalities, and glycemic markers in Indian patients may provide valuable insight for early identification of individuals at higher cardiometabolic risk. This study was thus undertaken to assess the correlation between serum uric acid, lipid profile, and glycemic control in patients with type 2 diabetes mellitus. Understanding these associations can help clinicians use SUA as a simple, inexpensive biomarker to predict dyslipidemia and glycemic derangement, potentially aiding in the prevention of cardiovascular complications in diabetic populations.
MATERIALS AND METHODS
This cross-sectional observational study was conducted in the Department of Biochemistry, in collaboration with the Department of Medicine, at Nalanda Medical College, Patna, Bihar, from January to December 2024. The study included 150 diagnosed cases of type 2 diabetes mellitus (T2DM), aged 35–70 y, selected using simple random sampling.
Inclusion and exclusion criteria
Inclusion: Diagnosed T2DM patients aged 35–70 y with disease duration ≥1 y. Exclusion: Patients with renal, hepatic, thyroid disorders, gout, malignancy, alcohol abuse, or those on drugs affecting uric acid or lipid metabolism (e. g., diuretics, corticosteroids, statins, allopurinol). Written informed consent was taken from all participants as per Helsinki Declaration (2013).
Sample collection and biochemical analysis
After overnight fasting (10–12 h), 5 ml venous blood was collected under aseptic conditions:
Fluoride vial – fasting plasma glucose (FPG) by GOD–POD method.
Plain tube – serum uric acid (SUA) by Uricase–PAP method and lipid profile by enzymatic colorimetric methods.
EDTA vial – HbA1c by ion-exchange resin or HPLC.
Lipid parameters included total cholesterol (TC), triglycerides (TG), HDL-C, and LDL-C (calculated using Friedewald’s formula).
Grouping of subjects
Based on glycemic control
-
Group A: HbA1c ≤7% (good control)
-
Group B: HbA1c>7% (poor control)
STATISTICAL ANALYSIS
Data were analyzed using SPSS version 26.0 (IBM Corp, USA). Continuous variables were expressed as mean±SD. Intergroup comparisons were performed using the Student’s t-test, and correlations were assessed using Pearson’s correlation coefficient (r). A p-value<0.05 was considered statistically significant. Graphs were prepared using GraphPad Prism 9 and Microsoft Excel.
RESULTS
A total of 150 patients with type 2 diabetes mellitus (T2DM) were included in this study. The mean age of the participants was 54.6±9.8 y, with a male predominance (60%). Most of the patients belonged to the 45–60 y age group. The mean BMI of the cohort was 26.8±3.1 kg/m², suggesting that a large proportion of patients were overweight. The mean fasting blood sugar (FBS) and HbA1c values were 162.4±45.6 mg/dl and 8.2±1.4%, respectively, reflecting poor glycemic control in the majority of the subjects. The mean serum uric acid (SUA) level was 6.4±1.2 mg/dl.
Table 1: Baseline demographic and biochemical characteristics of study participants
| Parameter | Mean±SD |
| Age (years) | 54.6±9.8 |
| Male (%) | 60% |
| Female (%) | 40% |
| BMI (kg/m²) | 26.8±3.1 |
| FBS (mg/dl) | 162.4±45.6 |
| HbA1c (%) | 8.2±1.4 |
| SUA (mg/dl) | 6.4±1.2 |
As shown in table 1, the study population demonstrated moderately elevated fasting glucose and HbA1c levels. The mean SUA value (6.4 mg/dl) was above the normal reference range for both genders, suggesting a high prevalence of hyperuricemia among diabetic patients. The gender distribution also revealed that male participants had slightly higher SUA values compared to females, though the difference was not statistically significant.
The mean lipid profile values observed were as follows: total cholesterol (TC) = 192.6±36.2 mg/dl, triglycerides (TG) = 178.4±44.5 mg/dl, HDL-C = 40.2±7.6 mg/dl, LDL-C = 112.5±31.8 mg/dl, and VLDL-C = 35.7±9.4 mg/dl. The majority of patients had elevated triglycerides and LDL-C levels with low HDL-C, reflecting the presence of atherogenic dyslipidemia.
Table 2 presents the correlation coefficients between serum uric acid and various biochemical parameters. SUA showed a statistically significant positive correlation with triglycerides (r = 0.42, p<0.001) and LDL-C (r = 0.36, p<0.01), indicating that as SUA levels increase, both TG and LDL-C levels tend to rise. Conversely, a significant negative correlation was observed between SUA and HDL-C (r =-0.31, p<0.05), implying that higher uric acid levels are associated with reduced protective HDL cholesterol.
A mild but significant positive correlation was found between SUA and HbA1c (r = 0.29, p<0.05), suggesting that patients with poor glycemic control also tend to have higher uric acid levels. This finding supports the hypothesis that hyperuricemia may contribute to impaired insulin sensitivity and glucose metabolism.
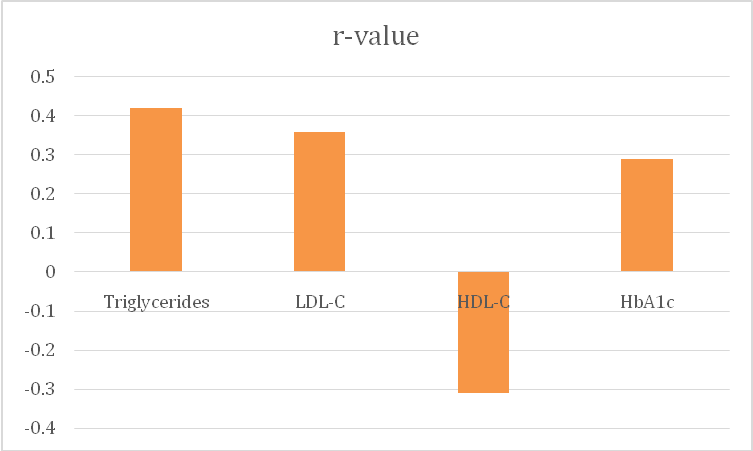
Fig. 1: Correlation coefficients (r) between serum uric acid and lipid/glycemic parameters
Table 2: Correlation of serum uric acid with lipid profile and glycemic parameters
| Parameter | r-value | p-value |
| Triglycerides | 0.42 | <0.001 |
| LDL-C | 0.36 | <0.01 |
| HDL-C | -0.31 | <0.05 |
| HbA1c | 0.29 | <0.05 |
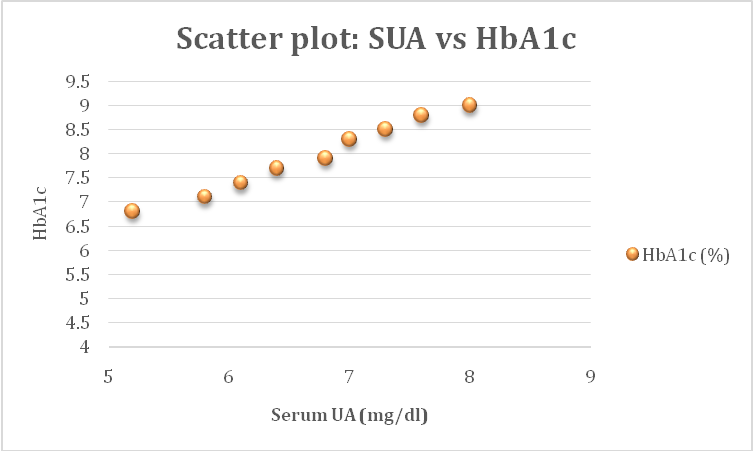
Fig. 2: Scatter plot showing positive correlation between serum uric acid and HbA1c levels
Fig. 1 illustrates the strength and direction of correlations between SUA and metabolic parameters. Triglycerides exhibited the strongest positive correlation with SUA, followed by LDL-C and HbA1c, while HDL-C showed a negative relationship. Fig. 2 demonstrates the scatter relationship between SUA and HbA1c, confirming that individuals with higher SUA levels also tend to have higher HbA1c values.
Overall, these findings suggest that elevated SUA is not only linked to lipid derangements but also reflects poor long-term glycemic control. The clustering of hyperuricemia, dyslipidemia, and hyperglycemia may represent a common metabolic milieu contributing to insulin resistance and cardiovascular risk in T2DM patients.
DISCUSSION
The present study was undertaken to evaluate the relationship between serum uric acid (SUA), lipid profile, and glycemic control among patients with type 2 diabetes mellitus (T2DM). The findings demonstrated that elevated SUA levels were significantly correlated with higher triglyceride (TG) and total cholesterol (TC) levels and inversely correlated with high-density lipoprotein (HDL-C). A positive correlation between SUA and glycated hemoglobin (HbA1c) was also noted, indicating an association between poor glycemic control and hyperuricemia.
Hyperuricemia is frequently observed in T2DM patients, and its pathophysiological role extends beyond being a simple marker of purine metabolism. Uric acid acts as both an antioxidant and a pro-oxidant depending on its concentration and microenvironment [9]. At elevated levels, SUA can induce oxidative stress, impair endothelial nitric oxide bioavailability, and promote inflammation, all of which contribute to insulin resistance and vascular dysfunction [9]. These mechanisms partly explain the observed link between SUA and poor glycemic control in our study population.
Our findings are in agreement with several previous studies. A study by Kumar et al. [16] reported a significant positive correlation between SUA and HbA1c in T2DM patients, suggesting that higher SUA may reflect suboptimal glycemic control. Similarly, Yadav et al. [17] demonstrated that SUA was higher in diabetic subjects compared to controls and correlated positively with fasting blood glucose (FBG) and HbA1c. These findings indicate that uric acid may be a surrogate marker for insulin resistance and chronic hyperglycemia.
With respect to lipid parameters, the present study observed significant positive correlations between SUA and triglycerides as well as total cholesterol, and a negative correlation with HDL-C. This pattern is consistent with diabetic dyslipidemia, characterized by hypertriglyceridemia, low HDL-C, and variable LDL changes [4]. Hyperinsulinemia associated with insulin resistance enhances hepatic very-low-density lipoprotein (VLDL) production and inhibits lipoprotein lipase activity, leading to accumulation of TG-rich lipoproteins. Elevated SUA further exacerbates this metabolic disturbance by promoting hepatic fat synthesis and impairing lipid oxidation [10].
Comparable results were reported by Singh et al. [18] who found that SUA levels correlated positively with triglycerides and LDL-C, and inversely with HDL-C among diabetic patients. Similarly, studies by Choi and Ford [7] and Chen et al. [11] have demonstrated that hyperuricemia is an independent risk factor for metabolic syndrome and atherosclerosis in T2DM. Thus, SUA can be viewed not merely as a biochemical byproduct but as a metabolic signal linking glucose and lipid derangements.
Interestingly, our study also found that patients with poor glycemic control (HbA1c>8%) had higher SUA and triglyceride levels compared to those with controlled diabetes. This observation is consistent with previous research suggesting that both uric acid and lipid abnormalities tend to worsen with increasing duration and severity of diabetes [11]. Chronic hyperglycemia induces oxidative stress and renal dysfunction, reducing uric acid excretion and thereby increasing SUA levels [11]. Moreover, insulin resistance reduces renal uric acid clearance through upregulation of URAT1 transporters in the proximal tubules, further aggravating hyperuricemia [13].
While uric acid may have protective antioxidant roles at physiological concentrations, persistent hyperuricemia seems to play a detrimental role in the diabetic milieu. Experimental studies suggest that uric acid may activate the renin–angiotensin system and cause endothelial injury, contributing to hypertension and nephropathy-both common complications of T2DM [5, 12]. These findings support the hypothesis that monitoring and managing SUA levels could be beneficial in improving cardiovascular and metabolic outcomes in diabetic patients.
Our study contributes to the growing body of evidence linking SUA with both lipid abnormalities and glycemic status. However, some studies have yielded contradictory results. For instance, Lv et al. [15] found that SUA was inversely related to HbA1c in certain subgroups, possibly due to gender differences, variations in renal handling of uric acid, or confounding by diet and medications. These discrepancies highlight the need for larger multicentric studies to clarify the causal relationship.
The clinical implications of our findings are significant. Routine estimation of SUA in T2DM patients may help identify individuals at higher risk for dyslipidemia and cardiovascular disease. Early intervention through lifestyle modification, improved glycemic control, and possibly uric acid–lowering therapy (such as allopurinol or febuxostat) may be beneficial, though further interventional studies are warranted to confirm these benefits.
LIMITATION
The present study had certain limitations. Being a cross-sectional design, it cannot establish a causal relationship between SUA and lipid or glycemic parameters. The sample size was modest, and dietary factors, medications like statins or uricosuric drugs, and renal function status could influence SUA levels. Future studies with larger sample sizes and longitudinal follow-up are needed to better understand temporal associations and potential mechanistic pathways.
CONCLUSION
In conclusion, this study found a significant correlation between serum uric acid, lipid profile, and glycemic control among patients with type 2 diabetes mellitus. Elevated SUA levels were associated with increased triglycerides and total cholesterol, lower HDL-C, and poorer glycemic control. These findings suggest that SUA could serve as an important biochemical marker reflecting metabolic risk in T2DM. Integrating SUA measurement into routine diabetic monitoring may provide additional insights for comprehensive metabolic risk assessment and management.
FUNDING
Nil
AUTHORS CONTRIBUTIONS
All authors have contributed equally
CONFLICT OF INTERESTS
Declared none
REFERENCES
American Diabetes Association Professional Practice Committee. Introduction and methodology: standards of care in diabetes-2024. Diabetes Care. 2024;47(Suppl 1):S1-4. doi: 10.2337/dc24-SINT, PMID 38078587.
International Diabetes Federation. IDF diabetes atlas. 10th ed. Brussels, Belgium: IDF; 2024.
Grundy SM. Metabolic syndrome pandemic. Arterioscler Thromb Vasc Biol. 2008;28(4):629-36. doi: 10.1161/ATVBAHA.107.151092, PMID 18174459.
Taskinen MR. Diabetic dyslipidaemia: from basic research to clinical practice. Diabetologia. 2003;46(6):733-49. doi: 10.1007/s00125-003-1111-y, PMID 12774165.
Feig DI, Kang DH, Johnson RJ. Uric acid and cardiovascular risk. N Engl J Med. 2008;359(17):1811-21. doi: 10.1056/NEJMra0800885, PMID 18946066.
Li C, Hsieh MC, Chang SJ. Metabolic syndrome diabetes and hyperuricemia. Curr Opin Rheumatol. 2013;25(2):210-6. doi: 10.1097/BOR.0b013e32835d951e, PMID 23370374.
Choi HK, Ford ES. Prevalence of the metabolic syndrome in individuals with hyperuricemia. Am J Med. 2007;120(5):442-7. doi: 10.1016/j.amjmed.2006.06.040, PMID 17466656.
Grayson PC, Kim SY, La Valley M, Choi HK. Hyperuricemia and incident hypertension: a systematic review and meta-analysis. Arthritis Care Res (Hoboken). 2011;63(1):102-10. doi: 10.1002/acr.20344, PMID 20824805.
Sautin YY, Johnson RJ. Uric acid: the oxidant–antioxidant paradox. Nucleosides, Nucleotides Nucleic Acids. 2008;27(6):608-19. doi: 10.1080/15257770802138558, PMID 18600514.
Nakagawa T, Hu H, Zharikov S, Tuttle KR, Short RA, Glushakova O. A causal role for uric acid in fructose-induced metabolic syndrome. Am J Physiol Renal Physiol. 2006;290(3):F625-31. doi: 10.1152/ajprenal.00140.2005, PMID 16234313.
Chen L, Yu S, Zhu Y, Zhang X, Luo Y, Wang L. Association between serum uric acid and metabolic syndrome: a meta-analysis. Clin Nutr. 2019;38(1):193-9. doi: 10.1016/j.clnu.2018.01.027.
Tsouli SG, Karagiannis A, Zachariadou T, Chrysostomou E, Liakos A, Papadakis J. The role of uric acid in cardiovascular risk. Curr Med Res Opin. 2006;22(12):235-42. doi: 10.1185/030079906X124327.
Johnson RJ, Nakagawa T, Sanchez Lozada LG, Shafiu M, Sundaram S, Le M. Sugar uric acid and the etiology of diabetes and obesity. Diabetes. 2013;62(10):3307-15. doi: 10.2337/db12-1814, PMID 24065788.
Xiong Q, Liu J, Xu Y. Effects of uric acid on diabetes mellitus and its chronic complications. Int J Endocrinol. 2019;2019:9691345. doi: 10.1155/2019/9691345, PMID 31737070.
LV Q, Meng XF, He FF, Chen S, Su H, Xiong J. High serum uric acid and increased risk of type 2 diabetes: a systemic review and meta-analysis of prospective cohort studies. PLOS One. 2013;8(2):e56864. doi: 10.1371/journal.pone.0056864, PMID 23437258.
Kumar S, Mondal H, Lata M, Behera JK, Priyadarshini B. Correlation of serum uric acid with lipid profile in patients with type 2 diabetes mellitus. J Clin Diagn Res. 2022;16(4):BC05-9. doi: 10.4103/jfmpc.jfmpc_2131_21.
Kumar S, Sharma R, Gupta A, Verma P. Serum uric acid: a potential marker of metabolic syndrome in type 2 diabetes. J Assoc Physicians India. 2018;66(11):30-4.
Uric acid as an emerging biomarker in metabolic and cardiovascular diseases in South Asians. Indian Heart J. 2020;72(3):185-90. doi: 10.1016/j.ihj.2019.11.200.