
Int J Curr Pharm Res, Vol 18, Issue 2, 129-134Original Article
EVALUATION OF PRESCRIPTION PRACTICES IN THE MEDICINE WARD OF A TERTIARY CARE TEACHING HOSPITAL IN WEST BENGAL: AN OBSERVATIONAL STUDY
SAIKAT SANNIGRAHI1*, TANUSREE MONDAL2, RAJARSHI BISWAS3, ARUNAVA BISWAS4, SUHRITA PAUL5
1,2,4Department of Pharmacology, Barasat Government Medical College and Hospital, Barasat, West Bengal, India. 3Indian Statistical Institute, Kolkata, West Bengal, India. 5Barasat Government Medical College and Hospital, Barasat, West Bengal, India
*Corresponding author: Saikat Sannigrahi; *Email: drsaikat90@gmail.com
Received: 12 Nov 2025, Revised and Accepted: 07 Jan 2026
ABSTRACT
Objective: Rational prescribing is crucial for ensuring patient safety, optimizing therapeutic outcomes and minimizing healthcare costs. Irrational prescription practices remain a major concern, particularly the inappropriate use of antimicrobials. Prescription audit serves as a key tool to assess and improve prescribing behaviour, ensuring adherence to standard treatment guidelines. This study aimed to assess the prescribing patterns with special emphasis on the use of antimicrobials and evaluate the rationality of prescriptions in relation to standard treatment guidelines and the principles of essential medicines use.
Methods: A cross-sectional, observational study was conducted at Barasat Government Medical College and Hospital over three months. A total of 365 prescriptions were collected through simple random sampling from the medicine wards and hospital records, of which 334 were eligible for analysis. Prescriptions were evaluated using WHO core drug use indicators, and data were analysed descriptively using Microsoft Excel 2021.
Results: Generic prescribing was observed in 100% of prescriptions, and 91.3% of drugs were from the National List of Essential Medicines (2022). The average number of drugs per prescription was 5.51, indicating moderate polypharmacy. Antibiotics were prescribed in 0.76 prescriptions reflecting cautious antimicrobial use. Only 35.04% of prescriptions documented a diagnosis, and patient advice was recorded in just 5.39%. The use of injectable formulations (average 4.27/prescription) was relatively high.
Conclusion: Prescribing practices largely adhered to rational drug use principles, but areas such as diagnostic documentation, patient counselling, and antimicrobial stewardship require strengthening. Regular audits and training are recommended to further enhance rational pharmacotherapy.
Keywords: Prescription audit, Rational drug use, WHO prescribing indicators, Essential medicines, Drug utilization, Generic prescribing
© 2026 The Authors. Published by Innovare Academic Sciences Pvt Ltd. This is an open access article under the CC BY license (https://creativecommons.org/licenses/by/4.0/)
DOI: https://dx.doi.org/10.22159/ijcpr.2026v18i2.8080 Journal homepage: https://innovareacademics.in/journals/index.php/ijcpr
INTRODUCTION
Rational prescribing is a fundamental component of quality healthcare and patient safety. It ensures that patients receive medications appropriate to their clinical needs, in doses that meet their individual requirements, for an adequate duration, and at the lowest cost to them and the community [1]. However, irrational prescribing remains a global concern, contributing to adverse drug reactions, antimicrobial resistance, increased healthcare costs, and poor patient outcomes [2]. Antimicrobial misuse, in particular, has emerged as a major public health threat due to the rapid spread of antimicrobial resistance (AMR) [3].
Prescription audit is a valuable tool for evaluating prescribing patterns and promoting rational drug use. It involves a systematic review of prescriptions to identify and correct irrational practices, ultimately improving the quality of healthcare delivery [4]. Inadequate prescription audits in healthcare facilities hinder early detection of such trends and prevent corrective interventions. Regular and systematic auditing of prescriptions can identify irrational antimicrobial use, promote adherence to standard treatment guidelines, and guide prescriber education [4]. Strengthening prescription audit mechanisms is therefore essential to optimize antibiotic stewardship, preserve drug efficacy, and curb the escalating threat of antimicrobial resistance. Addressing these gaps through systematic prescription audits can help ensure safe, effective, and evidence-based medical care, optimize drug utilization, and strengthen the overall rational pharmacotherapy practices within the healthcare system of West Bengal.
In a mixed-method survey of prescribers and dispensers in Tanzania, only 31.5% of prescribers held positive attitudes toward appropriate antibiotic use, despite 81.5% showing adequate knowledge [5]. A cross-sectional online questionnaire study of 613 prescribers in Jordan found that while knowledge on effective antibiotic use was high (>90%), only 62.2% knew about the spread of antibiotic resistance [6]. A multicentric KAP study of Indian clinicians (n =701) across medical and surgical disciplines found that while knowledge of antimicrobial resistance (AMR) was relatively high, there were attitudinal and practice gaps in antimicrobial prescribing (e. g., perceptions about antibiotic use, selection in specific settings) suggesting that knowledge alone did not translate into rational prescribing behaviour [7]. Addressing these gaps through targeted interventions such as educational programs and feedback mechanisms can significantly improve prescribing practices.
The Government of West Bengal has recognized the need to institutionalize prescription audits as part of its quality assurance framework in public healthcare facilities. Through the outcome of this study we want to focus on improving therapeutic outcomes, reduce irrational drug use, and strengthen the overall quality of healthcare delivery and build institutional capacity through training and sensitization of healthcare providers. Therefore, the proposed study aimed to assess the prescribing patterns in this hospital with special emphasis on the use of antimicrobials and also to evaluate the rationality of prescriptions in relation to standard treatment guidelines and the principles of essential medicines use.
MATERIALS AND METHODS
This study was employed in a cross-sectional, observational design to assess prescription practices in both the male and female Medicine wards of the hospital, as well as in the hospital medical record section of Barasat Government Medical College and Hospital (BGMCH), a peripheral tertiary care facility in West Bengal. Over the course of three months, from June to August 2025, the department of pharmacology faculty carried out the study with support from the local college administration. The flow of conduct of the study is depicted in fig. 1.
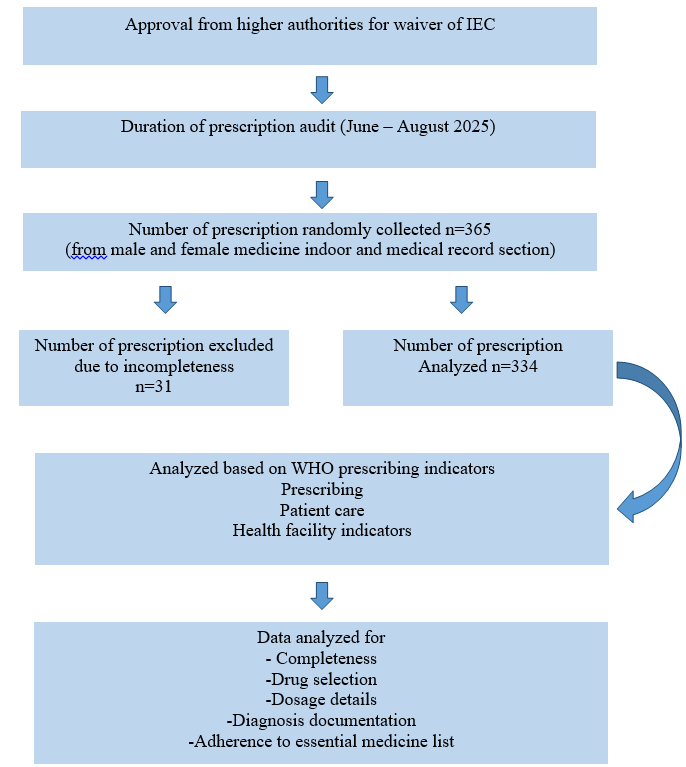
Fig. 1: Flow chart of the study
Since it was a non-interventional study, no direct patient interaction occurred, and only prescriptions were collected and evaluated. Therefore, ethical approval was waived off for this study. The selection of wards ensured diversity in prescribing habits and allowed for a more comprehensive understanding of drug use practices across genders and clinical contexts. Prescriptions from outside the study period, those that did not contain any drugs, were excluded.
Sample size and sampling method
A total of 365 prescriptions were randomly collected following simple randomization during the study period. Prescriptions were obtained directly from the wards both male and female and from archived patient medical records in the hospital's record section to ensure representative data from both current and past clinical encounters. Prescriptions that were legible, complete, and written during and before the study period were includedin the study. Prescriptions which were absolutely illegible and having any missing page(s) from the bed head ticket were excluded.
Data collection and evaluation tools
The prescriptions were analysed using the WHO core drug use indicators. These indicators are categorized into three major groups:
• Prescribing Indicators
• Patient Care Indicators
• Health-Facility Indicators
Data collection and evaluation tools
The prescriptions were analyzed using the WHO core drug use indicators:
• Average number of drugs per encounter
• Percentage of drugs prescribed by generic name
• Percentage of encounters with an antibiotic prescribed
• Percentage of encounters with an injection prescribed
• Percentage of drugs prescribed from the Essential Drugs List (EDL)
• Patient Care Indicators included (if applicable, depending on available data)
• Percentage of drugs actually dispensed
• Percentage of drugs adequately labeled
• Patients’ knowledge of correct dosage
• Health-Facility Indicators (if available from hospital records)
• Availability of a copy of the Essential Drugs List or formulary
• Availability of key drugs in stock
Statistical analysis
Data collected from the prescriptions were tabulated and analyzed quantitatively. Descriptive statistics (such as mean, percentage, and frequency) were used to evaluate each indicator. The findings were compared against WHO-recommended standards to assess the rationality of drug use in the hospital setting.
RESULTS
The prescription audit at BGMCH involved collecting a total of n= 365 prescriptions. Out of that n= 31 prescriptions were excluded due to incompleteness. Thus, n= 334 prescriptions were ultimately eligible for audit.
Legibility and documentation quality
Out of the total prescriptions analysed, 311 (93.11%) were found to be adequately legible, meaning that the handwriting, abbreviations, and overall presentation were clear enough to avoid misinterpretation by pharmacists or other healthcare professionals. However, 23 prescriptions (6.89%) exhibited poor legibility, posing a potential risk of dispensing errors or miscommunication.
Regarding clinical documentation, 286 prescriptions (85.63%) included the patient presenting complaints or findings, indicating that the majority of prescribers recorded clinical details as a basis for pharmacological decisions. However, only 117 prescriptions (35.04%) explicitly mentioned a provisional or final diagnosis, suggesting that in nearly two-thirds of cases, treatment was initiated without clearly documented diagnostic information. This limitation could hinder continuity of care and assessment of therapeutic appropriateness.
The time of prescription was recorded in 77.25% of prescriptions, and all prescriptions contained the prescriber’s name, signature, and date, ensuring traceability and accountability (table 1).
Prescribing practices
Encouragingly, generic prescribing was observed in 100% of all prescriptions, reflecting excellent adherence to institutional and national policies promoting the use of generic names for cost-effectiveness and rational drug selection.
Core drug use was noted in 98.5% of prescriptions, while appropriate dosage forms were mentioned in 99.4% (332 out of 334) prescriptions. Therapeutic dose and dosing frequency were appropriate in 98.5% (329) and 98.2% (328) of prescriptions, respectively, indicating good compliance with standard dosing protocols.
Relevant investigations were documented in 289 prescriptions (86.53%), signifying a rational and evidence-based approach to treatment, where diagnostic evaluations supported pharmacological decisions. However, patient advice or counselling instructions were included in only 5.39% of prescriptions, highlighting a major area for improvement in communication and patient education is shown in table 1, 2.
Table 1: Prescription details with patient identification
| Item | Yes | No | % |
| Identification of the health facility | 334 | 0 | 100 |
| Prescribers identification | 334 | 0 | 100 |
| Patients identification | 334 | 0 | 100 |
| Signature of the prescriber | 334 | 0 | 100 |
| Date of prescription | 333 | 1 | 9.7 |
| Time of prescription | 258 | 76 | 77.25 |
| Legibility of prescription | 311 | 23 | 93.11 |
| Prescription with findings and/or signs and symptoms | 286 | 48 | 85.63 |
| Prescription with provisional/differential/final diagnosis | 297 | 37 | 88.92 |
Prescription with total medications
c) No |
22 312 0 |
0 0 0 |
6.6 93.4 0 |
Table 2: Prescription details related to prescribed drugs
| Items | Yes | No | % |
| Selection of core drugs | 329 | 5 | 98.5 |
| Appropriate selection of subsidiary/Symptomatic drugs | 322 | 12 | 96.4 |
| Relevant advice and instructions to patients | 18 | 316 | 5.39 |
| Generic Prescription | 334 | 0 | 100 |
| Relevant investigation | 289 | 44 | 86.53 |
| Proper dosage forms or formulations (Tablet/Syrup/Injection etc.) | 332 | 2 | 99.4 |
| Proper therapeutic dose | 329 | 5 | 98.5 |
| Appropriate frequency of administration | 328 | 6 | 98.2 |
| Appropriate duration of therapy | 215 | 119 | 63.37 |
| FDC prescribed | 55 | 279 | 16.47 |
Drug utilization pattern
A total of 1,842 individual drugs were prescribed across all 334 prescriptions. The average number of drugs per prescription was 5.51, indicating a moderate degree of polypharmacy. While this may reflect the complexity of inpatient conditions, it also emphasizes the need for careful review to prevent therapeutic duplication or drug–drug interactions.
The average number of antibiotics per prescription was 0.76, indicating a judicious approach toward antimicrobial use, consistent with the principles of antimicrobial stewardship.
The average number of injections per prescription was 4.27, suggesting a high reliance on parenteral therapy. This is likely due to the inpatient hospital setting, where injections are often preferred for faster onset and improved bioavailability. Nonetheless, this trend warrants continued monitoring to ensure that injectable use remains justified and evidence-based. Out of 334 prescriptions, 55 (16.47%) included fixed-dose combinations (FDCs), most of which were clinically relevant and aligned with treatment guidelines and its shown in table 3.
Essential medicines and dispensing patterns
Among all prescribed drugs, 91.31% (1682 out of 1842) were listed in the National List of Essential Medicines (NLEM 2022), demonstrating strong adherence to rational prescribing and national standards for essential drug use. In terms of drug availability, 1,669 drugs (90.6%) were dispensed directly from the hospital pharmacy, indicating efficient stock management and accessibility. The remaining 9.4% were not dispensed due to unavailability or procurement from external sources, possibly representing non-essential or specialized formulations. A heat map was utilized to show the variables and their co-relation with other variables. Hence the variables were represented in alphabetical order as mentioned below in table 4.
Table 3: Details of core drugs indicators according to WHO
| Items | Number | Average per patients |
| Number of drugs prescribed | 1842 | 5.51 |
| Number of antibiotic/s prescribed | 253 | 0.76 |
| Number of Injection/s prescribed | 1426 | 4.27 |
| Number of drug/s from EDL | 1682 | 5.04 |
| Prescription written in local language | 0 | - |
Table 4: Variables with their alphabetical representation
| New name | Original variables |
| A | Time of prescription for IPD |
| B | Legibility of prescription |
| C | Prescription with findings and/or signs and symptoms |
| D | Prescription with provisional/differential/final diagnosis |
| E | Prescriptions with 1-3 drugs |
| F | Prescriptions with>3 drugs |
| G | Appropriate selection of subsidiary/symptomatic drugs |
| H | Relevant instructions or advices to the patients |
| I | Relevant investigations |
| J | Appropriate duration of therapy |
| K | FDC prescribed |
| L | Number of drugs prescribed |
| M | Number of antibiotic/s prescribed |
| N | Number of Injection/s prescribed |
| O | Number of drug/s from EDL |
| P | Number of drugs dispensed from Pharmacy |
Red colour represents the variables are directly proportional and the blue colour inversely proportional. Darker the colour stronger the relation among the variables is shown in fig. 2.
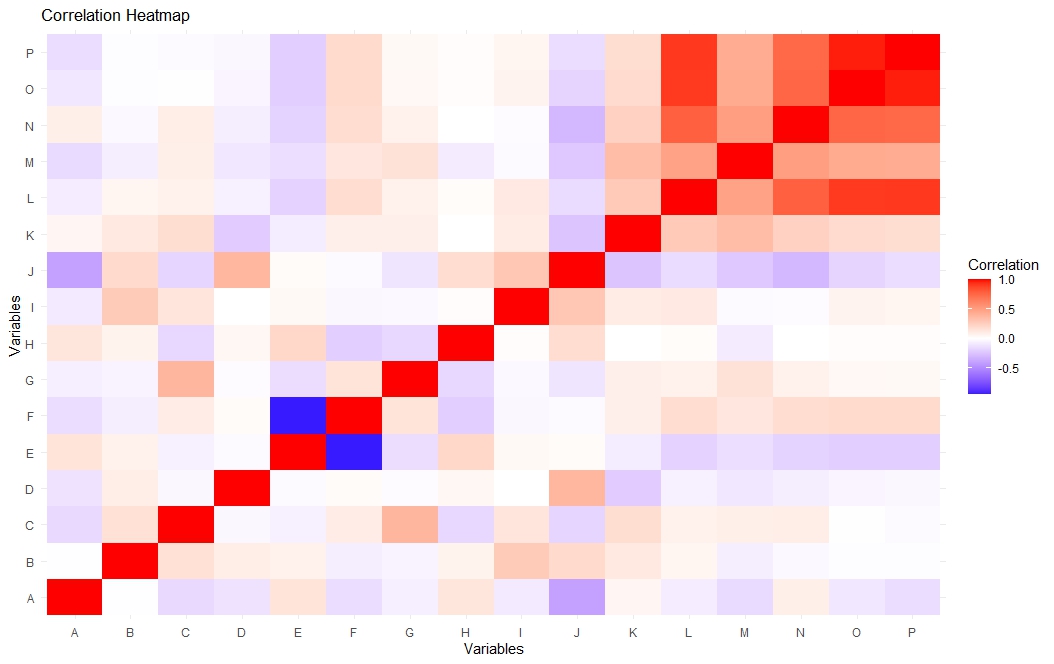
Fig. 2: Correlational heat map demonstrating co-relation of the variables
A dendogram was used for hierarchical clustering, representing a tree with similarity metric given to show how close variables are related to each other. Loser the connecting root in between variables, the more closely related are the two variables. Here, lower the distance more similar the two variables, which is demonstrated in fig. 3. For example, variable C (prescriptions documenting findings/signs/symptoms) showed a strong positive correlation with Variable G (appropriate selection of symptomatic drugs), implying that rational drug selection was guided by clinical findings. Similarly, Variable D (diagnosis documentation) correlated closely with Variable J (appropriate duration of therapy), indicating that prescribers tended to match treatment duration with diagnostic relevance.
This analysis reinforces that overall prescribing patterns were rational, evidence-based, and indication-oriented.
Overall the audit findings demonstrate high compliance with WHO prescribing indicators and rational drug use principles. Most prescriptions were complete, legible, and rational, reflecting a commendable level of adherence to essential medicine policy and good clinical practice.
However, certain gaps were identified, like inadequate documentation of diagnosis (only 35.04%), limited inclusion of patient counselling or treatment advice (5.39%), relatively high use of injections (4.27 per prescription) and moderate polypharmacy (5.51 drugs per prescription). Addressing these areas through prescriber sensitization, continuous medical education, and periodic audits could further strengthen prescription quality, ensure patient safety, and enhance therapeutic outcomes.
DISCUSSION
In this prescription audit study, we evaluated 334 inpatient (IPD) prescriptions in General Medicine, analysed their completeness and rationality, and assessed prescribers’ knowledge, attitudes, and practices regarding rational prescription writing.
Completeness of prescriptions
In the present audit of 334 inpatient prescriptions, basic identifiers were almost universally present, demonstrating strong adherence to prescription completeness in our institution. Comparatively, a multicentric Indian study by Joshi et al. involving 4,838 outpatient prescriptions found that 38.65% of prescriptions were incomplete, missing items such as dose, duration, or formulation [8]. Similarly, Shetty et al. found that diagnosis was missing in about 35.3% of 420 analysed prescriptions [9]. Our completeness for basic identifiers is therefore better than many Indian benchmarks; however, completeness in therapeutic detail (e. g., diagnosis, duration) remains a gap. Other Indian studies support this-for example, Meenakshi et al. (South India) found prescriber identification in only ~79.7% of prescriptions and diagnosis in ~82.7% of OPD prescriptions [10].
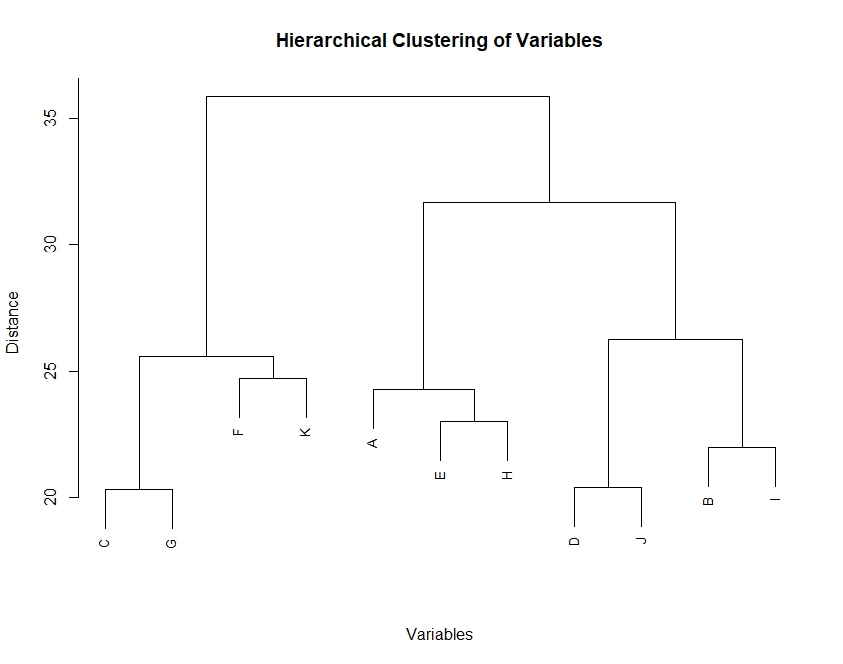
Fig. 3: Dendogram representing the relation of the hierarchical clustering of the variables
Legibility
In our audit, 93.11% (311/334) prescriptions were adequately legible, and 6.89% (23) had poor legibility. Legibility is crucial for safe dispensing and preventing medication errors. In a rural tertiary hospital audit by Sharma et al. among 200 prescriptions, only 83.5% were legible (68.5% easy legibility, 20% difficult, 11.5% illegible) [11]. In the Meenakshi et al. study, legibility was 97.8% good and only 0.5% average or worse [10]. Therefore, our legibility (~93%) compares favourably with many Indian audits-better than Sharma’s rural hospital result, though slightly lower than Meenakshi’s OPD finding. Given that our setting involves busy medicine wards with more complex and lengthy prescriptions, achieving>90% legibility is positive.
Documentation of clinical details (Findings/Diagnosis/Investigations)
The audit found that 85.63% of prescriptions included presenting complaints or findings, but only 35.04% explicitly documented a diagnosis. Investigations were recorded in 86.53% of prescriptions. The high recording of findings and investigations is commendable and indicates an indication-based approach to prescribing. In comparison, Shetty et al. found diagnosis missing in ~35% of cases, Meenakshi et al. reported diagnosis in ~82.7%, and Navadia et al. (2023) found that only 40% of prescriptions documented diagnosis/indication [12]. Thus, our institution’s performance in diagnosis documentation (35%) is lower than most OPD-based Indian audits but comparable to Navadia’s inpatient findings. Low diagnosis documentation hampers rationality assessment and continuity of care. However, the high rate of investigation documentation (86%) is encouraging and suggests a rational clinical work-up.
Rationality of drug selection
Our results show strong performance in several rationality metrics-generic prescribing in 100% of prescriptions, correct dosage form in 99.4%, therapeutic dose in 98.5%, frequency in 98.2%, and 91.31% of drugs from the National List of Essential Medicines (NLEM) 2022. In contrast, the multicentric Joshi et al. study reported generic prescribing in only 47.58% of prescriptions [8]. Thus, our generic and essential medicine fig. far exceed many Indian reports, which is a major strength. However, our average number of drugs per prescription (5.51) and injection use (4.27 per prescription) remain high. FDC prescribing (16.47%) also warrants attention. Sustaining high generic and essential drug use while curbing polypharmacy and unnecessary injectables will improve rationality further.
Prescribing metrics
The audit shows an average of 5.51 drugs per prescription, average antibiotics per prescription 0.76, injections per prescription 4.27, FDCs 16.47%, and appropriate duration at 63.37%. The high drug count and injection usage reflect inpatient case complexity but merit scrutiny. In Meenakshi et al. (OPD), average drugs per encounter were 2.38±1.1 and injections 10.5% [10]. Sharma et al. found antibiotic usage in 51.5% of prescriptions and legibility 83.5% [11]. The Joshi et al. multicentric study observed 3.34 drugs per prescription, antibiotics in 17.63%, and injectables in only 4.98% 8. Our antibiotic fig. (0.76 per prescription) is moderate for inpatient settings, but injection use is higher compared to OPD benchmarks. Similar inpatient studies, such as Bachewar et al. have also reported higher average drug counts (~5.6) and injectable use (~70%) in medical wards [13]. Moreover, only 63.37% prescriptions had appropriate duration, leaving a significant gap. Duration omission is a well-documented issue in Indian audits.
LIMITATIONS
Our study is cross-sectional in design; it captures prescribing behavior at one point of time and cannot ascertain temporal trends or causality. We did not have direct observation of prescribing decision-making or time-motion studies, so attribution of omissions to workload, system constraints, or attitudes remains speculative. Because it is a single-center study, generalizability to other hospitals or states is limited.
CONCLUSION
This prescription audit demonstrated overall good compliance with WHO core prescribing indicators, reflecting rational and standardized prescribing practices in the medicine wards. Completeness, legibility, and generic prescribing were near universal, and the majority of drugs were selected from the National List of Essential Medicines (NLEM 2022), signifying adherence to institutional and national rational drug use policies. However, incomplete documentation of diagnosis and inadequate patient advice remain significant gaps that may affect continuity of care and patient safety. So, periodic prescription audits, prescriber sensitization programs, and reinforcement of WHO-recommended good prescribing practices are essential to further enhance prescription quality and promote safe, evidence-based, and cost-effective pharmacotherapy.
ACKNOWLEDGEMENT
The authors would like to acknowledge Dr. Sankha Subhra Chakraborty, Dr. Aditya Adhikary and Dr. Sobhan Palodhi from the Department of Pharmacology and the institutional authority for their constant help and support.
FUNDING
Nil
CONFLICT OF INTERESTS
Declared none
REFERENCES
Maxwell SR. Rational prescribing: the principles of drug selection. Clin Med (Lond). 2016 Oct;16(5):459-64. doi: 10.7861/clinmedicine.16-5-459, PMID 27697811.
Farid Habibyar A, Nazari QA. Evaluation of prescribing patterns using WHO core drug use indicators in a pediatric hospital of Kabul Afghanistan: a prospective cross-sectional study. Heliyon. 2023 Nov 2;9(11):e21884. doi: 10.1016/j.heliyon.2023.e21884, PMID 38027959.
Karasneh RA, Al-Azzam SI, Ababneh M, Al-Azzeh O, Al-Batayneh OB, Muflih SM. Prescribers knowledge, attitudes and behaviors on antibiotics antibiotic use and antibiotic resistance in Jordan. Antibiotics (Basel). 2021;10(7):858. doi: 10.3390/antibiotics10070858, PMID 34356779.
Halder S, Gangopadhyay T, Mondal S, Das AK. Prescription audit from the outpatient department of a rural hospital in West Bengal, India: a cross-sectional study. Asian J Pharm Clin Res. 2022;15(12):126-9. doi: 10.22159/ajpcr.2022.v15i12.45901.
Nkinda L, Kilonzi M, Felix FF, Mutagonda R, Myemba DT, Mwakawanga DL. Drivers of irrational use of antibiotics among children: a mixed-method study among prescribers and dispensers in Tanzania. BMC Health Serv Res. 2022;22(1):961. doi: 10.1186/s12913-022-08359-7, PMID 35902955.
Karasneh RA, Al-Azzam SI, Ababneh M, Al-Azzeh O, Al-Batayneh OB, Muflih SM. Prescribers knowledge, attitudes and behaviors on antibiotics antibiotic use and antibiotic resistance in Jordan. Antibiotics (Basel). 2021 Jul 15;10(7):858. doi: 10.3390/antibiotics10070858, PMID 34356779.
Mittal N, Goel P, Goel K, Sharma R, Nath B, Singh S. Awareness regarding antimicrobial resistance and antibiotic prescribing behavior among physicians: results from a nationwide cross-sectional survey in India. Antibiotics (Basel). 2023;12(10):1496. doi: 10.3390/antibiotics12101496, PMID 37887197.
Joshi R, Medhi B, Prakash A, Chandy S, Ranjalkar J, Bright HR. Assessment of prescribing pattern of drugs and completeness of prescriptions as per the World Health Organization prescribing indicators in various Indian tertiary care centers: a multicentric study by rational use of Medicines Centers, Indian Council of Medical Research network under national virtual centre clinical pharmacology activity. Indian J Pharmacol. 2022 Sep-Oct;54(5):321-8. doi: 10.4103/ijp.ijp_976_21, PMID 36537400.
Shetty Y, Kamat S, Tripathi R, Parmar U, Jhaj R, Banerjee A. Evaluation of prescriptions from tertiary care hospitals across India for deviations from treatment guidelines and their potential consequences. Indian J Med Res. 2024 Feb 1;159(2):130-41. doi: 10.4103/ijmr.ijmr_2309_22, PMID 38528817.
Meenakshi R, Selvaraj N, Anandabaskar N, Dhamodharan A, Badrinath AK, Rajamohammad MA. Prescription audit of a teaching hospital in South India using World Health Organization core prescribing indicators a cross-sectional study. Perspect Clin Res. 2022 Jul-Sep;13(3):132-6. doi: 10.4103/picr.PICR_172_20, PMID 35928646.
Sharma M, Payal N, Devi LS, Gautam D, Khandait M, Hazarika K. Study on prescription audit from a rural tertiary care hospital in North India. J Pure Appl Microbiol. 2021;15(4):1931-9. doi: 10.22207/JPAM.15.4.14.
Navadia KP, Patel CR, Patel JM, Pandya SK. Evaluation of medication errors by prescription audit at a tertiary care teaching hospital. J Pharmacol Pharmacother. 2024;14(4):275-84. doi: 10.1177/0976500X231222689.
Bachewar NP, Choudhari SR, Dudhgaonkar S. Assessment of prescription pattern using WHO drug prescribing indicators in medicine wards of a tertiary care teaching hospital: a retrospective observational study. Int J Basic Clin Pharmacol. 2017 Jul 22;6(8):2070. doi: 10.18203/2319-2003.ijbcp20173298.