
Int J Pharm Pharm Sci, Vol 17, Issue 3, 21-31Original Article
A NOVEL DRUG DELIVERY SYSTEM OF INDIGENOUS HERBS FOR SUBLINGUAL IMMUNOTHERAPY IN COPD
V. DEEPA KUMARI , G. SELVI*, S. SHYAM SUNDAR, A. LAKSHMI PRIYA
C l Baid Metha College of Pharmacy, Affiliated to the Tamil Nadu Dr. MGR Medical University, Thoraipakkam, Chennai–97, India
*Corresponding author: G. Selvi; *Email: selviarunkumar@gmail.com
Received: 30 Nov 2024, Revised and Accepted: 09 Jan 2025
ABSTRACT
Objective: To develop and evaluate bilayer sublingual tablets containing Butterbur and Bee’s Pollen extracts for the management of Chronic Obstructive Pulmonary Disease (COPD). The aim was to achieve anti-inflammatory, anti-allergic, and immune-modulatory effects via a non-invasive delivery system, improving patient compliance and therapeutic outcomes.
Methods: Bilayer tablets were formulated using direct compression, with Bee’s Pollen serving as the immune-modulatory layer and Butterbur as the anti-inflammatory layer. The tablets were evaluated for pre-and post-compression parameters, including flow properties, hardness, friability, disintegration, and dissolution. Fourier Transform Infrared (FTIR) spectroscopy confirmed drug-excipient compatibility. In vitro drug release studies were conducted, and ex vivo permeation studies using goat buccal mucosa simulated sublingual absorption. Stability tests followed ICH guidelines to ensure physical and chemical consistency under accelerated conditions.
Results: The bilayer tablets exhibited rapid disintegration (<3 min) and high drug release (>90%) during dissolution studies. FTIR analysis confirmed the absence of significant drug-excipient interactions. Ex vivo permeation studies demonstrated efficient drug absorption, supporting systemic delivery. Stability tests revealed no significant changes in parameters over 30 days. The best formulations, F8 and F9, showed superior dissolution and permeation profiles, with cumulative drug release reaching 94.91% (Butterbur) and 93.3% (Bee’s Pollen).
Conclusion: Bilayer sublingual tablets combining Butterbur and Bee’s Pollen extracts present a promising therapeutic strategy for COPD. The dual action of these herbal extracts offers enhanced anti-inflammatory and immune-modulating effects, potentially improving patient outcomes and compliance. Further clinical trials are recommended to validate these findings and explore the long-term therapeutic potential.
Keywords: Bilayer tablet, Sublingual, Butterbur, Bee’s pollen, SLIT, COPD, Ex-vivo, In vitro, Permeability
© 2025 The Authors. Published by Innovare Academic Sciences Pvt Ltd. This is an open access article under the CC BY license (https://creativecommons.org/licenses/by/4.0/)
DOI: https://dx.doi.org/10.22159/ijpps.2025v17i3.53317 Journal homepage: https://innovareacademics.in/journals/index.php/ijpps
INTRODUCTION
COPD is a chronic inflammatory lung disease characterized by irreversible airflow limitation due to long-term exposure to harmful particles like tobacco smoke, environmental pollutants, and occupational chemicals [1, 2]. Affecting 5% to 15% of adults aged 45 and older globally, COPD is a leading cause of morbidity and mortality, significantly burdening healthcare systems. It is marked by reduced lung function, leading to diminished quality of life [3]. Key symptoms include dyspnoea, chronic cough, and sputum production [4, 5]. The inflammatory response, often triggered by pathogenic bacterial colonization, plays a central role in disease progression [6]. Patients frequently experience exacerbations, hospitalization, and other concurrent respiratory conditions like bronchiectasis, asthma, pulmonary fibrosis, and lung cancer [7]. The World Health Organization (WHO) forecasts that by 2030, Chronic Obstructive Pulmonary Disease (COPD) will become the third leading cause of death globally, up from its current position as the fourth, and will rank as the fifth leading cause of disability, rising from 12th place [8, 9].
Traditional COPD management relies on bronchodilators, corticosteroids, and other pharmacotherapies, which may lead to side effects and limited efficacy, especially with long-term use [10-12]. These treatments do not alter disease progression or enhance the underlying immune response, emphasizing the need for more effective therapeutic strategies [13, 14].
Given the limitations of conventional treatments, there is a growing interest in alternative approaches like immunotherapy to modulate immune responses and offer symptomatic relief [15, 16]. Sublingual immunotherapy (SLIT) is emerging as a non-invasive option that improves patient compliance by delivering active compounds directly into systemic circulation without injections [17].
Sublingual Immunotherapy (SLIT) is recommended for managing severe allergic symptoms that do not respond to conventional antihistamines [18, 19]. By administering small allergen doses under the tongue, SLIT gradually reduces the production of specific allergic antibodies (IgE) and fosters immune tolerance [20-22]. Available as tablets and drops, SLIT is FDA-approved for treating allergens such as grass pollen, ragweed, and dust mites. It offers a convenient alternative for individuals with busy lifestyles or a fear of needles and is a viable option for those unable to tolerate allergy injections [23, 24].
SLIT is recognized for its safety and effectiveness in alleviating symptoms of allergic rhinitis and reducing the need for medication. Unlike subcutaneous immunotherapy, SLIT requires higher doses of allergens to achieve a clinical effect, emphasizing the need for a well-established effective dose to minimize side effects [25, 26]. It promotes immunological tolerance by engaging Langerhans cells and myeloid dendritic cells to activate T and B cells, thereby improving immune regulation [27].
Butterbur, predominantly found in the Himalayan region, and Bee Pollen, harvested from apiaries in Punjab and Himachal Pradesh, hold significant therapeutic potential. The active compounds in Butterbur, known as petasins, possess anti-inflammatory and bronchodilatory properties, which may aid in managing COPD by alleviating airway constriction [28]. Similarly, Bee Pollen is abundant in antioxidants and bioflavonoids [29], which play a vital role in modulating immune responses and reducing oxidative stressboth, critical elements in the development of COPD. Together, these natural remedies offer synergistic benefits for lung health and could serve as effective complementary therapies for respiratory conditions like COPD.
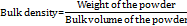
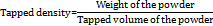
Herbal extracts such as Butterbur (Petasites hybridus) and Bee's Pollen (fig. 1) show significant potential for their anti-inflammatory and immunomodulatory properties. Developing a bilayer sublingual tablet that combines these herbs may provide synergistic effects, offering an effective approach to reducing inflammation and regulating immune responses in patients with COPD [30-33].
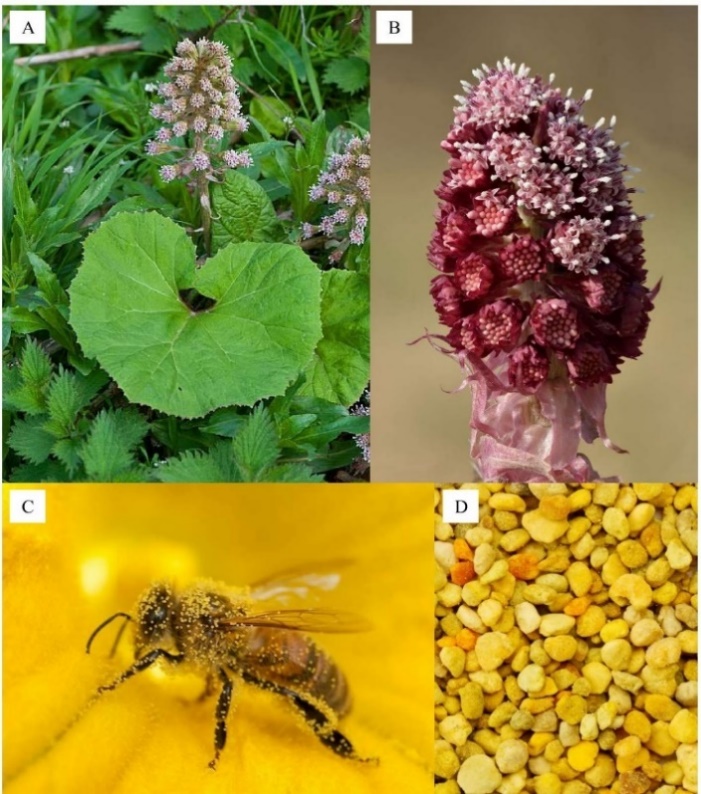
Fig. 1: The image depicts butterbur and bee’s pollen. A-Butterbur, B-Inflorescence, C-Bee covered with pollen, D-Bee's pollen grains
MATERIALS AND METHODS
Materials
Butterbur extract
Butterbur extract in powder form was purchased from Amazon India a product of Shrisha organics Pvt limited. The extract powder was standardized for Petasincontent. Alkaloids (Dragendorff’s Test), Carbohydrates (Molisch’s Test), Terpenoids (Sulfuric Acid Test), Flavonoids (Sodium Hydroxide Test) the results complied with the specification in COA issued with the product.
Bee’s pollen extract
Bee’s Pollen Extract extract in powder form was purchased from Amazon India a product of Heilen BiopharmPvt limited, Ahmedabad. The extract powder was tested for Carbohydrates (Fehling’s, Seliwanoff’s, Benedict’s), Proteins (Biuret Test), Phenolic Compounds (Ferric Chloride Test), Flavonoids (Sodium Hydroxide Test) the results complied with the specification in COA (Certificate of Analysis) issued with the product.
All excipients including microcrystalline cellulose, lactose, magnesium stearate of industrial grade and the project workspace was provided by Sai Mirra Innopharm Pvt limited.
Bilayer tablet preparation
The bilayer tablet of venlafaxine was prepared using a Rotary Mini tablet press with 6.5 mm round punches. The die was initially filled with the weighed amount of Bee's Pollen, pollen extract and was slightly compressed. Over this compressed layer, the required quantity of the butterbur extract layer was placed and compressed to obtain hardness of the tablet 3-4 kg/cm2. It was observed that table compressed at this force did not show any layer separation. The total weight of the tablet was kept 60000µg (60 mg) for all formulation (table 1) [34].
Table 1: Formulation of butterbur and bee's pollen
| Ingredients | F1 | F2 | F3 | F4 | F5 | F6 | F7 | F8 | F9 |
| Layer 1 butterbur (µg) | |||||||||
| Butterbur | 5000 | 5000 | 5000 | 5000 | 5000 | 5000 | 5000 | 5000 | 5000 |
| SSG | 0 | 0 | 3400 | 0 | 0 | 5000 | 0 | 0 | 6700 |
| CP | 0 | 2500 | 0 | 0 | 3500 | 0 | 0 | 4170 | 0 |
| CCS | 4000 | 0 | 0 | 5000 | 0 | 0 | 6000 | 0 | 0 |
| Magnesium stearate | 3000 | 3000 | 3000 | 3000 | 3000 | 3000 | 3000 | 3000 | 3000 |
| Colloidal silica | 2000 | 2000 | 2000 | 2000 | 2000 | 2000 | 2000 | 2000 | 2000 |
| Pearlitol | 47500 | 47000 | 46100 | 44500 | 46000 | 44500 | 43500 | 45300 | 42800 |
| Colourant | 500 | 500 | 500 | 500 | 500 | 500 | 500 | 500 | 500 |
| Total weight | 60000 | 60000 | 60000 | 60000 | 60000 | 60000 | 60000 | 60000 | 60000 |
| Layer 2 bee's pollen (µg) | |||||||||
| Bee's pollen | 8000 | 8000 | 8000 | 8000 | 8000 | 8000 | 8000 | 8000 | 8000 |
| SSG | 3400 | 5000 | 6700 | 3400 | 5000 | 6700 | 3400 | 5000 | 6700 |
| CP | 2500 | 2500 | 2500 | 3400 | 3400 | 3400 | 4170 | 4170 | 4170 |
| Magnesium stearate | 3000 | 3000 | 3000 | 3000 | 3000 | 3000 | 3000 | 3000 | 3000 |
| Colloidal silica | 2500 | 2500 | 2500 | 2500 | 2500 | 2500 | 2500 | 2500 | 2500 |
| Pearlitol | 5000 | 5000 | 5000 | 5000 | 10000 | 10000 | 10000 | 10000 | 15000 |
| Fructose | 3500 | 3500 | 3500 | 3500 | 3500 | 3500 | 3500 | 3500 | 3500 |
| Sepitrap | 5000 | 5000 | 5000 | 5000 | 5000 | 5000 | 5000 | 5000 | 5000 |
| MCC | 27000 | 25500 | 23000 | 26200 | 24600 | 22900 | 25400 | 23800 | 22150 |
| Total weight | 60000 | 60000 | 60000 | 60000 | 60000 | 60000 | 60000 | 60000 | 60000 |
Abbreviations: F: Formulation, SSG: Sodium starch glycolate, CP: Crospovidone, CCS: Croscarmellose Sodium, MCC: Microcrystalline Cellulose, µg: Microgram.
Evaluation
Evaluation of powder blends
The flow properties of the powder blend (prior to compression) were evaluated using bulk density, tapped bulk density, angle of repose, compressibility index (Carr's index), and Hausner's ratio. Each test was conducted three times for each formulation to ensure accuracy [35].
Angle of repose
For the angle of repose of the material was poured through a funnel to form a cone. The tip of the funnel should be held closed to the growing cone and slowly raised as the pile grows to minimize the impact of falling particles. Stop pouring the material when the pile reached a predetermined height or the base a predetermined width. Rather than attempt to measure the angle of the resulting cone directly, divided the height by half the width of the base of the cone.
The inverse tangent of this ratio is the angle of repose. It is defined as maximum angle possible between surface of the pile of powder and the horizontal plane [35].
Formula for angle of repose:


h = height of pile
r = radius of pile
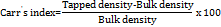
Bulk density
Bulk density of was determined by taking a 5 g of powder in a 10 ml graduated measuring cylinder, which is attached to the bulk density apparatus. The bulk density was calculated by following equation [35],
Tapped density
Tapped density was determined by tapping method using measuring cylinder containing weighed amount of powder. The cylinder was tapped for 100 times from a height of 1 inch at an interval of 2 sec. tapped density was calculated by following equation [35].
Carr’s compressibility index
This is an important property in maintaining uniform weight. It is calculated by using following formula [35].
Hausner’s ratio
A similar index to indicate the flow properties can be defined by Hausner’s ratio. Hausner’s ratio can be calculated by using following formula (table 2) [35].
Post-compression parameters
Appearance
The general appearance of the tablet and overall elegance and visual identity is very much needed for consumer acceptance.
Tablet thickness and diameter
Thickness and diameter of tablet is very important characteristics in reproducing appearance. Some filling equipment utilizes the counting mechanism to get uniform thickness. Randomly, 10 tablets were taken from each formulation and the thickness and diameter was determined with a vernier caliper. The size of the tablet should be dimensionally described, monitored, and controlled.
Weight variation
A group of 20 tablets were taken from each formulation randomly and weighed using an electronic balance and the average weight of the tablets was determined. The individual tablet weights were compared with average weight (table 3).
Table 2: Flow property characteristics [35]
| Flow property | Angle of repose (Ɵ) | Compressibility index (%) | Hausner’s ratio |
| Excellent | 25-30 | ˂10 | 1.00-1.11 |
| Good | 31-35 | 11-15 | 1.12-1.18 |
| Fair | 36-40 | 16-20 | 1.19-1.25 |
| Passable | 41-45 | 21-25 | 1.26-1.34 |
| Poor | 46-55 | 26-31 | 1.35-1.45 |
| Very poor | 56-65 | 32-37 | 1.46-1.59 |
| Very very poor | ˃65 | ˃38 | ˃1.60 |
Table 3: Uniformity of weight
| Tablet average weight | Percentage differential lowed |
| ≤80 | ±10 |
| Between80and250 | ±7.5 |
| >250 | ±5 |
Hardness of tablets
Strength of the tablet is defined as tensile strength (N: Newton or kg/cm2). The crushing load on tablet is defined as the force necessary to fracture a tablet into 2 halves by applying compression. The hardness of the prepared tablets was determined by means of the Monsanto hardness tester. For each batch, the hardness of 10 randomly selected tablets was determined and the average was noted [36].
Friability
It is a measurement of mechanical strength of tablet. The friability is determined to evaluate the effects of rubbing and shocks, which may frequently cause tablet to damage, cap, or rupture [36].
10 tablets were weighed and placed in the Roche Friabilatortest apparatus, the tablets were exposed to rolling and repeated shocks, resulting from free fall within the apparatus. After 4 min or 100 evolutions, the tablets were de dusted and weighed again and noted. The friability was determined as the percentage loss in weight of the tablets. Compressed tablets must not drop more than 1% of their weight. The friability (F) is expressed by

Wetting time
Wetting time related with contact angle which is significant parameter required for sublingual tablets. The tablets with lesser wetting time have faster disintegration. This test was performed to calculate the wetting time using simple procedure and was done by placing the tablet on tissue paper which was placed on a Petri dish of 6.5 cm in diameter containing 10 ml of water at room temperature. The time required for the water to wet the tablet completely by the absorbent tissue paper was noted [36].
Water absorption ratio
A piece of tissue paper folded twice was placed in a small Petri dish containing 6 ml of water. A tablet was put on the tissue paper and allowed to wet completely. The wet tablet was then weighed. The water absorption ratio was calculated by [37].

WB-The weights of tablet before absorption
WA-The weights of tablet after absorption
In vitro disintegration
In the USP disintegration test for sublingual tablets, the disintegration apparatus for oral tablets is used without the covering plastic disks, and 2 min is specified as the acceptable time limit for tablet disintegration fulfilling the official requirements (<3 min) for sublingual tablets. Disintegration test was carried out using a disintegration apparatus at 37±0.5 °C in distilled water [37].
In vitro dissolution studies
Dissolution study was carried out in USP II paddle-type apparatus using 500 ml of phosphate buffer (pH 6.8) as a dissolution medium at 50rpm. Temperature of the dissolution Medium was maintained at 37±0.5 °C. Samples of 5 ml were withdrawn at 1, 5, 15, 30 and 45 min Interval, filtered and replaced with 5 ml of fresh dissolution medium. The Samples were suitably diluted and estimated spectrophotometrically at two different nm for terpenoids and glucose by using Shimadzu-1700 UV-visible spectrophotometer. The dissolution experiments were conducted in triplicate. Dissolution rate was studied for all designed formulations and dissolution parameters were calculated (table 4) [38].
Table 4: Dissolution specification
| Parameter | Specifications |
| Apparatus | USP II Paddle |
| Dissolution medium | 500 ml phosphate buffer pH6.8 |
| Rotation speed | 50 rpm |
| Temperature | 37±0.5 °C |
| Withdrawn sample | 5 ml |
| Absorbance measured | 243 nm, 540 nm |
Abbreviations: USP II Paddle: United States Pharmacopeia Type II Paddle Apparatus, ml: milliliters, rpm: revolutions per minute, °C: Celsius, nm: nanometres
In vitro permeation studies
In vitro permeation studies were carried out with Franz Diffusion Cell Apparatus. The medium used for these studies was phosphate buffer (pH6.8) maintained at 37±0.5 °C. Cellulose dialysis membrane was used as a permeation barrier. Samples were collected at predetermined time intervals (1, 5, 15, 30, 45 and 60 min). Samples were analyzed for both drugs that pass the membrane are determined by UV spectrophotometer set at 243 and 540 nm. The permeation studies were performed for the best two batches in drug release [39].
Ex-vivo permeation study of sublingual tablets
The buccal mucosa is very similar to the sublingual mucosa, so in this study, goat buccal mucosa was used to determine the permeation of drug through the mucosa using a Franz diffusion cell at 37±0.5 °C. Fresh goat buccal mucosa was mounted between the donor and receptor compartments. The sublingual tablet was placed with the core facing the mucosa, and the compartments were clamped together. The donor compartment was filled with 5 ml of phosphate buffer (pH 6.8). The receptor compartment (20 ml capacity) was filled with phosphate buffer (pH 6.8) and the hydrodynamics in the compartment was maintained by stirring with a magnetic bead at the uniform slow speed of 100 rpm one-milliliter samples were withdrawn at pre-determined time intervals and analyzed for drug content using an ultraviolet (UV) spectrophotometer at 243 and 540 nm [38].
Stability studies
The purpose of stability testing is to provide evidence on how the quality of a drug substance or drug product varies with time under the influence of a variety of environmental factors, such as temperature, humidity, and light, enabling recommended storage conditions. To avoid this undesirable delay, the principles of accelerated stability studies are adopted. ICH specifies the length of study and storage conditions.
Long-Term Testing: 25 °C±2 °C/60% RH±5% for 12 Mo
Accelerated Testing: 40 °C±2 °C/75% RH±5% for 6 Mo
Selected formulation was tested for stability studies by placing the tablets in the humidity chamber at 40±2 °C/75±5% RH up to 1 mo. The tablets were analyzed at a time interval for hardness and in vitro disintegration time, dissolution percentage [40].
RESULTS AND DISCUSSION
Organoleptic characteristics
Butterbur is characterized by its light-yellow powder form and distinctive odour, whereas Bee's Pollen presents as bright yellow spherical granules. These physical attributes help differentiate the two substances and are essential for their identification in pharmaceutical preparations.
Solubility profile
The solubility characteristics of Butterbur and Bee's Pollen were analysed to assess their compatibility with solvents. Butterbur exhibited slight solubility in ethanol and was sparingly soluble in water, indicating limited dissolution in polar solvents. Bee's Pollen showed slight solubility in ethanol but was poorly soluble in water, which suggests challenges in formulating aqueous solutions.
Preparation of standard calibration curves
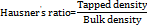
The calibration curve for Butterbur was established using a UV spectrophotometer at a wavelength of 243 nm (table 5). The absorbance data for Butterbur in distilled water followed a linear relationship, yielding an equation of the form Y = mx+c, where Y represents absorbance, m is the slope, and x denotes concentration. Butterbur showed linearity with an R² value of 0.993 over a concentration range of 1-10 μg/ml, adhering to Beer-Lambert Law.
Similarly, a calibration curve for Bee's Pollen was generated using UV analysis at 540 nm (table 5). The absorbance data also exhibited linearity, with an R² value of 0.994 in the concentration range of 1-5 μg/ml, confirming adherence to Beer-Lambert Law. The equation derived was also of the form Y = mx+c, indicating a strong correlation between concentration and absorbance (fig. 2).
Table 5: Calibration curve of butterbur and bee's pollen
| Concentration (µg/ml) | Absorbance (Butterbur at 243 nm) | Concentration (µg/ml) | Absorbance (Bee's pollen at 540 nm) |
| 0 | 0 | 0 | 0 |
| 1 | 0.105 | 1 | 0.024 |
| 2 | 0.154 | 2 | 0.039 |
| 3 | 0.222 | 4 | 0.07 |
| 4 | 0.263 | 6 | 0.095 |
| 5 | 0.341 | 8 | 0.121 |
| 6 | 0.406 | 10 | 0.15 |
| 7 | 0.47 | ||
| 8 | 0.534 |
Abbreviations: µg/ml: Microgram per millilitre, nm: Nanometer
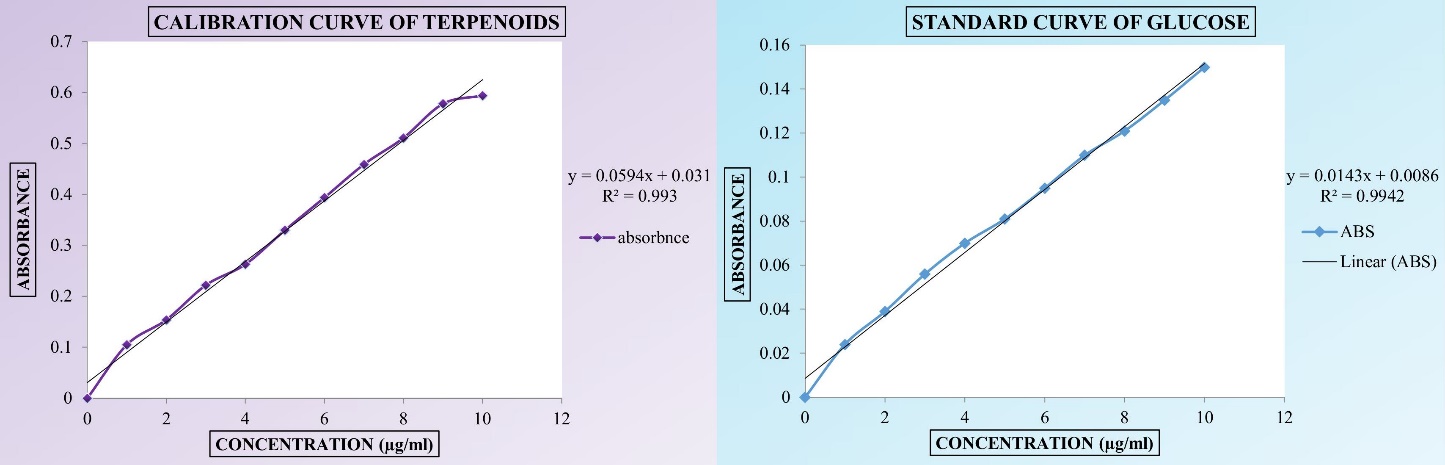
Fig. 2: Standard curve of butterbur and bee's pollen. Abbreviations: µg/ml: Microgram per millilitre, ABS: Absorbance, R2: Correlation coefficient
Fourier transform infrared (FTIR) spectroscopy studies
FTIR analysis was conducted on pure drugs and their physical mixtures to evaluate potential interactions between the active ingredients and excipients (table 6). The FTIR spectrum of Butterbur displayed distinct peaks associated with petasin, its main phytoconstituent, while Bee’s Pollen exhibited characteristic peaks at specific wavelengths (fig. 3). No significant shifts were observed in the spectra of the pure drugs or their physical mixtures, indicating the absence of chemical interactions between the drugs, disintegrants, and diluents used in the formulation. Furthermore, no interactions were detected between the two drugs when combined in a bilayer tablet format [36, 38].
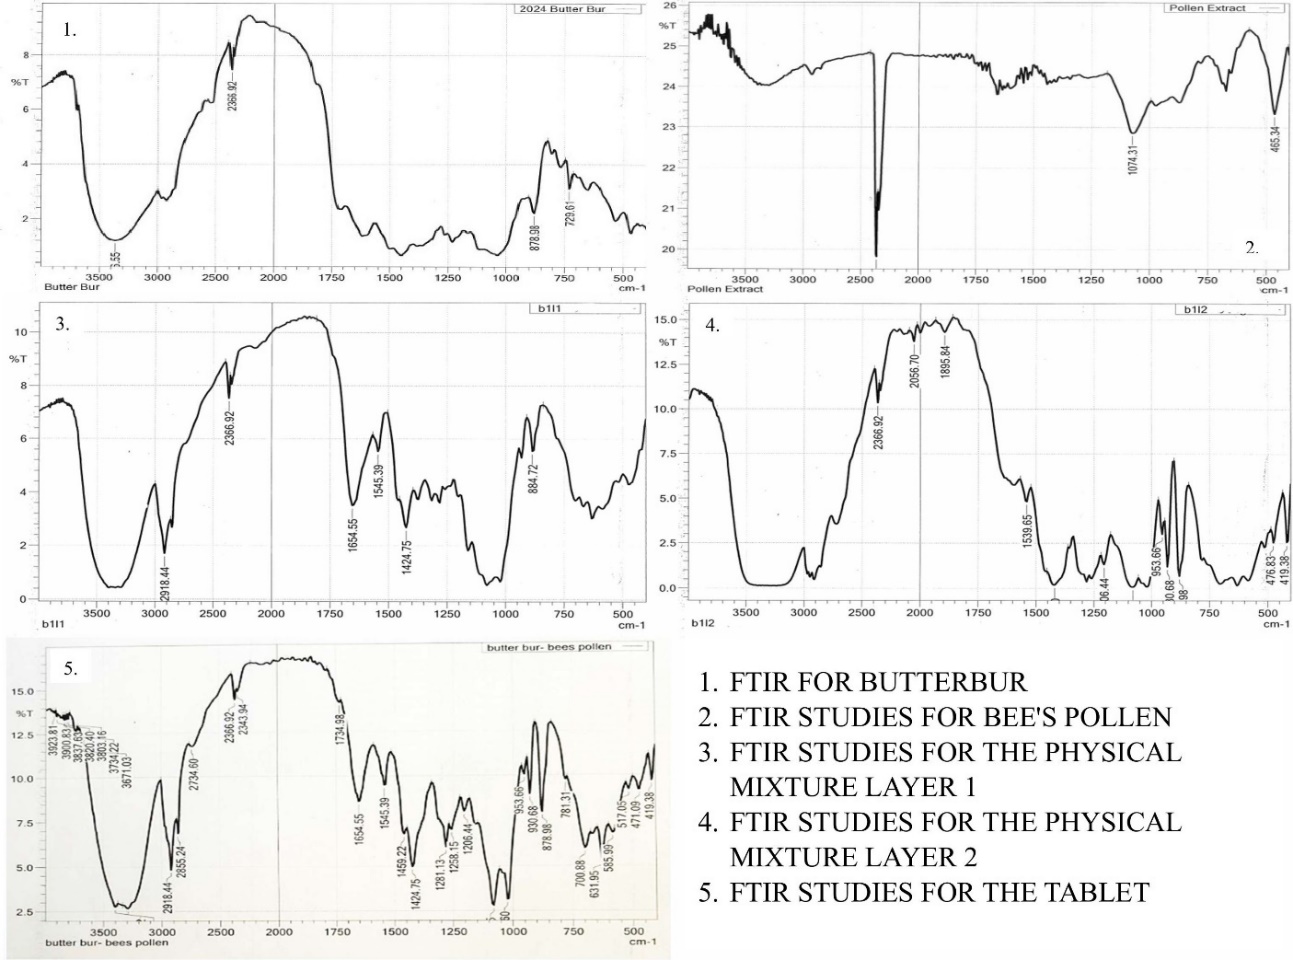
Fig. 3: FTIR studies of butterbur, bee's pollen, physical mixture layer 1, Physical Mixture Layer 2, and the tablet. Abbreviations: FTIR: Fourier Transform Infrared spectroscopy, Abbreviations: FTIR: Fourier transform infrared spectroscopy
Table 6: FTIR characterization of butterbur, bee's pollen, physical mixture layer 1, physical mixture layer 2, and the tablet
| S. No. | FTIR characteristic | Wave number in cm-1 |
| Butterbur | ||
| 1 | C-H Stretching | 2800-3000 |
| 2 | O-H Stretching | 3200-3600 |
| 3 | C=O Stretching | 1700-1750 |
| 4 | C=C aromatic | 1600-1450 |
| Bee's Pollen | ||
| 1 | (C-H stretching) | 2850-3000 |
| 2 | Aromatic (C=C) | 1625-1680 |
| 3 | C-O stretching | 1050-1150 |
| 4 | O-H | 3200-3600 |
| Physical Mixture Layer 1 | ||
| 1 | (C=C stretching) | 1600-1650 |
| 2 | Aromatic (C=C) | 1625-1680 |
| 3 | C-O stretching | 1050-1150 |
| 4 | O-H | 3200-3600 |
| Physical Mixture Layer 2 | ||
| 1 | (C=C stretching) | 1600-1650 |
| 2 | Aromatic (C-O-C) | 2300-2000 |
| 3 | C-O stretching | 1050-1150 |
| 4 | O-H | 3200-3600 |
| 5 | C=O | 1500-1600 |
| The Tablet | ||
| 1 | C-H stretching | 2800 to 3000 |
| 2 | O-H stretching | 3200 to 3800 |
| 3 | C=O stretching | 1700 to 1850 |
| 4 | C-H bending | 1330 to 1660 |
| 5 | O-H bending | 1000 to 1250 |
Table 7: Test for identification
| Identification | Observed |
| Bee’s pollen | |
| Carbohydrate | + |
| Fructose | + |
| Glucose | + |
| Proteins | + |
| Phenolic Compounds | + |
| Butterbur | |
| Carbohydrates | - |
| Alkaloids | - |
| Terpenoids | + |
| Flavonoids | + |
+indicates presence and – indicates absence
Preliminary phytochemical analysis
Preliminary chemical testing was carried out on the extract powders of Butterbur and Bee's Pollen to identify their phytochemical constituents (table 7). These analyses are crucial in verifying the presence of active components and understanding their potential therapeutic effects.
Precompression parameters
For Butterbur extract, the bulk density ranged from 0.571 g/ml to 0.724 g/ml, while the tapped density varied between 0.684 g/ml and 0.941 g/ml. The compressibility index ranged from 2.6% to 17.7%, suggesting good compressibility, with a Hausner’s ratio between 1.05 and 1.30 and an angle of repose ranging from 24.3° to 32.1° (table 8). These findings demonstrate excellent flow and compressibility properties, making the extract suitable for tablet formulation.
Bee's Pollen showed bulk densities ranging from 0.597±0.015 g/ml to 0.641±0.015 g/ml, with tapped densities between 0.810±0.008 g/ml and 0.917±0.010 g/ml. The compressibility index ranged from 2.8% to 4.5%, the Hausner’s ratio was between 1.28 and 1.45, and the angle of repose varied from 23.9° to 32.3° (table 8). These values suggest favourable flow properties, indicating that Bee's Pollen is suitable for compression.
Fig. 4: Disintegration time for bee's pollen and butterbur. Abbreviations: sec: seconds
Table 8: Pre-formulation studies of butterbur and bee's pollen layer
| Formulation code | Bulk density (g/ml)* | Tapped density (g/ml)* | Compressibility index (%)* | Hausner’s ratio* | Angle of repose (θ)* |
| Butterbur | |||||
| F1 | 0.694±0.010 | 0.757±0.008 | 9.0±1.25 | 1.09±0.68 | 31.5±1.28 |
| F2 | 0.602±0.015 | 0.704±0.006 | 16.2±1.07 | 1.16±0.055 | 30.8±2.36 |
| F3 | 0.657±0.010 | 0.694±0.010 | 5.6±0.12 | 1.05±0.047 | 27.3±1.54 |
| F4 | 0.649±0.012 | 0.724±0.008 | 11.5±1.25 | 1.11±0.085 | 30.4±2.61 |
| F5 | 0.581±0.015 | 0.684±0.012 | 17.7±0.95 | 1.17±0.064 | 32.1±1.78 |
| F6 | 0.724±0.014 | 0.941±0.010 | 2.9±1.30 | 1.29±0.052 | 25.2±1.63 |
| F7 | 0.571±0.010 | 0.724±0.008 | 2.6±1.25 | 1.26±0.055 | 25.7±2.35 |
| F8 | 0.675±0.010 | 0.862±0.007 | 2.7±1.15 | 1.22±0.070 | 24.9±2.15 |
| F9 | 0.704±0.011 | 0.920±0.010 | 3.06±1.20 | 1.30±0.054 | 24.3±1.40 |
| Bee's Pollen | |||||
| F1 | 0.623±0.015 | 0.906±0.010 | 4.5±1.25 | 1.45±0.68 | 32.3±1.30 |
| F2 | 0.615±0.010 | 0.887±0.008 | 4.4±1.07 | 1.43±0.055 | 30.6±1.35 |
| F3 | 0.619±0.010 | 0.901±0.005 | 4.5±0.12 | 1.45±0.047 | 26.1±1.15 |
| F4 | 0.628±0.010 | 0.810±0.008 | 2.8±1.25 | 1.28±0.085 | 31.4±2.20 |
| F5 | 0.597±0.015 | 0.868±0.012 | 4.5±0.95 | 1.45±0.064 | 28.7±2.35 |
| F6 | 0.626±0.012 | 0.894±0.011 | 4.2±1.30 | 1.42±0.052 | 25.3±1.45 |
| F7 | 0.641±0.015 | 0.917±0.010 | 4.3±1.25 | 1.43±0.055 | 29.5±2.30 |
| F8 | 0.612±0.014 | 0.883±0.006 | 4.4±1.15 | 1.44±0.070 | 23.9±2.15 |
| F9 | 0.604±0.010 | 0.867±0.014 | 4.3±1.20 | 1.43±0.054 | 24.7±1.25 |
Where, *All values are mean±SD, n=3, P<0.01. Abbreviations: g/ml: g per millilitre, F: Formulation
Post compression parameters
Bilayer tablets were prepared and evaluated for various parameters. Tablet thickness ranged from 3.7±0.05 mm to 3.9±0.11 mm, demonstrating uniformity across batches. Weight variation tests confirmed that all formulations were within pharmacopoeial limits. Tablet hardness was consistent, ranging from 2.9±0.05 to 3.8±0.20 kg/cm², which ensures good handling and durability. The friability of all formulations was below 1%, confirming mechanical stability.
Wetting time was recorded between 56.3 to 69.1 seconds, with formulation F9 exhibiting the fastest wetting time due to the addition of super disintegrants like sodium starch glycolate and crospovidone (table 9). These agents enhance saliva absorption and expand upon contact with moisture, leading to quick disintegration (fig. 4).
Water absorption and assay analysis
The water absorption ratio varied between 43.2±0.44 to 54.3±0.12, indicating the influence of super disintegrants and diluents in facilitating water uptake. Assay results for Butterbur were between 51.98±0.054% to 84.35±0.056% w/w, while Bee’s Pollen showed a range of 68.57% to 89.16%, all within acceptable limits as per pharmacopoeial standards.
Disintegration and in vitro dissolution studies
The disintegration times of all tablet batches complied with the sublingual tablet requirement of less than 200 seconds (table 9). In vitro dissolution studies were conducted, although specific data was represented in table 10, demonstrating efficient drug release profiles (fig. 5).
Stability studies
Stability tests for the selected formulation F9 were performed at 40 °C±2 °C and 75% RH±5% over 30 days, following ICH guidelines. Samples were periodically assessed for hardness, disintegration time, and dissolution. No significant changes were observed, indicating the formulation's stability under accelerated conditions. The results were shown in table 11.
Table 9: Evaluation of bilayer tablets
| Formulation code | Evaluation of bilayer tablets | Estimation of bilayer tablets | Disintegration time | ||||||||
| Thickness (mm±SD)* | Diameter (mm± SD)* | Weight Variation (µg±SD)* | Hardness (kg/cm²)±SD* | Friability *(%) | Wetting Time* (sec) | Water Absorption Ratio (%)* | Butterbur (% w/w)* | Bee's Pollen (% w/w) | Butterbur (sec)* | Bee's Pollen (sec)* | |
| F1 | 3.9±0.05 | 6.5±0.02 | 120,950±1,500 | 3.5±0.15 | 0.4±0.02 | 69.1±0.27 | 43.2±0.44 | 60.51±0.23 | 68.57±0.43 | 186±0.01 | 77±0.04 |
| F2 | 3.9±0.05 | 6.4±0.04 | 120,650±1,980 | 3.2±0.05 | 0.51±0.03 | 66.7±0.44 | 44.3±0.54 | 59.65±0.42 | 73.75±0.52 | 179±0.20 | 79±0.03 |
| F3 | 3.9±0.11 | 6.5±0.04 | 120,600±1,780 | 3.4±0.05 | 0.42±0.01 | 59.6±0.55 | 51.5±0.22 | 51.98±0.54 | 78.75±0.26 | 175±0.50 | 74±0.01 |
| F4 | 3.8±0.05 | 6.5±0.05 | 121,150±1,590 | 3.6±0.23 | 0.6±0.02 | 67.6±0.44 | 47.4±0.26 | 62.21±0.41 | 77.53±0.23 | 181±0.40 | 73±0.05 |
| F5 | 3.7±0.05 | 6.6±0.03 | 120,650±1,690 | 3.2±0.15 | 0.5±0.01 | 64.8±0.37 | 50.2±0.43 | 71.30±0.38 | 79.37±0.42 | 167±0.01 | 71±0.04 |
| F6 | 3.8±0.05 | 6.5±0.02 | 120,850±2,150 | 3.8±0.20 | 0.39±0.01 | 60.4±0.56 | 52.4±0.75 | 62.78±0.55 | 75.93±0.71 | 159±0.02 | 65±0.03 |
| F7 | 3.7±0.11 | 6.5±0.01 | 120,950±1,980 | 3.5±0.11 | 0.5±0.04 | 62.3±0.41 | 49.6±0.59 | 63.92±0.43 | 78.21±0.56 | 168±0.03 | 72±0.02 |
| F8 | 3.8±0.05 | 6.5±0.02 | 120,800±2,060 | 2.9±0.05 | 0.65±0.02 | 57.8±0.26 | 53.1±0.32 | 78.69±0.24 | 82.50±0.38 | 159±0.04 | 65±0.03 |
| F9 | 3.8±0.17 | 6.5±0.01 | 120,600±1,780 | 3.1±0.23 | 0.41±0.02 | 56.3±0.57 | 54.3±0.12 | 84.37±0.56 | 89.16±0.16 | 154±0.01 | 58±0.02 |
Where, *All values are mean±SD, n=3, P<0.01. Abbreviations: g/ml: g per millilitre, F: Formulation, mm: Millimetre, SD: Standard Deviation,µg: Microgram, w/w: weight by weight, sec: Seconds
In vitro permeation studies
The In vitro permeation study assessed the drug release across a mucosal membrane, focusing on formulations F8 and F9 due to their superior dissolution profiles (table 12). These studies demonstrated a gradual diffusion of the drug when exposed to a buffer solution, highlighting their potential for sublingual administration.
Table 10: % Drug release for butterbur and bee's pollen
| Formulation | % Drug release with time | |||||
| 1 min | 5 min | 15 min | 30 min | 45 min | 60 min | |
| Butterbur | ||||||
| F1* | 22.03±0.17 | 44.06± 0.15 | 57.62± 0.14 | 64.4± 0.16 | 72.88± 0.10 | 71.85± 0.17 |
| F2* | 27.11± 0.13 | 42.37± 0.17 | 55.93± 0.13 | 64.4± 0.14 | 79.66± 0.12 | 78.26± 0.14 |
| F3* | 28.81± 0.14 | 49.15± 0.12 | 50.84± 0.15 | 76.27± 0.13 | 89.83± 0.11 | 87.82± 0.15 |
| F4* | 25.42± 0.16 | 37.28± 0.14 | 50.84± 0.16 | 62.71± 0.18 | 77.96± 0.17 | 75.34± 0.12 |
| F5* | 28.81± 0.12 | 42.37± 0.15 | 66.1± 0.11 | 77.96± 0.12 | 86.44± 0.14 | 85.24± 0.10 |
| F6* | 32.2± 0.19 | 45.76± 0.11 | 59.32± 0.12 | 79.66± 0.17 | 91.52± 0.16 | 90.22± 0.16 |
| F7* | 25.42± 0.11 | 35.59± 0.12 | 54.23± 0.14 | 69.49± 0.12 | 83.05± 0.11 | 81.03± 0.11 |
| F8* | 27.11± 0.09 | 45.76± 0.06 | 66.1± 0.08 | 76.27± 0.07 | 89.83± 0.06 | 88.51± 0.08 |
| F9* | 33.89± 0.07 | 62.71± 0.04 | 71.18± 0.06 | 83.05± 0.09 | 94.91± 0.08 | 92.54± 0.07 |
| Bee's pollen | ||||||
| F1* | 30.8± 0.08 | 42.41± 0.11 | 54.46± 0.13 | 61.6± 0.07 | 69.64± 0.11 | 67.62± 0.10 |
| F2* | 33.03± 0.13 | 44.19± 0.12 | 59.82± 0.15 | 66.51± 0.09 | 72.32± 0.15 | 71.36± 0.16 |
| F3* | 36.16± 0.12 | 45.53± 0.16 | 60.26± 0.08 | 73.21± 0.11 | 83.48± 0.17 | 82.43± 0.13 |
| F4* | 32.58± 0.15 | 41.96± 0.09 | 56.69± 0.12 | 67.41± 0.13 | 78.57± 0.14 | 77.03± 0.12 |
| F5* | 31.69± 0.17 | 41.07± 0.13 | 52.67± 0.15 | 64.73± 0.16 | 75.44± 0.12 | 74.81± 0.14 |
| F6* | 41.51± 0.12 | 53.13± 0.10 | 66.07± 0.12 | 80.8± 0.14 | 91.51± 0.10 | 90.66± 0.11 |
| F7* | 38.83± 0.08 | 48.66± 0.10 | 63.39± 0.07 | 74.1± 0.09 | 86.61± 0.08 | 84.87± 0.09 |
| F8* | 41.07± 0.06 | 54.01± 0.01 | 68.75± 0.04 | 83.03± 0.06 | 89.73± 0.05 | 88.43± 0.04 |
| F9* | 48.21± 0.04 | 61.16± 0.05 | 72.76± 0.02 | 85.26± 0.01 | 93.3± 0.03 | 92.4± 0.02 |
Where,*All values are mean±RSD, n=6, P<0.01. Abbreviations: F: Formulation.
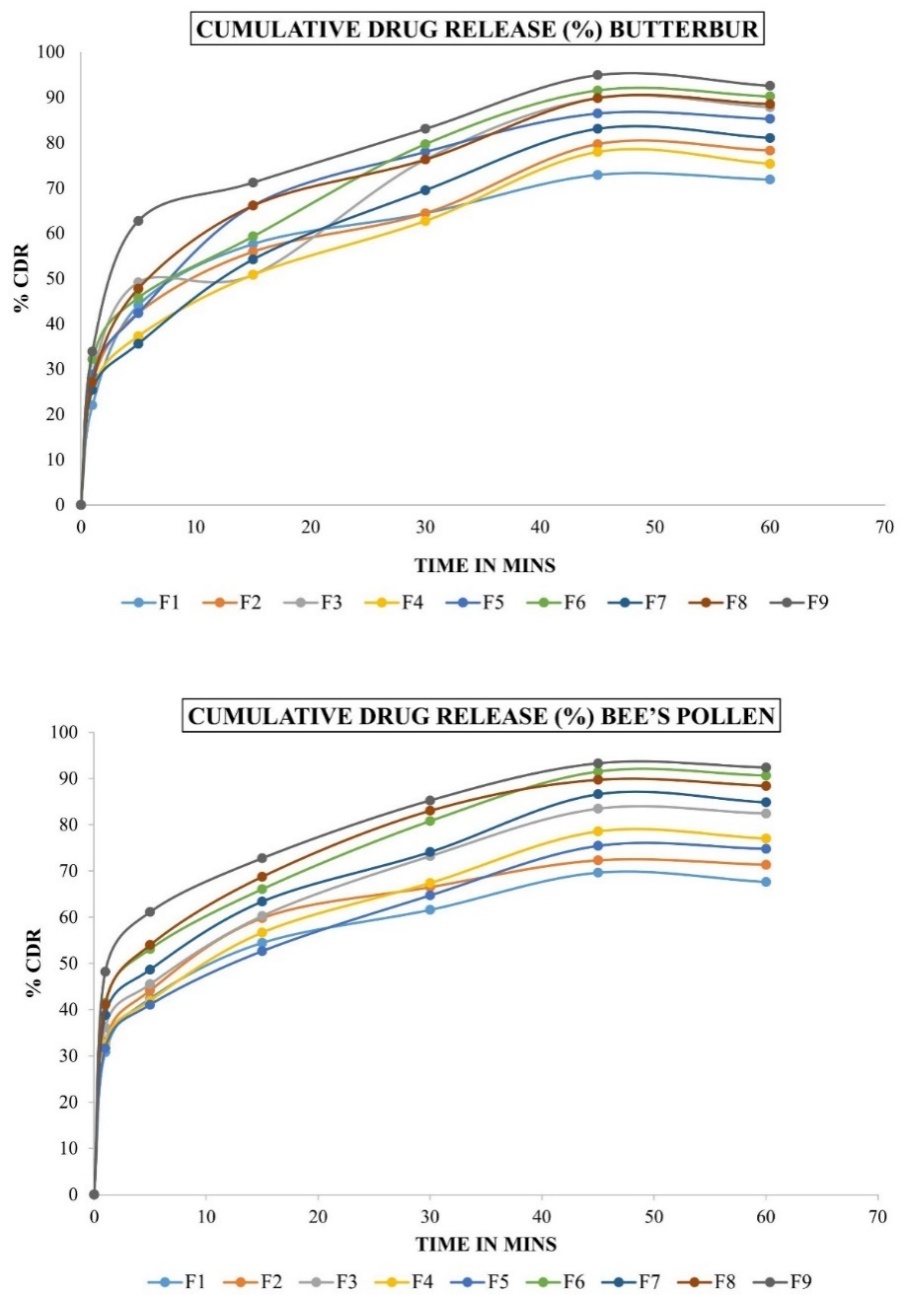
Fig. 5: Cumulative drug release (%) Butterbur and bee’s pollen. Abbreviations: F: Formulation, CDR: Cumulative drug release
Table 11: Stability results of the selected formulation
| Parameters | 40 °C±2 °C and 75% RH±5% | |||
| Initial | 15 d | 30 d | ||
| Hardness (kg/cm3)* | 3.1± 0.23 | 3.2± 0.21 | 3± 0.23 | |
| Disintegration time(sec)* | L1 | 58.3± 0.11 | 57.4± 0.09 | 56.8± 0.13 |
| L2 | 154± 0.01 | 153.2± 0.04 | 152.6± 0.02 | |
| Dissolution (%)* | L1 | 92.4± 0.14 | 92.38± 0.10 | 92.03± 0.15 |
| L2 | 92.54± 0.12 | 92.33± 0.14 | 91.86± 0.11 | |
Where, *All values are mean±SD, n=3, P<0.01, Abbreviations: L1:Bee's Pollen Layer; L2: Butterbur Layer, kg/cm3: kilograms per cubic centimeter, Sec: Seconds
Table 12: In vitro permeation studies for F8 and F9
| Time in minutes | Butterbur (µg)* | Bee's pollen (µg)* |
| In vitro permeation studies F8 | ||
| 0 | 0 | 0 |
| 1 | 25,760±20 | 32,140±40 |
| 5 | 36,610±50 | 44,640±100 |
| 15 | 42,710±30 | 55,350±80 |
| 30 | 48,130±10 | 64,280±30 |
| 45 | 56,270±70 | 73,210±60 |
| In vitro permeation studies F9 | ||
| 0 | 0 | 0 |
| 1 | 27,790±20 | 37,500±40 |
| 5 | 39,320±30 | 51,780±20 |
| 15 | 45,420±10 | 58,920±50 |
| 30 | 50,840±20 | 71,420±30 |
| 45 | 62,370±10 | 82,140±20 |
Where, *All values are mean±SD, n=3, P<0.01., Abbreviations: µg: micrograms
Ex vivo permeation studies
The Ex vivo permeation analysis, represented through the table 13, further confirmed the drug’s effective permeation potential.
Bilayer tablets of butterbur-bee’s pollen for sublingual immunotherapy
The bilayer tablets of butterbur and bee’s pollen are shown in fig. 6.
Table 13: Drug diffusion via buccal membrane
| Time (min) | Butterbur %* | Bee's pollen %* |
| 0 | 0 | 0 |
| 1 | 30.5± 0.03 | 39.28± 0.04 |
| 5 | 42.71± 0.01 | 51.78± 0.05 |
| 15 | 51.52± 0.07 | 66.07± 0.11 |
| 30 | 61.69± 0.01 | 73.21± 0.03 |
| 45 | 71.86± 0.05 | 87.5± 0.08 |
Where, *All values are mean±SD, n=3, P<0.01
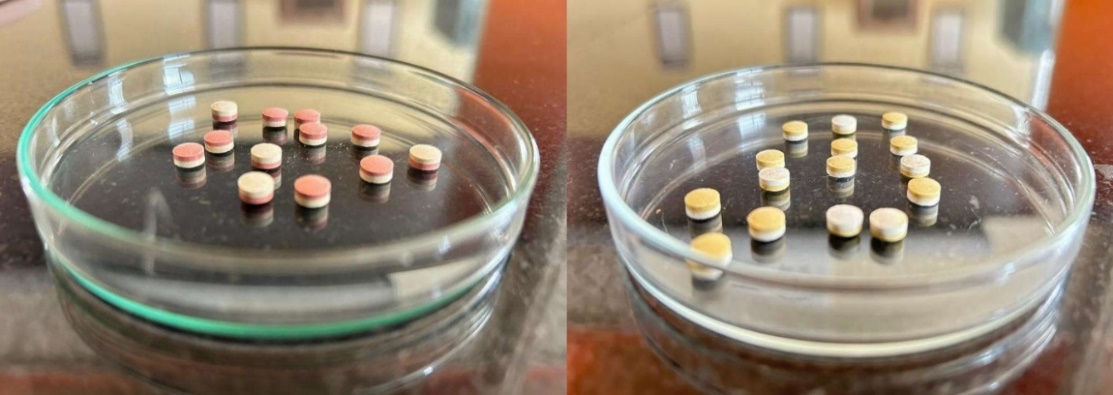
Fig. 6: Bilayer tablets of butterbur-bee’s pollen
DISCUSSION
Sublingual drug delivery offers a rapid and direct method for introducing drugs into the systemic circulation. Within the oral cavity, the sublingual region is the most permeable, enabling efficient drug absorption. Sublingual immunotherapy (SLIT) involves exposing the body to small amounts of allergens to build tolerance over time. FDA-approved SLIT tablets are placed under the tongue for 1-2 min until they dissolve before swallowing. This treatment is typically administered daily or several times a week, often requiring consistent use for up to three years to maintain its effectiveness. Over time, it helps reduce allergy symptoms, particularly for allergens like pollen.
This study aims to develop sublingual tablets incorporating Bee’s Pollen and butterbur, formulated using the direct compression method for COPD management. To promote rapid tablet disintegration, super disintegrants such as sodium starch glycolate, croscarmellose sodium, and crospovidone were utilized. Research by Desai PM et al. explored the impact of these disintegrants on RDTs within a QbD framework. Their findings indicated that sodium starch glycolate delayed disintegration in highly water-soluble drugs, while croscarmellose sodium and crospovidone accelerated the process. Interestingly, combinations like sodium starch glycolate-crospovidone and croscarmellose sodium-crospovidone exhibited synergistic effects, particularly under high compression pressures, significantly improving tablet performance [41].
Pre-formulation studies analyzed the phytochemical constituents, and a standard calibration curve was established using a UV spectrophotometer. Precompression parameters were assessed, showing that both layers of the tablet triturates exhibited excellent flow properties and compressibility.
Post-compression tests, including hardness and friability assessments, confirmed that the tablets had strong mechanical integrity. The wetting time test highlighted the hydrophilic nature of the excipients, essential for rapid disintegration under the tongue. A water absorption test was conducted to evaluate the impact of humidity on tablet stability, given its influence on super disintegrant performance. All results were within acceptable limits. Nony E et al. evaluated a sublingual tablet containing recombinant Bet v 1 in a placebo-controlled trial involving 483 patients with birch pollen allergies. The tablets were well tolerated and demonstrated significant efficacy, reducing symptom scores by 17.0-17.7% compared to placebo after 5 mo of daily administration, with no dose-dependent effects observed across the 12.5-50 μg range [42].
In vitro dissolution studies revealed satisfactory drug release profiles for both layers, suggesting good bioavailability and therapeutic efficacy. Ryakala H et al. formulated a bilayer tablet comprising Nebivolol (NBL8) and Nateglinide (N9), incorporating super disintegrants in the immediate-release (IR) layer and polymers in the sustained-release (SR) layer. In vitro analyses demonstrated enhanced drug release with the addition of surfactants. Kinetic studies indicated strong linearity, with regression coefficients of 0.9714 for NBL8 (Higuchi model) and 0.9931 for N9 (zero-order model) [43, 44].
Based on comprehensive results, batches F8 and F9 were identified as the best formulations. Permeation studies for F8 and F9 confirmed a strong release profile, with significant drug diffusion through the mucosal membrane into the bloodstream. Stability testing for batch F9, conducted per ICH guidelines, demonstrated that the tablets remained stable under accelerated temperature and humidity conditions, confirming an adequate shelf life.
CONCLUSION
In recent years, herbal drugs have gained recognition comparable to allopathic medicines due to their adaptability and convenient administration through advanced drug delivery systems despite their slower onset of action. This study focuses on developing sublingual immunotherapy (SLIT) for COPD, aiming to enhance immunity by delivering allergens sublingually. SLIT provides bioavailability similar to intravenous methods, making it particularly beneficial for COPD patients, especially those with pollen-induced symptoms. The research investigates the potential of sublingual administration of herbal drugs for long-term COPD management. Future studies involving petasin, the active component, could deliver promising outcomes, presenting an innovative strategy for COPD treatment.
ACKNOWLEDGEMENT
We are greatly indebted to our highly respected and beloved madam, Dr. C N Nalini, M Pharm., Ph. D., Principal, C. L. Baid Metha College of Pharmacy for her benevolence and ever-helping arms, which provided us all the essential facilities in bringing out this paper.
We would like to thank our beloved parents for trusting and supporting us. Above all, we would like to give thanks and praise to the Almighty God for the grace and blessing throughout the entire work.
FUNDING
Nil
AUTHORS CONTRIBUTIONS
V. Deepa Kumari was involved in the data curation, investigation, methodology and roles/writing original draft; G. Selvi performed the conceptualization, methodology, project administration, resources, supervision, validation, and review; S. Shyam Sundar and A. Lakshmi Priya contributed to literature Search, writing, review, and editing; All authors read and approved the final manuscript.
CONFLICT OF INTERESTS
The authors declare no conflict of interest, financial or otherwise.
REFERENCES
Liu J, Ran Z, Wang F, Xin C, Xiong B, Song Z. Role of pulmonary microorganisms in the development of chronic obstructive pulmonary disease. Crit Rev Microbiol. 2021;47(1):1-12. doi: 10.1080/1040841X.2020.1830748, PMID 33040638.
Basnet S, Durga YV, Yadav SK, Adhikari S, KS S. Effects of socioeconomic and clinical factors on treatment adherence in patients with chronic obstructive pulmonary diseases patient: focus on inhalation therapy. Asian J Pharm Clin Res. 2024 Oct 7;17(10):138-42. doi: 10.22159/ajpcr.2024v17i10.51542.
Singh D, Agusti A, Anzueto A, Barnes PJ, Bourbeau J, Celli BR. Global strategy for the diagnosis management and prevention of chronic obstructive lung disease: the gold science committee report 2019. Eur Respir J. 2019 May 18;53(5):1900164. doi: 10.1183/13993003.00164-2019, PMID 30846476.
World Health Organization. WHO World Health Organization: WHO. Chronic Obstruct Pulm Dis (COPD); 2024. Available from: https://www.who.int/news-room/fact-sheets/detail/chronic-obstructive-pulmonary-disease-(copd).
P Sucharitha JL, Sindhu MJ, Teja AC, BM. Study on risk factors clinical and therapeutic profile of chronic obstructive pulmonary disease patients in government general hospital. Asian J Pharm Clin Res. 2021 Mar 7;14(3):60-5. doi: 10.22159/ajpcr.2021.v14i3.40245.
Mac Nee W. Pathogenesis of chronic obstructive pulmonary disease. Proc Am Thorac Soc. 2005;2(4):258-66. doi: 10.1513/pats.200504-045SR, PMID 16267346, PMCID PMC2713323.
Negewo NA, Gibson PG, MC Donald VM. COPD and its comorbidities: impact measurement and mechanisms. Respirology. 2015;20(8):1160-71. doi: 10.1111/resp.12642, PMID 26374280.
Aswal P, Bhumbla U. Prevalence of cardiovascular comorbidities in patients with chronic obstructive pulmonary disease in suburban areas of South-West India. Asian J Pharm Clin Res. 2022 May 7;15(5):72-5. doi: 10.22159/ajpcr.2022.v15i5.43639.
Fatima D, Tiwari S, Gowardipe PS, SK S. Study of lipid profile and atherogenic index in patients with chronic obstructive pulmonary disease. Asian J Pharm Clin Res. 2022 Dec 7;15(12):184-6.
Weiss A, Porter S, Rozenberg D, O Connor E, Lee T, Balter M. Chronic obstructive pulmonary disease: a palliative medicine review of the disease its therapies and drug interactions. J Pain Symptom Manag. 2020 Jul;60(1):135-50. doi: 10.1016/j.jpainsymman.2020.01.009, PMID 32004618.
Devi MK, SS, Lal Sasidharan S, SS, Shaik M, Sandeep G. A clinical study on safety and efficacy of formoterol and tiotropium combination compared to formoterol and tiotropium with roflumilast combination in treatment of moderate to severe chronic obstructive pulmonary disease patients. Asian J Pharm Clin Res. 2018 Mar 1;11(3):184-6. doi: 10.22159/ajpcr.2018.v11i3.21871.
Nurhidayah M, Fadilah F, Arsianti A, Bahtiar A. Identification of FGFR inhibitor as ST2 receptor/interleukin-1 receptor-like 1 inhibitor in chronic obstructive pulmonary disease due to exposure to E-cigarettes by network pharmacology and molecular docking prediction. Int J App Pharm. 2022 Mar 7;14(2):256-66. doi: 10.22159/ijap.2022v14i2.43784.
Ejiofor S, Turner AM. Pharmacotherapies for COPD. Clin Med Insights Circ Respir Pulm Med. 2013 Apr 25;7:17-34. doi: 10.4137/CCRPM.S7211, PMID 23700381.
Braghiroli A, Braido F, Piraino A, Rogliani P, Santus P, Scichilone N. Day and night control of COPD and role of pharmacotherapy: a review. Int J Chronic Obstruct Pulm Dis. 2020;15:1269-85. doi: 10.2147/COPD.S240033, PMID 32606638.
Chalela R, Gea J, Barreiro E. Immune phenotypes in lung cancer patients with COPD: potential implications for immunotherapy. J Thorac Dis. 2018 Jul;10 Suppl 18:S2186-9. doi: 10.21037/jtd.2018.06.143, PMID 30123556, PMCID PMC6072947.
QI Y, Yan Y, Tang D, Han J, Zhu X, Cui M. Inflammatory and immune mechanisms in COPD: current status and therapeutic prospects. J Inflam Res. 2024;17:6603-18. doi: 10.2147/JIR.S478568, PMID 39318994.
Cox LS, Larenas Linnemann D, Nolte H, Weldon D, Finegold I, Nelson HS. Sublingual immunotherapy: a comprehensive review. J Allergy Clin Immunol. 2006 May;117(5):1021-35. doi: 10.1016/j.jaci.2006.02.040, PMID 16675328.
Baba SM, Rasool R, Gull A, Qureshi TA, Beigh AH, Qadri Q. Effectiveness of sublingual immunotherapy in the treatment of HDM induced nasobronchial allergies: A 3 y randomized case-control study from Kashmir. Front Immunol. 2021 Oct 13;12:723814. doi: 10.3389/fimmu.2021.723814, PMID 34721385, PMCID PMC8548833.
Zeng Y, Xiao H, Gao S, LI J, Yang C, Zeng Q. Efficacy and immunological changes of sublingual immunotherapy in pediatric allergic rhinitis. World Allergy Organ J. 2023 Jul 23;16(7):100803. doi: 10.1016/j.waojou.2023.100803, PMID 37520614, PMCID PMC10382672.
Lawrence MG, Steinke JW, Borish L. Basic science for the clinician: mechanisms of sublingual and subcutaneous immunotherapy. Ann Allergy Asthma Immunol. 2016 Aug;117(2):138-42. doi: 10.1016/j.anai.2016.06.027, PMID 27499541, PMCID PMC4978173.
Globinska A, Boonpiyathad T, Satitsuksanoa P, Kleuskens M, Van DE Veen W, Sokolowska M. Mechanisms of allergen-specific immunotherapy: diverse mechanisms of immune tolerance to allergens. Ann Allergy Asthma Immunol. 2018;121(3):306-12. doi: 10.1016/j.anai.2018.06.026, PMID 29966703.
Arefin P, Habib MS, Ahmed NU, Rahim MA, Ibrahim M, Bhattacharjee SC, Chakraborty D, Das S, Karmakar D, Bhowmik D, Islam S, Arefin MS. Allergic rhinitis and importance of fexofenadine HCL sustained release microsphere as its treatment approach. Int J App Pharm. 2022 Jan 7;14(1):13-7. doi: 10.22159/ijap.2022v14i1.40369.b.
Canonica GW, Cox L, Pawankar R, Baena Cagnani CE, Blaiss M, Bonini S. Sublingual immunotherapy: world allergy organization position paper 2013 update. World Allergy Organ J. 2014 Mar 28;7(1):6. doi: 10.1186/1939-4551-7-6, PMID 24679069, PMCID PMC3983904.
Kulalert P, Phinyo P, Lao Araya M. Efficacy and safety of house dust mite sublingual immunotherapy tablets in allergic rhinitis: a systematic review and meta-analysis. World Allergy Organ J. 2022 Sep 7;15(9):100691. doi: 10.1016/j.waojou.2022.100691, PMID 36119654, PMCID PMC9465266.
Wise SK, Schlosser RJ. Subcutaneous and sublingual immunotherapy for allergic rhinitis: what is the evidence? Am J Rhinol Allergy. 2012 Jan-Feb;26(1):18-22. doi: 10.2500/ajra.2012.26.3691, PMID 22391071, PMCID PMC3906519.
Aboshady OA, Elghanam KM. Sublingual immunotherapy in allergic rhinitis: efficacy safety adherence and guidelines. Clin Exp Otorhinolaryngol. 2014 Dec;7(4):241-9. doi: 10.3342/ceo.2014.7.4.241, PMID 25436040, PMCID PMC4240478.
Keshavarz Shahbaz S, Varasteh AR, Koushki K, Ayati SH, Mashayekhi K, Sadeghi M. Sublingual dendritic cells targeting by aptamer: a possible approach for improvement of sublingual immunotherapy efficacy. Int Immunopharmacol. 2020 Aug;85:106603. doi: 10.1016/j.intimp.2020.106603, PMID 32485357.
Din L, Lui F. Butterbur. In: Treasure Island (FL): Stat Pearls Publishing; 2023 Jun 25. p. 2024. Available from: https://www.ncbi.nlm.nih.gov/books/NBK537160/.
Dse A, MA F, AN E, MA EN, Elhabal Sf. Antiobesity nutraceuticals: insights into mechanisms of action and potential use of biocompatible nanocarriers for delivery. Int J Appl Pharm. 2024 Jul 7;16(4):57-65.
Kocot J, Kielczykowska M, Luchowska Kocot D, Kurzepa J, Musik I. Antioxidant potential of propolis bee pollen and royal jelly: possible medical application. Oxid Med Cell Longev. 2018 May 2;2018:7074209. doi: 10.1155/2018/7074209, PMID 29854089, PMCID PMC5954854.
Chaudhary H, Rathee P, Rathee S, Kumar V. Natural relief for allergies: an overview. Pharmacogn Rev. 2008;2(4):241-8.
Thomet OA, Simon HU. Petasins in the treatment of allergic diseases: results of preclinical and clinical studies. Int Arch Allergy Immunol. 2002 Oct;129(2):108-12. doi: 10.1159/000065884, PMID 12403927.
Kwak JE, Lee JY, Baek JY, Kim SW, Ahn MR. The antioxidant and anti-inflammatory properties of bee pollen from acorn (Quercus acutissima carr.) and darae (Actinidia arguta). Antioxidants (Basel). 2024 Aug 13;13(8):981. doi: 10.3390/antiox13080981, PMID 39199227, PMCID PMC11352170.
Momin MM, Kane S, Abhang P. Formulation and evaluation of bilayer tablet for bimodal release of venlafaxine hydrochloride. Front Pharmacol. 2015 Jul 9;6:144. doi: 10.3389/fphar.2015.00144, PMID 26217229, PMCID PMC4496574.
Shankrayya M, Kulakarni ST, Vinayaka DM, Sathwik SAK, Taj S, Rahul RP. Formulation and evaluation of carbamazepine bilayer tablet for bimodal release. Int J Pharm Sci Res. 2023;14(10):5017-24. doi: 10.13040/IJPSR.0975-8232.14(10).5017-24.
Aghera NJ, Shah SD, Vadalia KR. Formulation and evaluation of sublingual tablets of losartan potassium. Asian Pac J Trop Dis. 2012;2:S130-5. doi: 10.1016/S2222-1808(12)60138-8.
Choudhury P, Deb P, Dash S. Formulation and statistical optimization of bilayer sublingual tablets of levocetirizine hydrochloride and ambroxol hydrochloride. Asian J Pharm Clin Res. 2016;9(5):228-34. doi: 10.22159/ajpcr.2016.v9i5.13343.
Prajapati ST, Patel PB, Patel CN. Formulation and evaluation of sublingual tablets containing sumatriptan succinate. Int J Pharm Investig. 2012 Jul;2(3):162-8. doi: 10.4103/2230-973X.104400, PMID 23373008, PMCID PMC3555012.
Bayrak Z, Tas C, Tasdemir U, Erol H, Ozkan CK, Savaser A. Formulation of zolmitriptan sublingual tablets prepared by direct compression with different polymers: in vitro and in vivo evaluation. Eur J Pharm Biopharm. 2011 Aug;78(3):499-505. doi: 10.1016/j.ejpb.2011.02.014, PMID 21352916.
Akhtar M, Jamshaid M, Zaman M, Mirza AZ. Bilayer tablets: a developing novel drug delivery system. J Drug Deliv Sci Technol. 2020 Dec;60:102079. doi: 10.1016/j.jddst.2020.102079.
Desai PM, ER PX, Liew CV, Heng PW. Functionality of disintegrants and their mixtures in enabling fast disintegration of tablets by a quality by design approach. AAPS Pharm Sci Tech. 2014 Oct;15(5):1093-104. doi: 10.1208/s12249-014-0137-4, PMID 24848762, PMCID PMC4179650.
Nony E, Bouley J, LE Mignon M, Lemoine P, Jain K, Horiot S. Development and evaluation of a sublingual tablet based on recombinant bet v 1 in birch pollen allergic patients. Allergy. 2015 Jul;70(7):795-804. doi: 10.1111/all.12622, PMID 25846209.
Ryakala H, Dineshmohan S, Ramesh A, Gupta VR. Formulation and in vitro evaluation of bilayer tablets of nebivolol hydrochloride and nateglinide for the treatment of diabetes and hypertension. J Drug Deliv. 2015;2015:827859. doi: 10.1155/2015/827859, PMID 25648606, PMCID PMC4310311.
Semalty M, Semalty A, Kumar G. Formulation and characterization of mucoadhesive buccal films of glipizide. Indian J Pharm Sci. 2008 Jan;70(1):43-8. doi: 10.4103/0250-474X.40330, PMID 20390079, PMCID PMC2852059.